Budget Slide
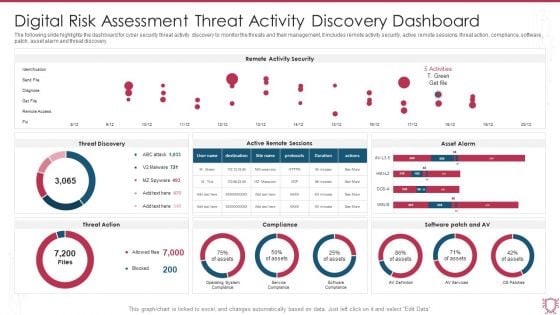
Digital Risk Assessment Threat Activity Discovery Dashboard Ppt Ideas Skills PDF
The following slide highlights the dashboard for cyber security threat activity discovery to monitor the threats and their management, it includes remote activity security, active remote sessions, threat action, compliance, software patch, asset alarm and threat discovery. Pitch your topic with ease and precision using this Digital Risk Assessment Threat Activity Discovery Dashboard Ppt Ideas Skills PDF. This layout presents information on Remote Activity Security, Threat Discovery, Asset Alarm. It is also available for immediate download and adjustment. So, changes can be made in the color, design, graphics or any other component to create a unique layout.
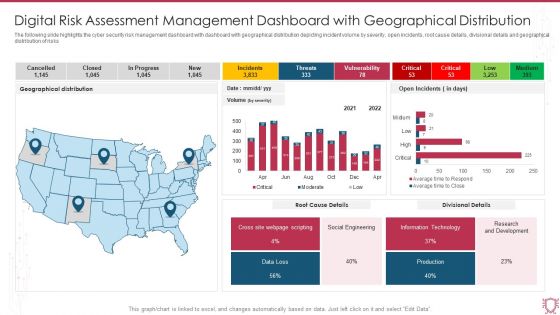
Digital Risk Assessment Management Dashboard With Geographical Distribution Clipart PDF
The following slide highlights the cyber security risk management dashboard with dashboard with geographical distribution depicting incident volume by severity, open incidents, root cause details, divisional details and geographical distribution of risks. Pitch your topic with ease and precision using this Digital Risk Assessment Management Dashboard With Geographical Distribution Clipart PDF. This layout presents information on Geographical Distribution, Root Cause Details, Divisional Details, Social Engineering. It is also available for immediate download and adjustment. So, changes can be made in the color, design, graphics or any other component to create a unique layout.
Dashboard For Tracking New Food Product Launch Strategic Plan Effectiveness Themes PDF
This slide illustrates facts and figures related to new food item introduction for FY22. It includes social media views and interactions, weekly income, and promotional expenditure.Pitch your topic with ease and precision using this Dashboard For Tracking New Food Product Launch Strategic Plan Effectiveness Themes PDF. This layout presents information on Promotion Expenditure, Social Media, Views Interactions. It is also available for immediate download and adjustment. So, changes can be made in the color, design, graphics or any other component to create a unique layout.
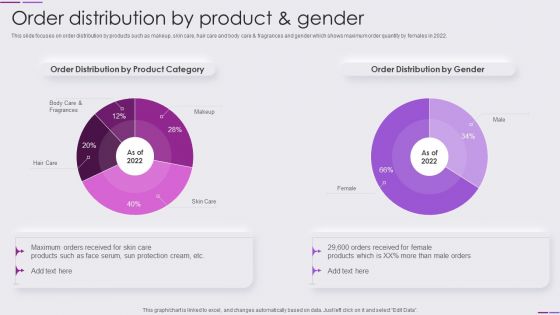
Beauty And Skincare Products Company Profile Order Distribution By Product And Gender Mockup PDF
This slide focuses on order distribution by products such as makeup, skin care, hair care and body care and fragrances and gender which shows maximum order quantity by females in 2022.Deliver an awe inspiring pitch with this creative Beauty And Skincare Products Company Profile Order Distribution By Product And Gender Mockup PDF bundle. Topics like Order Distribution, Distribution Gender, Maximum Orders can be discussed with this completely editable template. It is available for immediate download depending on the needs and requirements of the user.
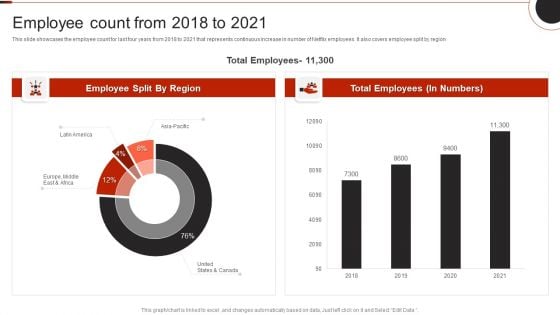
Netflix Company Outline Employee Count From 2018 To 2021 Information PDF
This slide showcases the employee count for last four years from 2018 to 2021 that represents continuous increase in number of Netflix employees. It also covers employee split by region.Deliver and pitch your topic in the best possible manner with this Netflix Company Outline Employee Count From 2018 To 2021 Information PDF. Use them to share invaluable insights on Employee Split, Total Employees, Europe Middle and impress your audience. This template can be altered and modified as per your expectations. So, grab it now.
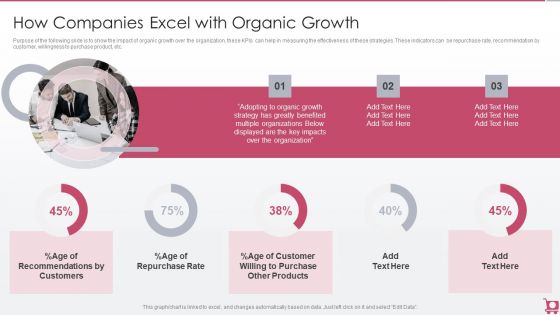
Playbook For Sales Growth Strategies How Companies Excel With Organic Growth Download PDF
Purpose of the following slide is to show the impact of organic growth over the organization, these KPIs can help in measuring the effectiveness of these strategies. These indicators can be repurchase rate, recommendation by customer, willingness to purchase product, etc. Deliver and pitch your topic in the best possible manner with this Playbook For Sales Growth Strategies How Companies Excel With Organic Growth Download PDF. Use them to share invaluable insights on Customers, Purchase Other Products, Organization and impress your audience. This template can be altered and modified as per your expectations. So, grab it now.
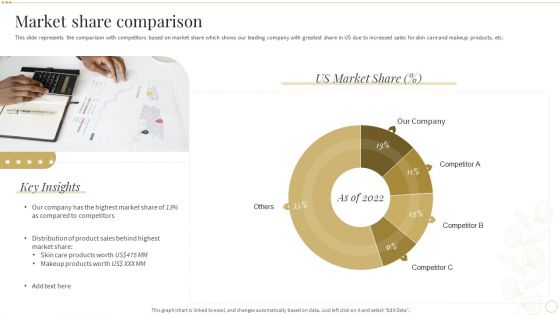
Market Share Comparison Skin Care And Beautifying Products Company Profile Summary PDF
This slide represents the comparison with competitors based on market share which shows our leading company with greatest share in US due to increased sales for skin care and makeup products, etc. Deliver an awe inspiring pitch with this creative Market Share Comparison Skin Care And Beautifying Products Company Profile Summary PDF bundle. Topics like Compared To Competitors, Distribution Of Product, Behind Highest can be discussed with this completely editable template. It is available for immediate download depending on the needs and requirements of the user.
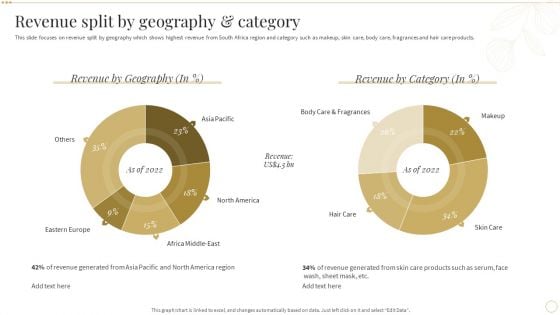
Revenue Split By Geography And Category Skin Care And Beautifying Products Company Profile Structure PDF
This slide focuses on revenue split by geography which shows highest revenue from South Africa region and category such as makeup, skin care, body care, fragrances and hair care products.Deliver and pitch your topic in the best possible manner with this Revenue Split By Geography And Category Skin Care And Beautifying Products Company Profile Structure PDF. Use them to share invaluable insights on Revenue Geography, Eastern Europe, Revenue Generated and impress your audience. This template can be altered and modified as per your expectations. So, grab it now.
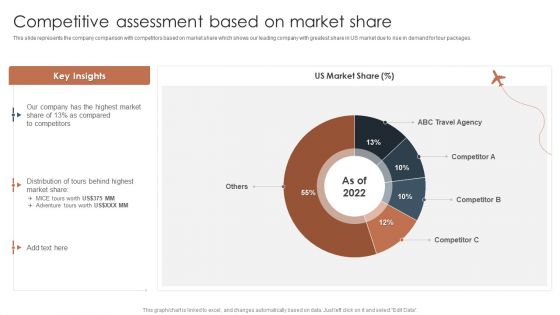
Tour And Travels Agency Profile Competitive Assessment Based On Market Share Elements PDF
This slide represents the company comparison with competitors based on market share which shows our leading company with greatest share in US market due to rise in demand for tour packages.Deliver and pitch your topic in the best possible manner with this Tour And Travels Agency Profile Competitive Assessment Based On Market Share Elements PDF. Use them to share invaluable insights on Compared Competitors, Distribution Tours, Travel Agency and impress your audience. This template can be altered and modified as per your expectations. So, grab it now.
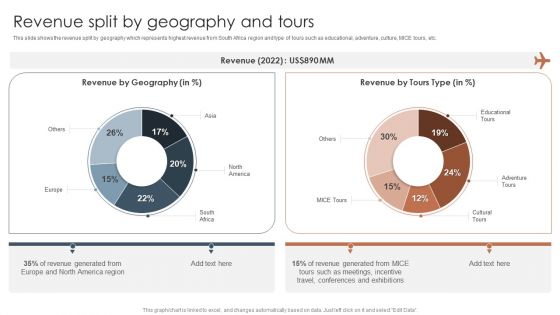
Tour And Travels Agency Profile Revenue Split By Geography And Tours Diagrams PDF
This slide shows the revenue split by geography which represents highest revenue from South Africa region and type of tours such as educational, adventure, culture, MICE tours, etc.Deliver and pitch your topic in the best possible manner with this Tour And Travels Agency Profile Revenue Split By Geography And Tours Diagrams PDF. Use them to share invaluable insights on Revenue Generated, America Region, Such As Meetings and impress your audience. This template can be altered and modified as per your expectations. So, grab it now.
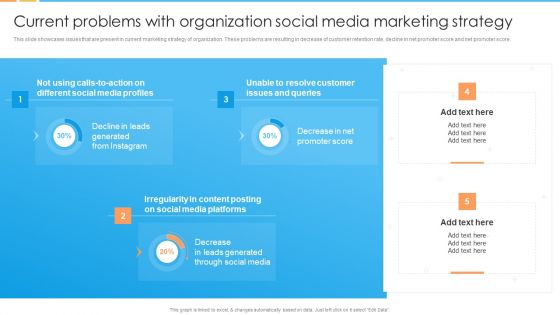
Digital Marketing Guide For B2B Firms Current Problems With Organization Social Media Marketing Strategy Inspiration PDF
This slide showcases issues that are present in current marketing strategy of organization. These problems are resulting in decrease of customer retention rate, decline in net promoter score and net promoter score.Deliver an awe inspiring pitch with this creative Digital Marketing Guide For B2B Firms Current Problems With Organization Social Media Marketing Strategy Inspiration PDF bundle. Topics like Generated Instagram, Irregularity Content, Media Platforms can be discussed with this completely editable template. It is available for immediate download depending on the needs and requirements of the user.
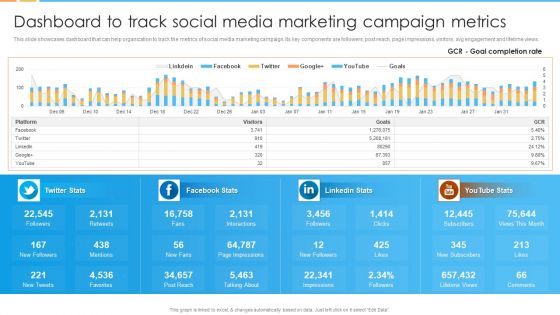
Digital Marketing Guide For B2B Firms Dashboard To Track Social Media Marketing Campaign Metrics Demonstration PDF
This slide showcases dashboard that can help organization to track the metrics of social media marketing campaign. Its key components are followers, post reach, page impressions, visitors, avg engagement and lifetime views.Deliver an awe inspiring pitch with this creative Digital Marketing Guide For B2B Firms Dashboard To Track Social Media Marketing Campaign Metrics Demonstration PDF bundle. Topics like Page Impressions, New Followers, Talking About can be discussed with this completely editable template. It is available for immediate download depending on the needs and requirements of the user.
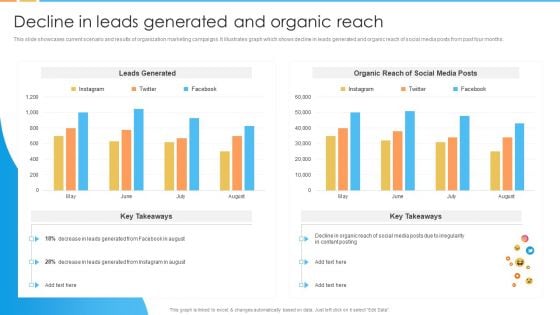
Digital Marketing Guide For B2B Firms Decline In Leads Generated And Organic Reach Pictures PDF
This slide showcases current scenario and results of organization marketing campaigns. It illustrates graph which shows decline in leads generated and organic reach of social media posts from past four months.Deliver and pitch your topic in the best possible manner with this Digital Marketing Guide For B2B Firms Decline In Leads Generated And Organic Reach Pictures PDF. Use them to share invaluable insights on Leads Generated, Organic Reach, Leads Generated and impress your audience. This template can be altered and modified as per your expectations. So, grab it now.
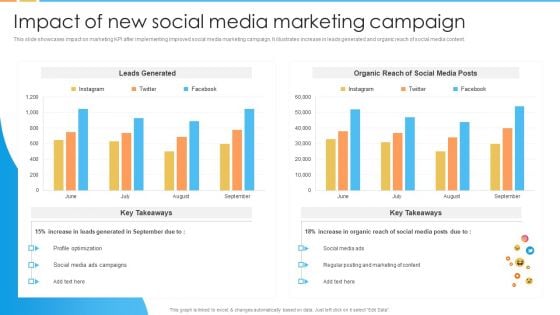
Digital Marketing Guide For B2B Firms Impact Of New Social Media Marketing Campaign Guidelines PDF
This slide showcases impact on marketing KPI after implementing improved social media marketing campaign. It illustrates increase in leads generated and organic reach of social media content.Deliver and pitch your topic in the best possible manner with this Digital Marketing Guide For B2B Firms Impact Of New Social Media Marketing Campaign Guidelines PDF. Use them to share invaluable insights on Profile Optimization, Organic Reach, Regular Posting and impress your audience. This template can be altered and modified as per your expectations. So, grab it now.
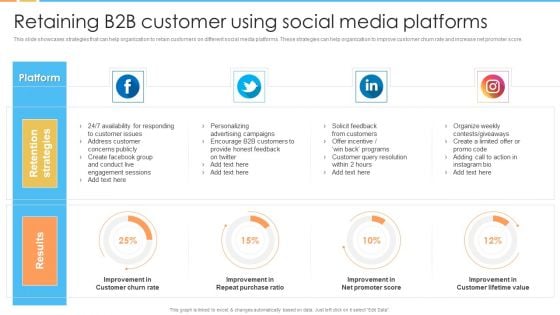
Digital Marketing Guide For B2B Firms Retaining B2B Customer Using Social Media Platforms Brochure PDF
This slide showcases strategies that can help organization to retain customers on different social media platforms. These strategies can help organization to improve customer churn rate and increase net promoter score.Deliver and pitch your topic in the best possible manner with this Digital Marketing Guide For B2B Firms Retaining B2B Customer Using Social Media Platforms Brochure PDF. Use them to share invaluable insights on Availability Responding, Address Customer, Advertising Campaigns and impress your audience. This template can be altered and modified as per your expectations. So, grab it now.
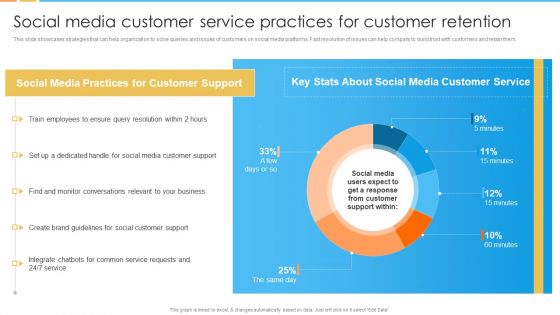
Digital Marketing Guide For B2B Firms Social Media Customer Service Practices For Customer Retention Brochure PDF
This slide showcases strategies that can help organization to solve queries and issues of customers on social media platforms. Fast resolution of issues can help company to build trust with customers and retain them.Deliver an awe inspiring pitch with this creative Digital Marketing Guide For B2B Firms Social Media Customer Service Practices For Customer Retention Brochure PDF bundle. Topics like Media Practices, Customer Support, Monitor Conversations can be discussed with this completely editable template. It is available for immediate download depending on the needs and requirements of the user.
Effective Company Event Communication Tactics Dashboard For Tracking Active Number Of Attendances Demonstration PDF
This slide covers metrics for analyzing the number of most active event participants. It includes KPIs such as check-in status, contract roles, top industries, contract by country, top 5 job functions, etc. Deliver and pitch your topic in the best possible manner with this Effective Company Event Communication Tactics Dashboard For Tracking Active Number Of Attendances Demonstration PDF. Use them to share invaluable insights on Attendance, Exhibitors, Management and impress your audience. This template can be altered and modified as per your expectations. So, grab it now.
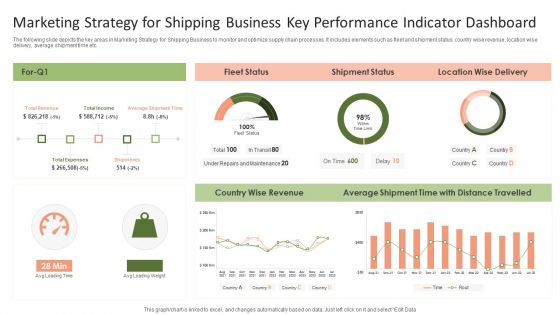
Marketing Strategy For Shipping Business Key Performance Indicator Dashboard Graphics PDF
The following slide depicts the key areas in Marketing Strategy for Shipping Business to monitor and optimize supply chain processes. It includes elements such as fleet and shipment status, country wise revenue, location wise delivery, average shipment time etc.Pitch your topic with ease and precision using this Marketing Strategy For Shipping Business Key Performance Indicator Dashboard Graphics PDF. This layout presents information on Shipment Status, Average Shipment, Wise Revenue. It is also available for immediate download and adjustment. So, changes can be made in the color, design, graphics or any other component to create a unique layout.
Market Insights Research Results With KPI Dashboard Ppt PowerPoint Presentation Icon File Formats PDF
The given below slide highlights the KPAs of market research associated with customer satisfaction. It includes net promoter score, customer effort score, monthly NPS and CES trend etc.Pitch your topic with ease and precision using this Market Insights Research Results With KPI Dashboard Ppt PowerPoint Presentation Icon File Formats PDF. This layout presents information on Satisfaction Score, Customer Effort, Customer Score. It is also available for immediate download and adjustment. So, changes can be made in the color, design, graphics or any other component to create a unique layout.
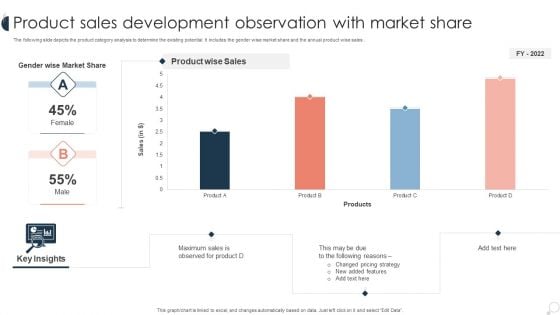
Product Sales Development Observation With Market Share Ppt PowerPoint Presentation Infographic Template Guide PDF
The following slide depicts the product category analysis to determine the existing potential. It includes the gender wise market share and the annual product wise sales . Pitch your topic with ease and precision using this Product Sales Development Observation With Market Share Ppt PowerPoint Presentation Infographic Template Guide PDF. This layout presents information on Changed Pricing, Observed For Product, Product Wise. It is also available for immediate download and adjustment. So, changes can be made in the color, design, graphics or any other component to create a unique layout.
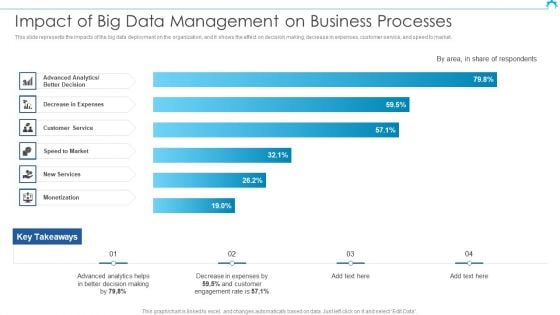
Big Data Architect Impact Of Big Data Management On Business Processes Designs PDF
This slide represents the impacts of the big data deployment on the organization, and it shows the effect on decision making, decrease in expenses, customer service, and speed to market.Deliver and pitch your topic in the best possible manner with this Big Data Architect Impact Of Big Data Management On Business Processes Designs PDF. Use them to share invaluable insights on Advanced Analytics, Better Decision, Decrease Expenses and impress your audience. This template can be altered and modified as per your expectations. So, grab it now.
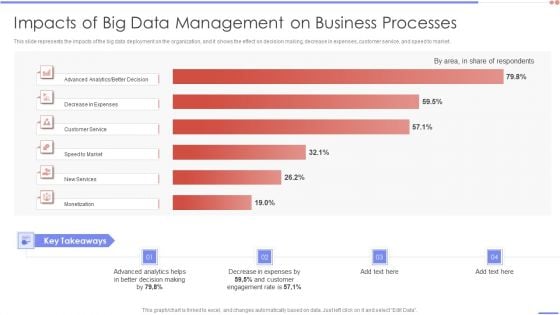
Data Analytics Management Impacts Of Big Data Management On Business Processes Sample PDF
This slide represents the impacts of the big data deployment on the organization, and it shows the effect on decision making, decrease in expenses, customer service, and speed to market.Deliver and pitch your topic in the best possible manner with this Data Analytics Management Impacts Of Big Data Management On Business Processes Sample PDF. Use them to share invaluable insights on Advanced Analytics, Decrease Expenses, Customer Service and impress your audience. This template can be altered and modified as per your expectations. So, grab it now.
Metaverse Technology IT Dashboard For Tracking Metaverse Environment Ppt Outline Elements PDF
This slide represents the dashboard for tracking the metaverse environment. It covers the details of daily revenue, the total number of users, the number of new users, and total sales. Deliver and pitch your topic in the best possible manner with this Metaverse Technology IT Dashboard For Tracking Metaverse Environment Ppt Outline Elements PDF. Use them to share invaluable insights on Digital Spot, Satisfaction Rate, All Metaverses, Transaction Details and impress your audience. This template can be altered and modified as per your expectations. So, grab it now.
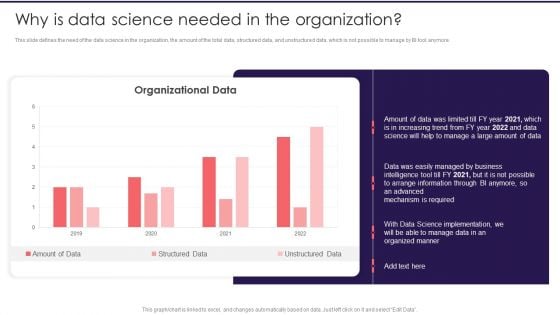
Information Studies Why Is Data Science Needed In The Organization Introduction PDF
This slide defines the need of the data science in the organization, the amount of the total data, structured data, and unstructured data, which is not possible to manage by BI tool anymore. Deliver an awe inspiring pitch with this creative Information Studies Why Is Data Science Needed In The Organization Introduction PDF bundle. Topics like Arrange Information, Required, Data Science Implementation can be discussed with this completely editable template. It is available for immediate download depending on the needs and requirements of the user.
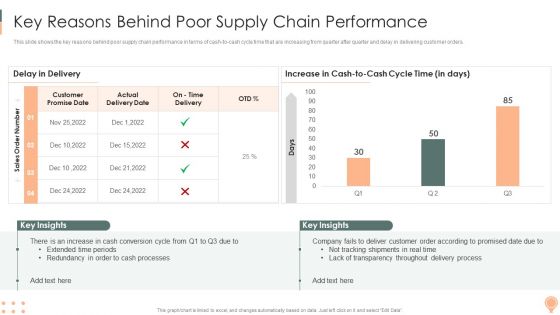
Supply Chain Approaches Key Reasons Behind Poorsupply Chain Performance Rules PDF
This slide shows the key reasons behind poor supply chain performance in terms of cash to cash cycle time that are increasing from quarter after quarter and delay in delivering customer orders.Deliver and pitch your topic in the best possible manner with this Supply Chain Approaches Key Reasons Behind Poorsupply Chain Performance Rules PDF. Use them to share invaluable insights on Customer Promise, Extended Time, Redundancy Cash and impress your audience. This template can be altered and modified as per your expectations. So, grab it now.
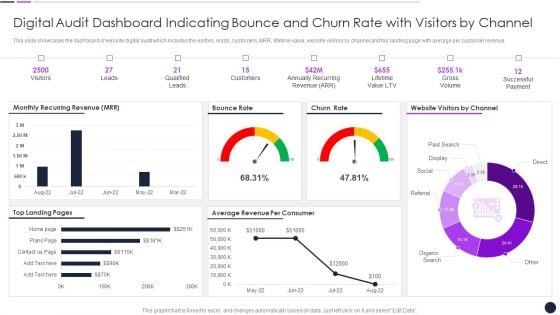
Digital Audit Dashboard Indicating Bounce And Churn Rate With Visitors By Channel Inspiration PDF
This slide showcases the dashboard of website digital audit which includes the visitors, leads, customers, MRR, lifetime value, website visitors by channel and top landing page with average per customer revenue.Deliver and pitch your topic in the best possible manner with this Digital Audit Dashboard Indicating Bounce And Churn Rate With Visitors By Channel Inspiration PDF. Use them to share invaluable insights on Qualified Leads, Annually Recurring, Lifetime Value and impress your audience. This template can be altered and modified as per your expectations. So, grab it now.
Online Customer Interaction Dashboard For Tracking Customer Service Team Performance Infographics PDF
This slide covers the KPI dashboard for analyzing the performance of client support department. It includes metrics such as first call resolution, unresolved calls, average response rate, the best day to call, average time to solve issues, etc. Deliver and pitch your topic in the best possible manner with this Online Customer Interaction Dashboard For Tracking Customer Service Team Performance Infographics PDF. Use them to share invaluable insights on Response Time, Issue Solving, Call Resolution and impress your audience. This template can be altered and modified as per your expectations. So, grab it now.
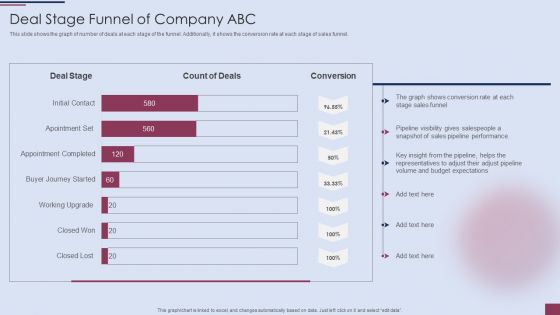
Sales Process Management To Boost Business Effectiveness Deal Stage Funnel Of Company ABC Mockup PDF
This slide shows the graph of number of deals at each stage of the funnel. Additionally, it shows the conversion rate at each stage of sales funnel.Deliver and pitch your topic in the best possible manner with this Sales Process Management To Boost Business Effectiveness Deal Stage Funnel Of Company ABC Mockup PDF. Use them to share invaluable insights on Shows Conversion, Sales Funnel, Pipeline Performance and impress your audience. This template can be altered and modified as per your expectations. So, grab it now.
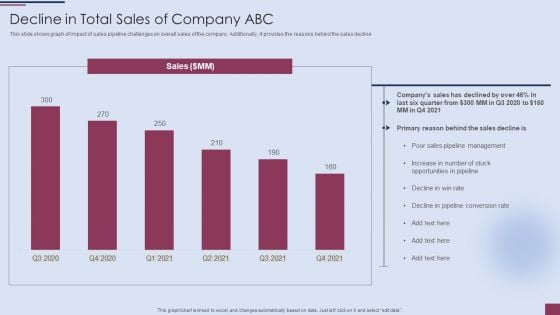
Sales Process Management To Boost Business Effectiveness Decline In Total Sales Of Company ABC Template PDF
This slide shows graph of impact of sales pipeline challenges on overall sales of the company. Additionally, it provides the reasons behind the sales decline.Deliver and pitch your topic in the best possible manner with this Sales Process Management To Boost Business Effectiveness Decline In Total Sales Of Company ABC Template PDF. Use them to share invaluable insights on Pipeline Management, Opportunities In Pipeline, Decline In Pipeline and impress your audience. This template can be altered and modified as per your expectations. So, grab it now.
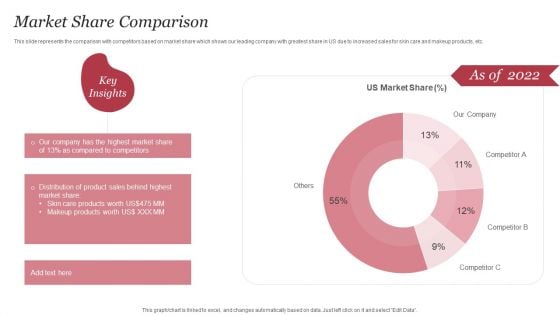
Personal Care Company Profile Market Share Comparison Ppt PowerPoint Presentation Gallery Deck PDF
This slide represents the comparison with competitors based on market share which shows our leading company with greatest share in US due to increased sales for skin care and makeup products, etc. Deliver an awe inspiring pitch with this creative Personal Care Company Profile Market Share Comparison Ppt PowerPoint Presentation Gallery Deck PDF bundle. Topics like US Market Share, Product Sales, Skin Care Products can be discussed with this completely editable template. It is available for immediate download depending on the needs and requirements of the user.

Personal Care Company Profile Annual Revenue 2018 To 2022 Graphics PDF
This slide highlights the annual revenue of our company in last five years with CAGR from 2018 to 2022 which shows increasing trend due to improved product sales. Deliver and pitch your topic in the best possible manner with this Personal Care Company Profile Annual Revenue 2018 To 2022 Graphics PDF. Use them to share invaluable insights on Annual Revenue, Key Insights, Annual Revenue, 2018 To 2022 and impress your audience. This template can be altered and modified as per your expectations. So, grab it now.
Personal Care Company Profile Order Distribution By Product And Gender Icons PDF
This slide focuses on order distribution by products such as makeup, skin care, hair care and body care and fragrances and gender which shows maximum order quantity by females in 2022. Deliver an awe inspiring pitch with this creative Personal Care Company Profile Order Distribution By Product And Gender Icons PDF bundle. Topics like Order Distribution, Product Category, Order Distribution Gender can be discussed with this completely editable template. It is available for immediate download depending on the needs and requirements of the user.
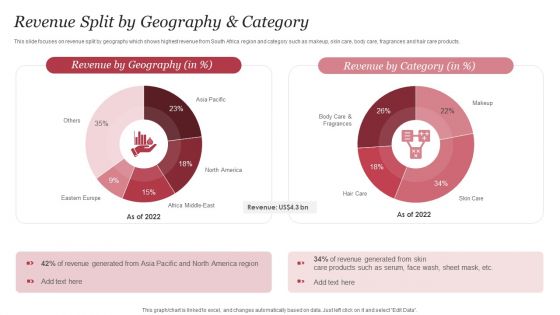
Personal Care Company Profile Revenue Split By Geography And Category Formats PDF
This slide focuses on revenue split by geography which shows highest revenue from South Africa region and category such as makeup, skin care, body care, fragrances and hair care products. Deliver and pitch your topic in the best possible manner with this Personal Care Company Profile Revenue Split By Geography And Category Formats PDF. Use them to share invaluable insights on Revenue Geography, Revenue Category, Revenue Generated and impress your audience. This template can be altered and modified as per your expectations. So, grab it now.
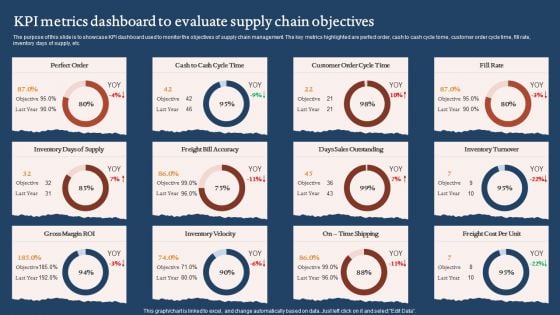
KPI Metrics Dashboard To Evaluate Supply Chain Objectives Graphics PDF
The purpose of this slide is to showcase KPI dashboard used to monitor the objectives of supply chain management. The key metrics highlighted are perfect order, cash to cash cycle tome, customer order cycle time, fill rate, inventory days of supply, etc. Pitch your topic with ease and precision using this KPI Metrics Dashboard To Evaluate Supply Chain Objectives Graphics PDF. This layout presents information on Days Sales Outstanding, Inventory Velocity, Gross Margin Roi. It is also available for immediate download and adjustment. So, changes can be made in the color, design, graphics or any other component to create a unique layout.
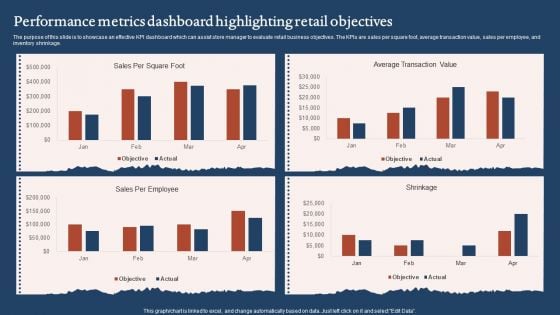
Performance Metrics Dashboard Highlighting Retail Objectives Sample PDF
The purpose of this slide is to showcase an effective KPI dashboard which can assist store manager to evaluate retail business objectives. The KPIs are sales per square foot, average transaction value, sales per employee, and inventory shrinkage. Pitch your topic with ease and precision using this Performance Metrics Dashboard Highlighting Retail Objectives Sample PDF. This layout presents information on Average Transaction Value, Sales Per Employee. It is also available for immediate download and adjustment. So, changes can be made in the color, design, graphics or any other component to create a unique layout.
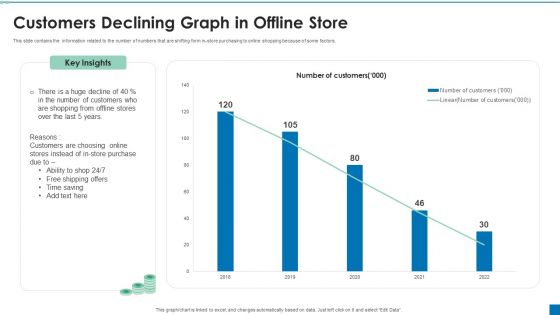
Customers Declining Graph In Offline Store Ppt PowerPoint Presentation Professional Clipart PDF
This slide contains the information related to the number of numbers that are shifting form in-store purchasing to online shopping because of some factors. Pitch your topic with ease and precision using this Customers Declining Graph In Offline Store Ppt PowerPoint Presentation Professional Clipart PDF. This layout presents information on Customers Choosing, Store Purchase, Time Saving. It is also available for immediate download and adjustment. So, changes can be made in the color, design, graphics or any other component to create a unique layout.
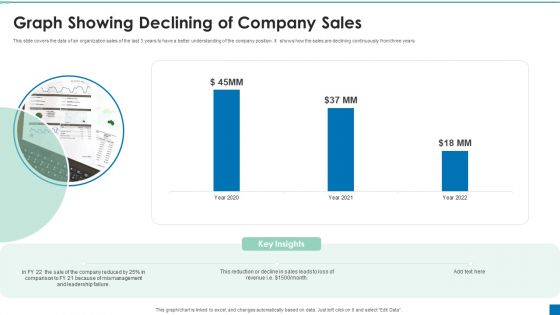
Graph Showing Declining Of Company Sales Ppt PowerPoint Presentation Portfolio Graphics Example PDF
This slide covers the data of an organization sales of the last 3 years to have a better understanding of the company position. It shows how the sales are declining continuously from three years.Pitch your topic with ease and precision using this Graph Showing Declining Of Company Sales Ppt PowerPoint Presentation Portfolio Graphics Example PDF. This layout presents information on Reduction Decline, Comparison, Mismanagement. It is also available for immediate download and adjustment. So, changes can be made in the color, design, graphics or any other component to create a unique layout.
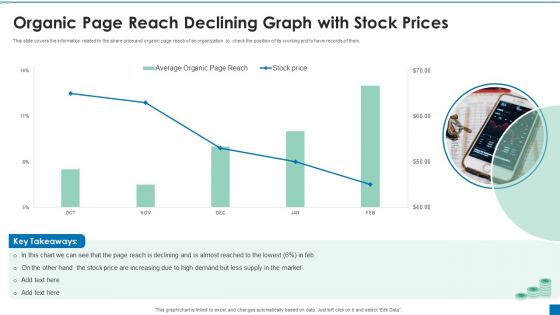
Organic Page Reach Declining Graph With Stock Prices Ppt PowerPoint Presentation Ideas Styles PDF
This slide covers the information related to the share price and organic page reach of an organization to check the position of its working and to have records of them.Pitch your topic with ease and precision using this Organic Page Reach Declining Graph With Stock Prices Ppt PowerPoint Presentation Ideas Styles PDF. This layout presents information on Increasing High, Reach Declining, Supply Market. It is also available for immediate download and adjustment. So, changes can be made in the color, design, graphics or any other component to create a unique layout.
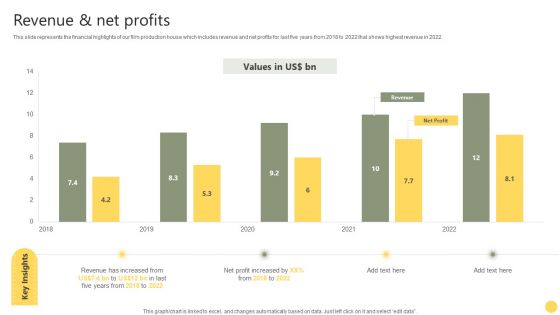
Film Making Firm Profile Revenue And Net Profits Ppt PowerPoint Presentation Gallery Template PDF
This slide represents the financial highlights of our film production house which includes revenue and net profits for last five years from 2018 to 2022 that shows highest revenue in 2022. Deliver an awe inspiring pitch with this creative Film Making Firm Profile Revenue And Net Profits Ppt PowerPoint Presentation Gallery Template PDF bundle. Topics like 2018 To 2022, Net Profit Increased, Revenue can be discussed with this completely editable template. It is available for immediate download depending on the needs and requirements of the user.
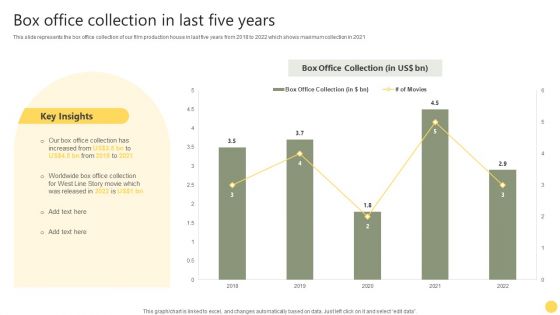
Film Making Firm Profile Box Office Collection In Last Five Years Ppt PowerPoint Presentation File Graphics PDF
This slide represents the box office collection of our film production house in last five years from 2018 to 2022 which shows maximum collection in 2021. Deliver an awe inspiring pitch with this creative Film Making Firm Profile Box Office Collection In Last Five Years Ppt PowerPoint Presentation File Graphics PDF bundle. Topics like Office Collection, Box Office Collection, 2018 To 2022 can be discussed with this completely editable template. It is available for immediate download depending on the needs and requirements of the user.
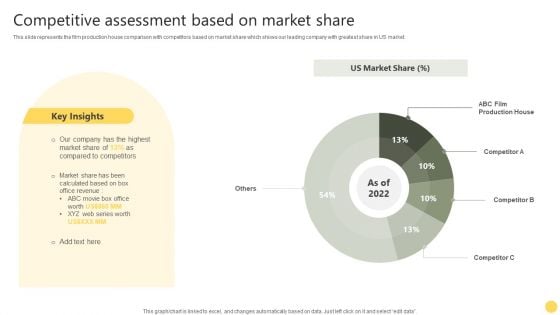
Film Making Firm Profile Competitive Assessment Based On Market Share Ppt PowerPoint Presentation Gallery Files PDF
This slide represents the film production house comparison with competitors based on market share which shows our leading company with greatest share in US market. Deliver and pitch your topic in the best possible manner with this Film Making Firm Profile Competitive Assessment Based On Market Share Ppt PowerPoint Presentation Gallery Files PDF. Use them to share invaluable insights on Key Insights, US Market Share, Market Share and impress your audience. This template can be altered and modified as per your expectations. So, grab it now.
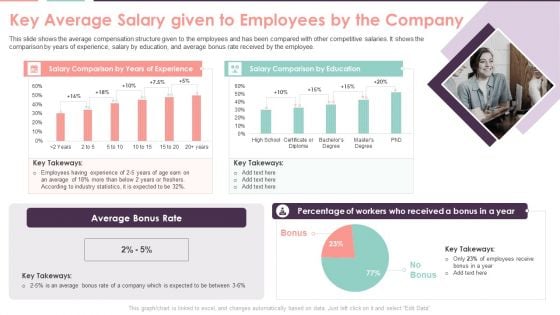
Compensation Survey Sheet Key Average Salary Given To Employees By The Company Information PDF
This slide shows the average compensation structure given to the employees and has been compared with other competitive salaries. It shows the comparison by years of experience, salary by education, and average bonus rate received by the employee. Deliver and pitch your topic in the best possible manner with this Compensation Survey Sheet Key Average Salary Given To Employees By The Company Information PDF. Use them to share invaluable insights on Average Bonus, Industry Statistics and impress your audience. This template can be altered and modified as per your expectations. So, grab it now.
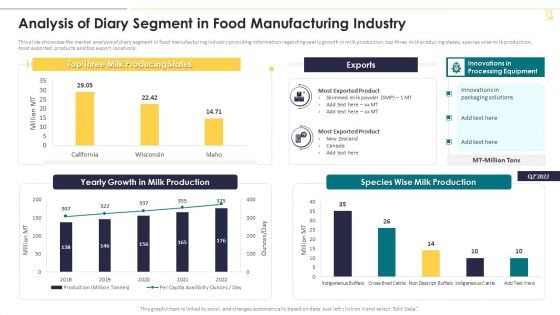
Analysis Of Diary Segment In Food Manufacturing Industry Pictures PDF
This slide showcase the market analysis of diary segment in food manufacturing industry providing information regarding yearly growth in milk production, top three milk producing states, species wise milk production, most exported products and top export locations. Deliver an awe inspiring pitch with this creative Analysis Of Diary Segment In Food Manufacturing Industry Pictures PDF bundle. Topics like Yearly Growth, Processing Equipment, Most Exported Product can be discussed with this completely editable template. It is available for immediate download depending on the needs and requirements of the user.
Analysis Of Grains Fruits And Vegetables Segment In Food Manufacturing Industry Icons PDF
This slide showcase the market analysis of grains fruits and vegetables in food manufacturing industry providing information regarding top states, total production both weight and value wise, key export destinations and innovations in processing equipment. Deliver and pitch your topic in the best possible manner with this Analysis Of Grains Fruits And Vegetables Segment In Food Manufacturing Industry Icons PDF. Use them to share invaluable insights on Key Export Destination, Food Grains Worth, Processing Equipment and impress your audience. This template can be altered and modified as per your expectations. So, grab it now.
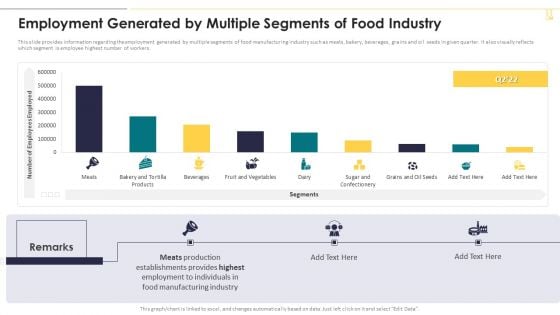
Employment Generated By Multiple Segments Of Food Industry Structure PDF
This slide provides information regarding the employment generated by multiple segments of food manufacturing industry such as meats, bakery, beverages, grains and oil seeds in given quarter. It also visually reflects which segment is employee highest number of workers. Deliver and pitch your topic in the best possible manner with this Employment Generated By Multiple Segments Of Food Industry Structure PDF. Use them to share invaluable insights on Meats Production, Manufacturing Industry and impress your audience. This template can be altered and modified as per your expectations. So, grab it now.
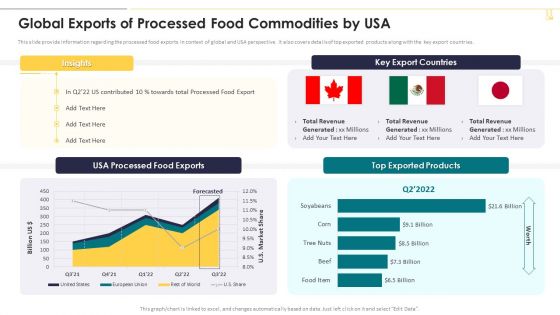
Global Exports Of Processed Food Commodities By Usa Graphics PDF
This slide provide information regarding the processed food exports in context of global and USA perspective. It also covers details of top exported products along with the key export countries. Deliver and pitch your topic in the best possible manner with this Global Exports Of Processed Food Commodities By Usa Graphics PDF. Use them to share invaluable insights on Top Exported Products, Key Export Countries, Total Revenue and impress your audience. This template can be altered and modified as per your expectations. So, grab it now.
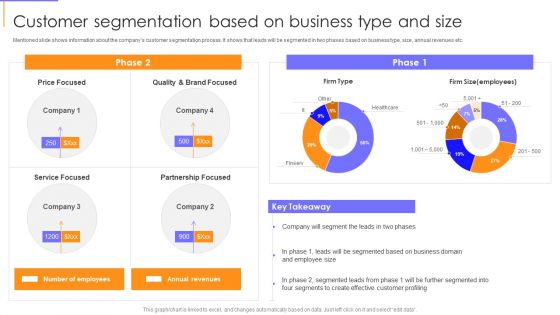
Guide To Client Success Customer Segmentation Based On Business Type And Size Guidelines PDF
Mentioned slide shows information about the companys customer segmentation process. It shows that leads will be segmented in two phases based on business type, size, annual revenues etc. Deliver and pitch your topic in the best possible manner with this Guide To Client Success Customer Segmentation Based On Business Type And Size Guidelines PDF. Use them to share invaluable insights on Quality, Service Focused, Annual Revenues and impress your audience. This template can be altered and modified as per your expectations. So, grab it now.
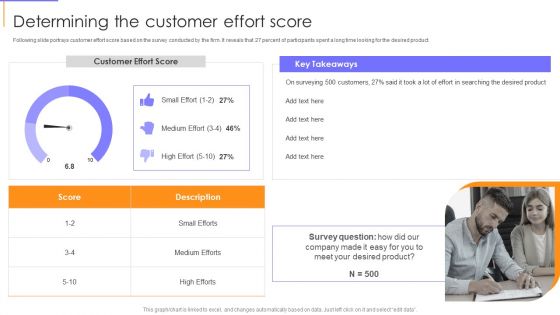
Guide To Client Success Determining The Customer Effort Score Microsoft PDF
Following slide portrays customer effort score based on the survey conducted by the firm. It reveals that 27 percent of participants spent a long time looking for the desired product. Deliver and pitch your topic in the best possible manner with this Guide To Client Success Determining The Customer Effort Score Microsoft PDF. Use them to share invaluable insights on Survey Question, Desired Product, Customer Effort Score and impress your audience. This template can be altered and modified as per your expectations. So, grab it now.

Customized Marketing Impact On Conversion Rates Ppt PowerPoint Presentation Gallery Slideshow PDF
This slide highlights the comparative analysis on conversion rates from the use customized marketing. The platform includes search engine marketing, website, email and social media. Pitch your topic with ease and precision using this Customized Marketing Impact On Conversion Rates Ppt PowerPoint Presentation Gallery Slideshow PDF. This layout presents information on Search Engine Marketing, Social Media, Mobile Apps. It is also available for immediate download and adjustment. So, changes can be made in the color, design, graphics or any other component to create a unique layout.
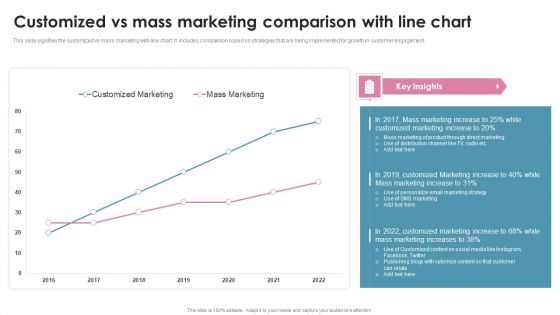
Customized Vs Mass Marketing Comparison With Line Chart Ppt PowerPoint Presentation File Ideas PDF
This slide signifies the customized vs mass marketing with line chart. It includes comparison based on strategies that are being implemented for growth in customer engagement. Pitch your topic with ease and precision using this Customized Vs Mass Marketing Comparison With Line Chart Ppt PowerPoint Presentation File Ideas PDF. This layout presents information on Customized Marketing, Mass Marketing, 2016 To 2022. It is also available for immediate download and adjustment. So, changes can be made in the color, design, graphics or any other component to create a unique layout.
Gross Profit Margin Dashboard With Revenue Vs Expenses Icons PDF
This slide showcases dashboard that can help organization to evaluate the revenue generated and expenses incurred in conducting operations. It also showcases gross profit and margin of last financial year. Pitch your topic with ease and precision using this Gross Profit Margin Dashboard With Revenue Vs Expenses Icons PDF. This layout presents information on Gross Profit Margin, EBITDA Margin, Net Profit Margin. It is also available for immediate download and adjustment. So, changes can be made in the color, design, graphics or any other component to create a unique layout.
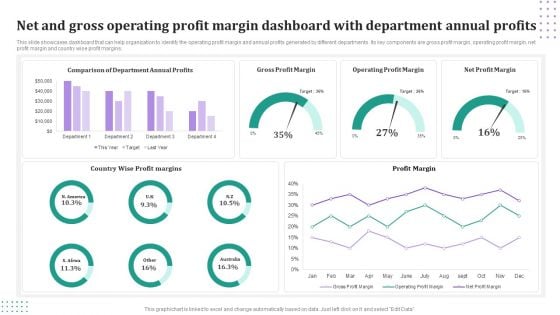
Net And Gross Operating Profit Margin Dashboard With Department Annual Profits Mockup PDF
This slide showcases dashboard that can help organization to identify the operating profit margin and annual profits generated by different departments. Its key components are gross profit margin, operating profit margin, net profit margin and country wise profit margins. Pitch your topic with ease and precision using this Net And Gross Operating Profit Margin Dashboard With Department Annual Profits Mockup PDF. This layout presents information on Gross Profit Margin, Operating Profit Margin, Net Profit Margin. It is also available for immediate download and adjustment. So, changes can be made in the color, design, graphics or any other component to create a unique layout.
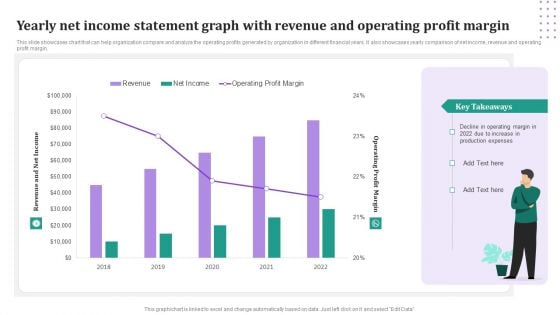
Yearly Net Income Statement Graph With Revenue And Operating Profit Margin Download PDF
This slide showcases chart that can help organization compare and analyze the operating profits generated by organization in different financial years. It also showcases yearly comparison of net income, revenue and operating profit margin. Pitch your topic with ease and precision using this Yearly Net Income Statement Graph With Revenue And Operating Profit Margin Download PDF. This layout presents information on Revenue, Net Income, Operating Profit Margin. It is also available for immediate download and adjustment. So, changes can be made in the color, design, graphics or any other component to create a unique layout.
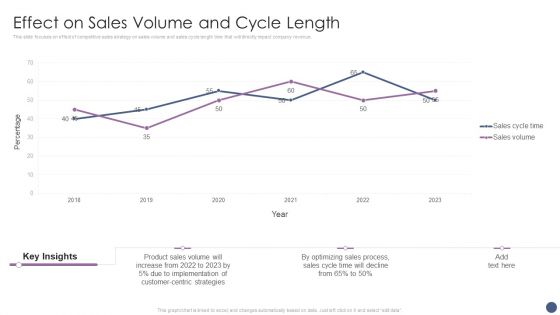
Competitive Sales Strategy Development Plan For Revenue Growth Effect On Sales Volume And Cycle Length Clipart PDF
This slide focuses on effect of competitive sales strategy on sales volume and sales cycle length time that will directly impact company revenue. Deliver and pitch your topic in the best possible manner with this Competitive Sales Strategy Development Plan For Revenue Growth Effect On Sales Volume And Cycle Length Clipart PDF. Use them to share invaluable insights on Implementation, Customer Centric Strategies, Optimizing Sales Process and impress your audience. This template can be altered and modified as per your expectations. So, grab it now.
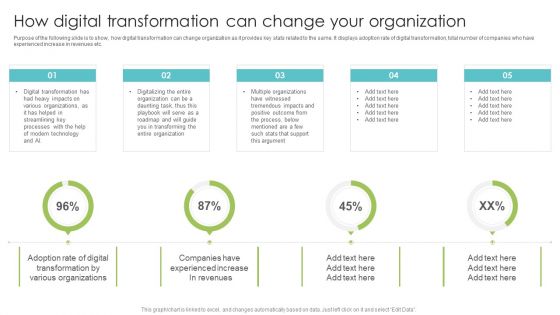
How Digital Transformation Can Change Your Organization Sample PDF
Purpose of the following slide is to show, how digital transformation can change organization as it provides key stats related to the same. It displays adoption rate of digital transformation, total number of companies who have experienced increase in revenues etc. Deliver an awe inspiring pitch with this creative How Digital Transformation Can Change Your Organization Sample PDF bundle. Topics like Revenues, Various Organizations, Modern Technology can be discussed with this completely editable template. It is available for immediate download depending on the needs and requirements of the user.
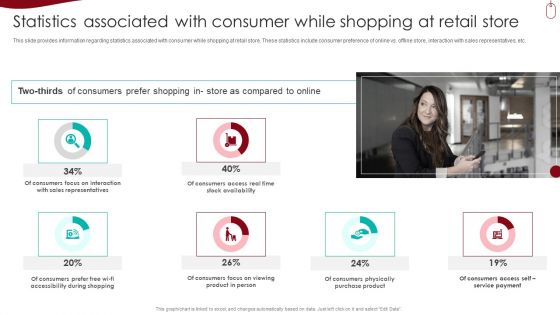
Retail Outlet Experience Optimization Playbook Statistics Associated With Consumer While Shopping At Retail Store Guidelines PDF
This slide provides information regarding statistics associated with consumer while shopping at retail store. These statistics include consumer preference of online vs. offline store, interaction with sales representatives, etc. Deliver an awe inspiring pitch with this creative Retail Outlet Experience Optimization Playbook Statistics Associated With Consumer While Shopping At Retail Store Guidelines PDF bundle. Topics like Purchase Product, Service Payment, Consumers Access can be discussed with this completely editable template. It is available for immediate download depending on the needs and requirements of the user.
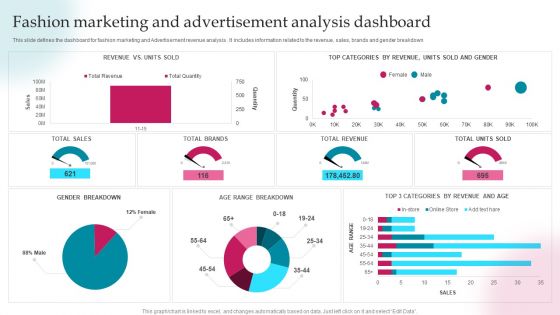
Fashion Marketing And Advertisement Analysis Dashboard Ppt PowerPoint Presentation Gallery Topics PDF
This slide defines the dashboard for fashion marketing and Advertisement revenue analysis . It includes information related to the revenue, sales, brands and gender breakdown. Pitch your topic with ease and precision using this Fashion Marketing And Advertisement Analysis Dashboard Ppt PowerPoint Presentation Gallery Topics PDF. This layout presents information on Total Revenue, Total Brands, Total Sales. It is also available for immediate download and adjustment. So, changes can be made in the color, design, graphics or any other component to create a unique layout.
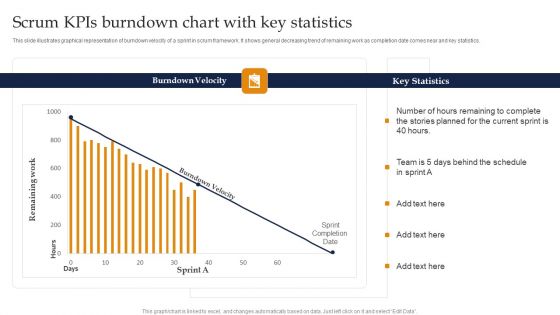
Scrum Kpis Burndown Chart With Key Statistics Ppt Pictures Visual Aids PDF
This slide illustrates graphical representation of burndown velocity of a sprint in scrum framework. It shows general decreasing trend of remaining work as completion date comes near and key statistics. Pitch your topic with ease and precision using this Scrum Kpis Burndown Chart With Key Statistics Ppt Pictures Visual Aids PDF. This layout presents information on Burndown Velocity, Key Statistics, Current Sprint. It is also available for immediate download and adjustment. So, changes can be made in the color, design, graphics or any other component to create a unique layout.
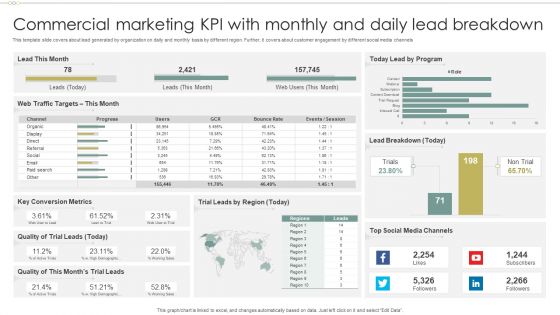
Commercial Marketing KPI With Monthly And Daily Lead Breakdown Ideas PDF
This template slide covers about lead generated by organization on daily and monthly basis by different region. Further, it covers about customer engagement by different social media channels. Pitch your topic with ease and precision using this Commercial Marketing KPI With Monthly And Daily Lead Breakdown Ideas PDF. This layout presents information on Conversion Metrics, Quality Trial, Lead Breakdown. It is also available for immediate download and adjustment. So, changes can be made in the color, design, graphics or any other component to create a unique layout.
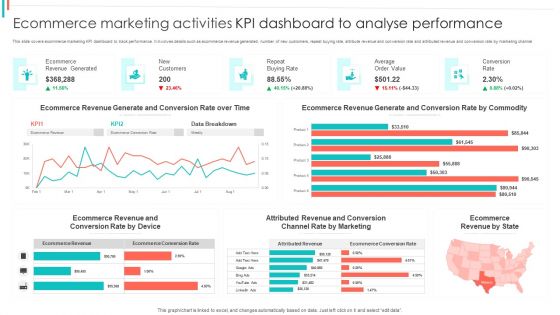
Ecommerce Marketing Activities KPI Dashboard To Analyse Performance Guidelines PDF
This slide covers ecommerce marketing KPI dashboard to track performance. It involves details such as ecommerce revenue generated, number of new customers, repeat buying rate, attribute revenue and conversion rate and attributed revenue and conversion rate by marketing channel.Pitch your topic with ease and precision using this Ecommerce Marketing Activities KPI Dashboard To Analyse Performance Guidelines PDF. This layout presents information on Revenue Generated, Ecommerce Revenue, Generate Conversion. It is also available for immediate download and adjustment. So, changes can be made in the color, design, graphics or any other component to create a unique layout.


 Continue with Email

 Home
Home


