Budget Slide
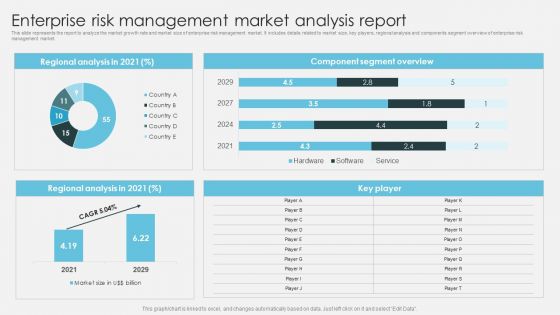
Enterprise Risk Management Market Analysis Report Introduction To ERM Clipart PDF
This slide represents the report to analyze the market growth rate and market size of enterprise risk management market. It includes details related to market size, key players, regional analysis and components segment overview of enterprise risk management market.Get a simple yet stunning designed Enterprise Risk Management Market Analysis Report Introduction To ERM Clipart PDF. It is the best one to establish the tone in your meetings. It is an excellent way to make your presentations highly effective. So, download this PPT today from Slidegeeks and see the positive impacts. Our easy-to-edit Enterprise Risk Management Market Analysis Report Introduction To ERM Clipart PDF can be your go-to option for all upcoming conferences and meetings. So, what are you waiting for Grab this template today.
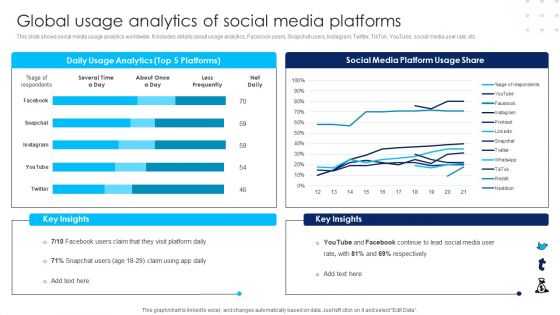
Using Social Media Platforms To Enhance Global Usage Analytics Of Social Media Platforms Rules PDF
This slide shows social media usage analytics worldwide. It includes details about usage analytics, Facebook users, Snapchat users, Instagram, Twitter, TikTok, YouTube, social media user rate, etc. Formulating a presentation can take up a lot of effort and time, so the content and message should always be the primary focus. The visuals of the PowerPoint can enhance the presenters message, so our Using Social Media Platforms To Enhance Global Usage Analytics Of Social Media Platforms Rules PDF was created to help save time. Instead of worrying about the design, the presenter can concentrate on the message while our designers work on creating the ideal templates for whatever situation is needed. Slidegeeks has experts for everything from amazing designs to valuable content, we have put everything into Using Social Media Platforms To Enhance Global Usage Analytics Of Social Media Platforms Rules PDF.
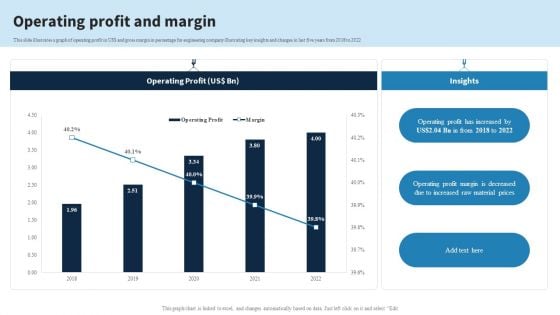
Engineering Services Company Report Operating Profit And Margin Ppt PowerPoint Presentation Gallery Show PDF
This slide illustrates a graph of operating profit in US dollar and gross margin in percentage for engineering company illustrating key insights and changes in last five years from 2018 to 2022. Do you have an important presentation coming up Are you looking for something that will make your presentation stand out from the rest Look no further than Engineering Services Company Report Operating Profit And Margin Ppt PowerPoint Presentation Gallery Show PDF. With our professional designs, you can trust that your presentation will pop and make delivering it a smooth process. And with Slidegeeks, you can trust that your presentation will be unique and memorable. So why wait Grab Engineering Services Company Report Operating Profit And Margin Ppt PowerPoint Presentation Gallery Show PDF today and make your presentation stand out from the rest.
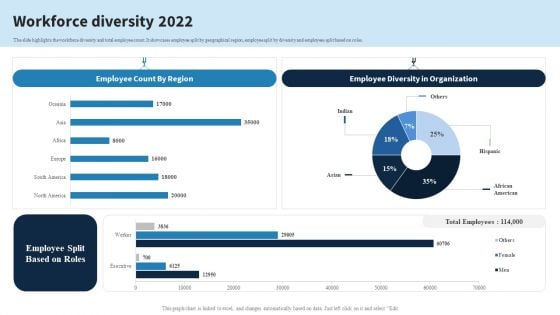
Engineering Services Company Report Workforce Diversity 2022 Ppt PowerPoint Presentation File Pictures PDF
The slide highlights the workforce diversity and total employee count. It showcases employee split by geographical region, employee split by diversity and employees split based on roles. Create an editable Engineering Services Company Report Workforce Diversity 2022 Ppt PowerPoint Presentation File Pictures PDF that communicates your idea and engages your audience. Whether youre presenting a business or an educational presentation, pre-designed presentation templates help save time. Engineering Services Company Report Workforce Diversity 2022 Ppt PowerPoint Presentation File Pictures PDF is highly customizable and very easy to edit, covering many different styles from creative to business presentations. Slidegeeks has creative team members who have crafted amazing templates. So, go and get them without any delay.
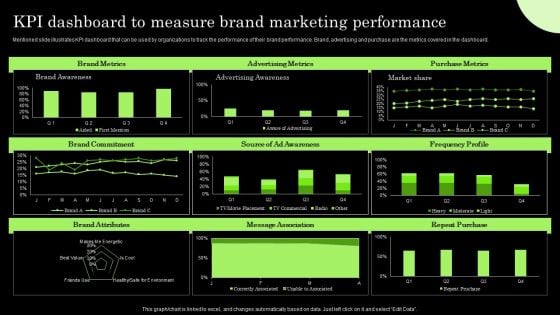
Tactical Brand Extension Launching Kpi Dashboard To Measure Brand Marketing Professional PDF
Mentioned slide illustrates KPI dashboard that can be used by organizations to track the performance of their brand performance. Brand, advertising and purchase are the metrics covered in the dashboard. Get a simple yet stunning designed Tactical Brand Extension Launching Kpi Dashboard To Measure Brand Marketing Professional PDF. It is the best one to establish the tone in your meetings. It is an excellent way to make your presentations highly effective. So, download this PPT today from Slidegeeks and see the positive impacts. Our easy-to-edit Tactical Brand Extension Launching Kpi Dashboard To Measure Brand Marketing Professional PDF can be your go-to option for all upcoming conferences and meetings. So, what are you waiting for Grab this template today.
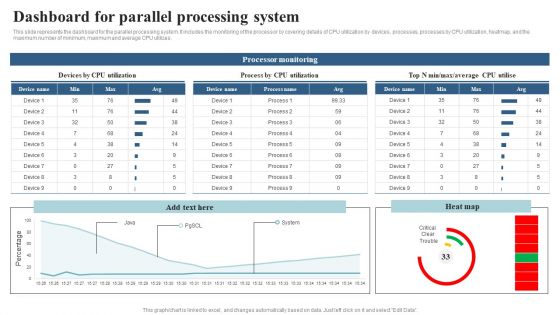
Integrating Parallel Processor System Dashboard For Parallel Processing System Brochure PDF
This slide represents the dashboard for the parallel processing system. It includes the monitoring of the processor by covering details of CPU utilization by devices, processes, processes by CPU utilization, heatmap, and the maximum number of minimum, maximum and average CPU utilizes. Want to ace your presentation in front of a live audience Our Integrating Parallel Processor System Dashboard For Parallel Processing System Brochure PDF can help you do that by engaging all the users towards you.. Slidegeeks experts have put their efforts and expertise into creating these impeccable powerpoint presentations so that you can communicate your ideas clearly. Moreover, all the templates are customizable, and easy-to-edit and downloadable. Use these for both personal and commercial use.
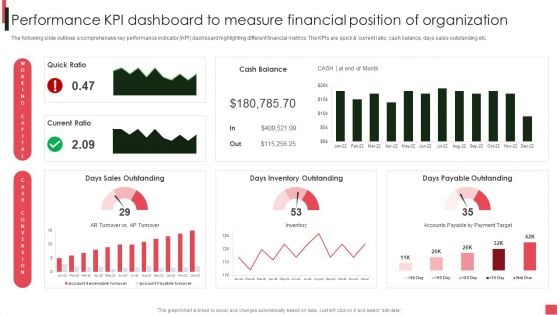
Overview Of Organizational Performance Kpi Dashboard To Measure Financial Position Sample PDF
The following slide outlines a comprehensive key performance indicator KPI dashboard highlighting different financial metrics. The KPIs are quick and current ratio, cash balance, days sales outstanding etc. Welcome to our selection of the Overview Of Organizational Performance Kpi Dashboard To Measure Financial Position Sample PDF. These are designed to help you showcase your creativity and bring your sphere to life. Planning and Innovation are essential for any business that is just starting out. This collection contains the designs that you need for your everyday presentations. All of our PowerPoints are 100 percent editable, so you can customize them to suit your needs. This multi-purpose template can be used in various situations. Grab these presentation templates today.
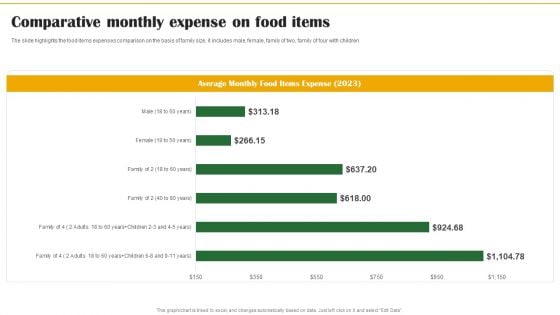
Food Organization Financial Trends Comparative Monthly Expense On Food Items Background PDF
The slide highlights the food items expenses comparison on the basis of family size, it includes male, female, family of two, family of four with children. Formulating a presentation can take up a lot of effort and time, so the content and message should always be the primary focus. The visuals of the PowerPoint can enhance the presenters message, so our Food Organization Financial Trends Comparative Monthly Expense On Food Items Background PDF was created to help save time. Instead of worrying about the design, the presenter can concentrate on the message while our designers work on creating the ideal templates for whatever situation is needed. Slidegeeks has experts for everything from amazing designs to valuable content, we have put everything into Food Organization Financial Trends Comparative Monthly Expense On Food Items Background PDF.
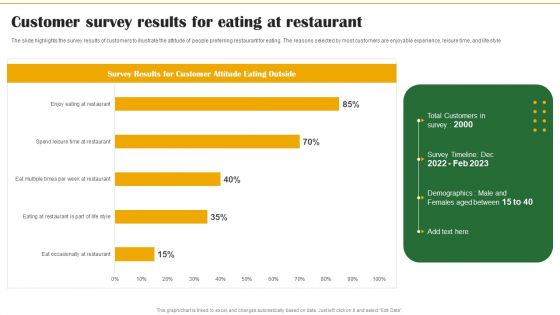
Food Organization Financial Trends Customer Survey Results For Eating At Restaurant Formats PDF
The slide highlights the survey results of customers to illustrate the attitude of people preferring restaurant for eating. The reasons selected by most customers are enjoyable experience, leisure time, and life style. Coming up with a presentation necessitates that the majority of the effort goes into the content and the message you intend to convey. The visuals of a PowerPoint presentation can only be effective if it supplements and supports the story that is being told. Keeping this in mind our experts created Food Organization Financial Trends Customer Survey Results For Eating At Restaurant Formats PDF to reduce the time that goes into designing the presentation. This way, you can concentrate on the message while our designers take care of providing you with the right template for the situation.
Integrating AI To Enhance Dashboard For Tracking Impact Of Supply Chain Automation Themes PDF
This slide covers the dashboard for back-end tracking of overall impact automation. It include KPIs such as retailer capacity, warehouse capacity, truck efficiency, time to reach warehouse, sustainability, etc. Do you have an important presentation coming up Are you looking for something that will make your presentation stand out from the rest Look no further than Integrating AI To Enhance Dashboard For Tracking Impact Of Supply Chain Automation Themes PDF. With our professional designs, you can trust that your presentation will pop and make delivering it a smooth process. And with Slidegeeks, you can trust that your presentation will be unique and memorable. So why wait Grab Integrating AI To Enhance Dashboard For Tracking Impact Of Supply Chain Automation Themes PDF today and make your presentation stand out from the rest.
Integrating AI To Enhance Dashboard For Tracking Impact Of Transport Automation Template PDF
This slide covers the dashboard for tracking vehicle efficiency after transport automation. It include KPIs such as truck turnaround time, average revenue per hour, truckload capacity, transit time, on-time pickup, and average revenue per mile. Whether you have daily or monthly meetings, a brilliant presentation is necessary. Integrating AI To Enhance Dashboard For Tracking Impact Of Transport Automation Template PDF can be your best option for delivering a presentation. Represent everything in detail using Integrating AI To Enhance Dashboard For Tracking Impact Of Transport Automation Template PDF and make yourself stand out in meetings. The template is versatile and follows a structure that will cater to your requirements. All the templates prepared by Slidegeeks are easy to download and edit. Our research experts have taken care of the corporate themes as well. So, give it a try and see the results.
Integrating AI To Enhance Dashboard For Tracking Impact Of Warehouse House Automation Professional PDF
This slide covers the dashboard with after automation warehouse overview. It include KPIs such as autonomous robots status, robotic arms status, battery level, performance, time to return, etc. Find highly impressive Integrating AI To Enhance Dashboard For Tracking Impact Of Warehouse House Automation Professional PDF on Slidegeeks to deliver a meaningful presentation. You can save an ample amount of time using these presentation templates. No need to worry to prepare everything from scratch because Slidegeeks experts have already done a huge research and work for you. You need to download Integrating AI To Enhance Dashboard For Tracking Impact Of Warehouse House Automation Professional PDF for your upcoming presentation. All the presentation templates are 100 percent editable and you can change the color and personalize the content accordingly. Download now.
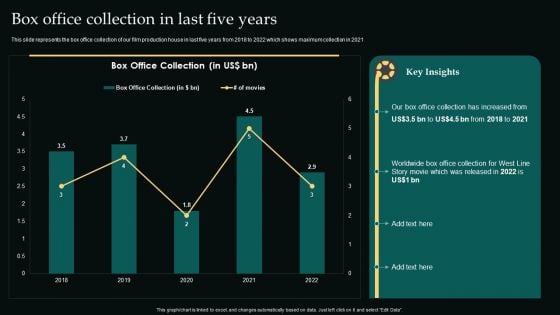
Box Office Collection In Last Five Years Movie Editing Company Outline Demonstration PDF
This slide represents the box office collection of our film production house in last five years from 2018 to 2022 which shows maximum collection in 2021. Crafting an eye-catching presentation has never been more straightforward. Let your presentation shine with this tasteful yet straightforward Box Office Collection In Last Five Years Movie Editing Company Outline Demonstration PDF template. It offers a minimalistic and classy look that is great for making a statement. The colors have been employed intelligently to add a bit of playfulness while still remaining professional. Construct the ideal Box Office Collection In Last Five Years Movie Editing Company Outline Demonstration PDF that effortlessly grabs the attention of your audience Begin now and be certain to wow your customers.
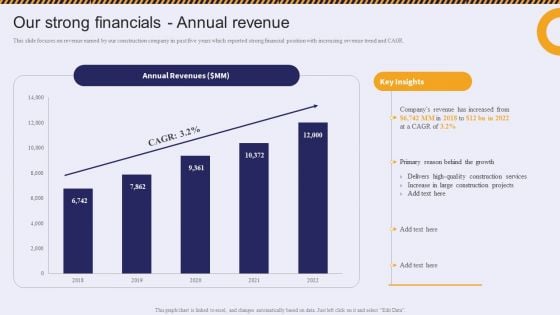
Our Strong Financials Annual Revenue Residential And Commercial Building Construction Topics PDF
This slide focuses on revenue earned by our construction company in past five years which reported strong financial position with increasing revenue trend and CAGR.This Our Strong Financials Annual Revenue Residential And Commercial Building Construction Topics PDF from Slidegeeks makes it easy to present information on your topic with precision. It provides customization options, so you can make changes to the colors, design, graphics, or any other component to create a unique layout. It is also available for immediate download, so you can begin using it right away. Slidegeeks has done good research to ensure that you have everything you need to make your presentation stand out. Make a name out there for a brilliant performance.
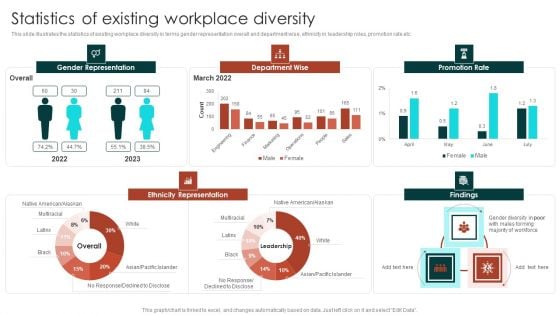
Diversity Management Plan To Improve Workplace Culture Statistics Of Existing Workplace Diversity Brochure PDF
This slide illustrates the statistics of existing workplace diversity in terms gender representation overall and department wise, ethnicity in leadership roles, promotion rate etc. Get a simple yet stunning designed Diversity Management Plan To Improve Workplace Culture Statistics Of Existing Workplace Diversity Brochure PDF. It is the best one to establish the tone in your meetings. It is an excellent way to make your presentations highly effective. So, download this PPT today from Slidegeeks and see the positive impacts. Our easy-to-edit Diversity Management Plan To Improve Workplace Culture Statistics Of Existing Workplace Diversity Brochure PDF can be your go-to option for all upcoming conferences and meetings. So, what are you waiting for. Grab this template today.
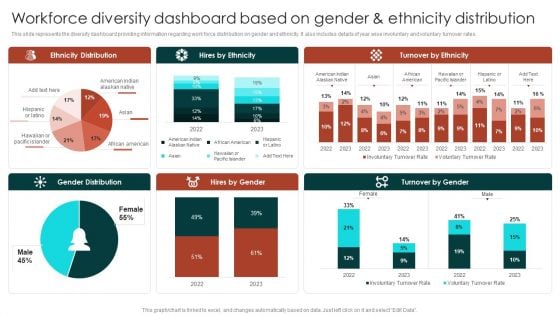
Workforce Diversity Dashboard Based On Gender And Ethnicity Distribution Guidelines PDF
This slide represents the diversity dashboard providing information regarding work force distribution on gender and ethnicity. It also includes details of year wise involuntary and voluntary turnover rates. Find highly impressive Workforce Diversity Dashboard Based On Gender And Ethnicity Distribution Guidelines PDF on Slidegeeks to deliver a meaningful presentation. You can save an ample amount of time using these presentation templates. No need to worry to prepare everything from scratch because Slidegeeks experts have already done a huge research and work for you. You need to download Workforce Diversity Dashboard Based On Gender And Ethnicity Distribution Guidelines PDF for your upcoming presentation. All the presentation templates are 100 Percent editable and you can change the color and personalize the content accordingly. Download now.
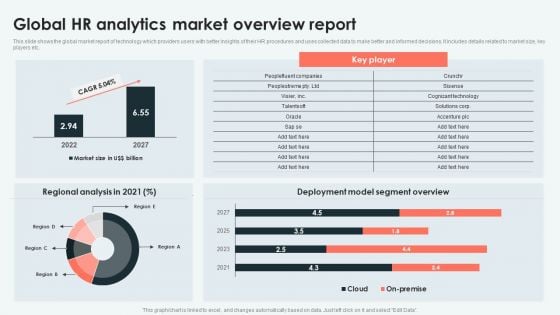
Analyzing And Deploying Global HR Analytics Market Overview Report Portrait PDF
This slide shows the global market report of technology which providers users with better insights of their HR procedures and uses collected data to make better and informed decisions. It includes details related to market size, key players etc. Create an editable Analyzing And Deploying Global HR Analytics Market Overview Report Portrait PDF that communicates your idea and engages your audience. Whether youre presenting a business or an educational presentation, pre-designed presentation templates help save time. Analyzing And Deploying Global HR Analytics Market Overview Report Portrait PDF is highly customizable and very easy to edit, covering many different styles from creative to business presentations. Slidegeeks has creative team members who have crafted amazing templates. So, go and get them without any delay.
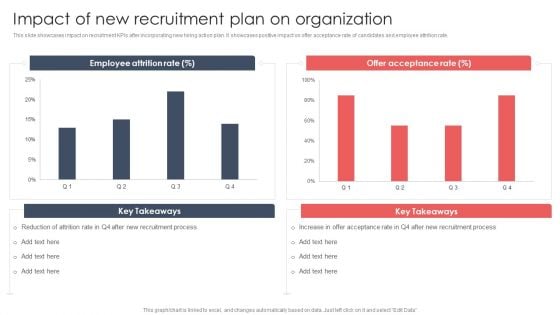
Screening And Staffing Impact Of New Recruitment Plan On Organization Portrait PDF
This slide showcases impact on recruitment KPIs after incorporating new hiring action plan. It showcases positive impact on offer acceptance rate of candidates and employee attrition rate. Crafting an eye-catching presentation has never been more straightforward. Let your presentation shine with this tasteful yet straightforward Screening And Staffing Impact Of New Recruitment Plan On Organization Portrait PDF template. It offers a minimalistic and classy look that is great for making a statement. The colors have been employed intelligently to add a bit of playfulness while still remaining professional. Construct the ideal Screening And Staffing Impact Of New Recruitment Plan On Organization Portrait PDF that effortlessly grabs the attention of your audience Begin now and be certain to wow your customers.

Generating Leads Through Decline In Leads Generated And Organic Reach Guidelines PDF
This slide current scenario and results of organization marketing campaigns. It illustrates graph which shows decline in leads generated and organic reach of social media posts from past four months. Slidegeeks is here to make your presentations a breeze with Generating Leads Through Decline In Leads Generated And Organic Reach Guidelines PDF With our easy-to-use and customizable templates, you can focus on delivering your ideas rather than worrying about formatting. With a variety of designs to choose from, youre sure to find one that suits your needs. And with animations and unique photos, illustrations, and fonts, you can make your presentation pop. So whether youre giving a sales pitch or presenting to the board, make sure to check out Slidegeeks first.
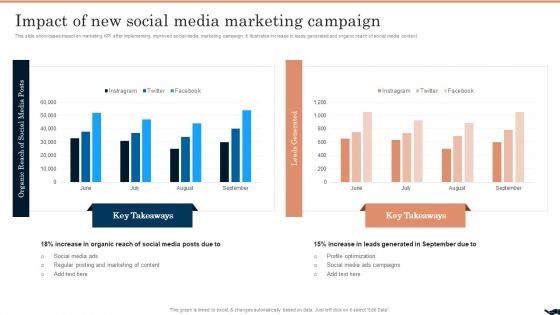
Generating Leads Through Impact Of New Social Media Marketing Campaign Clipart PDF
This slide showcases impact on marketing KPI after implementing improved social media marketing campaign. It illustrates increase in leads generated and organic reach of social media content. Find highly impressive Generating Leads Through Impact Of New Social Media Marketing Campaign Clipart PDF on Slidegeeks to deliver a meaningful presentation. You can save an ample amount of time using these presentation templates. No need to worry to prepare everything from scratch because Slidegeeks experts have already done a huge research and work for you. You need to download Generating Leads Through Impact Of New Social Media Marketing Campaign Clipart PDF for your upcoming presentation. All the presentation templates are 100 percent editable and you can change the color and personalize the content accordingly. Download now.

Talent Administration And Succession Determining Employee Headcount Average Tenure Inspiration PDF
Following slide displays informational stats about employee headcount and average tenure. It also includes a graph that shows stats about hiring and turnover rate. Slidegeeks is here to make your presentations a breeze with Talent Administration And Succession Determining Employee Headcount Average Tenure Inspiration PDF With our easy-to-use and customizable templates, you can focus on delivering your ideas rather than worrying about formatting. With a variety of designs to choose from, youre sure to find one that suits your needs. And with animations and unique photos, illustrations, and fonts, you can make your presentation pop. So whether youre giving a sales pitch or presenting to the board, make sure to check out Slidegeeks first.
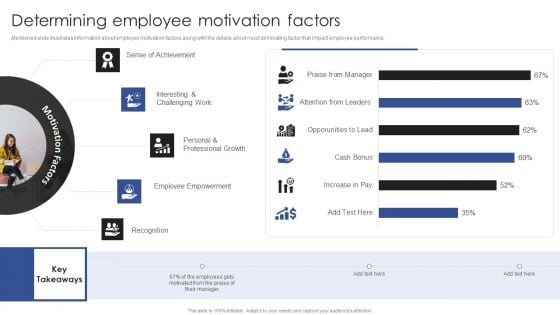
Talent Administration And Succession Determining Employee Motivation Factors Information PDF
Mentioned slide illustrates information about employee motivation factors along with the details about most dominating factor that impact employee performance. Do you have an important presentation coming up Are you looking for something that will make your presentation stand out from the rest Look no further than Talent Administration And Succession Determining Employee Motivation Factors Information PDF. With our professional designs, you can trust that your presentation will pop and make delivering it a smooth process. And with Slidegeeks, you can trust that your presentation will be unique and memorable. So why wait Grab Talent Administration And Succession Determining Employee Motivation Factors Information PDF today and make your presentation stand out from the rest.
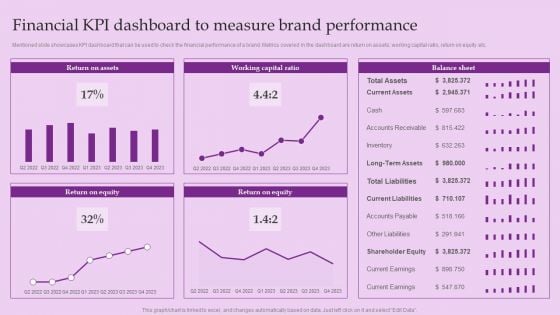
Financial KPI Dashboard To Measure Brand Performance Brand And Equity Evaluation Techniques Elements PDF
Mentioned slide showcases KPI dashboard that can be used to check the financial performance of a brand. Metrics covered in the dashboard are return on assets, working capital ratio, return on equity etc.Coming up with a presentation necessitates that the majority of the effort goes into the content and the message you intend to convey. The visuals of a PowerPoint presentation can only be effective if it supplements and supports the story that is being told. Keeping this in mind our experts created Financial KPI Dashboard To Measure Brand Performance Brand And Equity Evaluation Techniques Elements PDF to reduce the time that goes into designing the presentation. This way, you can concentrate on the message while our designers take care of providing you with the right template for the situation.
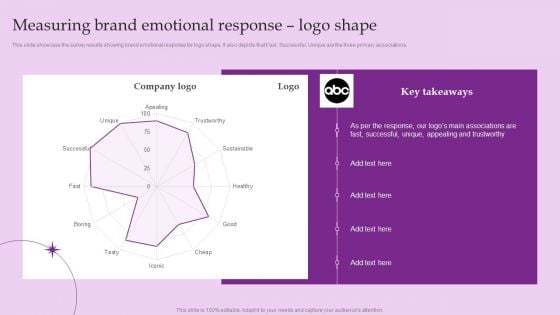
Measuring Brand Emotional Response Logo Shape Brand And Equity Evaluation Techniques Introduction PDF
This slide showcase the survey results showing brand emotional response for logo shape. It also depicts that Fast, Successful, Unique are the three primary associations. This Measuring Brand Emotional Response Logo Shape Brand And Equity Evaluation Techniques Introduction PDF from Slidegeeks makes it easy to present information on your topic with precision. It provides customization options, so you can make changes to the colors, design, graphics, or any other component to create a unique layout. It is also available for immediate download, so you can begin using it right away. Slidegeeks has done good research to ensure that you have everything you need to make your presentation stand out. Make a name out there for a brilliant performance.
Effective Brand Reputation Management Customer Tracking Dashboard To Monitor Brand Introduction PDF
This slide provides information brand loyalty tracking dashboard in order to monitor customer engagement, average revenues, new vs. Returning visitors performance, etc. Formulating a presentation can take up a lot of effort and time, so the content and message should always be the primary focus. The visuals of the PowerPoint can enhance the presenters message, so our Effective Brand Reputation Management Customer Tracking Dashboard To Monitor Brand Introduction PDF was created to help save time. Instead of worrying about the design, the presenter can concentrate on the message while our designers work on creating the ideal templates for whatever situation is needed. Slidegeeks has experts for everything from amazing designs to valuable content, we have put everything into Effective Brand Reputation Management Customer Tracking Dashboard To Monitor Brand Introduction PDF.
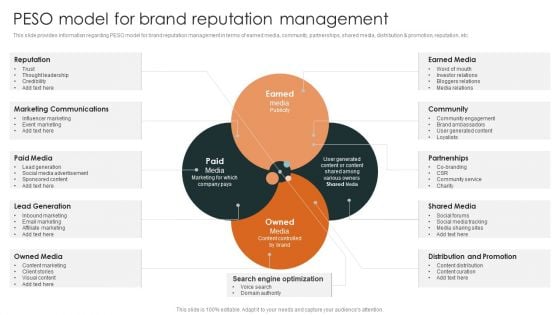
Effective Brand Reputation Management Peso Model For Brand Reputation Management Clipart PDF
This slide provides information regarding monitoring dashboard to track brand performance through monitoring of session, new users, bounce rate, etc. Find highly impressive Effective Brand Reputation Management Peso Model For Brand Reputation Management Clipart PDF on Slidegeeks to deliver a meaningful presentation. You can save an ample amount of time using these presentation templates. No need to worry to prepare everything from scratch because Slidegeeks experts have already done a huge research and work for you. You need to download Effective Brand Reputation Management Peso Model For Brand Reputation Management Clipart PDF for your upcoming presentation. All the presentation templates are 100 precent editable and you can change the color and personalize the content accordingly. Download now.
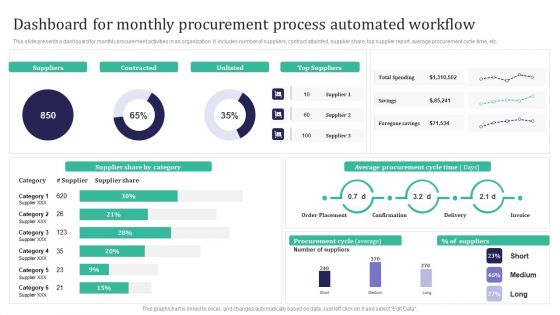
Integration Automation Dashboard For Monthly Procurement Process Automated Introduction PDF
This slide presents a dashboard for monthly procurement activities in an organization. It includes number of suppliers, contract attainted, supplier share, top supplier report, average procurement cycle time, etc. Slidegeeks is here to make your presentations a breeze with Integration Automation Dashboard For Monthly Procurement Process Automated Introduction PDF With our easy-to-use and customizable templates, you can focus on delivering your ideas rather than worrying about formatting. With a variety of designs to choose from, youre sure to find one that suits your needs. And with animations and unique photos, illustrations, and fonts, you can make your presentation pop. So whether youre giving a sales pitch or presenting to the board, make sure to check out Slidegeeks first.
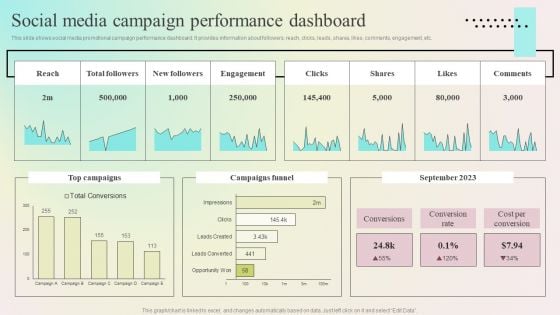
Enhancing Organic Reach Social Media Campaign Performance Dashboard Rules PDF
This slide shows social media promotional campaign performance dashboard. It provides information about followers, reach, clicks, leads, shares, likes, comments, engagement, etc. Formulating a presentation can take up a lot of effort and time, so the content and message should always be the primary focus. The visuals of the PowerPoint can enhance the presenters message, so our Enhancing Organic Reach Social Media Campaign Performance Dashboard Rules PDF was created to help save time. Instead of worrying about the design, the presenter can concentrate on the message while our designers work on creating the ideal templates for whatever situation is needed. Slidegeeks has experts for everything from amazing designs to valuable content, we have put everything into Enhancing Organic Reach Social Media Campaign Performance Dashboard Rules PDF
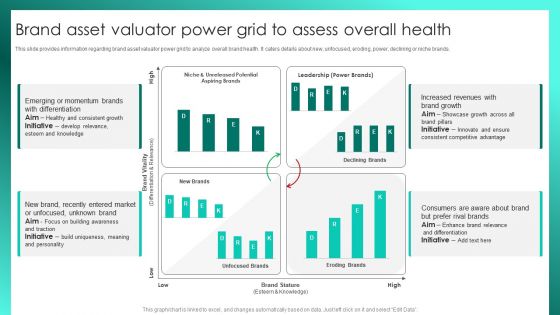
Successful Brand Management Brand Asset Valuator Power Grid To Assess Overall Health Template PDF
This slide provides information regarding brand asset valuator power grid to analyze overall brand health. It caters details about new, unfocused, eroding, power, declining or niche brands. Get a simple yet stunning designed Successful Brand Management Brand Asset Valuator Power Grid To Assess Overall Health Template PDF. It is the best one to establish the tone in your meetings. It is an excellent way to make your presentations highly effective. So, download this PPT today from Slidegeeks and see the positive impacts. Our easy-to-edit Successful Brand Management Brand Asset Valuator Power Grid To Assess Overall Health Template PDF can be your go-to option for all upcoming conferences and meetings. So, what are you waiting for Grab this template today.
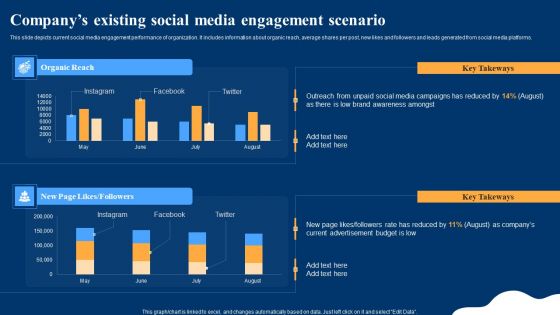
Optimizing Social Networks Companys Existing Social Media Engagement Scenario Structure PDF
This slide depicts current social media engagement performance of organization. It includes information about organic reach, average shares per post, new likes and followers and leads generated from social media platforms. Create an editable Optimizing Social Networks Companys Existing Social Media Engagement Scenario Structure PDF that communicates your idea and engages your audience. Whether youre presenting a business or an educational presentation, pre-designed presentation templates help save time. Optimizing Social Networks Companys Existing Social Media Engagement Scenario Structure PDF is highly customizable and very easy to edit, covering many different styles from creative to business presentations. Slidegeeks has creative team members who have crafted amazing templates. So, go and get them without any delay.
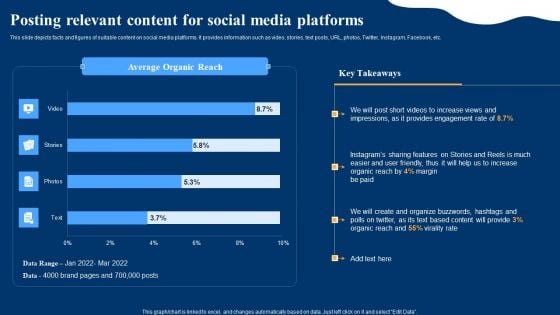
Optimizing Social Networks Posting Relevant Content For Social Media Platforms Information PDF
This slide depicts facts and figures of suitable content on social media platforms. It provides information such as video, stories, text posts, URL, photos, Twitter, Instagram, Facebook, etc. Crafting an eye-catching presentation has never been more straightforward. Let your presentation shine with this tasteful yet straightforward Optimizing Social Networks Posting Relevant Content For Social Media Platforms Information PDF template. It offers a minimalistic and classy look that is great for making a statement. The colors have been employed intelligently to add a bit of playfulness while still remaining professional. Construct the ideal Optimizing Social Networks Posting Relevant Content For Social Media Platforms Information PDF that effortlessly grabs the attention of your audience Begin now and be certain to wow your customers.
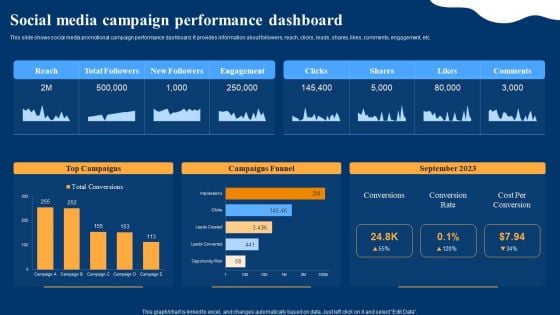
Optimizing Social Networks Social Media Campaign Performance Dashboard Guidelines PDF
This slide shows social media promotional campaign performance dashboard. It provides information about followers, reach, clicks, leads, shares, likes, comments, engagement, etc. Coming up with a presentation necessitates that the majority of the effort goes into the content and the message you intend to convey. The visuals of a PowerPoint presentation can only be effective if it supplements and supports the story that is being told. Keeping this in mind our experts created Optimizing Social Networks Social Media Campaign Performance Dashboard Guidelines PDF to reduce the time that goes into designing the presentation. This way, you can concentrate on the message while our designers take care of providing you with the right template for the situation.
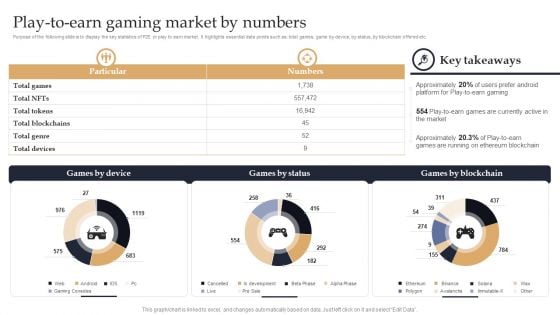
Web 3 0 Blockchain Based P2E Mobile Game Sector Report Promotional Plan Play To Earn Gaming Market By Numbers Summary PDF
Purpose of the following slide is to display the key statistics of P2E or play to earn market. It highlights essential data points such as total games, game by device, by status, by blockchain offered etc. Coming up with a presentation necessitates that the majority of the effort goes into the content and the message you intend to convey. The visuals of a PowerPoint presentation can only be effective if it supplements and supports the story that is being told. Keeping this in mind our experts created Web 3 0 Blockchain Based P2E Mobile Game Sector Report Promotional Plan Play To Earn Gaming Market By Numbers Summary PDF to reduce the time that goes into designing the presentation. This way, you can concentrate on the message while our designers take care of providing you with the right template for the situation.
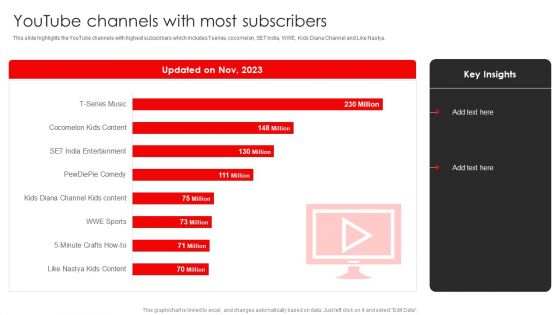
Procedure To Build Youtube Channel And Online Awareness Youtube Channels With Most Subscribers Rules PDF
This slide highlights the YouTube channels with highest subscribers which includes Tseries, cocomelon, SET India, WWE, Kids Diana Channel and Like Nastya. Whether you have daily or monthly meetings, a brilliant presentation is necessary. Procedure To Build Youtube Channel And Online Awareness Youtube Channels With Most Subscribers Rules PDFcan be your best option for delivering a presentation. Represent everything in detail using Procedure To Build Youtube Channel And Online Awareness Youtube Channels With Most Subscribers Rules PDF and make yourself stand out in meetings. The template is versatile and follows a structure that will cater to your requirements. All the templates prepared by Slidegeeks are easy to download and edit. Our research experts have taken care of the corporate themes as well. So, give it a try and see the results.
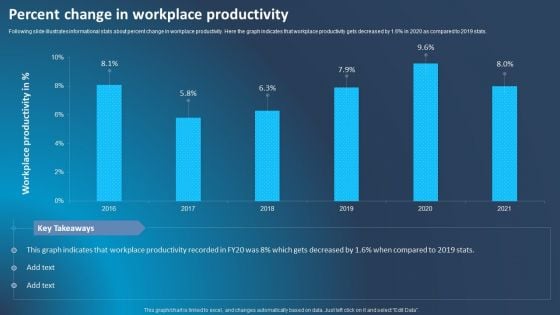
Improving Corporate Performance Percent Change In Workplace Productivity Inspiration PDF
Following slide illustrates informational stats about percent change in workplace productivity. Here the graph indicates that workplace productivity gets decreased by 1.6 percent in 2020 as compared to 2019 stats. Formulating a presentation can take up a lot of effort and time, so the content and message should always be the primary focus. The visuals of the PowerPoint can enhance the presenters message, so our Improving Corporate Performance Percent Change In Workplace Productivity Inspiration PDF was created to help save time. Instead of worrying about the design, the presenter can concentrate on the message while our designers work on creating the ideal templates for whatever situation is needed. Slidegeeks has experts for everything from amazing designs to valuable content, we have put everything into Improving Corporate Performance Percent Change In Workplace Productivity Inspiration PDF.
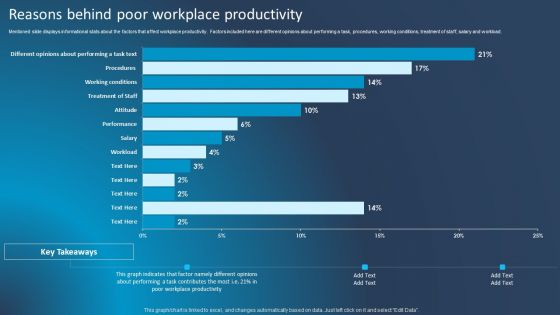
Improving Corporate Performance Reasons Behind Poor Workplace Productivity Designs PDF
Mentioned slide displays informational stats about the factors that affect workplace productivity. Factors included here are different opinions about performing a task, procedures, working conditions, treatment of staff, salary and workload. Coming up with a presentation necessitates that the majority of the effort goes into the content and the message you intend to convey. The visuals of a PowerPoint presentation can only be effective if it supplements and supports the story that is being told. Keeping this in mind our experts created Improving Corporate Performance Reasons Behind Poor Workplace Productivity Designs PDF to reduce the time that goes into designing the presentation. This way, you can concentrate on the message while our designers take care of providing you with the right template for the situation.

Executing Diversity Performance Measuring Dashboard For Executing Diversity And Inclusion Brochure PDF
This slide depicts the performance measuring dashboard for diversity and inclusion program providing information regarding the employee engagement, workforce by disability type, unconscious biases complaints etc. Crafting an eye-catching presentation has never been more straightforward. Let your presentation shine with this tasteful yet straightforward Executing Diversity Performance Measuring Dashboard For Executing Diversity And Inclusion Brochure PDF template. It offers a minimalistic and classy look that is great for making a statement. The colors have been employed intelligently to add a bit of playfulness while still remaining professional. Construct the ideal Executing Diversity Performance Measuring Dashboard For Executing Diversity And Inclusion Brochure PDF that effortlessly grabs the attention of your audience Begin now and be certain to wow your customers.
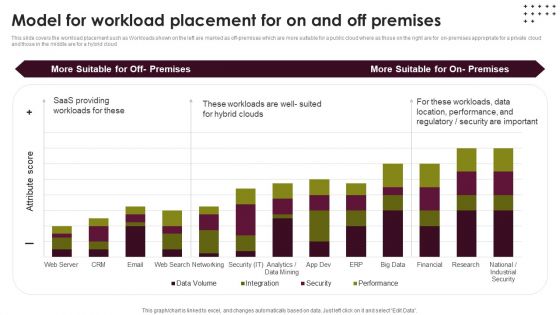
Cloud Computing Scalability Model For Workload Placement For On And Off Premises Elements PDF
This slide covers the workload placement such as Workloads shown on the left are marked as off-premises which are more suitable for a public cloud where as those on the right are for on-premises appropriate for a private cloud and those in the middle are for a hybrid cloud. Formulating a presentation can take up a lot of effort and time, so the content and message should always be the primary focus. The visuals of the PowerPoint can enhance the presenters message, so our Cloud Computing Scalability Model For Workload Placement For On And Off Premises Elements PDF was created to help save time. Instead of worrying about the design, the presenter can concentrate on the message while our designers work on creating the ideal templates for whatever situation is needed. Slidegeeks has experts for everything from amazing designs to valuable content, we have put everything into Cloud Computing Scalability Model For Workload Placement For On And Off Premises Elements PDF.
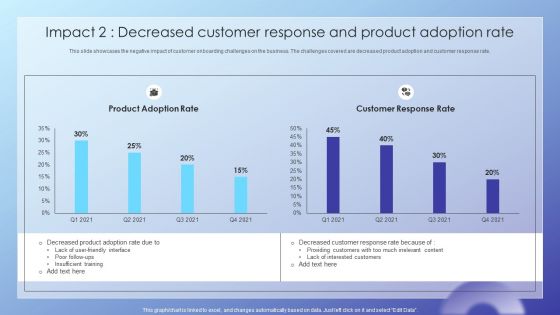
Client Acquisition Journey Plan Impact 2 Decreased Customer Response Topics PDF
This slide showcases the negative impact of customer onboarding challenges on the business. The challenges covered are decreased product adoption and customer response rate. Formulating a presentation can take up a lot of effort and time, so the content and message should always be the primary focus. The visuals of the PowerPoint can enhance the presenters message, so our Client Acquisition Journey Plan Impact 2 Decreased Customer Response Topics PDF was created to help save time. Instead of worrying about the design, the presenter can concentrate on the message while our designers work on creating the ideal templates for whatever situation is needed. Slidegeeks has experts for everything from amazing designs to valuable content, we have put everything into Client Acquisition Journey Plan Impact 2 Decreased Customer Response Topics PDF.
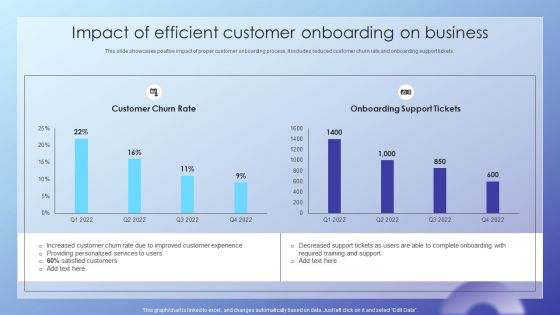
Client Acquisition Journey Plan Impact Of Efficient Customer Onboarding Template PDF
This slide showcases positive impact of proper customer onboarding process. It includes reduced customer churn rate and onboarding support tickets. Coming up with a presentation necessitates that the majority of the effort goes into the content and the message you intend to convey. The visuals of a PowerPoint presentation can only be effective if it supplements and supports the story that is being told. Keeping this in mind our experts created Client Acquisition Journey Plan Impact Of Efficient Customer Onboarding Template PDF to reduce the time that goes into designing the presentation. This way, you can concentrate on the message while our designers take care of providing you with the right template for the situation.

Customer Support Services Customer Service Performance Dashboard To Track Topics PDF
This slide showcases dashboard depicting customer service dashboard to track support tick resolution status. The dashboard includes ticket support requests, status, resolved and unresolved tickets, tickets by issue type, etc. Whether you have daily or monthly meetings, a brilliant presentation is necessary. Customer Support Services Customer Service Performance Dashboard To Track Topics PDF can be your best option for delivering a presentation. Represent everything in detail using Customer Support Services Customer Service Performance Dashboard To Track Topics PDF and make yourself stand out in meetings. The template is versatile and follows a structure that will cater to your requirements. All the templates prepared by Slidegeeks are easy to download and edit. Our research experts have taken care of the corporate themes as well. So, give it a try and see the results.
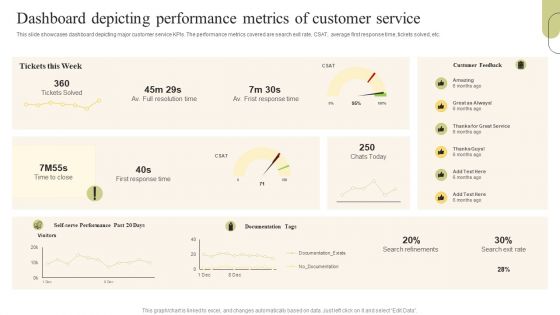
Customer Support Services Dashboard Depicting Performance Metrics Of Customer Designs PDF
This slide showcases dashboard depicting major customer service KPIs. The performance metrics covered are search exit rate, CSAT, average first response time, tickets solved, etc. Coming up with a presentation necessitates that the majority of the effort goes into the content and the message you intend to convey. The visuals of a PowerPoint presentation can only be effective if it supplements and supports the story that is being told. Keeping this in mind our experts created Customer Support Services Dashboard Depicting Performance Metrics Of Customer Designs PDF to reduce the time that goes into designing the presentation. This way, you can concentrate on the message while our designers take care of providing you with the right template for the situation.
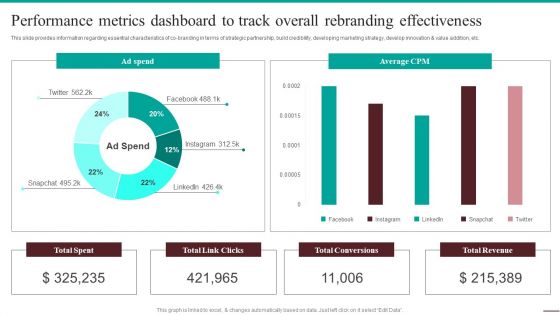
Guide For Systematic Performance Metrics Dashboard To Track Overall Rebranding Background PDF
This slide provides information regarding essential characteristics of co-branding in terms of strategic partnership, build credibility, developing marketing strategy, develop innovation and value addition, etc. Formulating a presentation can take up a lot of effort and time, so the content and message should always be the primary focus. The visuals of the PowerPoint can enhance the presenters message, so our Guide For Systematic Performance Metrics Dashboard To Track Overall Rebranding Background PDF was created to help save time. Instead of worrying about the design, the presenter can concentrate on the message while our designers work on creating the ideal templates for whatever situation is needed. Slidegeeks has experts for everything from amazing designs to valuable content, we have put everything into Guide For Systematic Performance Metrics Dashboard To Track Overall Rebranding Background PDF.
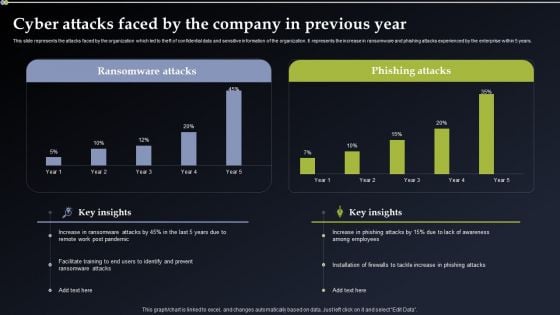
Deploying Cyber Security Incident Response Administration Cyber Attacks Faced By The Company Sample PDF
This slide represents the attacks faced by the organization which led to theft of confidential data and sensitive information of the organization. It represents the increase in ransomware and phishing attacks experienced by the enterprise within 5 years. Get a simple yet stunning designed Deploying Cyber Security Incident Response Administration Cyber Attacks Faced By The Company Sample PDF. It is the best one to establish the tone in your meetings. It is an excellent way to make your presentations highly effective. So, download this PPT today from Slidegeeks and see the positive impacts. Our easy to edit Deploying Cyber Security Incident Response Administration Cyber Attacks Faced By The Company Sample PDF can be your go to option for all upcoming conferences and meetings. So, what are you waiting for Grab this template today.
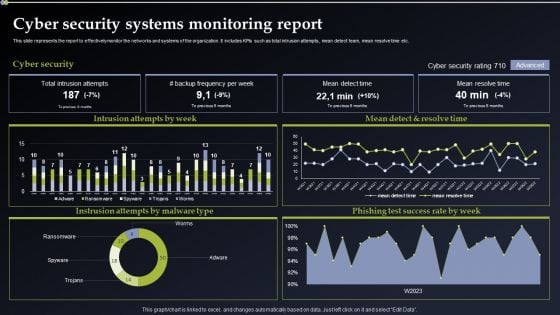
Deploying Cyber Security Incident Response Administration Cyber Security Systems Monitoring Report Microsoft PDF
This slide represents the report to effectively monitor the networks and systems of the organization. It includes KPIs such as total intrusion attempts, mean detect team, mean resolve time etc. Slidegeeks is here to make your presentations a breeze with Deploying Cyber Security Incident Response Administration Cyber Security Systems Monitoring Report Microsoft PDF With our easy to use and customizable templates, you can focus on delivering your ideas rather than worrying about formatting. With a variety of designs to choose from, you are sure to find one that suits your needs. And with animations and unique photos, illustrations, and fonts, you can make your presentation pop. So whether you are giving a sales pitch or presenting to the board, make sure to check out Slidegeeks first.
Deploying Cyber Security Incident Response Administration Enterprise Cyber Risk Management Dashboard Icons PDF
This slide represents the key metrics dashboard representing details related to management of cyber security incidents by an enterprise. It includes key performance indicators such as risk analysis progress, risk rating breakdown etc. Whether you have daily or monthly meetings, a brilliant presentation is necessary. Deploying Cyber Security Incident Response Administration Enterprise Cyber Risk Management Dashboard Icons PDF can be your best option for delivering a presentation. Represent everything in detail using Deploying Cyber Security Incident Response Administration Enterprise Cyber Risk Management Dashboard Icons PDF and make yourself stand out in meetings. The template is versatile and follows a structure that will cater to your requirements. All the templates prepared by Slidegeeks are easy to download and edit. Our research experts have taken care of the corporate themes as well. So, give it a try and see the results.

Optimizing Marketing Analytics To Enhance Organizational Growth Analyzing Organic Click Through Rates Elements PDF
This slide covers an overview of click through rate KPI to identify the percentage of visitors who click on your page after their search triggers an impression. It also includes optimizing strategies, using descriptive URLs, localizing content, and adding structured data. This Optimizing Marketing Analytics To Enhance Organizational Growth Analyzing Organic Click Through Rates Elements PDF from Slidegeeks makes it easy to present information on your topic with precision. It provides customization options, so you can make changes to the colors, design, graphics, or any other component to create a unique layout. It is also available for immediate download, so you can begin using it right away. Slidegeeks has done good research to ensure that you have everything you need to make your presentation stand out. Make a name out there for a brilliant performance.
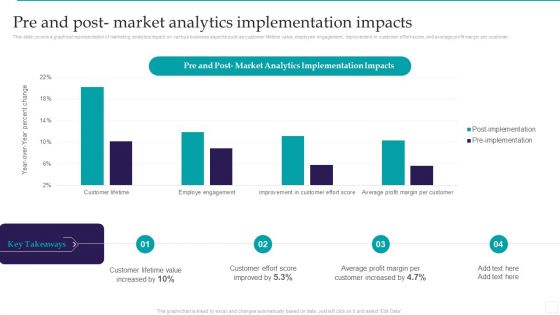
Optimizing Marketing Analytics To Enhance Organizational Growth Pre And Post Market Analytics Microsoft PDF
This slide covers a graphical representation of marketing analytics impact on various business aspects such as customer lifetime value, employee engagement, improvement in customer effort score, and average profit margin per customer. Get a simple yet stunning designed Optimizing Marketing Analytics To Enhance Organizational Growth Pre And Post Market Analytics Microsoft PDF. It is the best one to establish the tone in your meetings. It is an excellent way to make your presentations highly effective. So, download this PPT today from Slidegeeks and see the positive impacts. Our easy to edit Optimizing Marketing Analytics To Enhance Organizational Growth Pre And Post Market Analytics Microsoft PDF can be your go to option for all upcoming conferences and meetings. So, what are you waiting for Grab this template today.
Optimizing Marketing Analytics To Enhance Organizational Growth Tracking Social Media Engagement Rate Sample PDF
This slide covers an overview of the social media engagement rate to identify if the content is reaching the target audience. It also includes improvement strategies such as having a consistent, authentic voice, knowing your algorithms, and creating shareable content. Slidegeeks is here to make your presentations a breeze with Optimizing Marketing Analytics To Enhance Organizational Growth Tracking Social Media Engagement Rate Sample PDF With our easy to use and customizable templates, you can focus on delivering your ideas rather than worrying about formatting. With a variety of designs to choose from, you are sure to find one that suits your needs. And with animations and unique photos, illustrations, and fonts, you can make your presentation pop. So whether you are giving a sales pitch or presenting to the board, make sure to check out Slidegeeks first.
Optimizing Marketing Analytics To Enhance Organizational Growth Website Landing Page KPI Tracking Dashboard Graphics PDF
This slide covers a dashboard for analysing the metrics of the website landing page. It includes KPIs such as conversions, conversion rate, sessions, bounce rate, engagement sickness, etc. Do you have an important presentation coming up Are you looking for something that will make your presentation stand out from the rest Look no further than Optimizing Marketing Analytics To Enhance Organizational Growth Website Landing Page KPI Tracking Dashboard Graphics PDF. With our professional designs, you can trust that your presentation will pop and make delivering it a smooth process. And with Slidegeeks, you can trust that your presentation will be unique and memorable. So why wait Grab Optimizing Marketing Analytics To Enhance Organizational Growth Website Landing Page KPI Tracking Dashboard Graphics PDF today and make your presentation stand out from the rest.
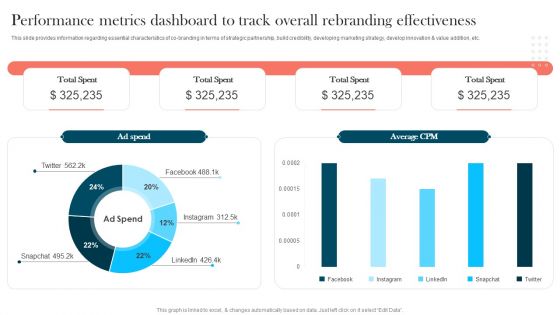
Strengthening Brand Performance Metrics Dashboard To Track Overall Rebranding Themes PDF
This slide provides information regarding essential characteristics of co-branding in terms of strategic partnership, build credibility, developing marketing strategy, develop innovation and value addition, etc. Coming up with a presentation necessitates that the majority of the effort goes into the content and the message you intend to convey. The visuals of a PowerPoint presentation can only be effective if it supplements and supports the story that is being told. Keeping this in mind our experts created Strengthening Brand Performance Metrics Dashboard To Track Overall Rebranding Themes PDF to reduce the time that goes into designing the presentation. This way, you can concentrate on the message while our designers take care of providing you with the right template for the situation.
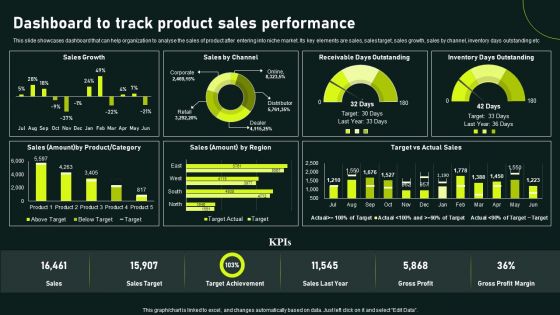
Dashboard To Track Product Sales Performance Gaining Competitive Advantage And Capturing Sample PDF
This slide showcases dashboard that can help organization to analyse the sales of product after entering into niche market. Its key elements are sales, sales target, sales growth, sales by channel, inventory days outstanding etc. Crafting an eye-catching presentation has never been more straightforward. Let your presentation shine with this tasteful yet straightforward Dashboard To Track Product Sales Performance Gaining Competitive Advantage And Capturing Sample PDF template. It offers a minimalistic and classy look that is great for making a statement. The colors have been employed intelligently to add a bit of playfulness while still remaining professional. Construct the ideal Dashboard To Track Product Sales Performance Gaining Competitive Advantage And Capturing Sample PDF that effortlessly grabs the attention of your audience Begin now and be certain to wow your customers.
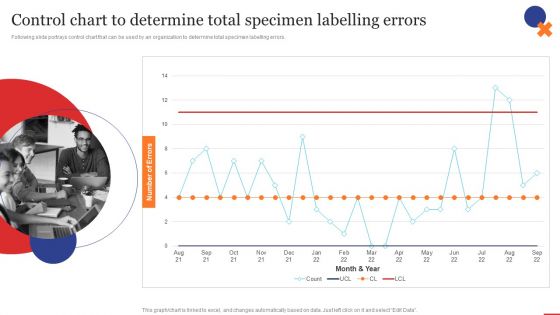
Control Chart To Determine Total Specimen Labelling Quality Control Planning Templates Set 1 Topics PDF
Following slide portrays control chart that can be used by an organization to determine total specimen labelling errors.Whether you have daily or monthly meetings, a brilliant presentation is necessary. Control Chart To Determine Total Specimen Labelling Quality Control Planning Templates Set 1 Topics PDF can be your best option for delivering a presentation. Represent everything in detail using Control Chart To Determine Total Specimen Labelling Quality Control Planning Templates Set 1 Topics PDF and make yourself stand out in meetings. The template is versatile and follows a structure that will cater to your requirements. All the templates prepared by Slidegeeks are easy to download and edit. Our research experts have taken care of the corporate themes as well. So, give it a try and see the results.
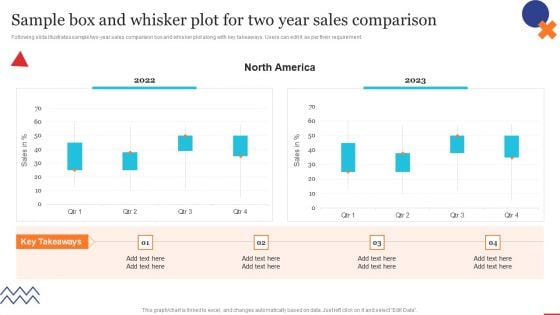
Sample Box And Whisker Plot For Two Year Quality Control Planning Templates Set 1 Download PDF
Following slide illustrates sample two-year sales comparison box and whisker plot along with key takeaways. Users can edit it as per their requirement.Find highly impressive Sample Box And Whisker Plot For Two Year Quality Control Planning Templates Set 1 Download PDF on Slidegeeks to deliver a meaningful presentation. You can save an ample amount of time using these presentation templates. No need to worry to prepare everything from scratch because Slidegeeks experts have already done a huge research and work for you. You need to download Sample Box And Whisker Plot For Two Year Quality Control Planning Templates Set 1 Download PDF for your upcoming presentation. All the presentation templates are 100precent editable and you can change the color and personalize the content accordingly. Download now,
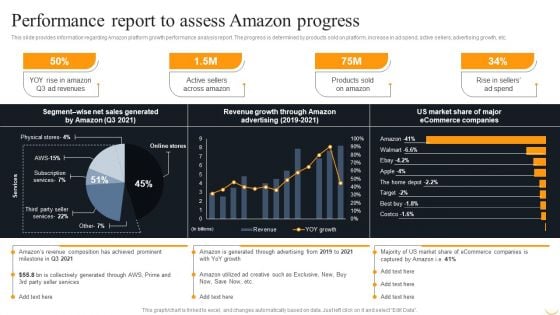
Amazon Business Strategies To Gain Competitive Advantage Performance Report Mockup PDF
This slide provides information regarding Amazon platform growth performance analysis report. The progress is determined by products sold on platform, increase in ad spend, active sellers, advertising growth, etc. Get a simple yet stunning designed Amazon Business Strategies To Gain Competitive Advantage Performance Report Mockup PDF. It is the best one to establish the tone in your meetings. It is an excellent way to make your presentations highly effective. So, download this PPT today from Slidegeeks and see the positive impacts. Our easy to edit Amazon Business Strategies To Gain Competitive Advantage Performance Report Mockup PDF can be your go to option for all upcoming conferences and meetings. So, what are you waiting for Grab this template today.
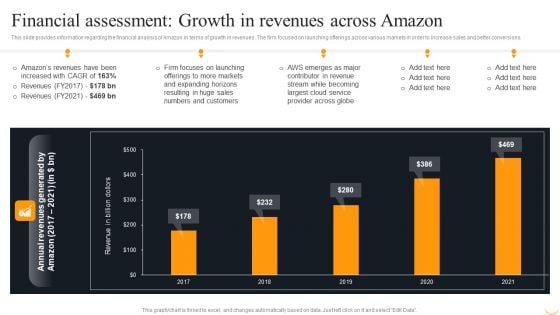
Financial Assessment Growth In Revenues Across Amazon Infographics PDF
This slide provides information regarding the financial analysis of Amazon in terms of growth in revenues. The firm focused on launching offerings across various markets in order to increase sales and better conversions. Slidegeeks is here to make your presentations a breeze with Financial Assessment Growth In Revenues Across Amazon Infographics PDF With our easy to use and customizable templates, you can focus on delivering your ideas rather than worrying about formatting. With a variety of designs to choose from, you are sure to find one that suits your needs. And with animations and unique photos, illustrations, and fonts, you can make your presentation pop. So whether you are giving a sales pitch or presenting to the board, make sure to check out Slidegeeks first.
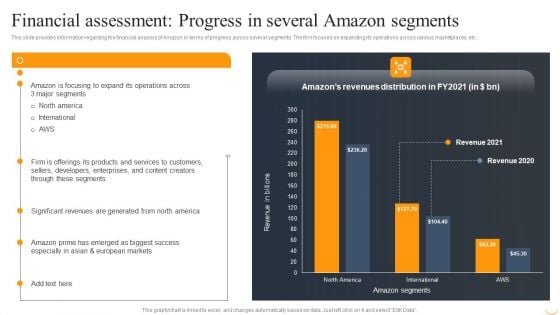
Financial Assessment Progress In Several Amazon Segments Summary PDF
This slide provides information regarding the financial analysis of Amazon in terms of progress across several segments. The firm focused on expanding its operations across various marketplaces, etc. Do you have an important presentation coming up Are you looking for something that will make your presentation stand out from the rest Look no further than Financial Assessment Progress In Several Amazon Segments Summary PDF. With our professional designs, you can trust that your presentation will pop and make delivering it a smooth process. And with Slidegeeks, you can trust that your presentation will be unique and memorable. So why wait Grab Financial Assessment Progress In Several Amazon Segments Summary PDF today and make your presentation stand out from the rest.
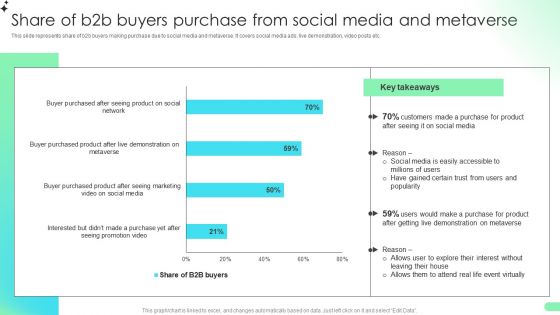
Share Of B2b Buyers Purchase From Social Media And Metaverse Comprehensive Guide For Developing Diagrams PDF
This slide represents social media marketing techniques that helps marketers to increase engagement rate and traffic on website. It covers comments, giveaways, images, heading optimization etc.Whether you have daily or monthly meetings, a brilliant presentation is necessary. Share Of B2b Buyers Purchase From Social Media And Metaverse Comprehensive Guide For Developing Diagrams PDF can be your best option for delivering a presentation. Represent everything in detail using Share Of B2b Buyers Purchase From Social Media And Metaverse Comprehensive Guide For Developing Diagrams PDF and make yourself stand out in meetings. The template is versatile and follows a structure that will cater to your requirements. All the templates prepared by Slidegeeks are easy to download and edit. Our research experts have taken care of the corporate themes as well. So, give it a try and see the results.
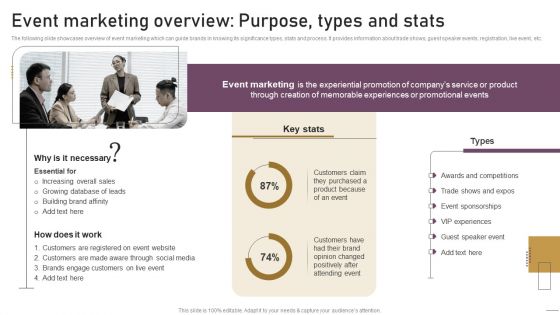
Implementing Experimental Marketing Event Marketing Overview Purpose Types And Stats Pictures PDF
The following slide showcases overview of event marketing which can guide brands in knowing its significance types, stats and process. It provides information about trade shows, guest speaker events, registration, live event, etc.Formulating a presentation can take up a lot of effort and time, so the content and message should always be the primary focus. The visuals of the PowerPoint can enhance the presenters message, so our Implementing Experimental Marketing Event Marketing Overview Purpose Types And Stats Pictures PDF was created to help save time. Instead of worrying about the design, the presenter can concentrate on the message while our designers work on creating the ideal templates for whatever situation is needed. Slidegeeks has experts for everything from amazing designs to valuable content, we have put everything into Implementing Experimental Marketing Event Marketing Overview Purpose Types And Stats Pictures PDF.
Consumers Buying Statistics While Engaging On Social Media Platforms Icons PDF
This slide includes various statistics related to customers action on social media. This include chances of customer engagement, website visit, buy decision and getting recommendations from customers. Get a simple yet stunning designed Consumers Buying Statistics While Engaging On Social Media Platforms Icons PDF. It is the best one to establish the tone in your meetings. It is an excellent way to make your presentations highly effective. So, download this PPT today from Slidegeeks and see the positive impacts. Our easy to edit Consumers Buying Statistics While Engaging On Social Media Platforms Icons PDF can be your go to option for all upcoming conferences and meetings. So, what are you waiting for. Grab this template today.


 Continue with Email

 Home
Home


