Budget
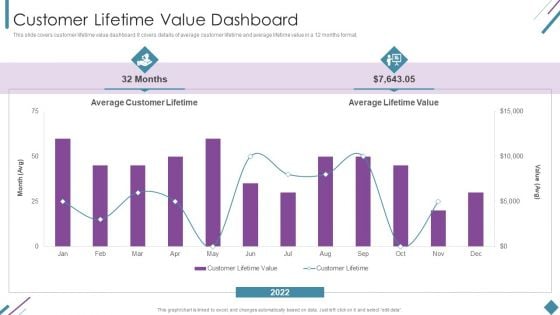
Metrics To Measure Business Performance Customer Lifetime Value Dashboard Slides PDF
This slide covers customer lifetime value dashboard. It covers details of average customer lifetime and average lifetime value in a 12 months format. Deliver and pitch your topic in the best possible manner with this Metrics To Measure Business Performance Customer Lifetime Value Dashboard Slides PDF. Use them to share invaluable insights on Average Customer Lifetime, Average Lifetime Value, 2022 and impress your audience. This template can be altered and modified as per your expectations. So, grab it now.
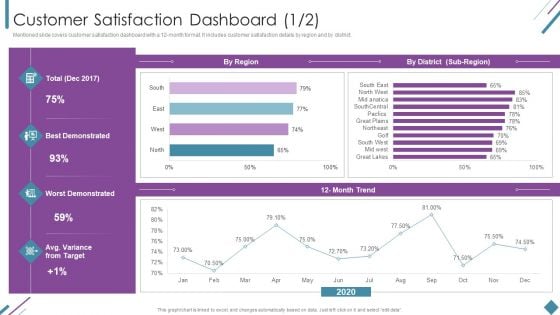
Metrics To Measure Business Performance Customer Satisfaction Dashboard Summary PDF
Mentioned slide covers customer satisfaction dashboard with a 12-month format. It includes customer satisfaction details by region and by district. Deliver an awe inspiring pitch with this creative Metrics To Measure Business Performance Customer Satisfaction Dashboard Summary PDF bundle. Topics like Best Demonstrated, Worst Demonstrated, 2020 can be discussed with this completely editable template. It is available for immediate download depending on the needs and requirements of the user.
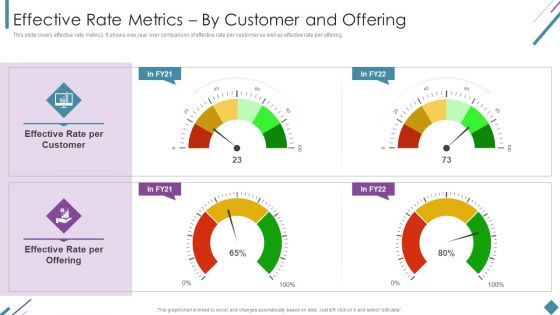
Metrics To Measure Business Performance Effective Rate Metrics By Customer And Offering Diagrams PDF
This slide covers effective rate metrics. It shows over year over comparison of effective rate per customer as well as effective rate per offering. Deliver and pitch your topic in the best possible manner with this Metrics To Measure Business Performance Effective Rate Metrics By Customer And Offering Diagrams PDF. Use them to share invaluable insights on Effective Rate, Per Customer, Per Offering and impress your audience. This template can be altered and modified as per your expectations. So, grab it now.
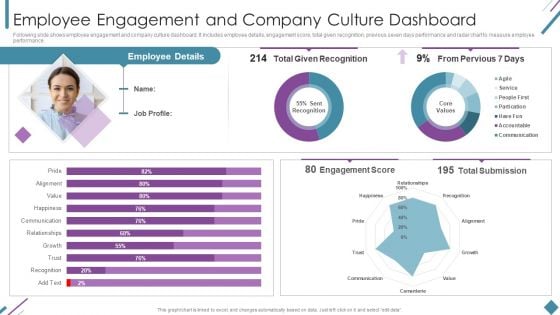
Metrics To Measure Business Performance Employee Engagement And Company Culture Demonstration PDF
Following slide shows employee engagement and company culture dashboard. It includes employee details, engagement score, total given recognition, previous seven days performance and radar chart to measure employee performance. Deliver and pitch your topic in the best possible manner with this Metrics To Measure Business Performance Employee Engagement And Company Culture Demonstration PDF. Use them to share invaluable insights on Employee Details, Total Given Recognition, Engagement Score and impress your audience. This template can be altered and modified as per your expectations. So, grab it now.
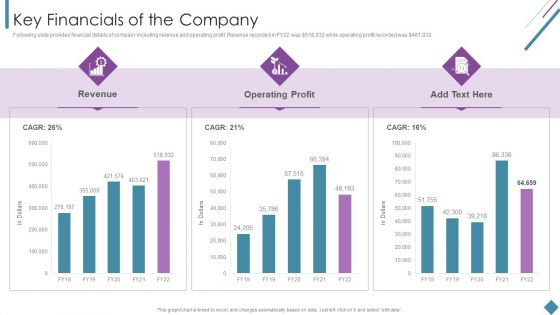
Metrics To Measure Business Performance Key Financials Of The Company Elements PDF
Following slide provides financial details of company including revenue and operating profit. Revenue recorded in FY22 was dollar 518,932 while operating profit recorded was dollar 481,932. Deliver an awe inspiring pitch with this creative Metrics To Measure Business Performance Key Financials Of The Company Elements PDF bundle. Topics like Revenue, Operating Profit can be discussed with this completely editable template. It is available for immediate download depending on the needs and requirements of the user.
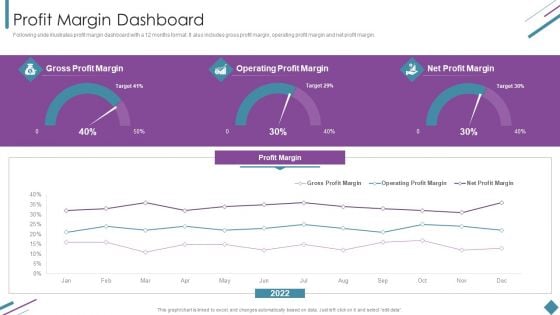
Metrics To Measure Business Performance Profit Margin Dashboard Designs PDF
Following slide illustrates profit margin dashboard with a 12 months format. It also includes gross profit margin, operating profit margin and net profit margin. Deliver and pitch your topic in the best possible manner with this Metrics To Measure Business Performance Profit Margin Dashboard Designs PDF. Use them to share invaluable insights on Gross Profit Margin, Operating Profit Margin, Net Profit Margin and impress your audience. This template can be altered and modified as per your expectations. So, grab it now.
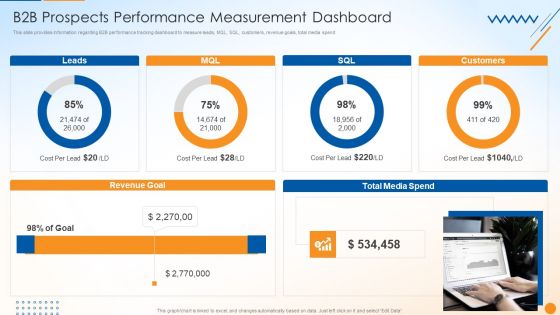
B2B Sales Techniques Playbook B2B Prospects Performance Measurement Dashboard Guidelines PDF
This slide provides information regarding B2B performance tracking dashboard to measure leads, MQL, SQL, customers, revenue goals, total media spend.Deliver an awe inspiring pitch with this creative B2B Sales Techniques Playbook B2B Prospects Performance Measurement Dashboard Guidelines PDF bundle. Topics like Revenue Goal, Total Media, Spend Customers can be discussed with this completely editable template. It is available for immediate download depending on the needs and requirements of the user.
B2B Sales Techniques Playbook B2B Sales Representatives Performance Tracking Dashboard Diagrams PDF
This slide provides information regarding B2B sales representatives performance tracking dashboard to measure leads by region, revenue breakdown, top performers by leads, revenues, etc. Deliver and pitch your topic in the best possible manner with this B2B Sales Techniques Playbook B2B Sales Representatives Performance Tracking Dashboard Diagrams PDF. Use them to share invaluable insights on Combine Sales, Individual Performance, Achieved Highest and impress your audience. This template can be altered and modified as per your expectations. So, grab it now.
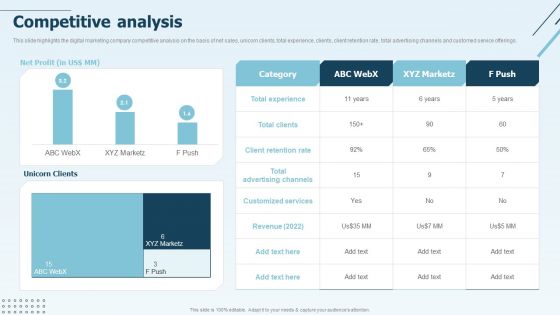
Digital Marketing Company Profile Competitive Analysis Summary PDF
This slide highlights the digital marketing company competitive analysis on the basis of net sales, unicorn clients, total experience, clients, client retention rate, total advertising channels and customed service offerings.Deliver an awe inspiring pitch with this creative Digital Marketing Company Profile Competitive Analysis Summary PDF bundle. Topics like Client Retention, Customized Services, Total Experience can be discussed with this completely editable template. It is available for immediate download depending on the needs and requirements of the user.
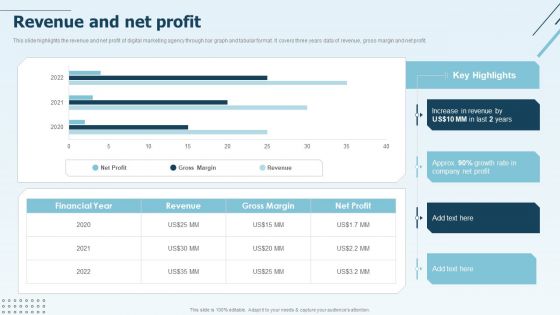
Digital Marketing Company Profile Revenue And Net Profit Download PDF
This slide highlights the revenue and net profit of digital marketing agency through bar graph and tabular format. It covers three years data of revenue, gross margin and net profit.Deliver an awe inspiring pitch with this creative Digital Marketing Company Profile Revenue And Net Profit Download PDF bundle. Topics like Increase Revenue, Gross Margin, Net Profit can be discussed with this completely editable template. It is available for immediate download depending on the needs and requirements of the user.
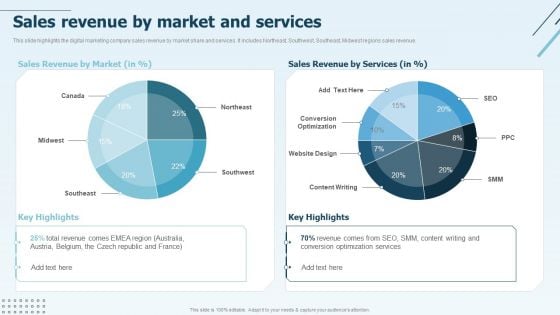
Digital Marketing Company Profile Sales Revenue By Market And Services Mockup PDF
This slide highlights the digital marketing company sales revenue by market share and services. It includes Northeast, Southwest, Southeast, Midwest regions sales revenue.Deliver and pitch your topic in the best possible manner with this Digital Marketing Company Profile Sales Revenue By Market And Services Mockup PDF. Use them to share invaluable insights on Conversion Optimization, Sales Revenue, Total Revenue and impress your audience. This template can be altered and modified as per your expectations. So, grab it now.
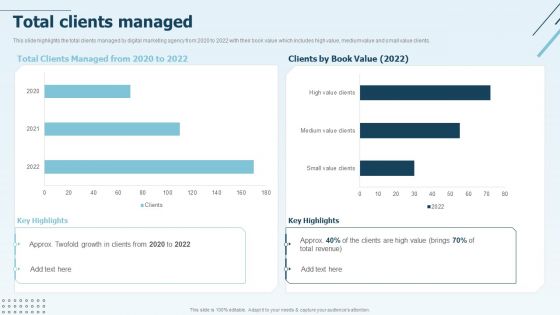
Digital Marketing Company Profile Total Clients Managed Formats PDF
This slide highlights the total clients managed by digital marketing agency from 2020 to 2022 with their book value which includes high value, medium value and small value clients. Deliver an awe inspiring pitch with this creative Digital Marketing Company Profile Total Clients Managed Formats PDF bundle. Topics like Clients Managed, Approx Twofold, Total Revenue can be discussed with this completely editable template. It is available for immediate download depending on the needs and requirements of the user.
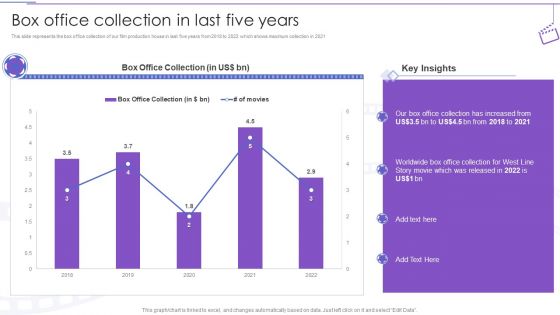
Film Making Company Outline Box Office Collection In Last Five Years Ppt PowerPoint Presentation Slides Clipart PDF
This slide represents the box office collection of our film production house in last five years from 2018 to 2022 which shows maximum collection in 2021.Deliver and pitch your topic in the best possible manner with this Film Making Company Outline Box Office Collection In Last Five Years Ppt PowerPoint Presentation Slides Clipart PDF. Use them to share invaluable insights on Office Collection, Worldwide Box, Released and impress your audience. This template can be altered and modified as per your expectations. So, grab it now.
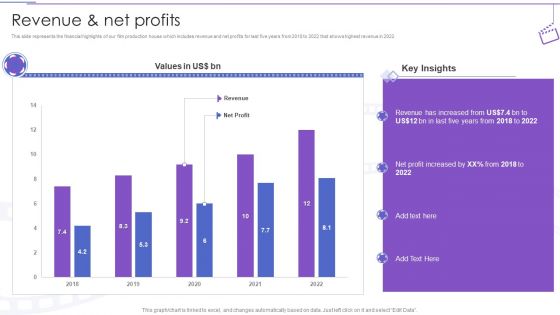
Film Making Company Outline Revenue And Net Profits Ppt PowerPoint Presentation Ideas Slide Portrait PDF
This slide represents the financial highlights of our film production house which includes revenue and net profits for last five years from 2018 to 2022 that shows highest revenue in 2022.Deliver an awe inspiring pitch with this creative Film Making Company Outline Revenue And Net Profits Ppt PowerPoint Presentation Ideas Slide Portrait PDF bundle. Topics like Revenue Increased, Five Years, Profit Increased can be discussed with this completely editable template. It is available for immediate download depending on the needs and requirements of the user.
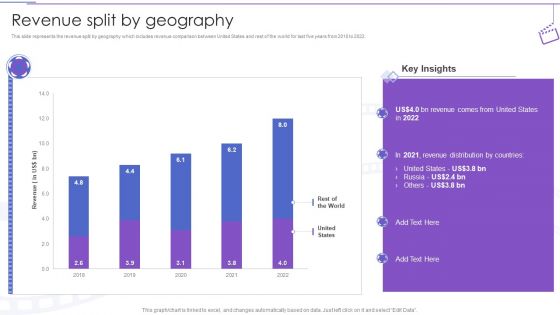
Film Making Company Outline Revenue Split By Geography Ppt PowerPoint Presentation Professional Graphic Images PDF
This slide represents the revenue split by geography which includes revenue comparison between United States and rest of the world for last five years from 2018 to 2022.Deliver and pitch your topic in the best possible manner with this Film Making Company Outline Revenue Split By Geography Ppt PowerPoint Presentation Professional Graphic Images PDF. Use them to share invaluable insights on United States, Revenue Distribution, Revenue Comes and impress your audience. This template can be altered and modified as per your expectations. So, grab it now.
Box Office Collection In Last Five Years Film Media Company Profile Ppt PowerPoint Presentation Icon Show PDF
This slide represents the box office collection of our film production house in last five years from 2018 to 2022 which shows maximum collection in 2021.Deliver and pitch your topic in the best possible manner with this Box Office Collection In Last Five Years Film Media Company Profile Ppt PowerPoint Presentation Icon Show PDF. Use them to share invaluable insights on Collection Increased, Released, Office Collection and impress your audience. This template can be altered and modified as per your expectations. So, grab it now.
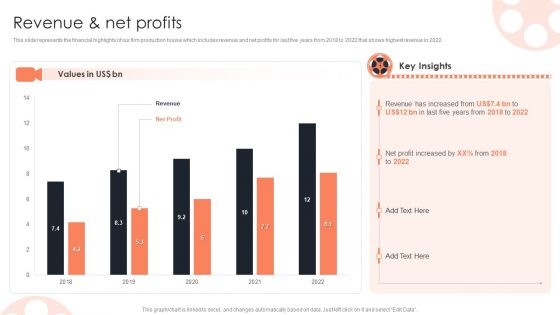
Revenue And Net Profits Film Media Company Profile Ppt PowerPoint Presentation Model Summary PDF
Deliver an awe inspiring pitch with this creative Revenue And Net Profits Film Media Company Profile Ppt PowerPoint Presentation Model Summary PDF bundle. Topics like Revenue Increased, Profit Increased, Values can be discussed with this completely editable template. It is available for immediate download depending on the needs and requirements of the user.
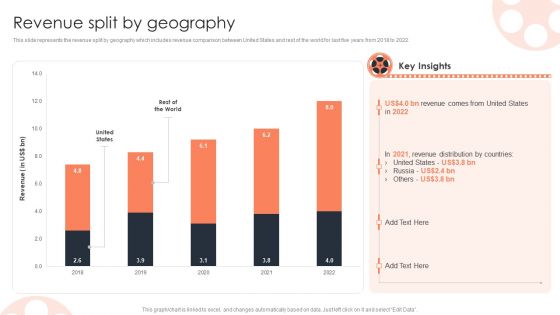
Revenue Split By Geography Film Media Company Profile Ppt PowerPoint Presentation Infographics Infographics PDF
This slide represents the financial highlights of our film production house which includes revenue and net profits for last five years from 2018 to 2022 that shows highest revenue in 2022.Deliver and pitch your topic in the best possible manner with this Revenue Split By Geography Film Media Company Profile Ppt PowerPoint Presentation Infographics Infographics PDF. Use them to share invaluable insights on United States, Revenue Distribution, Key Insights and impress your audience. This template can be altered and modified as per your expectations. So, grab it now.
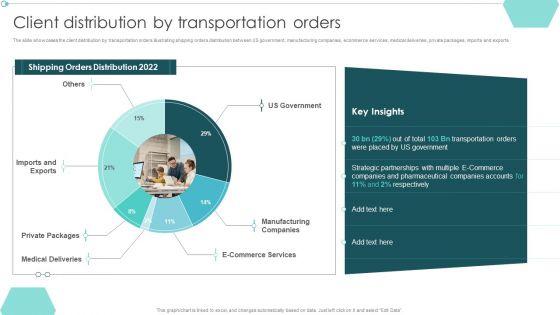
Transportation Company Profile Client Distribution By Transportation Orders Ppt PowerPoint Presentation Infographic Template Demonstration PDF
The slide showcases the client distribution by transportation orders illustrating shipping orders distribution between US government, manufacturing companies, ecommerce services, medical deliveries, private packages, imports and exports.Deliver an awe inspiring pitch with this creative Transportation Company Profile Client Distribution By Transportation Orders Ppt PowerPoint Presentation Infographic Template Demonstration PDF bundle. Topics like Manufacturing Companies, Private Packages, Medical Deliveries can be discussed with this completely editable template. It is available for immediate download depending on the needs and requirements of the user.
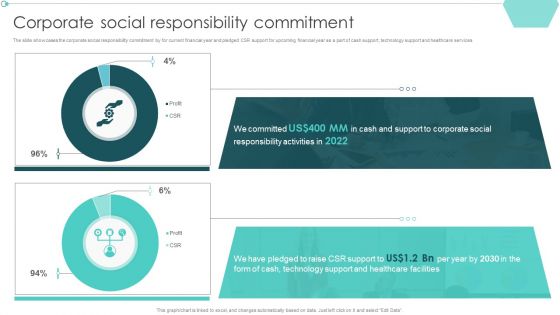
Transportation Company Profile Corporate Social Responsibility Commitment Ppt PowerPoint Presentation Model Master Slide PDF
The slide showcases the corporate social responsibility commitment by for current financial year and pledged CSR support for upcoming financial year as a part of cash support, technology support and healthcare services.Deliver an awe inspiring pitch with this creative Transportation Company Profile Corporate Social Responsibility Commitment Ppt PowerPoint Presentation Model Master Slide PDF bundle. Topics like Responsibility Activities, Pledged Raise, Technology Support can be discussed with this completely editable template. It is available for immediate download depending on the needs and requirements of the user.
Transportation Company Profile CSR Support For Sustainable Growth Ppt PowerPoint Presentation Icon Outfit PDF
The slide highlights the CSR support for society and spend distribution for current year. It depicts poverty support, quench hunger, health support, quality education, clean drinking water, gender equality, others, clean energy, global warming and clean ocean drive.Deliver and pitch your topic in the best possible manner with this Transportation Company Profile CSR Support For Sustainable Growth Ppt PowerPoint Presentation Icon Outfit PDF. Use them to share invaluable insights on Quench Hunger, Quality Education, Health Support and impress your audience. This template can be altered and modified as per your expectations. So, grab it now.
Transportation Company Profile Executive Summary Ppt PowerPoint Presentation Icon Show PDF
The slide showcases the executive summary to provide brief insights of company which includes company outline, leadership and key statistics depicting financials, operations and locations.Deliver an awe inspiring pitch with this creative Transportation Company Profile Executive Summary Ppt PowerPoint Presentation Icon Show PDF bundle. Topics like Delivered Locally, Delivered Internationally, Board Of Directors can be discussed with this completely editable template. It is available for immediate download depending on the needs and requirements of the user.
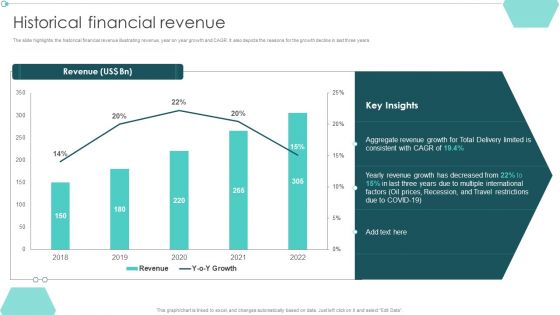
Transportation Company Profile Historical Financial Revenue Ppt PowerPoint Presentation File Layout PDF
The slide highlights the historical financial revenue illustrating revenue, year on year growth and CAGR. It also depicts the reasons for the growth decline in last three years.Deliver and pitch your topic in the best possible manner with this Transportation Company Profile Historical Financial Revenue Ppt PowerPoint Presentation File Layout PDF. Use them to share invaluable insights on Aggregate Revenue, Multiple International, Prices Recession and impress your audience. This template can be altered and modified as per your expectations. So, grab it now.
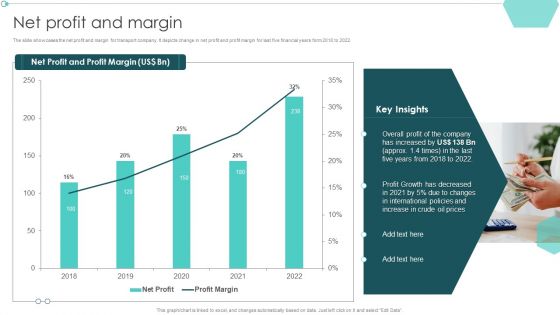
Transportation Company Profile Net Profit And Margin Ppt PowerPoint Presentation Summary Diagrams PDF
Deliver an awe inspiring pitch with this creative Transportation Company Profile Net Profit And Margin Ppt PowerPoint Presentation Summary Diagrams PDF bundle. Topics like Overall Profit, Increase In Crude, Profit Growth can be discussed with this completely editable template. It is available for immediate download depending on the needs and requirements of the user.
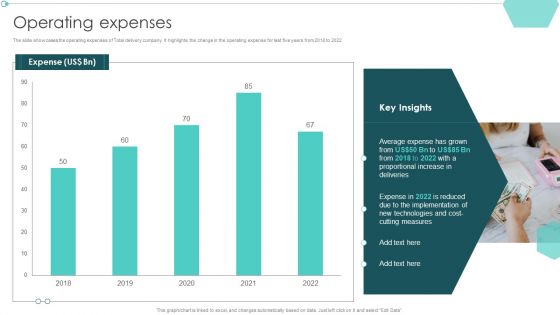
Transportation Company Profile Operating Expenses Ppt PowerPoint Presentation Portfolio Grid PDF
Deliver and pitch your topic in the best possible manner with this Transportation Company Profile Operating Expenses Ppt PowerPoint Presentation Portfolio Grid PDF. Use them to share invaluable insights on New Technologies, Cutting Measures, Proportional Increase and impress your audience. This template can be altered and modified as per your expectations. So, grab it now.
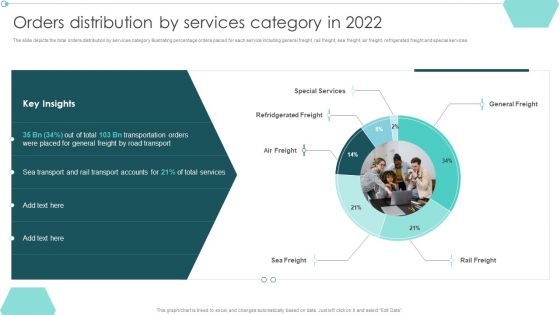
Transportation Company Profile Orders Distribution By Services Category In 2022 Ppt PowerPoint Presentation Slides Guidelines PDF
Deliver an awe inspiring pitch with this creative Transportation Company Profile Orders Distribution By Services Category In 2022 Ppt PowerPoint Presentation Slides Guidelines PDF bundle. Topics like Transportation Orders, Placed General, Transport Accounts can be discussed with this completely editable template. It is available for immediate download depending on the needs and requirements of the user.
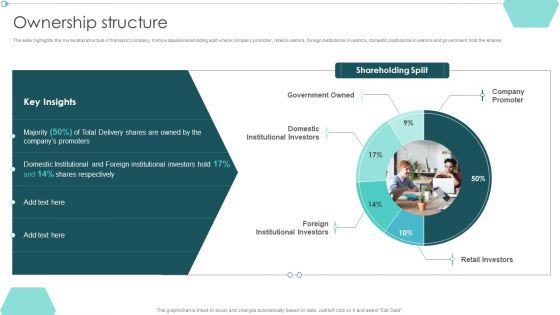
Transportation Company Profile Ownership Structure Ppt PowerPoint Presentation Show Introduction PDF
Deliver and pitch your topic in the best possible manner with this Transportation Company Profile Ownership Structure Ppt PowerPoint Presentation Show Introduction PDF. Use them to share invaluable insights on Domestic Institutional, Shares Respectively, Foreign Institutional and impress your audience. This template can be altered and modified as per your expectations. So, grab it now.
Strategy Playbook For Ecommerce Business Ecommerce Website Performance Tracking Dashboard Portrait PDF
This slide provides information regarding ecommerce website performance tracking dashboard addressing page views, website conversions, etc. Deliver an awe inspiring pitch with this creative Strategy Playbook For Ecommerce Business Ecommerce Website Performance Tracking Dashboard Portrait PDF bundle. Topics like Website Conversions, Website Performance, Website Overview can be discussed with this completely editable template. It is available for immediate download depending on the needs and requirements of the user.

Strategy Playbook For Ecommerce Business Statistics Associated With Global Ecommerce Growth Infographics PDF
This slide provides information regarding statistics associated to ecommerce growth in terms of expected ecommerce sales, ecommerce share of retails sales, number of global internet users preferring products online on monthly basis, etc. Deliver and pitch your topic in the best possible manner with this Strategy Playbook For Ecommerce Business Statistics Associated With Global Ecommerce Growth Infographics PDF. Use them to share invaluable insights on Global Ecommerce, People Preferring, Ecommerce Share and impress your audience. This template can be altered and modified as per your expectations. So, grab it now.
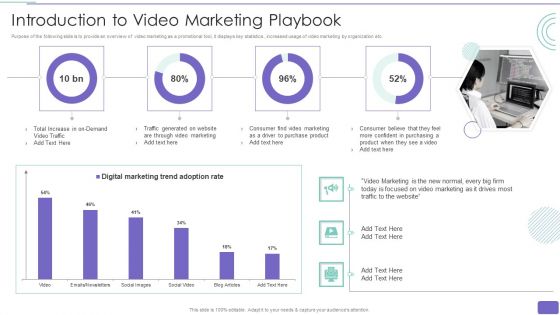
Youtube Advertising Strategy Playbook Introduction To Video Marketing Playbook Sample PDF
Purpose of the following slide is to provide an overview of video marketing as a promotional tool, it displays key statistics , increased usage of video marketing by organization etc. Deliver an awe inspiring pitch with this creative Youtube Advertising Strategy Playbook Introduction To Video Marketing Playbook Sample PDF bundle. Topics like Digital Marketing Trend, Adoption Rate, Social Media can be discussed with this completely editable template. It is available for immediate download depending on the needs and requirements of the user.
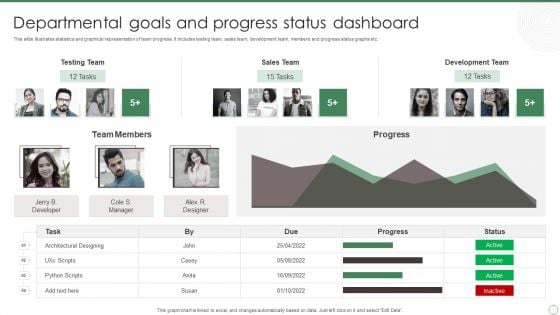
Departmental Goals And Progress Status Dashboard Ppt Portfolio Samples PDF
This slide illustrates statistics and graphical representation of team progress. It includes testing team, sales team, development team, members and progress status graphs etc. Pitch your topic with ease and precision using this Departmental Goals And Progress Status Dashboard Ppt Portfolio Samples PDF. This layout presents information on Testing Team, Sales Team, Development Team. It is also available for immediate download and adjustment. So, changes can be made in the color, design, graphics or any other component to create a unique layout.
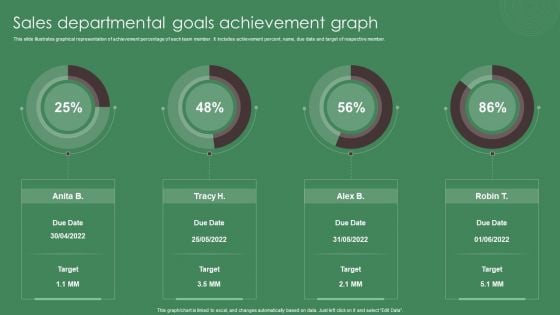
Sales Departmental Goals Achievement Graph Ppt Inspiration Slide Download PDF
This slide illustrates graphical representation of achievement percentage of each team member. It includes achievement percent, name, due date and target of respective member. Pitch your topic with ease and precision using this Sales Departmental Goals Achievement Graph Ppt Inspiration Slide Download PDF. This layout presents information on Sales Departmental, Goals, Achievement Graph. It is also available for immediate download and adjustment. So, changes can be made in the color, design, graphics or any other component to create a unique layout.
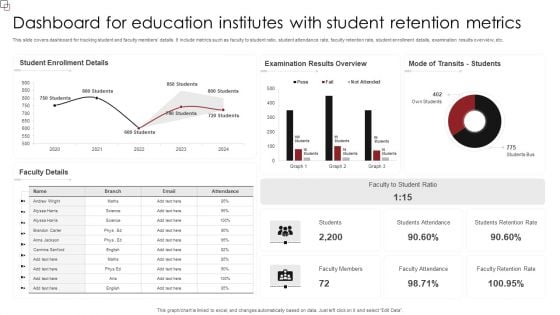
Dashboard For Education Institutes With Student Retention Metrics Slides PDF
This slide covers dashboard for tracking student and faculty members details. It include metrics such as faculty to student ratio, student attendance rate, faculty retention rate, student enrollment details, examination results overview, etc. Showcasing this set of slides titled Dashboard For Education Institutes With Student Retention Metrics Slides PDF. The topics addressed in these templates are Student Enrollment Details, Examination Results Overview, Faculty Student Ratio. All the content presented in this PPT design is completely editable. Download it and make adjustments in color, background, font etc. as per your unique business setting.
Education Dashboard For Tracking Gender Based Retention Metrics Template PDF
This slide illustrates student retention analysis dashboard. It include metrics based on gender, campus, ethnicity, and age group. Pitch your topic with ease and precision using this Education Dashboard For Tracking Gender Based Retention Metrics Template PDF. This layout presents information on Gender Based, Retention Rates, Age Group, Campus Wise. It is also available for immediate download and adjustment. So, changes can be made in the color, design, graphics or any other component to create a unique layout.
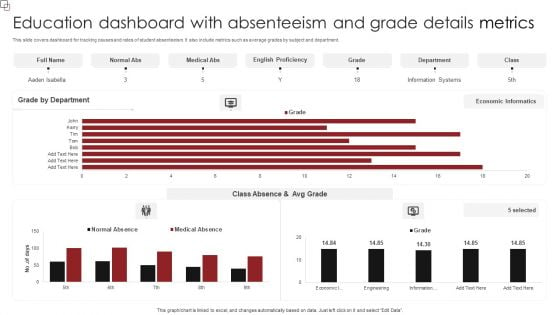
Education Dashboard With Absenteeism And Grade Details Metrics Diagrams PDF
This slide covers dashboard for tracking causes and rates of student absenteeism. It also include metrics such as average grades by subject and department. Pitch your topic with ease and precision using this Education Dashboard With Absenteeism And Grade Details Metrics Diagrams PDF. This layout presents information on Grade Department, English Proficiency, Medical Abs. It is also available for immediate download and adjustment. So, changes can be made in the color, design, graphics or any other component to create a unique layout.
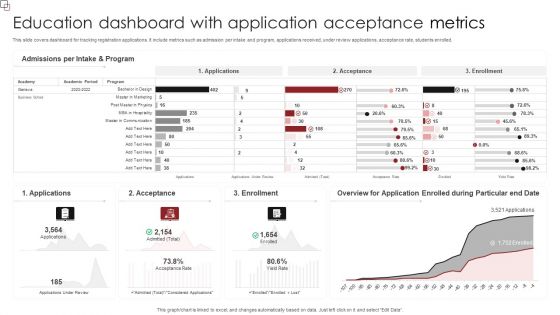
Education Dashboard With Application Acceptance Metrics Clipart PDF
This slide covers dashboard for tracking registration applications. It include metrics such as admission per intake and program, applications received, under review applications, acceptance rate, students enrolled. Showcasing this set of slides titled Education Dashboard With Application Acceptance Metrics Clipart PDF. The topics addressed in these templates are Admissions Per, Intake And Program, Enrollment. All the content presented in this PPT design is completely editable. Download it and make adjustments in color, background, font etc. as per your unique business setting.
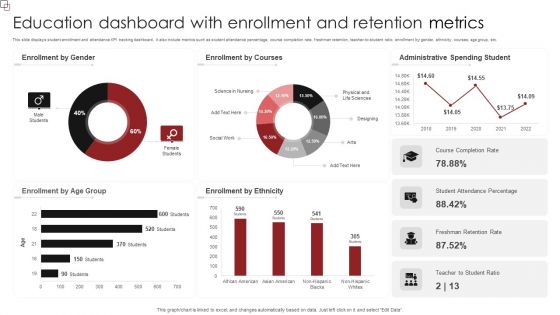
Education Dashboard With Enrollment And Retention Metrics Sample PDF
This slide displays student enrollment and attendance KPI tracking dashboard. It also include metrics such as student attendance percentage, course completion rate, freshman retention, teacher-to-student ratio, enrollment by gender, ethnicity, courses, age group, etc. Pitch your topic with ease and precision using this Education Dashboard With Enrollment And Retention Metrics Sample PDF. This layout presents information on Enrollment Gender, Enrollment Courses, Administrative Spending Student. It is also available for immediate download and adjustment. So, changes can be made in the color, design, graphics or any other component to create a unique layout.
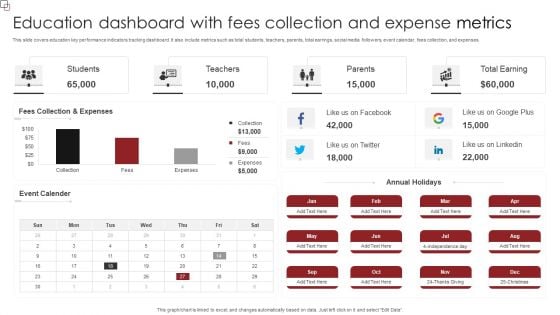
Education Dashboard With Fees Collection And Expense Metrics Demonstration PDF
This slide covers education key performance indicators tracking dashboard. It also include metrics such as total students, teachers, parents, total earrings, social media followers, event calendar, fees collection, and expenses. Showcasing this set of slides titled Education Dashboard With Fees Collection And Expense Metrics Demonstration PDF. The topics addressed in these templates are Event Calender, Annual Holidays, Fees Collection, Expenses. All the content presented in this PPT design is completely editable. Download it and make adjustments in color, background, font etc. as per your unique business setting.
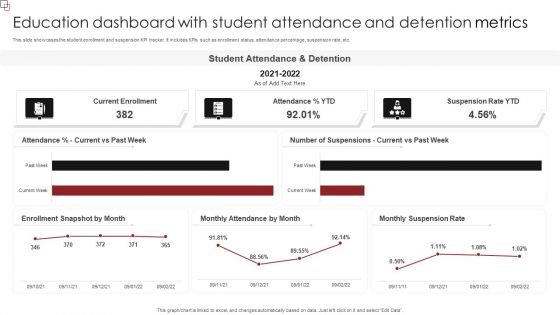
Education Dashboard With Student Attendance And Detention Metrics Inspiration PDF
This slide showcases the student enrollment and suspension KPI tracker. It includes KPIs such as enrollment status, attendance percentage, suspension rate, etc. Pitch your topic with ease and precision using this Education Dashboard With Student Attendance And Detention Metrics Inspiration PDF. This layout presents information on Student Attendance, Suspension Rate YTD, Current Enrollment. It is also available for immediate download and adjustment. So, changes can be made in the color, design, graphics or any other component to create a unique layout.
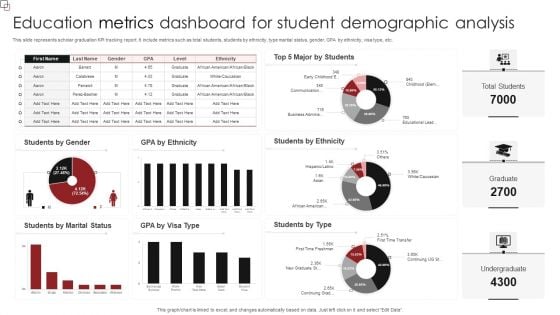
Education Metrics Dashboard For Student Demographic Analysis Diagrams PDF
This slide represents scholar graduation KPI tracking report. It include metrics such as total students, students by ethnicity, type marital status, gender, GPA by ethnicity, visa type, etc. Showcasing this set of slides titled Education Metrics Dashboard For Student Demographic Analysis Diagrams PDF. The topics addressed in these templates are Students Ethnicity, Students Type, Students Marital Status. All the content presented in this PPT design is completely editable. Download it and make adjustments in color, background, font etc. as per your unique business setting.
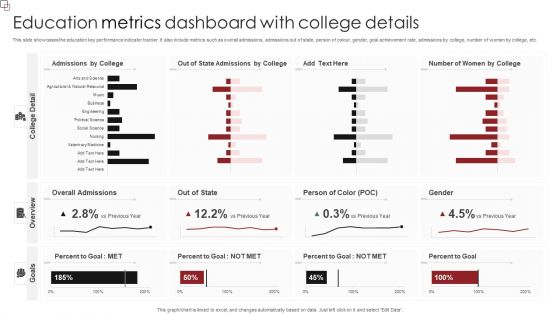
Education Metrics Dashboard With College Details Formats PDF
This slide showcases the education key performance indicator tracker. It also include metrics such as overall admissions, admissions out of state, person of colour, gender, goal achievement rate, admissions by college, number of women by college, etc. Pitch your topic with ease and precision using this Education Metrics Dashboard With College Details Formats PDF. This layout presents information on Overall Admissions, Person Of Color, Percent To Goal. It is also available for immediate download and adjustment. So, changes can be made in the color, design, graphics or any other component to create a unique layout.
Education Metrics Tracker For Students Performance Evaluation Professional PDF
This slide covers student performance analysis dashboard. It include metrics student count, student attendance, average subject score, branch examination results, student count by grade, etc. Showcasing this set of slides titled Education Metrics Tracker For Students Performance Evaluation Professional PDF. The topics addressed in these templates are Students Count, Grade And Gender, Students Details, Examination Results Branch. All the content presented in this PPT design is completely editable. Download it and make adjustments in color, background, font etc. as per your unique business setting.
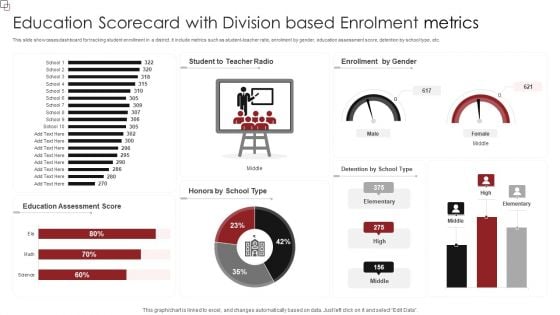
Education Scorecard With Division Based Enrolment Metrics Professional PDF
This slide showcases dashboard for tracking student enrollment in a district. It include metrics such as student-teacher ratio, enrolment by gender, education assessment score, detention by school type, etc. Pitch your topic with ease and precision using this Education Scorecard With Division Based Enrolment Metrics Professional PDF. This layout presents information on Education Assessment Score, Enrollment Gender. It is also available for immediate download and adjustment. So, changes can be made in the color, design, graphics or any other component to create a unique layout.
Training And Education Metrics Tracking Dashboard Guidelines PDF
This slide showcases dashboard for tracking training programs details. It include metrics such as training to invited percentage, unique trained, training man-days, total program names, etc. Pitch your topic with ease and precision using this Training And Education Metrics Tracking Dashboard Guidelines PDF. This layout presents information on Location Wise Training, Training Concerning Vertical, Tennessee. It is also available for immediate download and adjustment. So, changes can be made in the color, design, graphics or any other component to create a unique layout.
Education Metrics Dashboard For Tracking Student Ethnicity And Specially Abled Characteristics Brochure PDF
This slide covers the education key performance indicator tracker. It include metrics such as total applications, conversion rate, offers year to date, applications by ethnicity and disabilities, etc. Showcasing this set of slides titled Education Metrics Dashboard For Tracking Student Ethnicity And Specially Abled Characteristics Brochure PDF. The topics addressed in these templates are Total Applications, Conversion Rate 2022, Ethnicity. All the content presented in this PPT design is completely editable. Download it and make adjustments in color, background, font etc. as per your unique business setting.
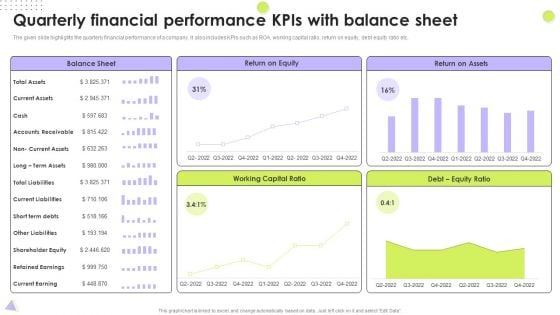
Quarterly Financial Performance Kpis With Balance Sheet Designs PDF
The given slide highlights the quarterly financial performance of a company. It also includes KPIs such as ROA, working capital ratio, return on equity, debt equity ratio etc. Pitch your topic with ease and precision using this Quarterly Financial Performance Kpis With Balance Sheet Designs PDF. This layout presents information on Total Liabilities, Return On Equity, Working Capital Ratio. It is also available for immediate download and adjustment. So, changes can be made in the color, design, graphics or any other component to create a unique layout.
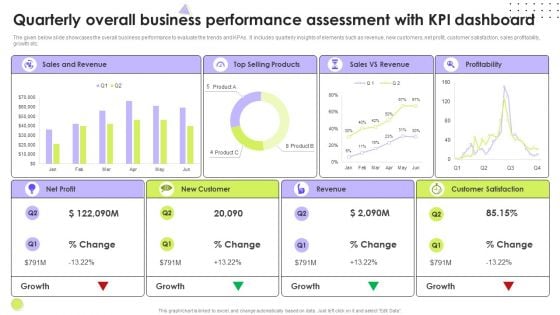
Quarterly Overall Business Performance Assessment With Kpi Dashboard Microsoft PDF
The given below slide showcases the overall business performance to evaluate the trends and KPAs. It includes quarterly insights of elements such as revenue, new customers, net profit, customer satisfaction, sales profitability, growth etc. Pitch your topic with ease and precision using this Quarterly Overall Business Performance Assessment With Kpi Dashboard Microsoft PDF. This layout presents information on Revenue, Customer Satisfaction, Net Profit. It is also available for immediate download and adjustment. So, changes can be made in the color, design, graphics or any other component to create a unique layout.
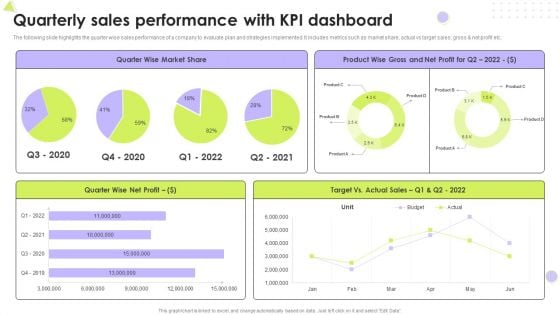
Quarterly Sales Performance With Kpi Dashboard Introduction PDF
The following slide highlights the quarter wise sales performance of a company to evaluate plan and strategies implemented. It includes metrics such as market share, actual vs target sales, gross and net profit etc. Pitch your topic with ease and precision using this Quarterly Sales Performance With Kpi Dashboard Introduction PDF. This layout presents information on Market Share, Net Profit, Target. It is also available for immediate download and adjustment. So, changes can be made in the color, design, graphics or any other component to create a unique layout.
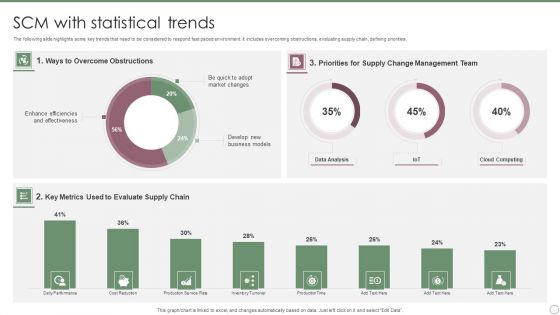
SCM With Statistical Trends Ppt PowerPoint Presentation Gallery Examples PDF
The following slide highlights some key trends that need to be considered to respond fast paced environment. It includes overcoming obstructions, evaluating supply chain, defining priorities. Pitch your topic with ease and precision using this SCM With Statistical Trends Ppt PowerPoint Presentation Gallery Examples PDF. This layout presents information on Ways To Overcome, Obstructions, Key Metrics, Evaluate Supply Chain. It is also available for immediate download and adjustment. So, changes can be made in the color, design, graphics or any other component to create a unique layout.
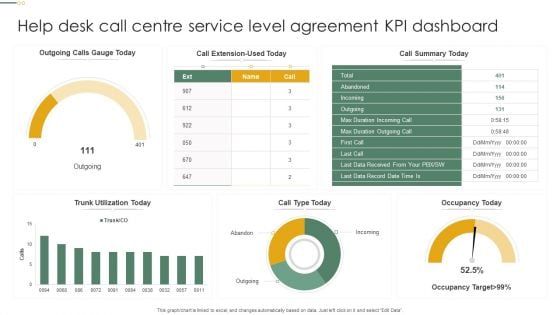
Help Desk Call Centre Service Level Agreement KPI Dashboard Pictures PDF
This graph or chart is linked to excel, and changes automatically based on data. Just left click on it and select Edit Data. Showcasing this set of slides titled Help Desk Call Centre Service Level Agreement KPI Dashboard Pictures PDF. The topics addressed in these templates are Call Type Today, Occupancy Today, Call Summary Today. All the content presented in this PPT design is completely editable. Download it and make adjustments in color, background, font etc. as per your unique business setting.
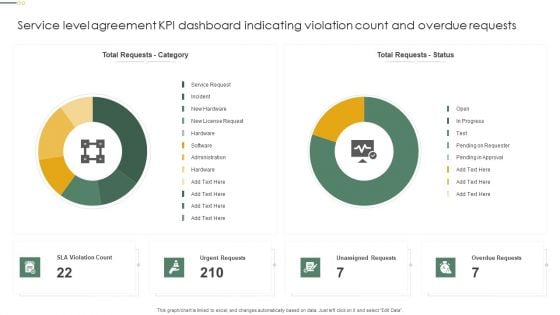
Service Level Agreement KPI Dashboard Indicating Violation Count And Overdue Requests Diagrams PDF
This graph or chart is linked to excel, and changes automatically based on data. Just left click on it and select Edit Data. Showcasing this set of slides titled Service Level Agreement KPI Dashboard Indicating Violation Count And Overdue Requests Diagrams PDF. The topics addressed in these templates are Total Requests Category, Total Requests Status, Urgent Requests. All the content presented in this PPT design is completely editable. Download it and make adjustments in color, background, font etc. as per your unique business setting.
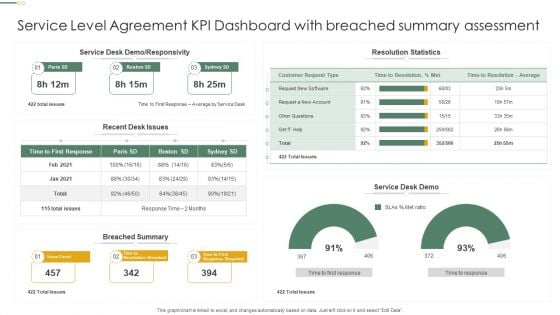
Service Level Agreement KPI Dashboard With Breached Summary Assessment Professional PDF
This graph or chart is linked to excel, and changes automatically based on data. Just left click on it and select Edit Data. Pitch your topic with ease and precision using this Service Level Agreement KPI Dashboard With Breached Summary Assessment Professional PDF. This layout presents information on Resolution Statistics, Service Desk Demo, Breached Summary. It is also available for immediate download and adjustment. So, changes can be made in the color, design, graphics or any other component to create a unique layout.
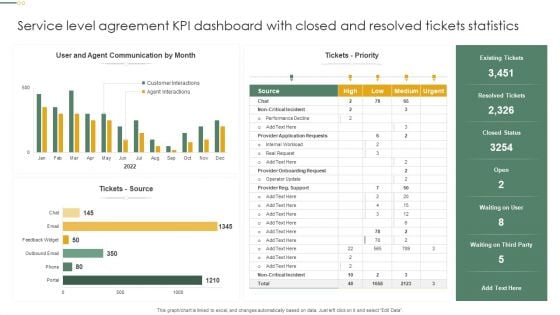
Service Level Agreement KPI Dashboard With Closed And Resolved Tickets Statistics Inspiration PDF
This graph or chart is linked to excel, and changes automatically based on data. Just left click on it and select Edit Data. Showcasing this set of slides titled Service Level Agreement KPI Dashboard With Closed And Resolved Tickets Statistics Inspiration PDF. The topics addressed in these templates are Tickets Priority, Tickets Source, Resolved Tickets. All the content presented in this PPT design is completely editable. Download it and make adjustments in color, background, font etc. as per your unique business setting.
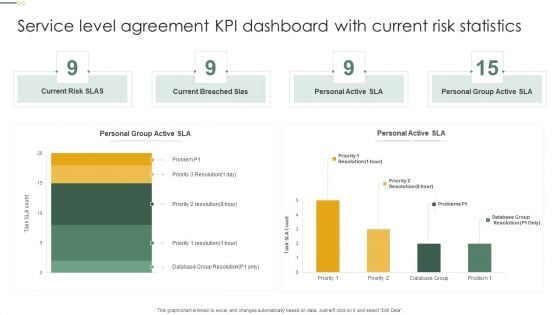
Service Level Agreement KPI Dashboard With Current Risk Statistics Topics PDF
This graph or chart is linked to excel, and changes automatically based on data. Just left click on it and select Edit Data. Pitch your topic with ease and precision using this Service Level Agreement KPI Dashboard With Current Risk Statistics Topics PDF. This layout presents information on Current Risk SLAS, Current Breached Slas, Personal Active SLA It is also available for immediate download and adjustment. So, changes can be made in the color, design, graphics or any other component to create a unique layout.
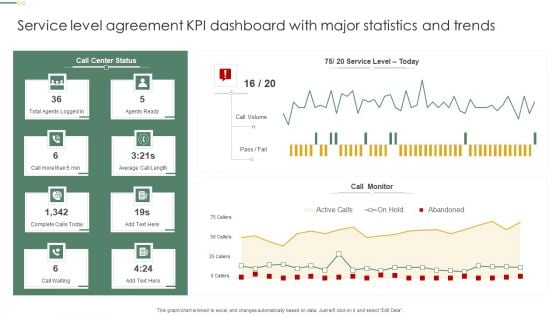
Service Level Agreement KPI Dashboard With Major Statistics And Trends Pictures PDF
This graph or chart is linked to excel, and changes automatically based on data. Just left click on it and select Edit Data. Pitch your topic with ease and precision using this Service Level Agreement KPI Dashboard With Major Statistics And Trends Pictures PDF. This layout presents information on Call Monitor, Call Volume, Agents Ready. It is also available for immediate download and adjustment. So, changes can be made in the color, design, graphics or any other component to create a unique layout.
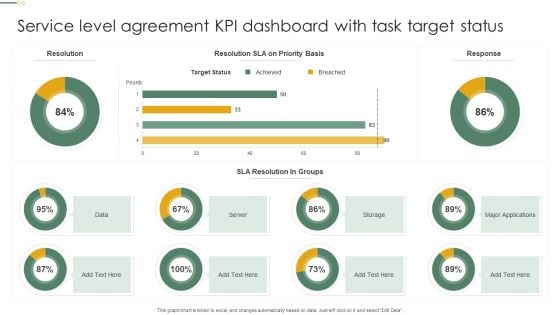
Service Level Agreement KPI Dashboard With Task Target Status Microsoft PDF
This graph or chart is linked to excel, and changes automatically based on data. Just left click on it and select Edit Data. Pitch your topic with ease and precision using this Service Level Agreement KPI Dashboard With Task Target Status Microsoft PDF. This layout presents information on Target Status, Sla Resolution, Groups, Server. It is also available for immediate download and adjustment. So, changes can be made in the color, design, graphics or any other component to create a unique layout.

Departmental Goals Ppt PowerPoint Presentation Complete Deck With Slides
Improve your presentation delivery using this Departmental Goals Ppt PowerPoint Presentation Complete Deck With Slides. Support your business vision and objectives using this well-structured PPT deck. This template offers a great starting point for delivering beautifully designed presentations on the topic of your choice. Comprising twelve slides this professionally designed template is all you need to host discussion and meetings with collaborators. Each slide is self-explanatory and equipped with high-quality graphics that can be adjusted to your needs. Therefore, you will face no difficulty in portraying your desired content using this PPT slideshow. This PowerPoint slideshow contains every important element that you need for a great pitch. It is not only editable but also available for immediate download and utilization. The color, font size, background, shapes everything can be modified to create your unique presentation layout. Therefore, download it now.
BPO Call Center Company Profile Gender Equality Index Icons PDF
This slide highlights the gender equality index of call center company which includes total women employed in overall workforce, management positions, board of directors and executive committee. Deliver an awe inspiring pitch with this creative BPO Call Center Company Profile Gender Equality Index Icons PDF bundle. Topics like Women Employees, Overall Workforce, Management Positions can be discussed with this completely editable template. It is available for immediate download depending on the needs and requirements of the user.
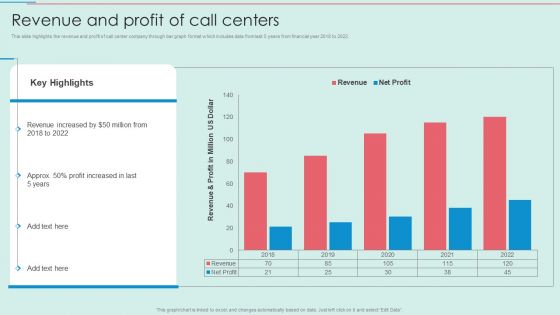
BPO Call Center Company Profile Revenue And Profit Of Call Centers Template PDF
This slide highlights the revenue and profit of call center company through bar graph format which includes data from last 5 years from financial year 2018 to 2022.Deliver and pitch your topic in the best possible manner with this BPO Call Center Company Profile Revenue And Profit Of Call Centers Template PDF. Use them to share invaluable insights on Revenue Increased, Profit Increased, Profit Million and impress your audience. This template can be altered and modified as per your expectations. So, grab it now.
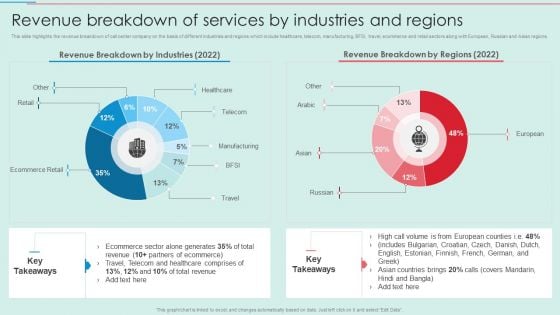
BPO Call Center Company Profile Revenue Breakdown Of Services By Industries And Regions Professional PDF
This slide highlights the revenue breakdown of call center company on the basis of different industries and regions which include healthcare, telecom, manufacturing, BFSI, travel, ecommerce and retail sectors along with European, Russian and Asian regions. Deliver an awe inspiring pitch with this creative BPO Call Center Company Profile Revenue Breakdown Of Services By Industries And Regions Professional PDF bundle. Topics like Ecommerce Retail, Ecommerce Generates, Healthcare Comprises can be discussed with this completely editable template. It is available for immediate download depending on the needs and requirements of the user.


 Continue with Email

 Home
Home


