Budget
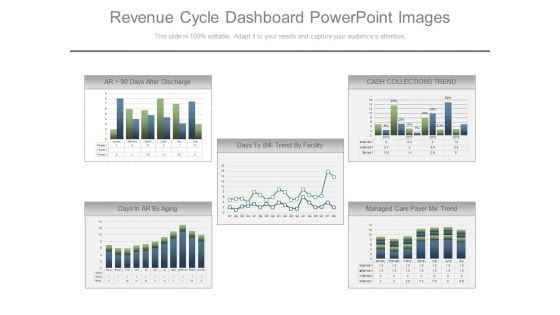
Revenue Cycle Dashboard Powerpoint Images
This is a revenue cycle dashboard powerpoint images. This is a five stage process. The stages in this process are days after discharge, cash collections trend, days to bill trend by facility, days in ar by aging, managed care payer mix trend.
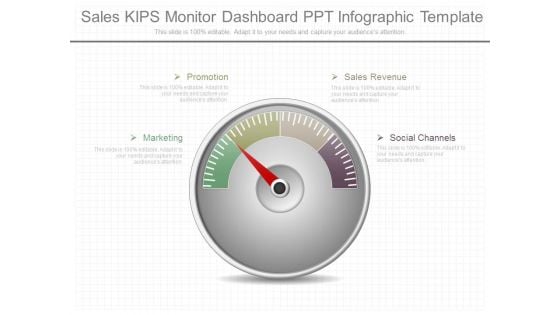
Sales Kips Monitor Dashboard Ppt Infographic Template
This is a sales kips monitor dashboard ppt infographic template. This is a four stage process. The stages in this process are promotion, marketing, sales revenue, social channels.
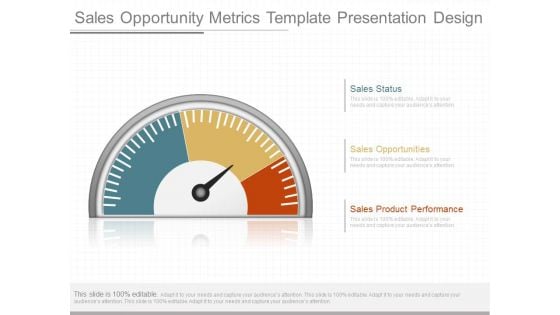
Sales Opportunity Metrics Template Presentation Design
This is a sales opportunity metrics template presentation design. This is a three stage process. The stages in this process are sales status, sales opportunities, sales product performance.
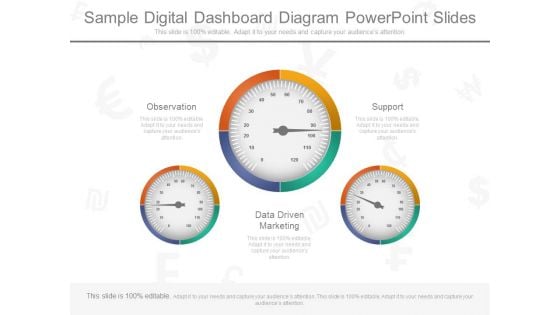
Sample Digital Dashboard Diagram Powerpoint Slides
This is a sample digital dashboard diagram powerpoint slides. This is a three stage process. The stages in this process are observation, support , data driven marketing.
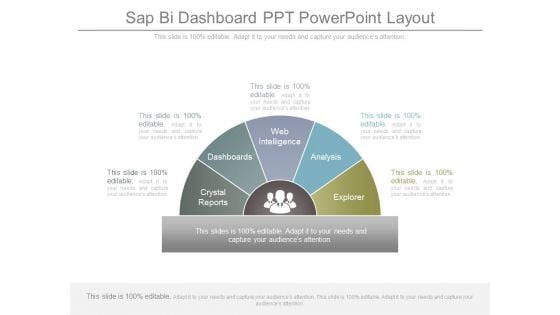
Sap Bi Dashboard Ppt Powerpoint Layout
This is a sap bi dashboard ppt powerpoint layout. This is a five stage process. The stages in this process are crystal reports, dashboards, web intelligence, analysis, explorer.
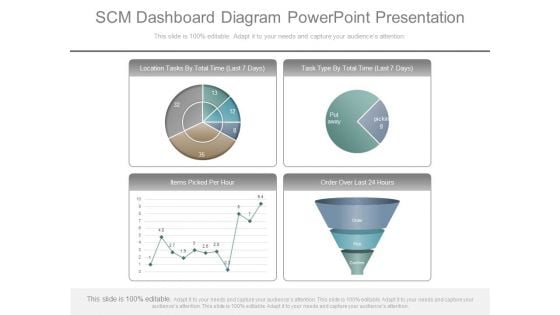
Scm Dashboard Diagram Powerpoint Presentation
This is a scm dashboard diagram powerpoint presentation. This is a four stage process. The stages in this process are location tasks by total time, task type by total time, items picked per hour, order over last.
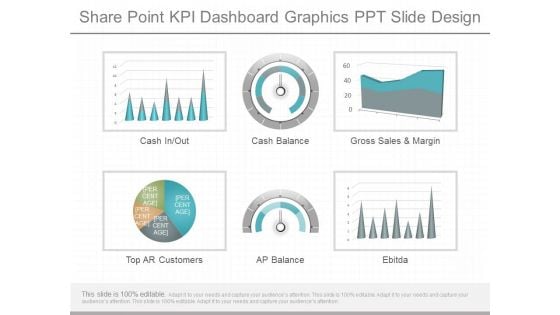
Share Point Kpi Dashboard Graphics Ppt Slide Design
This is a share point kpi dashboard graphics ppt slide design. This is a six stage process. The stages in this process are cash in out, cash balance, gross sales and margin, top ar customers, ap balance, ebitda.
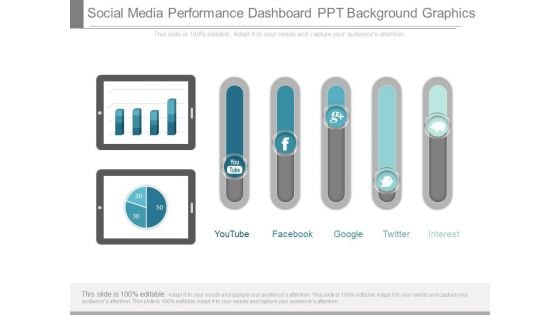
Social Media Performance Dashboard Ppt Background Graphics
This is a social media performance dashboard ppt background graphics. This is a seven stage process. The stages in this process are youtube, facebook, google, twitter, pinterest.
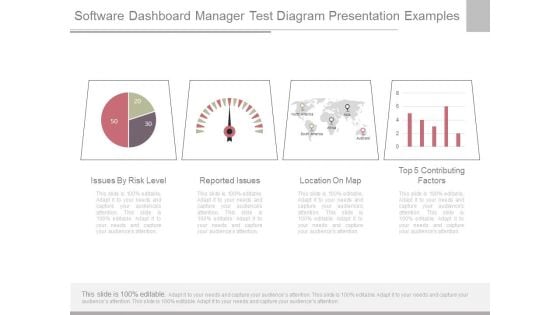
Software Dashboard Manager Test Diagram Presentation Examples
This is a software dashboard manager test diagram presentation examples. This is a four stage process. The stages in this process are issues by risk level, reported issues, location on map, top contributing factors.
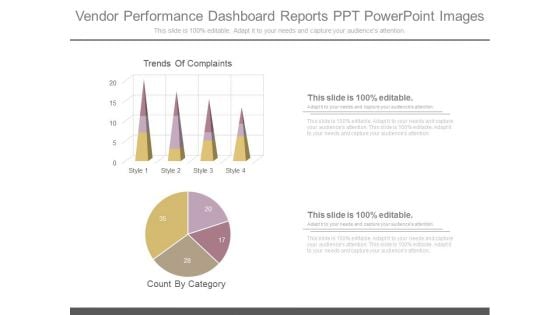
Vendor Performance Dashboard Reports Ppt Powerpoint Images
This is a vendor performance dashboard reports ppt powerpoint images. This is a two stage process. The stages in this process are trends of complaints, count by category.
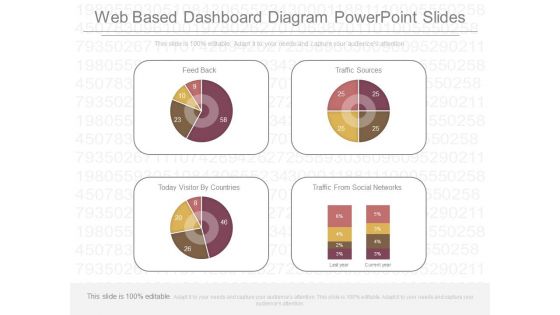
Web Based Dashboard Diagram Powerpoint Slides
This is a web based dashboard diagram powerpoint slides. This is a four stage process. The stages in this process are feed back, traffic sources, today visitor by countries, traffic from social networks.
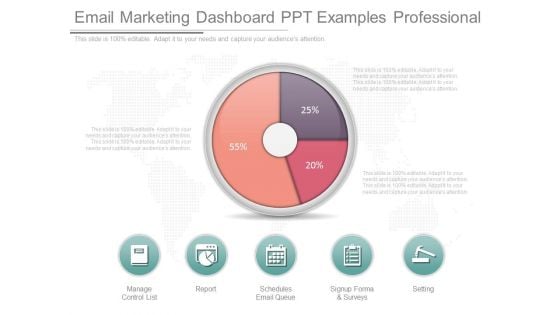
Email Marketing Dashboard Ppt Examples Professional
This is a email marketing dashboard ppt examples professional. This is a three stage process. The stages in this process are manage control list, report, schedules email queue, signup forma and surveys, setting.
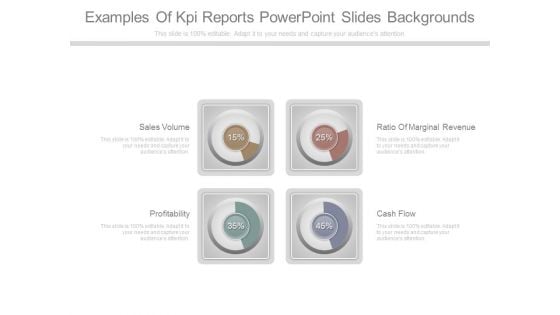
Examples Of Kpi Reports Powerpoint Slides Backgrounds
This is a examples of kpi reports powerpoint slides backgrounds. This is a four stage process. The stages in this process are sales volume, profitability, ratio of marginal revenue, cash flow.
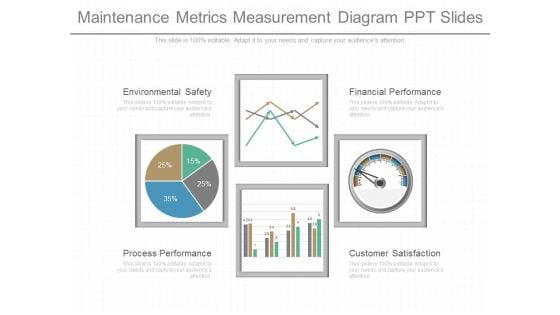
Maintenance Metrics Measurement Diagram Ppt Slides
This is a maintenance metrics measurement diagram ppt slides. This is a four stage process. The stages in this process are environmental safety, process performance, financial performance, customer satisfaction.
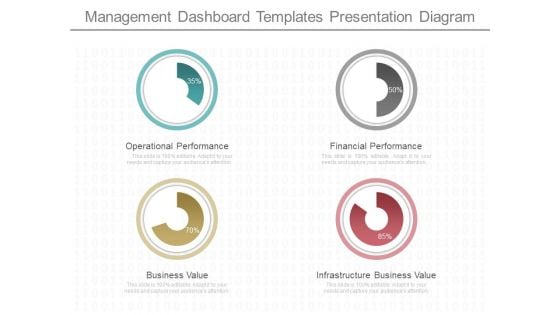
Management Dashboard Templates Presentation Diagram
This is a management dashboard templates presentation diagram. This is a four stage process. The stages in this process are operational performance, business value, financial performance, infrastructure business value.
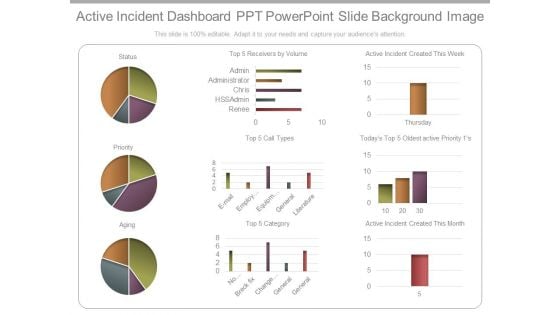
Active Incident Dashboard Ppt Powerpoint Slide Background Image
This is a active incident dashboard ppt powerpoint slide background image. This is a three stage process. The stages in this process are status, priority, aging, receivers by volume, renee, hssadmin, chris, administrator, admin, category, email, employee setup, equipment, general, literature, no category, breck fix, change management, general, active incident created this week, oldest active priority, active incident created this month, thursday.
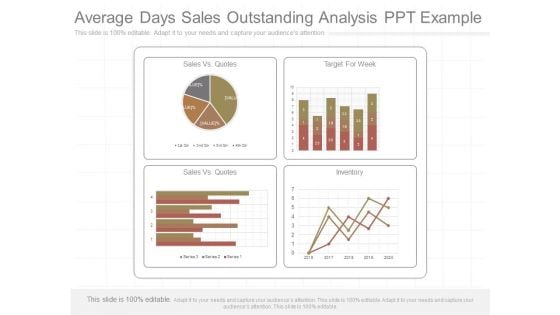
Average Days Sales Outstanding Analysis Ppt Example
This is a average days sales outstanding analysis ppt example. This is a four stage process. The stages in this process are target for week, inventory, sales vs quotes, sales vs quotes.
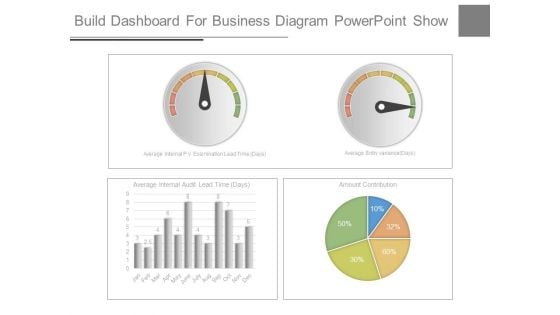
Build Dashboard For Business Diagram Powerpoint Show
This is a build dashboard for business diagram powerpoint show. This is a four stage process. The stages in this process are average internal pv examination lead time, average entry variance, average internal audit lead time, amount contribution.
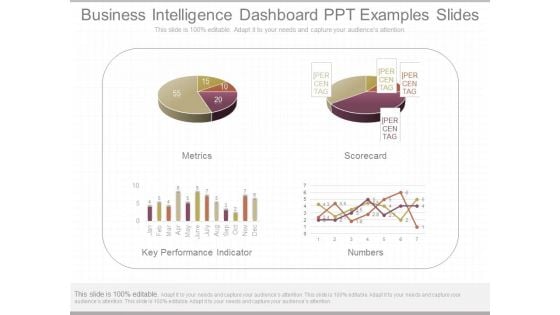
Business Intelligence Dashboard Ppt Examples Slides
This is a business intelligence dashboard ppt examples slides. This is a four stage process. The stages in this process are metrics, scorecard, key performance indicator, numbers.
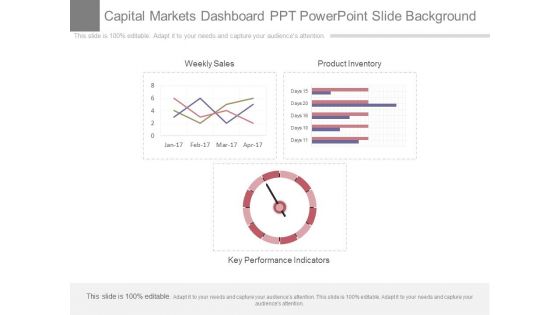
Capital Markets Dashboard Ppt Powerpoint Slide Background
This is a capital markets dashboard ppt powerpoint slide background. This is a three stage process. The stages in this process are weekly sales, product inventory, key performance indicators.
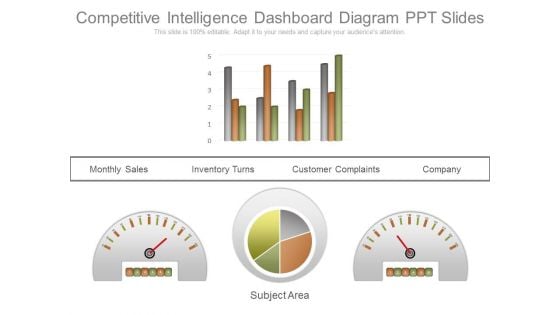
Competitive Intelligence Dashboard Diagram Ppt Slides
This is a competitive intelligence dashboard diagram ppt slides. This is a four stage process. The stages in this process are monthly sales, inventory turns, customer complaints, company, subject area.
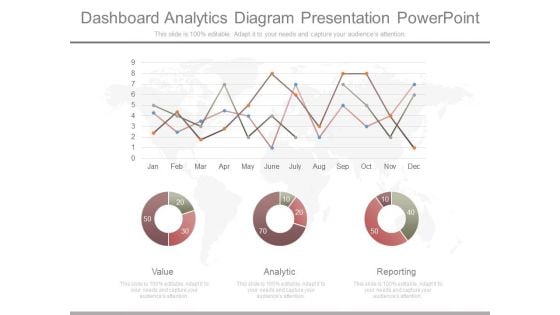
Dashboard Analytics Diagram Presentation Powerpoint
This is a dashboard analytics diagram presentation powerpoint. This is a three stage process. The stages in this process are value, analytic, reporting.
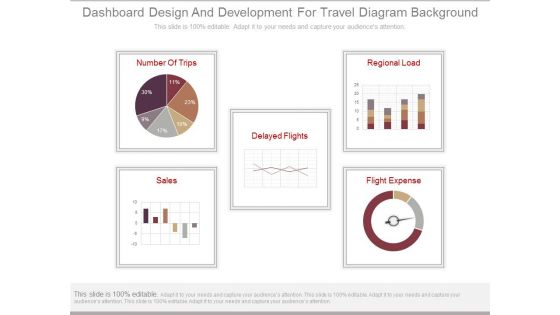
Dashboard Design And Development For Travel Diagram Background
This is a dashboard design and development for travel diagram background. This is a five stage process. The stages in this process are number of trips, sales, delayed flights, regional load, flight expense.
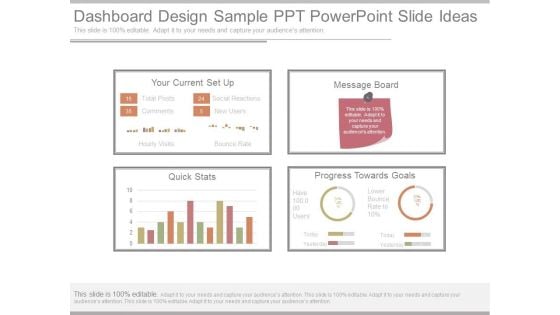
Dashboard Design Sample Ppt Powerpoint Slide Ideas
This is a dashboard design sample ppt powerpoint slide ideas. This is a four stage process. The stages in this process are your current setup, message board, quick stats, progress towards goals, total posts, comments, social reactions, new users, hourly visits, bounce rate.

Dashboard Report Ppt Powerpoint Ideas
This is a dashboard report ppt powerpoint ideas. This is a six stage process. The stages in this process are sales vs quotes, target for week, the sales, inventory, revenue.
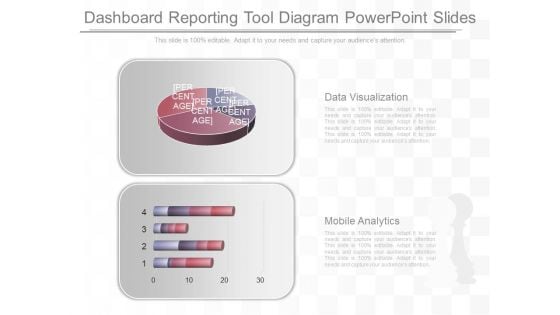
Dashboard Reporting Tool Diagram Powerpoint Slides
This is a dashboard reporting tool diagram powerpoint slides. This is a two stage process. The stages in this process are data visualization, mobile analytics.
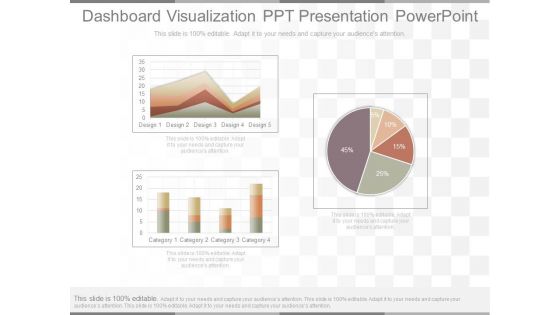
Dashboard Visualization Ppt Presentation Powerpoint
This is a dashboard visualization ppt presentation powerpoint. This is a three stage process. The stages in this process are design, category.
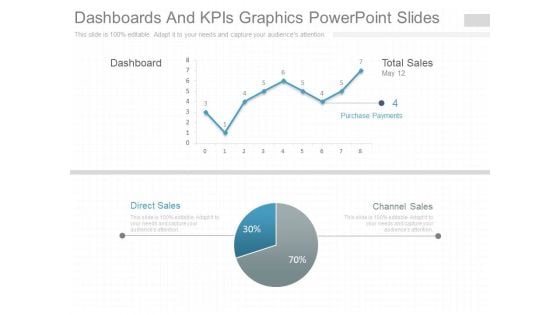
Dashboards And Kpis Graphics Powerpoint Slides
This is a dashboards and kpis graphics powerpoint slides. This is a two stage process. The stages in this process are dashboard, total sales, channel sales, direct sales, purchase payments.
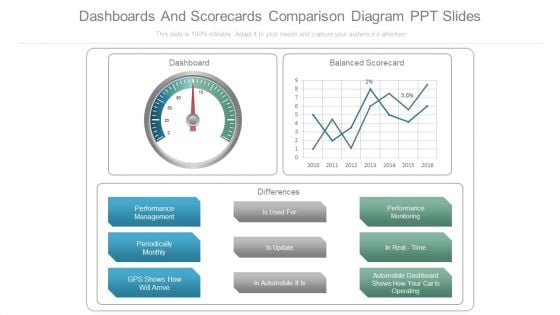
Dashboards And Scorecards Comparison Diagram Ppt Slides
This is a dashboards and scorecards comparison diagram ppt slides. This is a three stage process. The stages in this process are dashboard, balanced scorecard, differences, performance management, periodically monthly, gps shows how will arrive, is used for, is update, in automobile it is, performance monitoring, in real time, automobile dashboard shows how your car is operating.
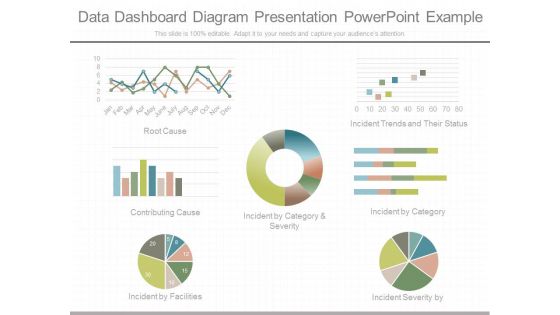
Data Dashboard Diagram Presentation Powerpoint Example
This is a data dashboard diagram presentation powerpoint example. This is a seven stage process. The stages in this process are root cause, incident trends and their status, contributing cause, incident by category and severity, incident by category, incident by facilities, incident severity by.
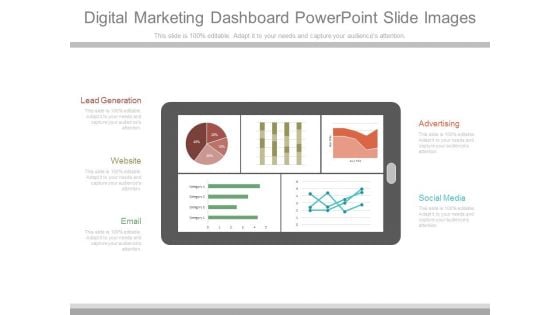
Digital Marketing Dashboard Powerpoint Slide Images
This is a digital marketing dashboard powerpoint slide images. This is a five stage process. The stages in this process are lead generation, website, email, advertising, social media.

Average Profit Margin Examples Presentation Slides
This is a average profit margin examples presentation slides. This is a five stage process. The stages in this process are sales growth, sales opportunities, product performance, average profit margin, sales target.
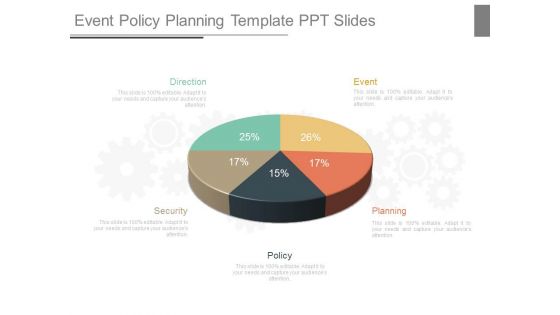
Event Policy Planning Template Ppt Slides
This is a event policy planning template ppt slides. This is a five stage process. The stages in this process are direction, security, policy, planning, event.
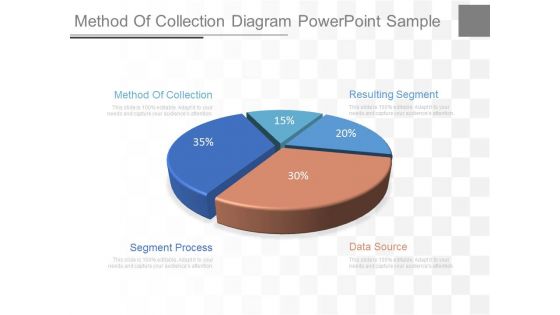
Method Of Collection Diagram Powerpoint Sample
This is a method of collection diagram powerpoint sample. This is a five stage process. The stages in this process are method of collection, segment process, data source, resulting segment.
Operations Management Business Units Example Powerpoint Slides
This is a operations management business units example powerpoint slides. This is a four stage process. The stages in this process are executive, management, operations, business units.
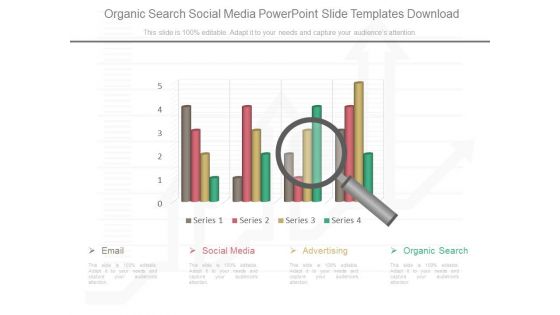
Organic Search Social Media Powerpoint Slide Templates Download
This is a organic search social media powerpoint slide templates download. This is a four stage process. The stages in this process are email, social media, advertising, organic search, series.
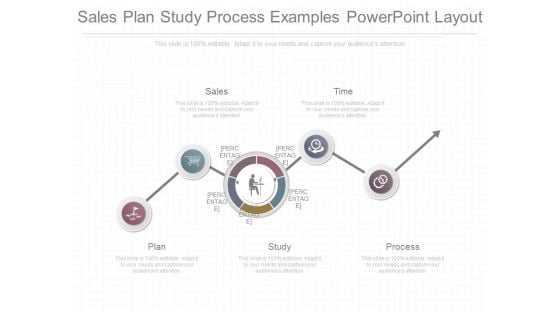
Sales Plan Study Process Examples Powerpoint Layout
This is a sales plan study process examples powerpoint layout. This is a five stage process. The stages in this process are sales, time, plan, study, process.
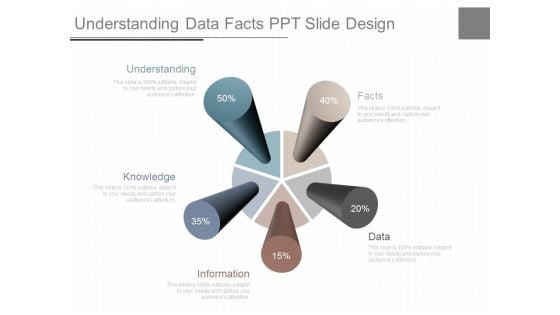
Understanding Data Facts Ppt Slide Design
This is a understanding data facts ppt slide design. This is a five stage process. The stages in this process are understanding, knowledge, information, data, facts.
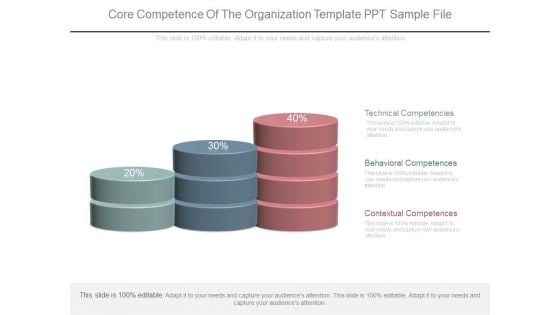
Core Competence Of The Organization Template Ppt Sample File
This is a core competence of the organization template ppt sample file. This is a three stage process. The stages in this process are technical competencies, behavioral competences, contextual competences.
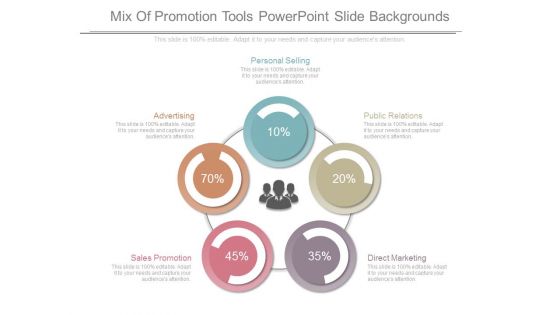
Mix Of Promotion Tools Powerpoint Slide Backgrounds
This is a mix of promotion tools powerpoint slide backgrounds. This is a five stage process. The stages in this process are personal selling, public relations, direct marketing, advertising, sales promotion.
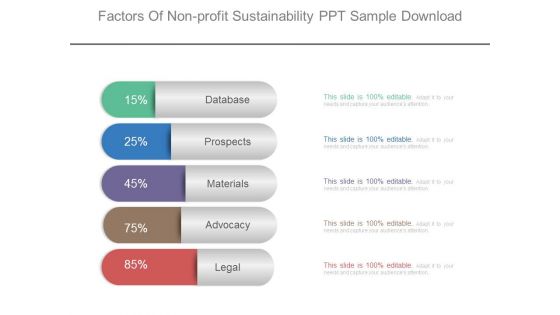
Factors Of Non Profit Sustainability Ppt Sample Download
This is a factors of non profit sustainability ppt sample download. This is a five stage process. The stages in this process are database, prospects, materials, advocacy, legal.
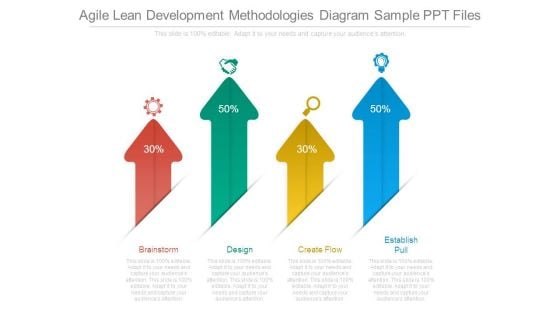
Agile Lean Development Methodologies Diagram Sample Ppt Files
This is a agile lean development methodologies diagram sample ppt files. This is a four stage process. The stages in this process are create flow, brainstorm, design, establish pull.
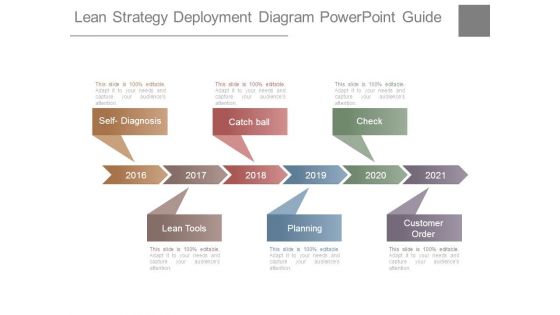
Lean Strategy Deployment Diagram Powerpoint Guide
This is a lean strategy deployment diagram powerpoint guide. This is a six stage process. The stages in this process are self diagnosis, catch ball, check, lean tools, planning, customer order.
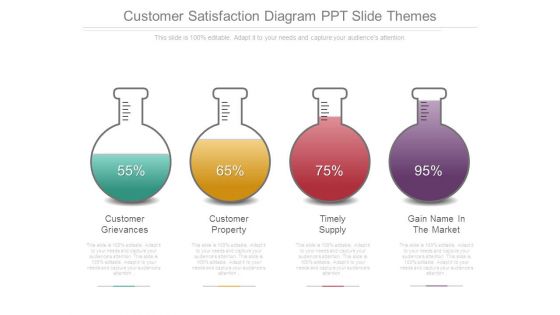
Customer Satisfaction Diagram Ppt Slide Themes
This is a customer satisfaction diagram ppt slide themes. This is a four stage process. The stages in this process are customer grievances, customer property, timely supply, gain name in the market.
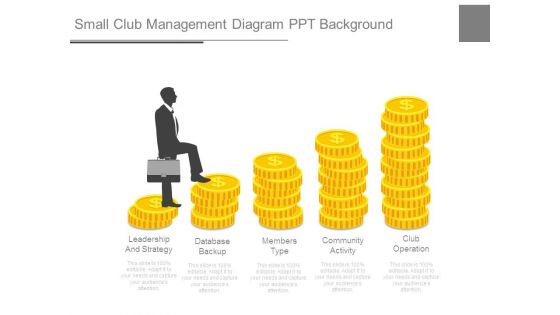
Small Club Management Diagram Ppt Background
This is a small club management diagram ppt background. This is a five stage process. The stages in this process are leadership and strategy, database backup, members type, community activity, club operation.
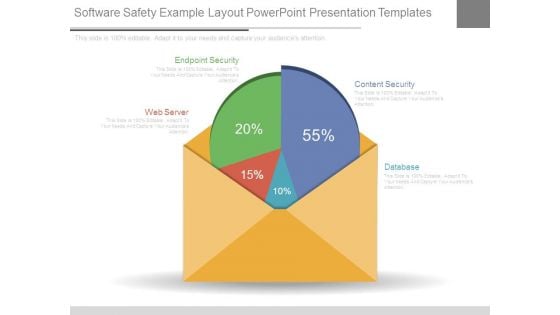
Software Safety Example Layout Powerpoint Presentation Templates
This is a software safety example layout powerpoint presentation templates. This is a four stage process. The stages in this process are web server, endpoint security, content security, database.
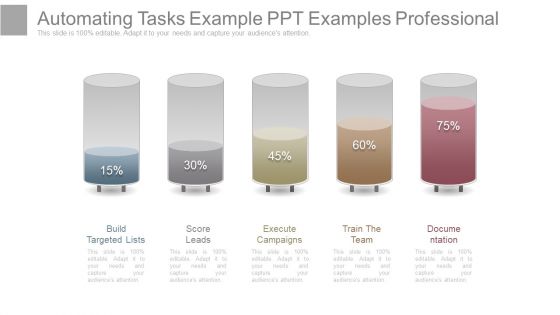
Automating Tasks Example Ppt Examples Professional
This is a automating tasks example ppt examples professional. This is a five stage process. The stages in this process are build targeted lists, score leads, execute campaigns, train the team, documentation.
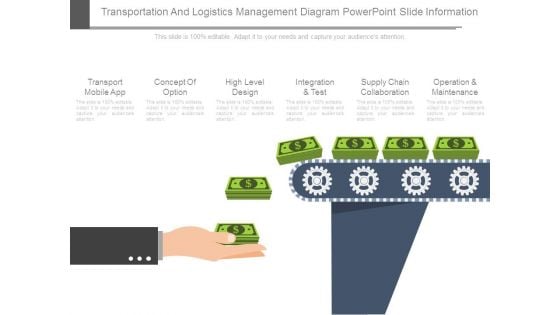
Transportation And Logistics Management Diagram Powerpoint Slide Information
This is a transportation and logistics management diagram powerpoint slide information. This is a six stage process. The stages in this process are transport mobile app, concept of option, high level design, integration and test, supply chain collaboration, operation and maintenance.
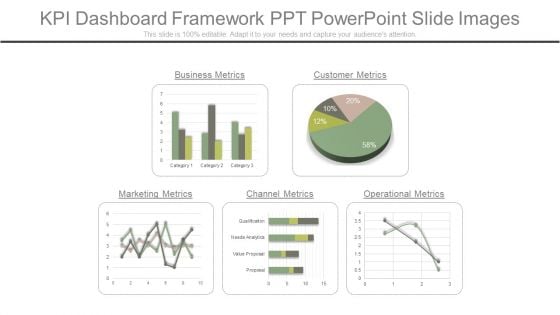
Kpi Dashboard Framework Ppt Powerpoint Slide Images
This is a kpi dashboard framework ppt powerpoint slide images. This is a five stage process. The stages in this process are business metrics, customer metrics, operational metrics, channel metrics, marketing metrics.
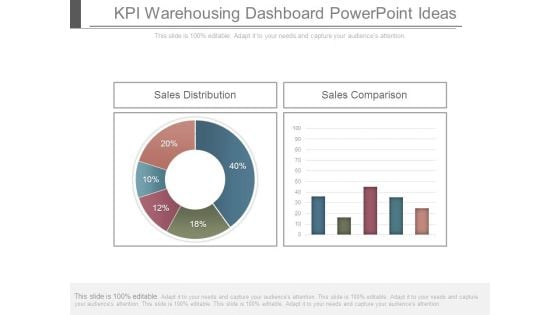
Kpi Warehousing Dashboard Powerpoint Ideas
This is a kpi warehousing dashboard powerpoint ideas. This is a two stage process. The stages in this process are sales distribution, sales comparison.
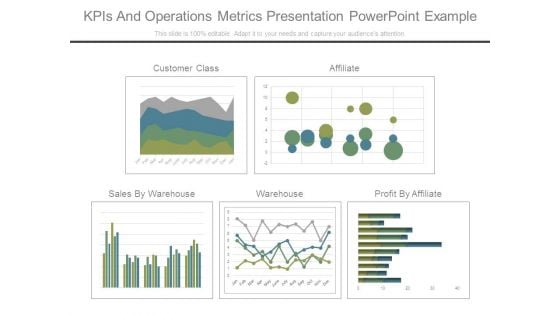
Kpis And Operations Metrics Presentation Powerpoint Example
This is a kpis and operations metrics presentation powerpoint example. This is a five stage process. The stages in this process are customer class, affiliate, sales by warehouse, warehouse, profit by affiliate.
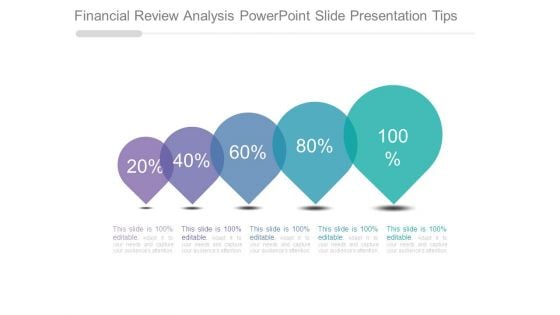
Financial Review Analysis Powerpoint Slide Presentation Tips
This is a financial review analysis powerpoint slide presentation tips. This is a five stage process. The stages in this process are business, growth, success, marketing, strategy, planning.

Win Loss Analysis Chart Powerpoint Presentation Templates
This is a win loss analysis chart powerpoint presentation templates. This is a two stage process. The stages in this process are business, management, marketing, sales, funnel.
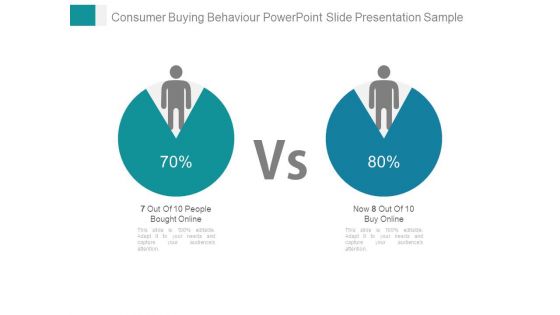
Consumer Buying Behaviour Powerpoint Slide Presentation Sample
This is a consumer buying behaviour powerpoint slide presentation sample. This is a two stage process. The stages in this process are 7 out of 10 people bought online, now 8 out of 10 buy online.
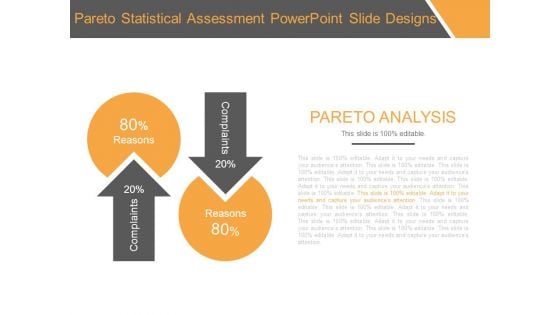
Pareto Statistical Assessment Powerpoint Slide Designs
This is a pareto statistical assessment powerpoint slide designs. This is a two stage process. The stages in this process are pareto analysis, reasons, complaints.
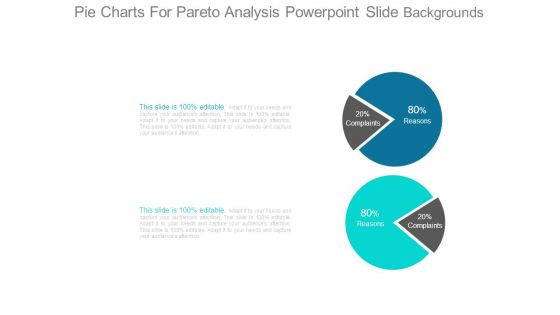
Pie Charts For Pareto Analysis Powerpoint Slide Backgrounds
This is a pie charts for pareto analysis powerpoint slide backgrounds. This is a two stage process. The stages in this process are reasons, complaints.
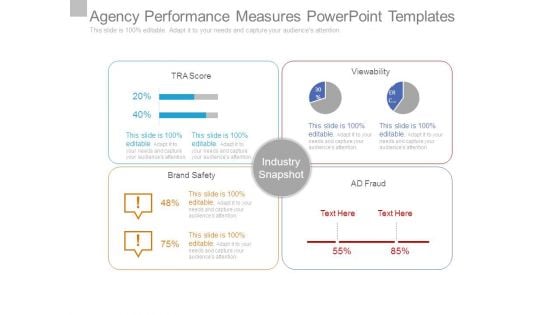
Agency Performance Measures Powerpoint Templates
This is a agency performance measures powerpoint templates. This is a four stage process. The stages in this process are industry snapshot, brand safety, ad fraud, viewability, tra score.
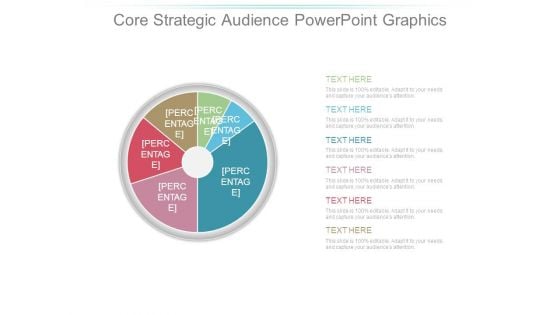
Core Strategic Audience Powerpoint Graphics
This is a core strategic audience powerpoint graphics. This is a six stage process. The stages in this process are circular, growth, business, marketing, percentage.
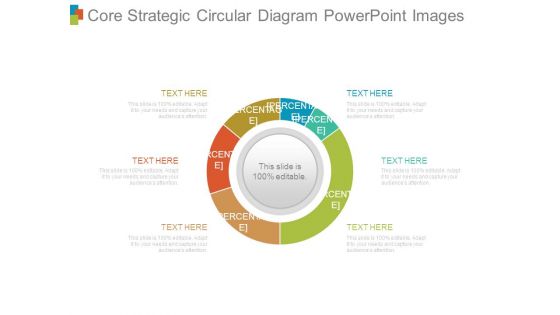
Core Strategic Circular Diagram Powerpoint Images
This is a core strategic circular diagram powerpoint images. This is a six stage process. The stages in this process are circular, growth, business, marketing, percentage.
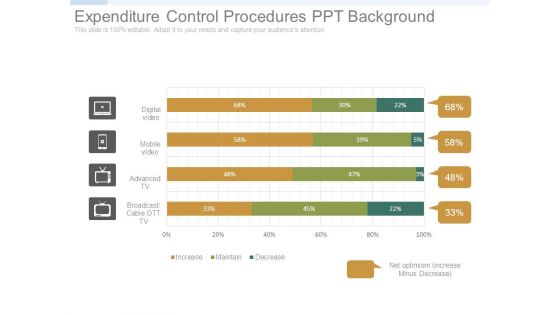
Expenditure Control Procedures Ppt Background
This is a expenditure control procedures ppt background. This is a four stage process. The stages in this process are digital video, mobile video, advanced tv, broadcast cable ott tv, increase, maintain, decrease, net optimism increase minus decrease.


 Continue with Email

 Home
Home


