Business Analysis Icon
Protection Working Management Chart Ppt Sample
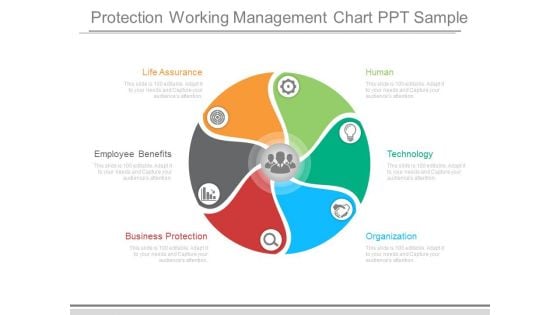
This is a protection working management chart ppt sample. This is a six stage process. The stages in this process are life assurance, employee benefits, business protection, human, technology, organization.
Implementing DRP IT Phase 4 Setting Up The Recovery Goals Ppt PowerPoint Presentation File Format PDF
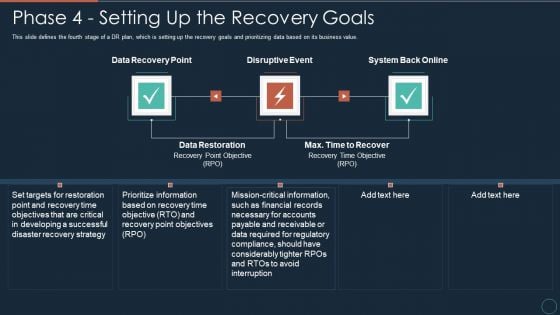
This slide defines the fourth stage of a DR plan, which is setting up the recovery goals and prioritizing data based on its business value.Deliver and pitch your topic in the best possible manner with this implementing drp it phase 4 setting up the recovery goals ppt powerpoint presentation file format pdf Use them to share invaluable insights on recovery time objectives, developing a successful, prioritize information and impress your audience. This template can be altered and modified as per your expectations. So, grab it now.
Channel Insight Pricing Diagram Example Of Ppt Presentation
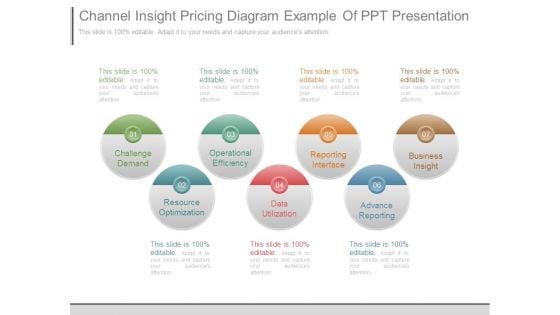
This is a channel insight pricing diagram example of ppt presentation. This is a seven stage process. The stages in this process are challenge demand, operational efficiency, reporting interface, business insight, resource optimization, data utilization, advance reporting.
Marketing And Sales Tools Diagram Sample Ppt Files
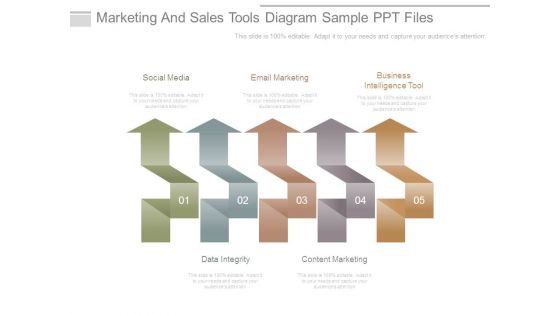
This is a marketing and sales tools diagram sample ppt files. This is a five stage process. The stages in this process are social media, email marketing, business intelligence tool, data integrity, content marketing.
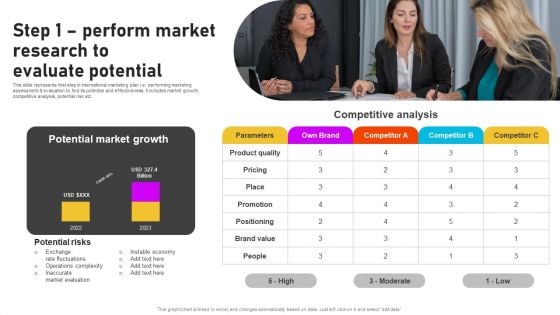
Formulating International Promotional Campaign Strategy Step 1 Perform Market Research To Evaluate Potential Template PDF
This slide represents first step in international marketing plan i.e. performing marketing assessment and evaluation to find its potential and effectiveness. It includes market growth, competitive analysis, potential risk etc. The Formulating International Promotional Campaign Strategy Step 1 Perform Market Research To Evaluate Potential Template PDF is a compilation of the most recent design trends as a series of slides. It is suitable for any subject or industry presentation, containing attractive visuals and photo spots for businesses to clearly express their messages. This template contains a variety of slides for the user to input data, such as structures to contrast two elements, bullet points, and slides for written information. Slidegeeks is prepared to create an impression.

Retail Industry Examination Ppt PowerPoint Presentation Complete Deck With Slides
If designing a presentation takes a lot of your time and resources and you are looking for a better alternative, then this Retail Industry Examination Ppt PowerPoint Presentation Complete Deck With Slides is the right fit for you. This is a prefabricated set that can help you deliver a great presentation on the topic. All the fourteen slides included in this sample template can be used to present a birds-eye view of the topic. These slides are also fully editable, giving you enough freedom to add specific details to make this layout more suited to your business setting. Apart from the content, all other elements like color, design, theme are also replaceable and editable. This helps in designing a variety of presentations with a single layout. Not only this, you can use this PPT design in formats like PDF, PNG, and JPG once downloaded. Therefore, without any further ado, download and utilize this sample presentation as per your liking.
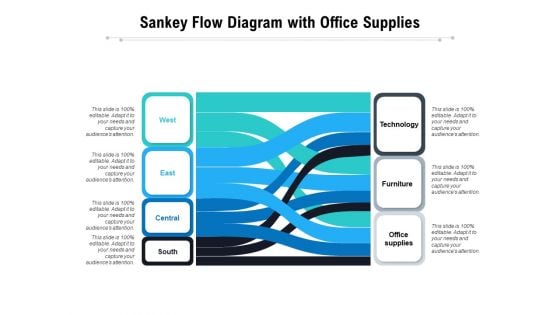
Sankey Flow Diagram With Office Supplies Ppt PowerPoint Presentation Infographics Example PDF
Showcasing this set of slides titled sankey flow diagram with office supplies ppt powerpoint presentation infographics example pdf. The topics addressed in these templates are technology, furniture, office supplies, central, west, east, south. All the content presented in this PPT design is completely editable. Download it and make adjustments in color, background, font etc. as per your unique business setting.
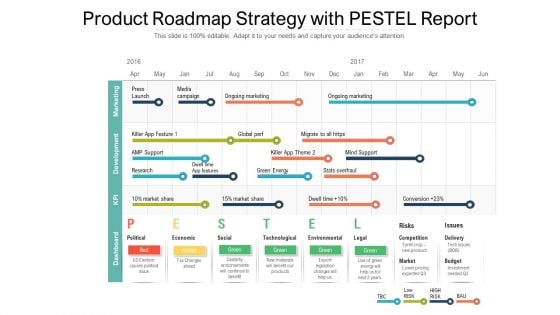
Product Roadmap Strategy With PESTEL Report Ppt PowerPoint Presentation Diagram Templates PDF
Showcasing this set of slides titled product roadmap strategy with pestel report ppt powerpoint presentation diagram templates pdf. The topics addressed in these templates are economical, social, technological. All the content presented in this PPT design is completely editable. Download it and make adjustments in color, background, font etc. as per your unique business setting.
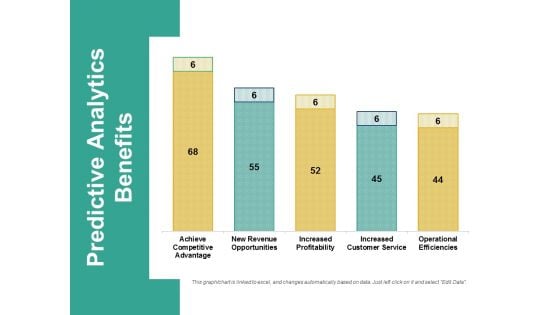
Predictive Analytics Benefits Ppt PowerPoint Presentation Professional Samples
This is a predictive analytics benefits ppt powerpoint presentation professional samples. This is a five stage process. The stages in this process are business, finance, marketing, strategy, analysis.
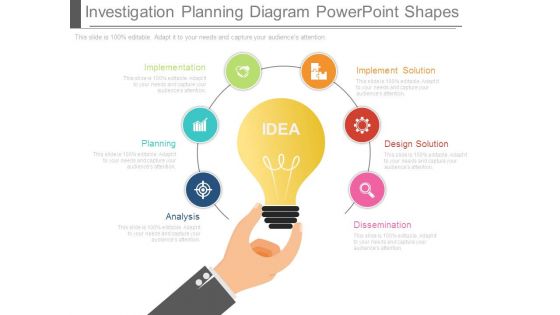
Investigation Planning Diagram Powerpoint Shapes
This is a investigation planning diagram powerpoint shapes. This is a six stage process. The stages in this process are implementation, planning, analysis, implement solution, design solution, dissemination.

Bar Diagram Ppt PowerPoint Presentation Ideas Infographic Template
This is a bar diagram ppt powerpoint presentation ideas infographic template. This is a four stage process. The stages in this process are business, finance, marketing, strategy, analysis.
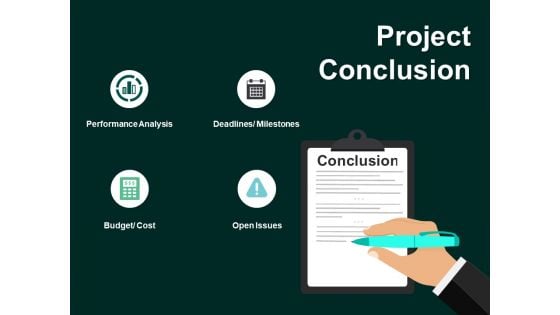
Project Conclusion Budget Ppt PowerPoint Presentation Gallery Diagrams
This is a project conclusion budget ppt powerpoint presentation gallery diagrams. This is a four stage process. The stages in this process are business, planning, strategy, analysis, marketing.
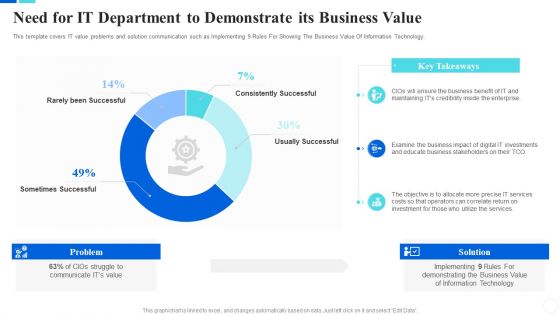
Communicate Company Value To Your Stakeholders Need For IT Department To Demonstrate Professional PDF
This template covers IT value problems and solution communication such as Implementing 9 Rules For Showing The Business Value Of Information Technology. Deliver and pitch your topic in the best possible manner with this communicate company value to your stakeholders need for it department to demonstrate professional pdf. Use them to share invaluable insights on business benefit, enterprise, investments, services and impress your audience. This template can be altered and modified as per your expectations. So, grab it now.
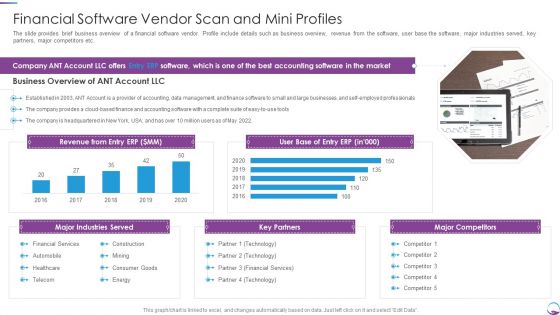
Financial Software Vendor Scan And Mini Profiles Mockup PDF
The slide provides brief business overview of a financial software vendor. Profile include details such as business overview, revenue from the software, user base the software, major industries served, key partners, major competitors etc. Deliver an awe inspiring pitch with this creative Financial Software Vendor Scan And Mini Profiles Mockup PDF bundle. Topics like Financial Services, Consumer Goods, Technology, Revenue can be discussed with this completely editable template. It is available for immediate download depending on the needs and requirements of the user.
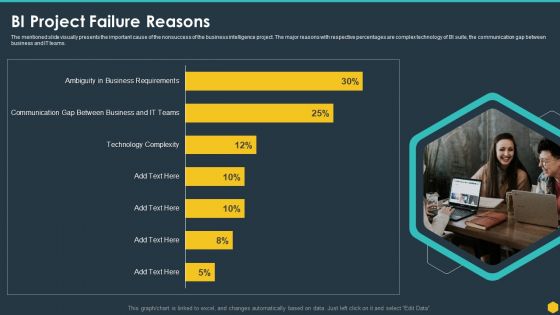
BI Project Failure Reasons BI Transformation Toolset Rules PDF
The mentioned slide visually presents the important cause of the nonsuccess of the business intelligence project. The major reasons with respective percentages are complex technology of BI suite, the communication gap between business and IT teams. Deliver an awe inspiring pitch with this creative BI Project Failure Reasons BI Transformation Toolset Rules PDF bundle. Topics like Bi Project Failure Reasons can be discussed with this completely editable template. It is available for immediate download depending on the needs and requirements of the user.
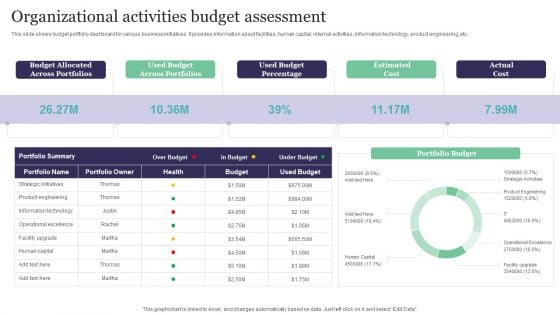
Organizational Activities Budget Assessment Summary PDF
This slide shows budget portfolio dashboard for various business initiatives. It provides information about facilities, human capital, internal activities, information technology, product engineering, etc. Showcasing this set of slides titled Organizational Activities Budget Assessment Summary PDF. The topics addressed in these templates are Budget Allocated, Across Portfolios, Used Budget, Percentage, Actual Cost. All the content presented in this PPT design is completely editable. Download it and make adjustments in color, background, font etc. as per your unique business setting.

Employee Satisfaction Survey Ppt PowerPoint Presentation Complete Deck With Slides Survey
This Employee Satisfaction Survey Ppt PowerPoint Presentation Complete Deck With Slides Survey acts as backup support for your ideas, vision, thoughts, etc. Use it to present a thorough understanding of the topic. This PPT slideshow can be utilized for both in-house and outside presentations depending upon your needs and business demands. Entailing five slides with a consistent design and theme, this template will make a solid use case. As it is intuitively designed, it suits every business vertical and industry. All you have to do is make a few tweaks in the content or any other component to design unique presentations. The biggest advantage of this complete deck is that it can be personalized multiple times once downloaded. The color, design, shapes, and other elements are free to modify to add personal touches. You can also insert your logo design in this PPT layout. Therefore a well-thought and crafted presentation can be delivered with ease and precision by downloading this Employee Satisfaction Survey Ppt PowerPoint Presentation Complete Deck With Slides Survey PPT slideshow.
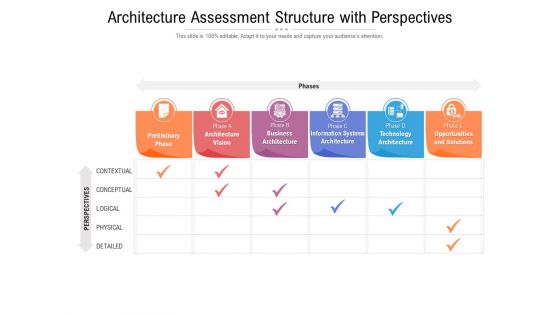
Architecture Assessment Structure With Perspectives Ppt PowerPoint Presentation Inspiration Portfolio PDF
Presenting this set of slides with name architecture assessment structure with perspectives ppt powerpoint presentation inspiration portfolio pdf. The topics discussed in these slides are preliminary phase, architecture vision, business architecture, information systems architecture, technology architecture, opportunities and solutions. This is a completely editable PowerPoint presentation and is available for immediate download. Download now and impress your audience.
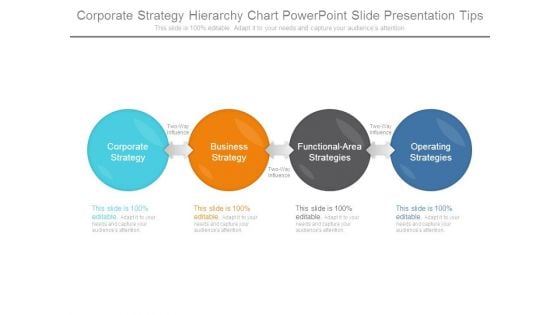
Corporate Strategy Hierarchy Chart Powerpoint Slide Presentation Tips
This is a corporate strategy hierarchy chart powerpoint slide presentation tips. This is a four stage process. The stages in this process are corporate strategy, business strategy, functional area strategies, operating strategies.
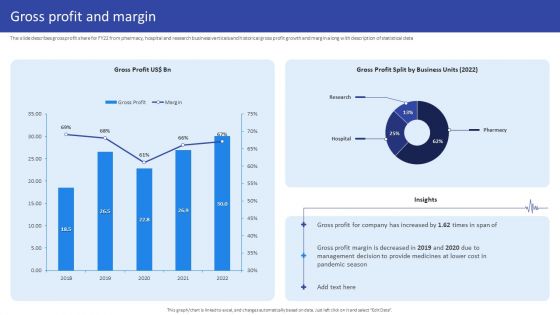
Hospital Medical Research Company Profile Gross Profit And Margin Pictures PDF
The slide describes gross profit share for FY22 from pharmacy, hospital and research business verticals and historical gross profit growth and margin along with description of statistical data. Deliver an awe inspiring pitch with this creative Hospital Medical Research Company Profile Gross Profit And Margin Pictures PDF bundle. Topics like Gross Profit Split, Business Units 2022, 2018 To 2022 can be discussed with this completely editable template. It is available for immediate download depending on the needs and requirements of the user.
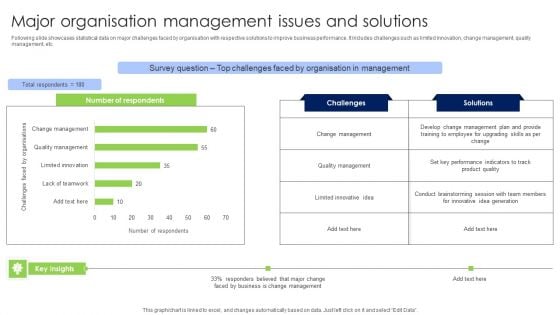
Major Organisation Management Issues And Solutions Pictures PDF
Following slide showcases statistical data on major challenges faced by organisation with respective solutions to improve business performance. It includes challenges such as limited innovation, change management, quality management, etc. Showcasing this set of slides titled Major Organisation Management Issues And Solutions Pictures PDF. The topics addressed in these templates are Number Of Respondents, Challenges, Solutions. All the content presented in this PPT design is completely editable. Download it and make adjustments in color, background, font etc. as per your unique business setting.
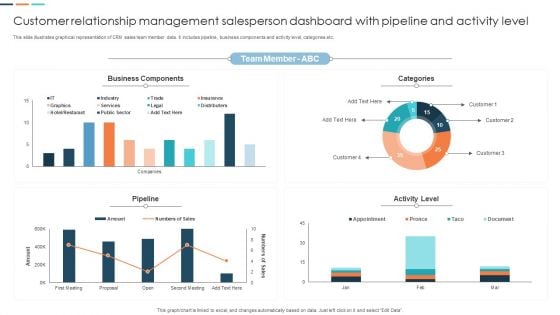
Customer Relationship Management Salesperson Dashboard With Pipeline And Activity Level Designs PDF
This slide illustrates graphical representation of CRM sales team member data. It includes pipeline, business components and activity level, categories etc. Pitch your topic with ease and precision using this Customer Relationship Management Salesperson Dashboard With Pipeline And Activity Level Designs PDF. This layout presents information on Categories, Business Components, Team Member. It is also available for immediate download and adjustment. So, changes can be made in the color, design, graphics or any other component to create a unique layout.
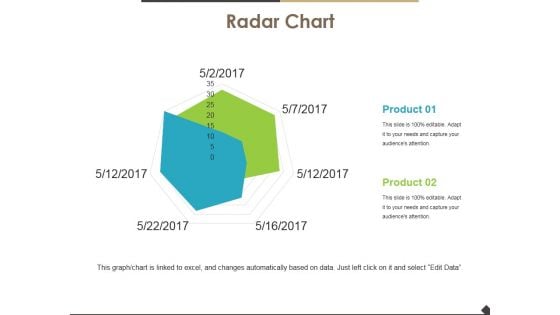
Radar Chart Ppt PowerPoint Presentation Inspiration Layouts
This is a radar chart ppt powerpoint presentation inspiration layouts. This is a two stage process. The stages in this process are radar chart, product, marketing, strategy, analysis.
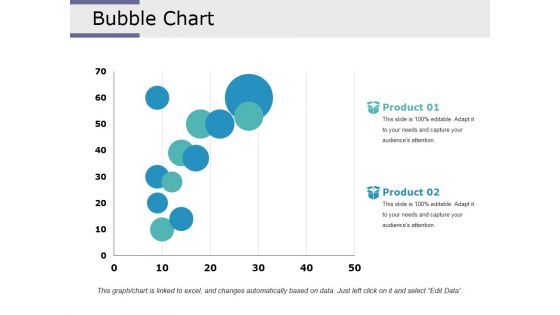
Bubble Chart Ppt PowerPoint Presentation Inspiration Portfolio
This is a bubble chart ppt powerpoint presentation inspiration portfolio. This is a two stage process. The stages in this process are bubble chart, finance, analysis, marketing, strategy.
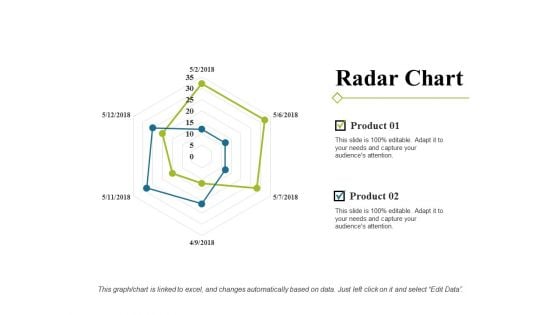
Radar Chart Ppt PowerPoint Presentation Portfolio Show
This is a radar chart ppt powerpoint presentation portfolio show. This is a two stage process. The stages in this process are radar chart, finance, marketing, strategy, analysis.
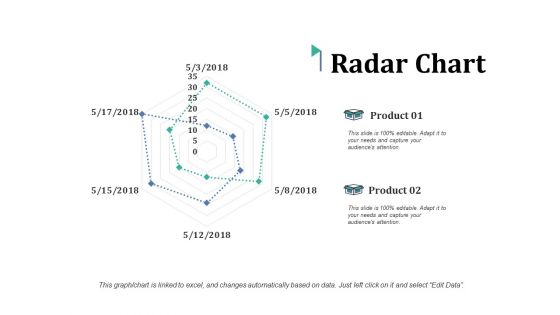
Radar Chart Ppt PowerPoint Presentation Pictures Smartart
This is a radar chart ppt powerpoint presentation pictures smartart. This is a two stage process. The stages in this process are radar chart, finance, marketing, analysis, management.
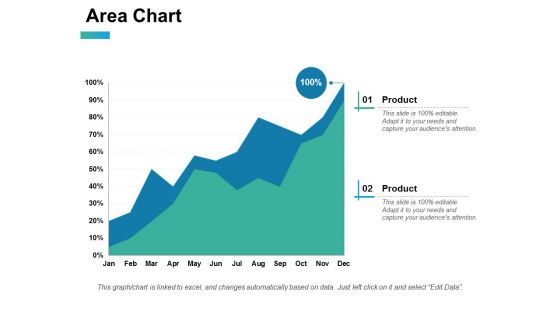
Area Chart Ppt PowerPoint Presentation Summary Guidelines
This is a area chart ppt powerpoint presentation summary guidelines. This is a two stage process. The stages in this process are area chart, finance, analysis, investment, marketing.
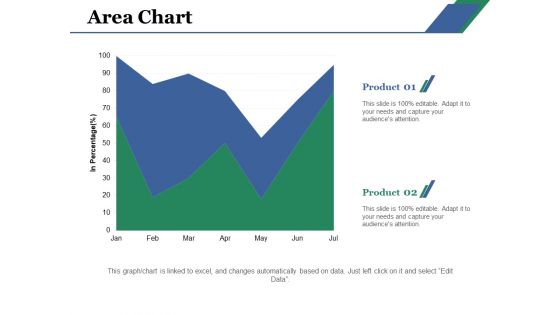
Area Chart Ppt PowerPoint Presentation Layouts Gridlines
This is a area chart ppt powerpoint presentation layouts gridlines. This is a two stage process. The stages in this process are area chart, product, percentage, analysis, capture.
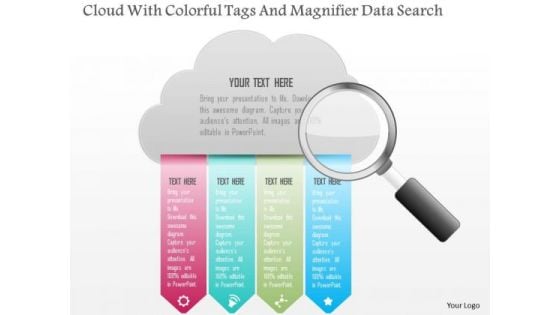
Busines Diagram Cloud With Colorful Tags And Magnifier Data Search Presentation Template
This business diagram displays graphic of colorful tags and cloud with magnifier. This slide can be used to for technology and communication related topics. Enhance the look of your presentations with this diagram.
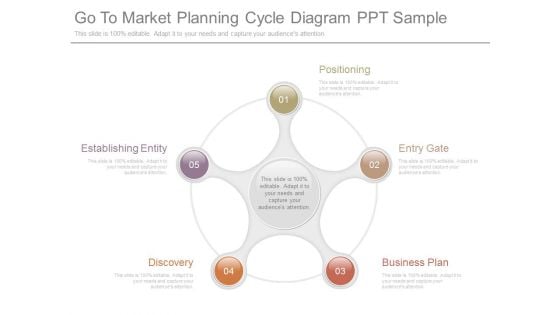
Go To Market Planning Cycle Diagram Ppt Sample
This is a go to market planning cycle diagram ppt sample. This is a five stage process. The stages in this process are establishing entity, discovery, positioning, entry gate, business plan.
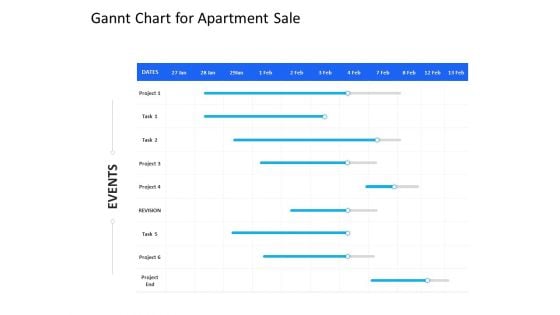
Organization Manpower Management Technology Gannt Chart For Apartment Sale Elements PDF
Your complex projects can be managed and organized simultaneously using this detailed organization manpower management technology gannt chart for apartment sale elements pdf template. Track the milestones, tasks, phases, activities, and subtasks to get an updated visual of your project. Share your planning horizon and release plan with this well crafted presentation template. This exemplary template can be used to plot various dependencies to distinguish the tasks in the pipeline and their impact on the schedules and deadlines of the project. Apart from this, you can also share this visual presentation with your team members and stakeholders. It a resourceful tool that can be incorporated into your business structure. Therefore, download and edit it conveniently to add the data and statistics as per your requirement.
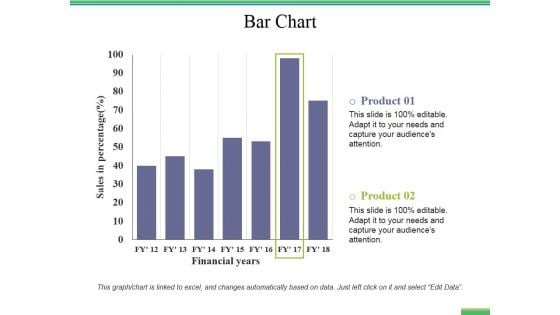
Bar Chart Ppt PowerPoint Presentation File Rules
This is a bar chart ppt powerpoint presentation file rules. This is a two stage process. The stages in this process are bar graph, finance, marketing, strategy, analysis.
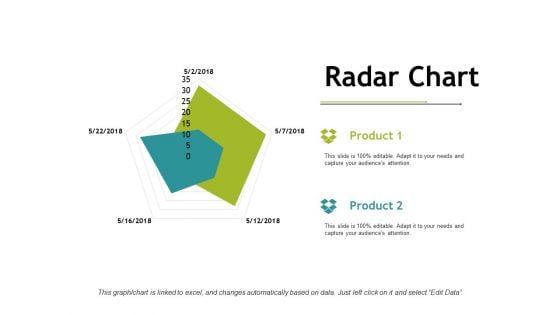
Radar Chart Ppt PowerPoint Presentation Model Slideshow
This is a radar chart ppt powerpoint presentation model slideshow. This is a two stage process. The stages in this process are finance, marketing, analysis, management, planning.

Combo Chart Ppt PowerPoint Presentation Infographics Ideas
This is a combo chart ppt powerpoint presentation infographics ideas. This is a four stage process. The stages in this process are bar graph, marketing, strategy, finance, analysis.

Line Chart Ppt PowerPoint Presentation File Sample
This is a line chart ppt powerpoint presentation file sample. This is a two stage process. The stages in this process are finance, marketing, management, investment, analysis.
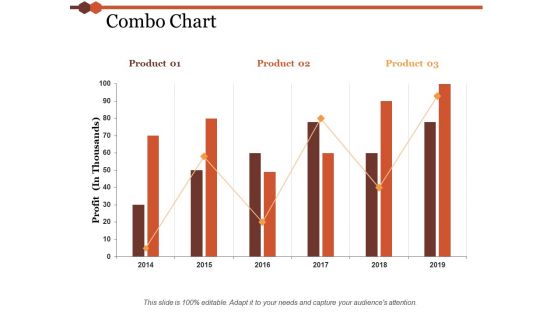
Combo Chart Ppt PowerPoint Presentation Model Professional
This is a combo chart ppt powerpoint presentation model professional. This is a three stage process. The stages in this process are finance, marketing, management, investment, analysis.
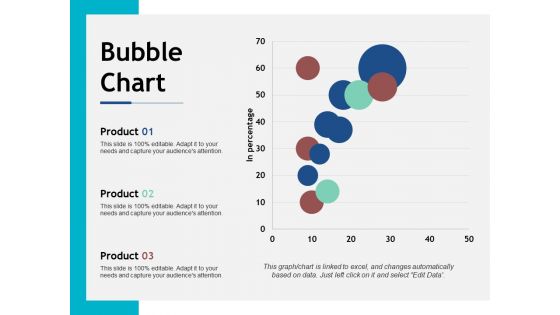
Bubble Chart Ppt PowerPoint Presentation Styles Show
This is a bubble chart ppt powerpoint presentation styles show. This is a three stage process. The stages in this process are finance, marketing, management, investment, analysis.
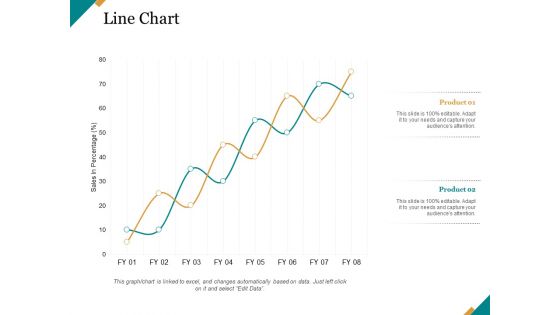
Line Chart Ppt PowerPoint Presentation Pictures Graphics
This is a line chart ppt powerpoint presentation pictures graphics. This is a two stage process. The stages in this process are finance, marketing, management, investment, analysis.
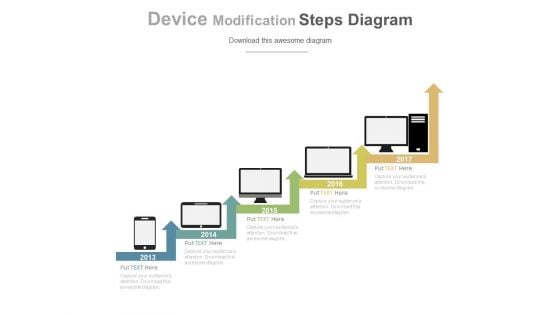
Comparison Between Varying Hardware Technologies Powerpoint Slides
This PPT slide displays graphics of computers diagram with growth steps. Use this PPT design to display varying hardware technologies. This PowerPoint template can be customized as per requirements of business education or any other theme.

Investigate Manufacturing Magnify Glass Ppt PowerPoint Presentation Complete Deck
Share a great deal of information on the topic by deploying this investigate manufacturing magnify glass ppt powerpoint presentation complete deck. Support your ideas and thought process with this prefabricated set. It includes a set of twelve slides, all fully modifiable and editable. Each slide can be restructured and induced with the information and content of your choice. You can add or remove large content boxes as well, to make this PPT slideshow more personalized. Its high-quality graphics and visuals help in presenting a well-coordinated pitch. This PPT template is also a resourceful tool to take visual cues from and implement the best ideas to help your business grow and expand. The main attraction of this well-formulated deck is that everything is editable, giving you the freedom to adjust it to your liking and choice. Changes can be made in the background and theme as well to deliver an outstanding pitch. Therefore, click on the download button now to gain full access to this
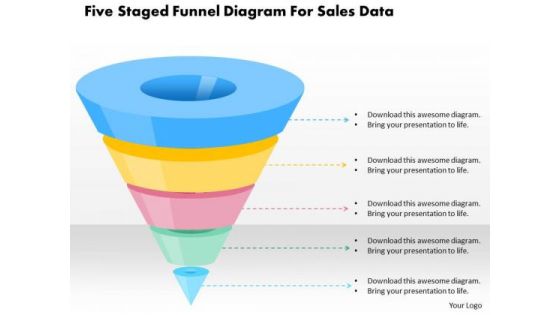
Five Staged Funnel Diagram For Sales Data PowerPoint Template
Five staged funnel diagram has been used to design this power point template. This diagram template contains the concept of sales data representation. Use this PPT for your business and sales related presentations.
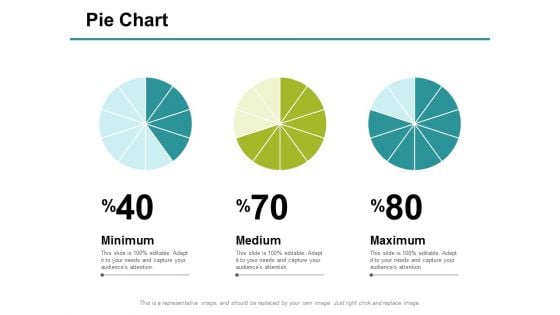
Pie Chart Ppt PowerPoint Presentation Model Examples
This is a pie chart ppt powerpoint presentation model examples. This is a three stage process. The stages in this process are pie chart, minimum, medium, maximum, analysis.
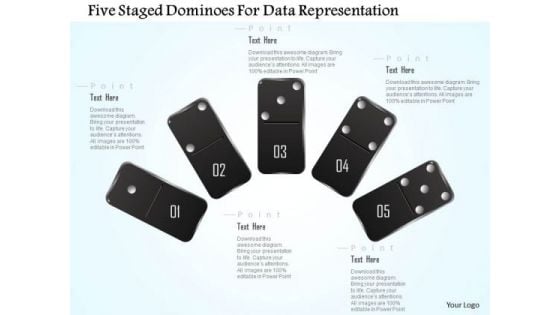
Busines Diagram Five Staged Dominoes For Data Representation Presentation Template
This business diagram displays graphics of five staged dominoes. Use this slide to represent your data in visual manner. This slide offers an excellent background to build professional presentations.
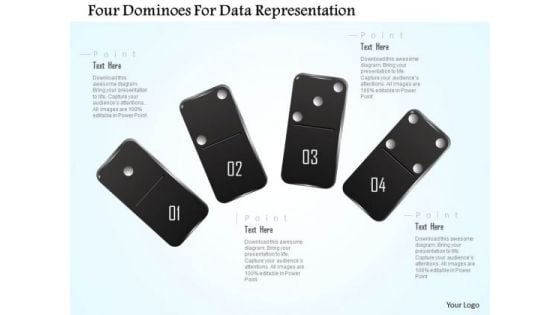
Busines Diagram Four Dominoes For Data Representation Presentation Template
This business diagram displays graphics of four staged dominoes. Use this slide to represent your data in visual manner. This slide offers an excellent background to build professional presentations.
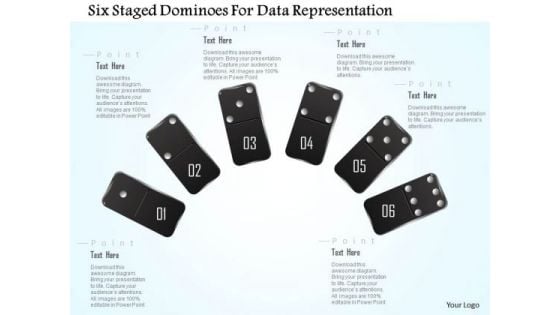
Busines Diagram Six Staged Dominoes For Data Representation Presentation Template
This business diagram displays graphics of six staged dominoes. Use this slide to represent your data in visual manner. This slide offers an excellent background to build professional presentations.
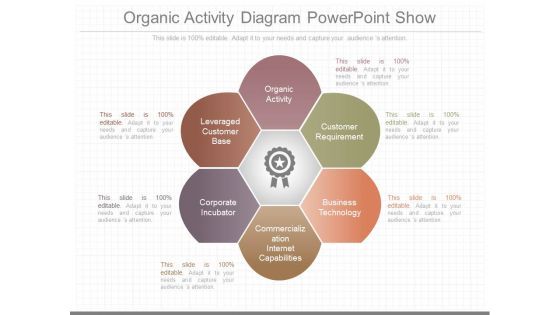
Organic Activity Diagram Powerpoint Show
This is a organic activity diagram powerpoint show. This is a six stage process. The stages in this process are leveraged customer base, organic activity, corporate incubator, commercialization internet capabilities, customer requirement, business technology.
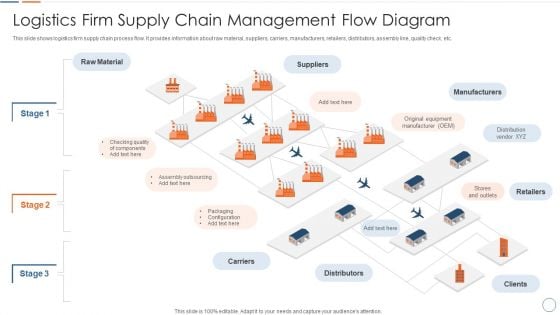
Logistics Firm Supply Chain Management Flow Diagram Guidelines PDF
This slide shows logistics firm supply chain process flow. It provides information about raw material, suppliers, carriers, manufacturers, retailers, distributors, assembly line, quality check, etc. Showcasing this set of slides titled Logistics Firm Supply Chain Management Flow Diagram Guidelines PDF. The topics addressed in these templates are Suppliers, Manufacturers, Raw Material. All the content presented in this PPT design is completely editable. Download it and make adjustments in color, background, font etc. as per your unique business setting.
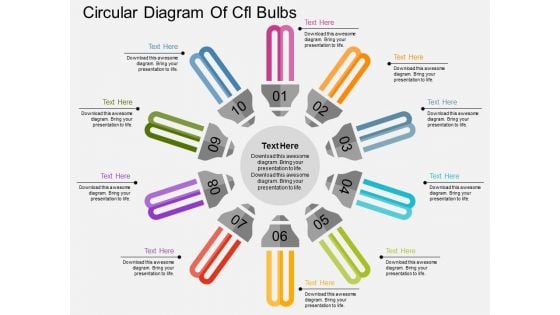
Circular Diagram Of Cfl Bulbs Powerpoint Templates
This PowerPoint template has been designed with circular diagram of CFL bulbs. It helps to exhibit business strategies and ideas. Use this diagram to impart more clarity to data and to create more sound impact on viewers.
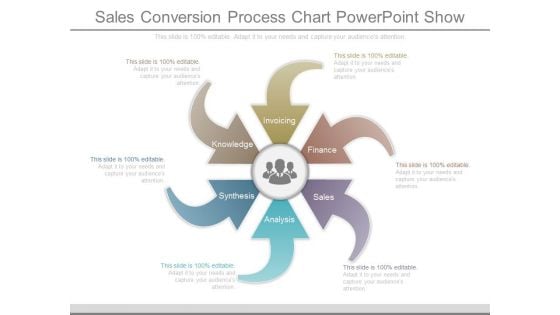
Sales Conversion Process Chart Powerpoint Show
This is a sales conversion process chart powerpoint show. This is a six stage process. The stages in this process are invoicing, finance, sales, analysis, synthesis, knowledge.

Column Chart Ppt PowerPoint Presentation Portfolio Inspiration
This is a column chart ppt powerpoint presentation portfolio inspiration. This is a two stage process. The stages in this process are finance, marketing, management, investment, analysis.
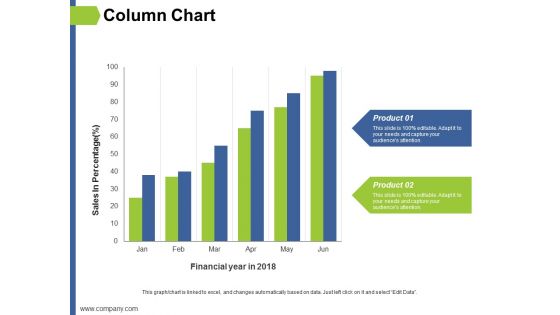
Column Chart Ppt PowerPoint Presentation Slides Format
This is a column chart ppt powerpoint presentation slides format. This is a two stage process. The stages in this process are finance, marketing, management, investment, analysis.
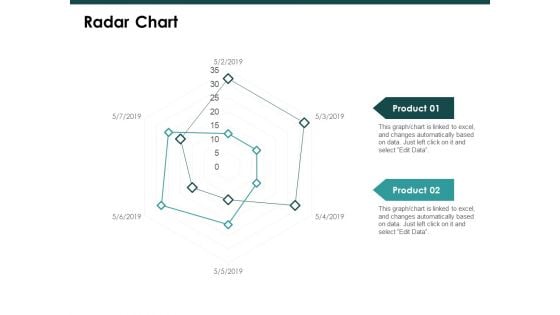
Radar Chart Graph Ppt PowerPoint Presentation Slide
This is a radar chart graph ppt powerpoint presentation slide. This is a two stage process. The stages in this process are finance, marketing, management, investment, analysis.
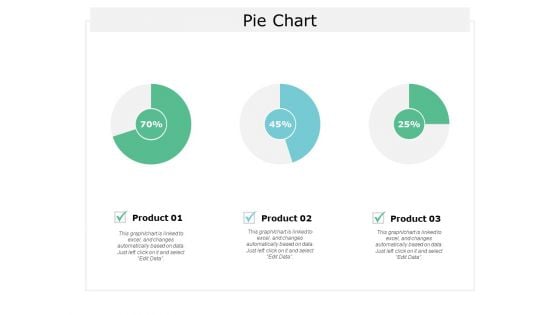
Pie Chart Finance Ppt Powerpoint Presentation Introduction
This is a pie chart finance ppt powerpoint presentation introduction. This is a three stage process. The stages in this process are finance, marketing, analysis, investment, strategy.
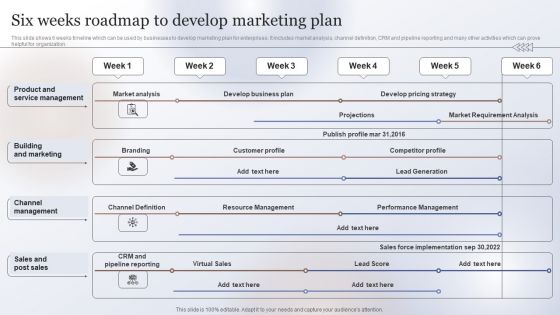
Marketing Strategy To Enhance Six Weeks Roadmap To Develop Marketing Plan Themes PDF
This slide shows 6 weeks timeline which can be used by businesses to develop marketing plan for enterprises. It includes market analysis, channel definition, CRM and pipeline reporting and many other activities which can prove helpful for organization. Get a simple yet stunning designed Marketing Strategy To Enhance Six Weeks Roadmap To Develop Marketing Plan Themes PDF. It is the best one to establish the tone in your meetings. It is an excellent way to make your presentations highly effective. So, download this PPT today from Slidegeeks and see the positive impacts. Our easy-to-edit Marketing Strategy To Enhance Six Weeks Roadmap To Develop Marketing Plan Themes PDF can be your go-to option for all upcoming conferences and meetings. So, what are you waiting for Grab this template today.
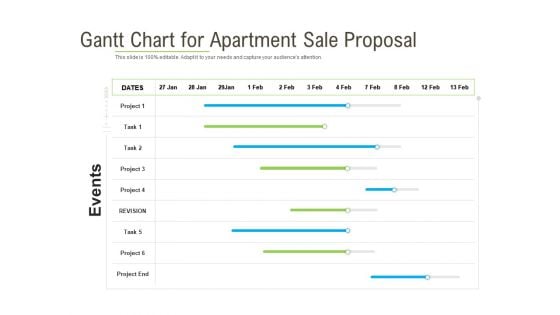
Rapid Innovation In HR Technology Space Gantt Chart For Apartment Sale Proposal Structure PDF
Your complex projects can be managed and organized simultaneously using this detailed rapid innovation in hr technology space gantt chart for apartment sale proposal structure pdf template. Track the milestones, tasks, phases, activities, and subtasks to get an updated visual of your project. Share your planning horizon and release plan with this well crafted presentation template. This exemplary template can be used to plot various dependencies to distinguish the tasks in the pipeline and their impact on the schedules and deadlines of the project. Apart from this, you can also share this visual presentation with your team members and stakeholders. It a resourceful tool that can be incorporated into your business structure. Therefore, download and edit it conveniently to add the data and statistics as per your requirement.
Graph01 Success PowerPoint Templates And PowerPoint Backgrounds 0611
Microsoft PowerPoint Template and Background with success diagram finances business diagram stock growth market Play by the book with our Graph01 Success PowerPoint Templates And PowerPoint Backgrounds 0611. They advocate a fair and square approach.
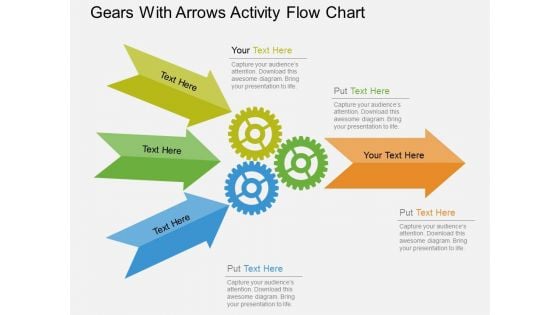
Gears With Arrows Activity Flow Chart Powerpoint Template
This PowerPoint slide contains gears arrow business design. This professional slide may be used as activity flow chart. Use this template to highlight the key issues of your presentation.
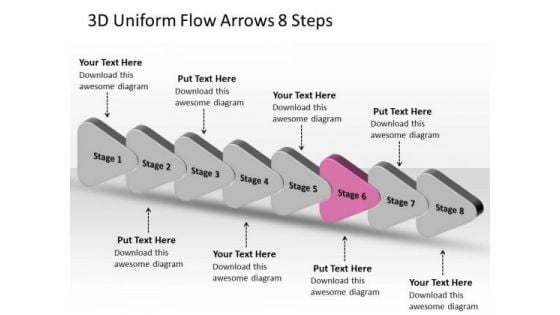
3d Uniform Flow Arrows 8 Steps Best Chart PowerPoint Slides
We present our 3d uniform flow arrows 8 steps best chart PowerPoint Slides. Use our Business PowerPoint Templates because, Marketing Strategy Business Template: - Maximizing sales of your product is the intended destination. Use our Arrows PowerPoint Templates because; emphasize the process of your business/corporate growth. Use our Success PowerPoint Templates because, our presentation designs are for those on the go. Use our Signs PowerPoint Templates because; discuss each path to the smallest detail. Use our Process and Flows PowerPoint Templates because, It has inspired a whole new world of medical endeavor. Use these PowerPoint slides for presentations relating to abstract, arrow, arrows, business, chart, design, development, diagram, direction, element, flow, flowchart, graph, linear, management, model, motion, organization, plan, process, program, section, segment, set, sign, solution, strategy, symbol, technology. The prominent colors used in the PowerPoint template are Pink, Gray, and Black Compile it on our 3d Uniform Flow Arrows 8 Steps Best Chart PowerPoint Slides. Give your thoughts exclusive exposure.
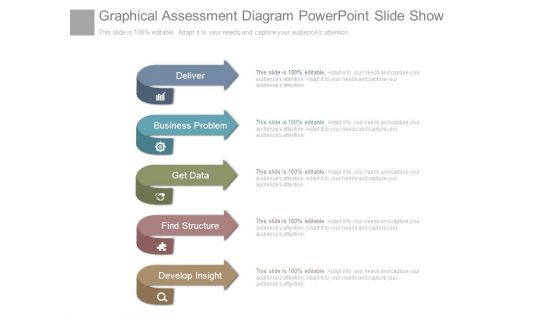
Graphical Assessment Diagram Powerpoint Slide Show
This is a graphical assessment diagram powerpoint slide show. This is a five stage process. The stages in this process are deliver, business problem, get data, find structure, develop insight.
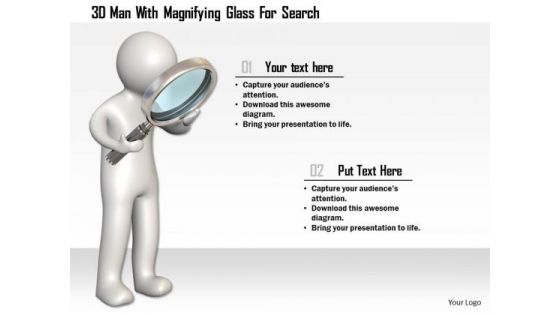
3d Man With Magnifying Glass For Search
This Power Point template diagram slide has been crafted with graphic of 3d man and magnifying glass. This diagram slide contains the concept of search and focus. Use this slide for your business and marketing presentations.


 Continue with Email

 Home
Home


