Business Analysis Icon
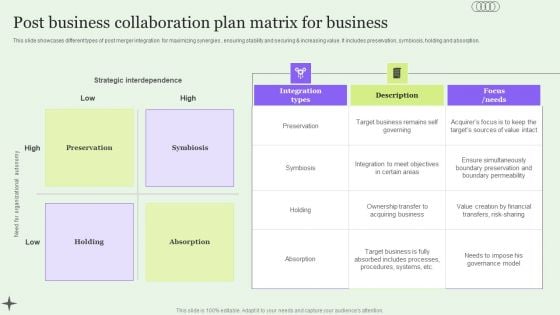
Post Business Collaboration Plan Matrix For Business Elements PDF
This slide showcases different types of post merger integration for maximizing synergies , ensuring stability and securing and increasing value. It includes preservation, symbiosis, holding and absorption. Presenting Post Business Collaboration Plan Matrix For Business Elements PDF to dispense important information. This template comprises four stages. It also presents valuable insights into the topics including Preservation, Symbiosis, Holding, Absorption. This is a completely customizable PowerPoint theme that can be put to use immediately. So, download it and address the topic impactfully.
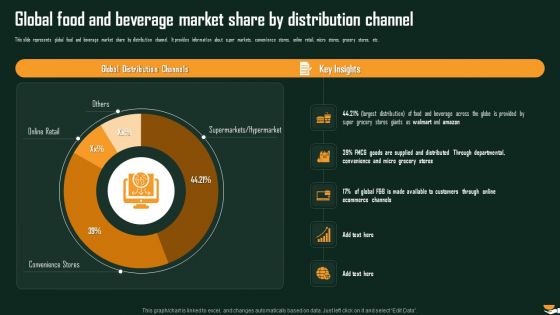
Global Food And Beverage Market Share By Distribution Channel International Food And Beverages Sector Analysis Portrait PDF
This slide represents global food and beverage market share by distribution channel. It provides information about super markets, convenience stores, online retail, micro stores, grocery stores, etc. Deliver and pitch your topic in the best possible manner with this Global Food And Beverage Market Share By Distribution Channel International Food And Beverages Sector Analysis Portrait PDF. Use them to share invaluable insights on Distribution Channels, Beverage Across, Through Departmental and impress your audience. This template can be altered and modified as per your expectations. So, grab it now.
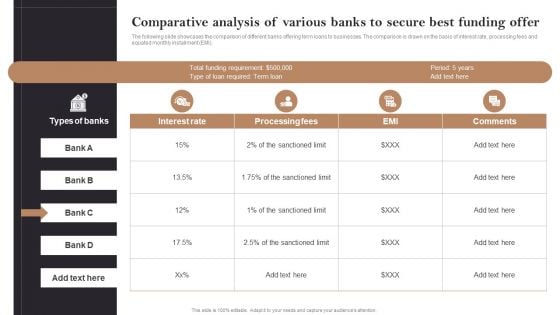
Comparative Analysis Of Various Banks To Secure Best Funding Offer Opening Retail Store In Untapped Themes PDF
The following slide showcases the comparison of different banks offering term loans to businesses. The comparison is drawn on the basis of interest rate, processing fees and equated monthly installment EMI. There are so many reasons you need a Comparative Analysis Of Various Banks To Secure Best Funding Offer Opening Retail Store In Untapped Themes PDF. The first reason is you can notspend time making everything from scratch, Thus, Slidegeeks has made presentation templates for you too. You can easily download these templates from our website easily.
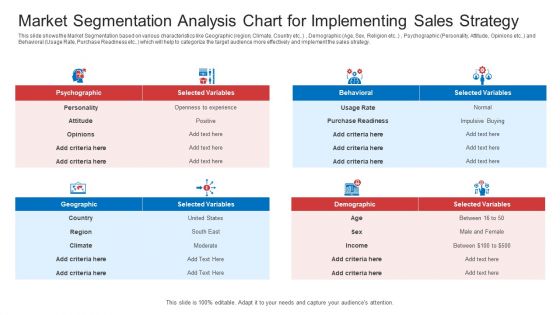
Strategic Plan To Increase Sales Volume And Revenue Market Segmentation Analysis Chart For Implementing Sales Strategy Microsoft PDF
This slide shows the Market Segmentation based on various characteristics like Geographic region, Climate, Country etc. Demographic Age, Sex, Religion etc. Psychographic Personality, Attitude, Opinions etc. and Behavioral Usage Rate, Purchase Readiness etc. which will help to categorize the target audience more effectively and implement the sales strategy. Deliver an awe inspiring pitch with this creative strategic plan to increase sales volume and revenue market segmentation analysis chart for implementing sales strategy microsoft pdf bundle. Topics like psychographic, behavioral, geographic, demographic can be discussed with this completely editable template. It is available for immediate download depending on the needs and requirements of the user.
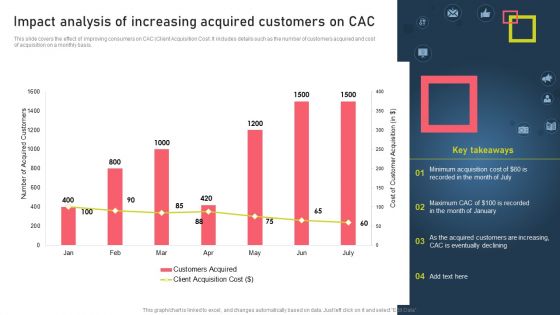
Strategies For Acquiring Online And Offline Clients Impact Analysis Of Increasing Acquired Customers On Cac Ideas PDF
This slide covers the effect of improving consumers on CAC Client Acquisition Cost. It includes details such as the number of customers acquired and cost of acquisition on a monthly basis. The best PPT templates are a great way to save time, energy, and resources. Slidegeeks have 100 percent editable powerpoint slides making them incredibly versatile. With these quality presentation templates, you can create a captivating and memorable presentation by combining visually appealing slides and effectively communicating your message. Download Strategies For Acquiring Online And Offline Clients Impact Analysis Of Increasing Acquired Customers On Cac Ideas PDF from Slidegeeks and deliver a wonderful presentation.
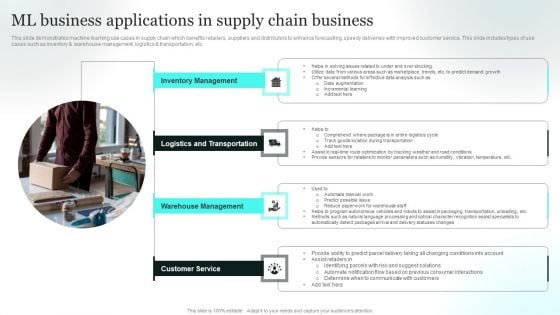
ML Business Applications In Supply Chain Business Structure PDF
This slide demonstrates machine learning use cases in supply chain which benefits retailers, suppliers and distributors to enhance forecasting, speedy deliveries with improved customer service. This slide includes types of use cases such as inventory and warehouse management, logistics and transportation, etc. Presenting ML Business Applications In Supply Chain Business Structure PDF to dispense important information. This template comprises four stages. It also presents valuable insights into the topics including Inventory Management, Logistics And Transportation, Warehouse Management. This is a completely customizable PowerPoint theme that can be put to use immediately. So, download it and address the topic impactfully.
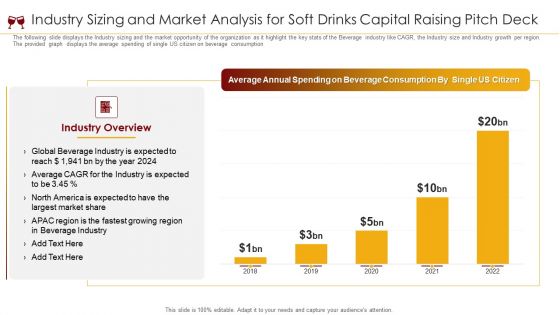
Industry Sizing And Market Analysis For Soft Drinks Capital Raising Pitch Deck Ppt Inspiration Clipart Images PDF
The following slide displays the Industry sizing and the market opportunity of the organization as it highlight the key stats of the Beverage industry like CAGR, the Industry size and Industry growth per region. The provided graph displays the average spending of single US citizen on beverage consumption. Deliver an awe inspiring pitch with this creative industry sizing and market analysis for soft drinks capital raising pitch deck ppt inspiration clipart images pdf bundle. Topics like global beverage industry, market share, beverage industry, 2018 to 2022 can be discussed with this completely editable template. It is available for immediate download depending on the needs and requirements of the user.
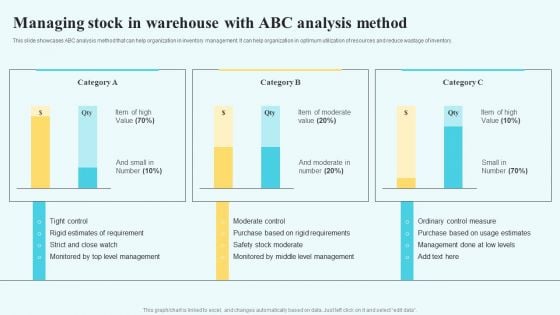
Adopting Multiple Tactics To Improve Inventory Optimization Managing Stock In Warehouse With Abc Analysis Method Brochure PDF
This modern and well arranged Adopting Multiple Tactics To Improve Inventory Optimization Managing Stock In Warehouse With Abc Analysis Method Brochure PDF provides lots of creative possibilities. It is very simple to customize and edit with the Powerpoint Software. Just drag and drop your pictures into the shapes. All facets of this template can be edited with Powerpoint no extra software is necessary. Add your own material, put your images in the places assigned for them, adjust the colors, and then you can show your slides to the world, with an animated slide included.

Investor Pitch Deck To Collect Capital From Subordinated Loan Competitive Analysis By Operational And Financial Data Diagrams PDF
The slide provides the Competitive landscape of the company on the basis of financial data sales and profit and operational data employee count, locations, year of existence etc. Deliver an awe-inspiring pitch with this creative investor pitch deck to collect capital from subordinated loan competitive analysis by operational and financial data diagrams pdf bundle. Topics like year existence, locations, major product service, interest rate, sales, employee count, profit can be discussed with this completely editable template. It is available for immediate download depending on the needs and requirements of the user.
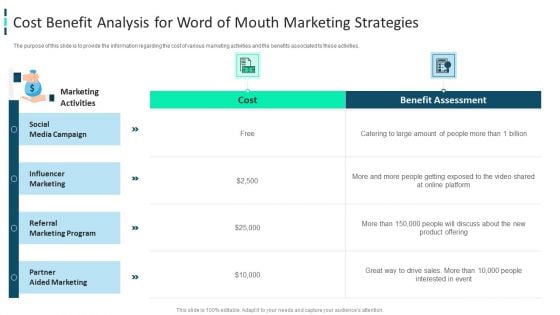
Improving Brand Awareness Through WOM Marketing Cost Benefit Analysis For Word Of Mouth Marketing Strategies Diagrams PDF
The purpose of this slide is to provide the information regarding the cost of various marketing activities and the benefits associated to these activities. Deliver and pitch your topic in the best possible manner with this improving brand awareness through wom marketing cost benefit analysis for word of mouth marketing strategies diagrams pdf. Use them to share invaluable insights on social media campaign, influencer marketing, referral marketing program, partner aided marketing and impress your audience. This template can be altered and modified as per your expectations. So, grab it now.
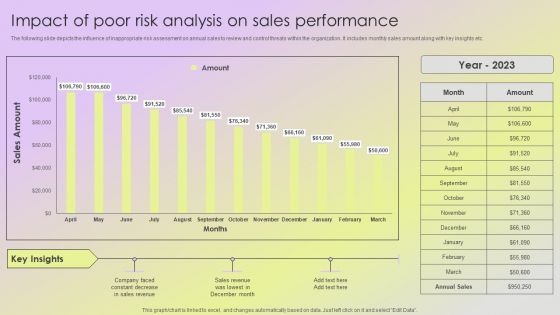
Mitigating Sales Risks With Strategic Action Planning Impact Of Poor Risk Analysis On Sales Performance Guidelines PDF
The following slide depicts the influence of inappropriate risk assessment on annual sales to review and control threats within the organization. It includes monthly sales amount along with key insights etc. Boost your pitch with our creative Mitigating Sales Risks With Strategic Action Planning Impact Of Poor Risk Analysis On Sales Performance Guidelines PDF. Deliver an awe-inspiring pitch that will mesmerize everyone. Using these presentation templates you will surely catch everyones attention. You can browse the ppts collection on our website. We have researchers who are experts at creating the right content for the templates. So you do not have to invest time in any additional work. Just grab the template now and use them.

Supply Chain Kpi Dashboard For Effective Financial Analysis Stand Out Digital Supply Chain Tactics Enhancing Graphics PDF
Mentioned slide illustrates KPI dashboard that can be used by managers to assess financial health of supply chain business. KPIs covered are supply chain costs versus sales, cash to order cycle, warehouse operating cost distribution etc.Coming up with a presentation necessitates that the majority of the effort goes into the content and the message you intend to convey. The visuals of a PowerPoint presentation can only be effective if it supplements and supports the story that is being told. Keeping this in mind our experts created Supply Chain Kpi Dashboard For Effective Financial Analysis Stand Out Digital Supply Chain Tactics Enhancing Graphics PDF to reduce the time that goes into designing the presentation. This way, you can concentrate on the message while our designers take care of providing you with the right template for the situation.
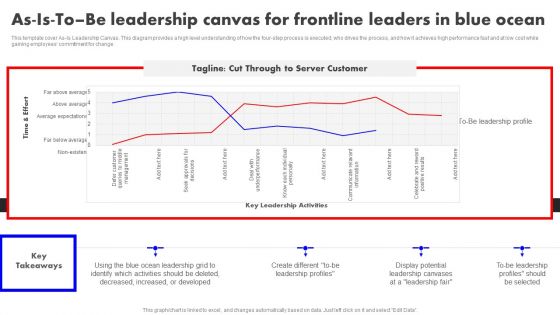
Detailed Analysis Of Red Ocean Vs Blue Ocean Approach As Is To Be Leadership Canvas For Frontline Leaders Rules PDF
This template cover As-Is Leadership Canvas. This diagram provides a high level understanding of how the four-step process is executed, who drives the process, and how it achieves high performance fast and at low cost while gaining employees commitment for change. Present like a pro with Detailed Analysis Of Red Ocean Vs Blue Ocean Approach As Is To Be Leadership Canvas For Frontline Leaders Rules PDF Create beautiful presentations together with your team, using our easy to use presentation slides. Share your ideas in real time and make changes on the fly by downloading our templates. So whether you are in the office, on the go, or in a remote location, you can stay in sync with your team and present your ideas with confidence. With Slidegeeks presentation got a whole lot easier. Grab these presentations today.
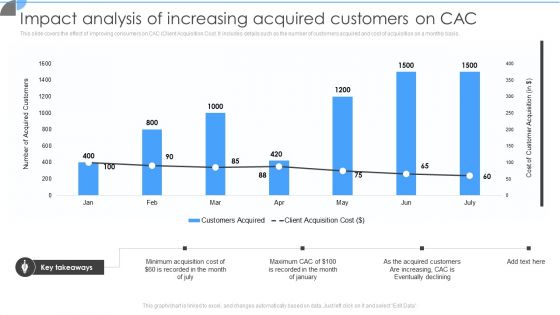
Customer Acquisition Approaches To Enhance Organization Growth Impact Analysis Of Increasing Acquired Customers On CAC Elements PDF
This slide covers the effect of improving consumers on CAC Client Acquisition Cost. It includes details such as the number of customers acquired and cost of acquisition on a monthly basis. Coming up with a presentation necessitates that the majority of the effort goes into the content and the message you intend to convey. The visuals of a PowerPoint presentation can only be effective if it supplements and supports the story that is being told. Keeping this in mind our experts created Customer Acquisition Approaches To Enhance Organization Growth Impact Analysis Of Increasing Acquired Customers On CAC Elements PDF to reduce the time that goes into designing the presentation. This way, you can concentrate on the message while our designers take care of providing you with the right template for the situation.
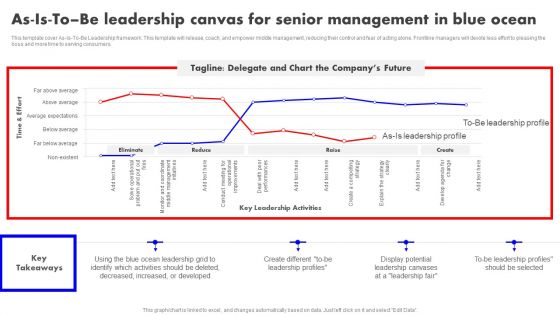
Detailed Analysis Of Red Ocean Vs Blue Ocean Approach As Is To Be Leadership Canvas Senior Management Topics PDF
This template cover As-Is-To-Be Leadership framework. This template will release, coach, and empower middle management, reducing their control and fear of acting alone. Frontline managers will devote less effort to pleasing the boss and more time to serving consumers. Slidegeeks is here to make your presentations a breeze with Detailed Analysis Of Red Ocean Vs Blue Ocean Approach As Is To Be Leadership Canvas Senior Management Topics PDF With our easy to use and customizable templates, you can focus on delivering your ideas rather than worrying about formatting. With a variety of designs to choose from, you are sure to find one that suits your needs. And with animations and unique photos, illustrations, and fonts, you can make your presentation pop. So whether you are giving a sales pitch or presenting to the board, make sure to check out Slidegeeks first.
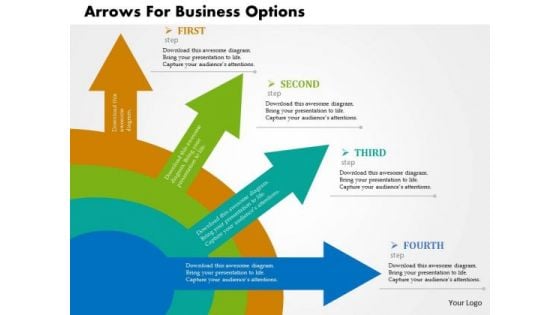
Business Diagram Arrows For Business Options Presentation Template
Market analysis can be displayed with this business diagram slide. It contains graphic of arrows in circular order. Download this diagram slide to make impressive presentations.
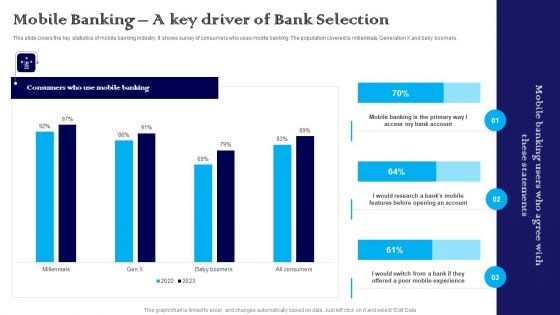
Exploring The Banking Industry A Comprehensive Analysis Mobile Banking A Key Driver Of Bank Selection Infographics PDF
This slide covers the key statistics of mobile banking industry. It shows survey of consumers who uses mobile banking. The population covered is millennials, Generation X and baby boomers. Slidegeeks is one of the best resources for PowerPoint templates. You can download easily and regulate Exploring The Banking Industry A Comprehensive Analysis Mobile Banking A Key Driver Of Bank Selection Infographics PDF for your personal presentations from our wonderful collection. A few clicks is all it takes to discover and get the most relevant and appropriate templates. Use our Templates to add a unique zing and appeal to your presentation and meetings. All the slides are easy to edit and you can use them even for advertisement purposes.
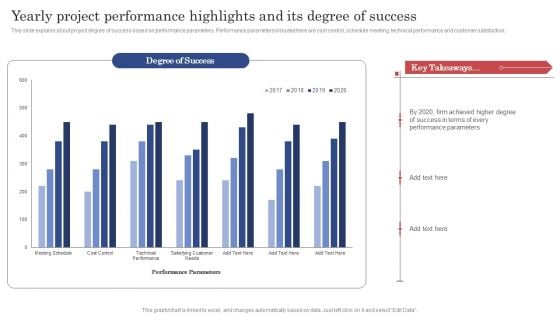
Construction Project Cost Benefit Analysis Report Yearly Project Performance Highlights And Its Degree Of Success Formats PDF
This slide explains about project degree of success based on performance parameters. Performance parameters included here are cost control, schedule meeting, technical performance and customer satisfaction. This Construction Project Cost Benefit Analysis Report Yearly Project Performance Highlights And Its Degree Of Success Formats PDF from Slidegeeks makes it easy to present information on your topic with precision. It provides customization options, so you can make changes to the colors, design, graphics, or any other component to create a unique layout. It is also available for immediate download, so you can begin using it right away. Slidegeeks has done good research to ensure that you have everything you need to make your presentation stand out. Make a name out there for a brilliant performance.
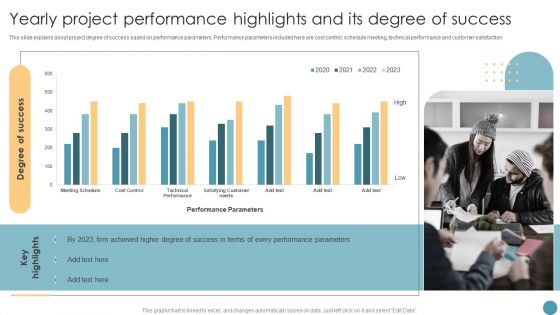
Yearly Project Performance Highlights And Its Degree Of Success Feasibility Analysis Report For Construction Project Clipart PDF
This slide explains about project degree of success based on performance parameters. Performance parameters included here are cost control, schedule meeting, technical performance and customer satisfaction. This Yearly Project Performance Highlights And Its Degree Of Success Feasibility Analysis Report For Construction Project Clipart PDF from Slidegeeks makes it easy to present information on your topic with precision. It provides customization options, so you can make changes to the colors, design, graphics, or any other component to create a unique layout. It is also available for immediate download, so you can begin using it right away. Slidegeeks has done good research to ensure that you have everything you need to make your presentation stand out. Make a name out there for a brilliant performance.
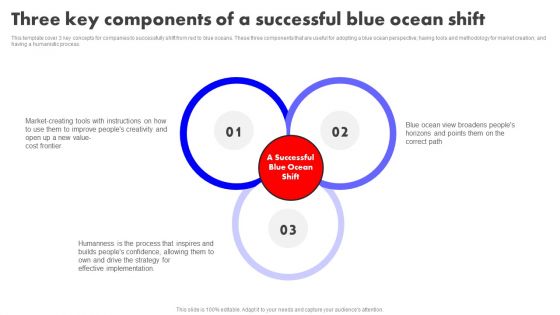
Detailed Analysis Of Red Ocean Vs Blue Ocean Approach Three Key Components Successful Blue Ocean Shift Diagrams PDF
This template cover 3 key concepts for companies to successfully shift from red to blue oceans. These three components that are useful for adopting a blue ocean perspective having tools and methodology for market creation and having a humanistic process. Create an editable Detailed Analysis Of Red Ocean Vs Blue Ocean Approach Three Key Components Successful Blue Ocean Shift Diagrams PDF that communicates your idea and engages your audience. Whether youre presenting a business or an educational presentation, pre designed presentation templates help save time. Detailed Analysis Of Red Ocean Vs Blue Ocean Approach Three Key Components Successful Blue Ocean Shift Diagrams PDF is highly customizable and very easy to edit, covering many different styles from creative to business presentations. Slidegeeks has creative team members who have crafted amazing templates. So, go and get them without any delay.
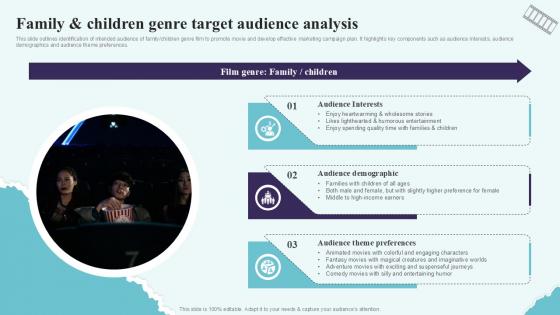
Family And Children Genre Target Audience Analysis Strategic Plan To Increase Film Ppt Sample Strategy SS V
This slide outlines identification of intended audience of familyorchildren genre film to promote movie and develop effective marketing campaign plan. It highlights key components such as audience interests, audience demographics and audience theme preferences. Whether you have daily or monthly meetings, a brilliant presentation is necessary. Family And Children Genre Target Audience Analysis Strategic Plan To Increase Film Ppt Sample Strategy SS V can be your best option for delivering a presentation. Represent everything in detail using Family And Children Genre Target Audience Analysis Strategic Plan To Increase Film Ppt Sample Strategy SS V and make yourself stand out in meetings. The template is versatile and follows a structure that will cater to your requirements. All the templates prepared by Slidegeeks are easy to download and edit. Our research experts have taken care of the corporate themes as well. So, give it a try and see the results. This slide outlines identification of intended audience of familyorchildren genre film to promote movie and develop effective marketing campaign plan. It highlights key components such as audience interests, audience demographics and audience theme preferences.
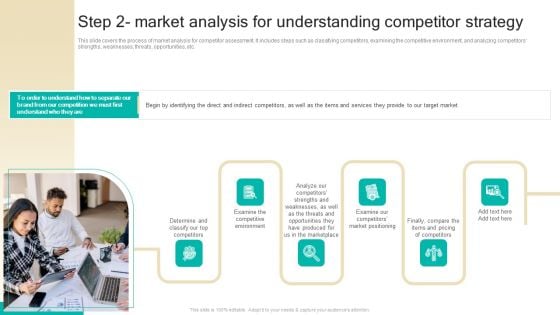
Procedure To Develop Effective Product Step 2 Market Analysis For Understanding Competitor Strategy Ppt Portfolio Diagrams PDF
This slide covers the process of market analysis for competitor assessment. It includes steps such as classifying competitors, examining the competitive environment, and analyzing competitors strengths, weaknesses, threats, opportunities, etc. Slidegeeks has constructed Procedure To Develop Effective Product Step 2 Market Analysis For Understanding Competitor Strategy Ppt Portfolio Diagrams PDF after conducting extensive research and examination. These presentation templates are constantly being generated and modified based on user preferences and critiques from editors. Here, you will find the most attractive templates for a range of purposes while taking into account ratings and remarks from users regarding the content. This is an excellent jumping-off point to explore our content and will give new users an insight into our top-notch PowerPoint Templates.
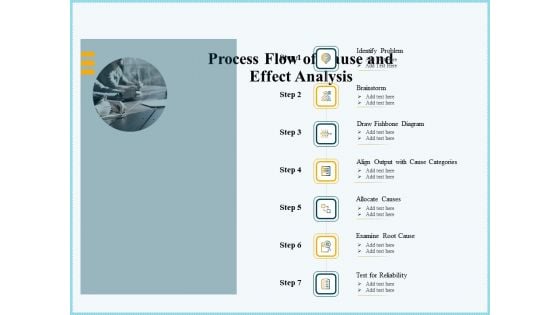
Vicious Circle Effect On Quality Assurance Process Flow Of Cause And Effect Analysis Ppt Portfolio Structure PDF
Presenting vicious circle effect on quality assurance process flow of cause and effect analysis ppt portfolio structure pdf to provide visual cues and insights. Share and navigate important information on seven stages that need your due attention. This template can be used to pitch topics like brainstorm, draw fishbone diagram, align output cause categories, allocate causes, examine root cause, test reliability, identify problem. In addtion, this PPT design contains high-resolution images, graphics, etc, that are easily editable and available for immediate download.
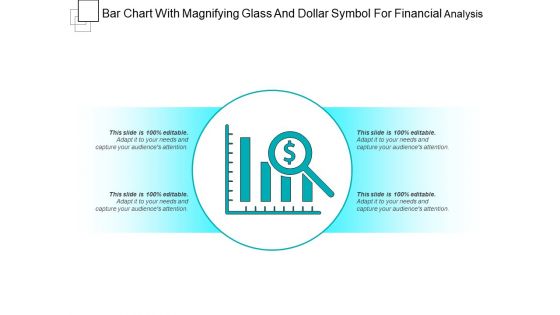
Bar Chart With Magnifying Glass And Dollar Symbol For Financial Analysis Ppt PowerPoint Presentation File Structure PDF
Presenting this set of slides with name bar chart with magnifying glass and dollar symbol for financial analysis ppt powerpoint presentation file structure pdf. This is a one stage process. The stages in this process is bar chart with magnifying glass and dollar symbol for financial analysis. This is a completely editable PowerPoint presentation and is available for immediate download. Download now and impress your audience.
RCA Action Plan For Business Cyber Security Icons PDF
This slide shows root cause analysis action plan to identify and provide strategies for overcoming cyber security threats. It include root cause, action plan and outcomes, etc. Showcasing this set of slides titled RCA Action Plan For Business Cyber Security Icons PDF Elements. The topics addressed in these templates are Root Cause, Action Plan, Outcomes. All the content presented in this PPT design is completely editable. Download it and make adjustments in color, background, font etc. as per your unique business setting.
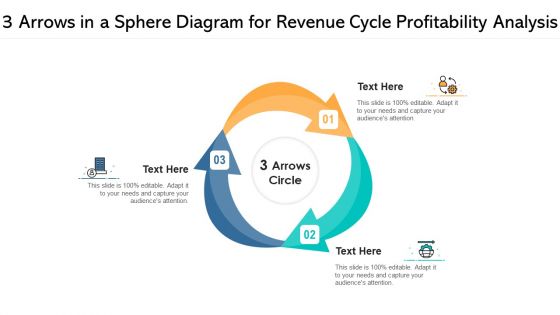
3 Arrows In A Sphere Diagram For Revenue Cycle Profitability Analysis Ppt PowerPoint Presentation Gallery Visual Aids PDF
Presenting 3 arrows in a sphere diagram for revenue cycle profitability analysis ppt powerpoint presentation gallery visual aids pdf to dispense important information. This template comprises three stages. It also presents valuable insights into the topics including 3 arrows in a sphere diagram for revenue cycle profitability analysis. This is a completely customizable PowerPoint theme that can be put to use immediately. So, download it and address the topic impactfully.
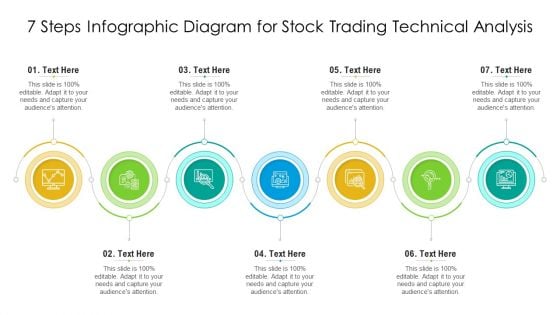
7 Steps Infographic Diagram For Stock Trading Technical Analysis Ppt PowerPoint Presentation Infographic Template Slide Portrait PDF
Persuade your audience using this 7 steps infographic diagram for stock trading technical analysis ppt powerpoint presentation infographic template slide portrait pdf. This PPT design covers seven stages, thus making it a great tool to use. It also caters to a variety of topics including 7 steps infographic diagram for stock trading technical analysis. Download this PPT design now to present a convincing pitch that not only emphasizes the topic but also showcases your presentation skills.
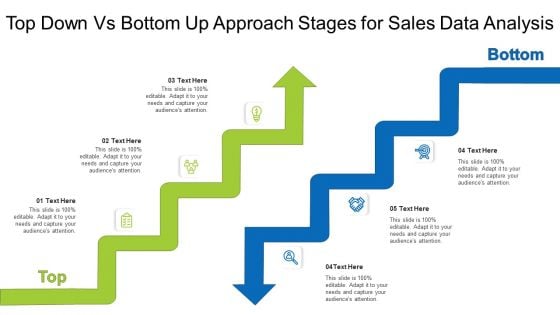
Top Down Vs Bottom Up Approach Stages For Sales Data Analysis Ppt PowerPoint Presentation Inspiration Template PDF
Presenting top down vs bottom up approach stages for sales data analysis ppt powerpoint presentation inspiration template pdf to dispense important information. This template comprises two stages. It also presents valuable insights into the topics including top down vs bottom up approach stages for sales data analysis. This is a completely customizable PowerPoint theme that can be put to use immediately. So, download it and address the topic impactfully.
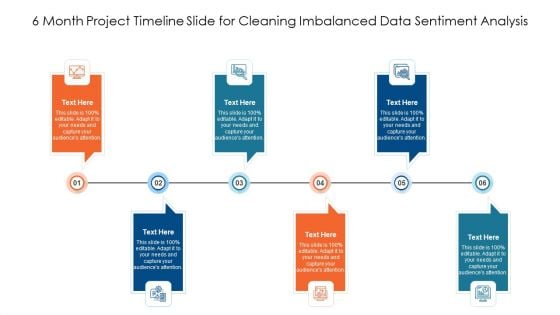
6 Month Project Timeline Slide For Cleaning Imbalanced Data Sentiment Analysis Ppt PowerPoint Presentation File Deck PDF
Presenting 6 month project timeline slide for cleaning imbalanced data sentiment analysis ppt powerpoint presentation file deck pdf to dispense important information. This template comprises six stages. It also presents valuable insights into the topics including 6 month project timeline slide for cleaning imbalanced data sentiment analysis. This is a completely customizable PowerPoint theme that can be put to use immediately. So, download it and address the topic impactfully.
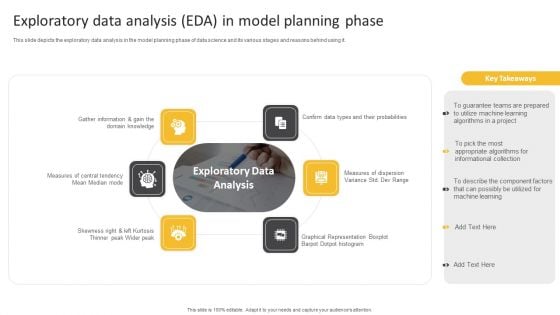
Information Science Exploratory Data Analysis EDA In Model Planning Phase Ppt PowerPoint Presentation Infographics Graphics Pictures PDF
This slide depicts the exploratory data analysis in the model planning phase of data science and its various stages and reasons behind using it.This is a Information Science Exploratory Data Analysis EDA In Model Planning Phase Ppt PowerPoint Presentation Infographics Graphics Pictures PDF template with various stages. Focus and dispense information on six stages using this creative set, that comes with editable features. It contains large content boxes to add your information on topics like Measures Dispersion, Graphical Representation, Skewness Right. You can also showcase facts, figures, and other relevant content using this PPT layout. Grab it now.
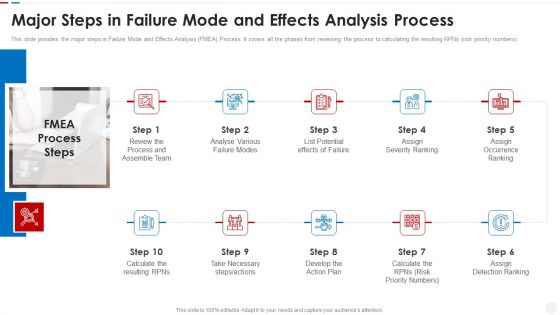
Failure Methods And Effects Assessments FMEA Major Steps In Failure Mode And Effects Analysis Process Demonstration PDF
This slide provides the major steps in Failure Mode and Effects Analysis FMEA Process. It covers all the phases from reviewing the process to calculating the resulting RPNs risk priority numbers. This is a failure methods and effects assessments fmea major steps in failure mode and effects analysis process demonstration pdf template with various stages. Focus and dispense information on ten stages using this creative set, that comes with editable features. It contains large content boxes to add your information on topics like process, team, analyse, potential, severity ranking. You can also showcase facts, figures, and other relevant content using this PPT layout. Grab it now.
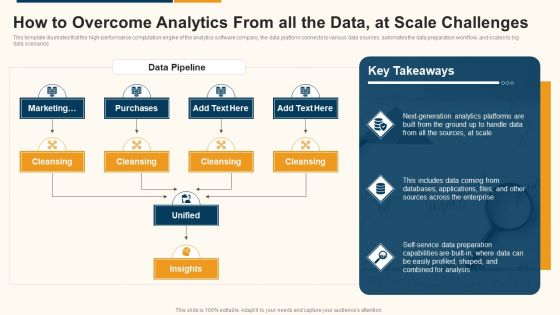
Data Interpretation And Analysis Playbook How To Overcome Analytics From All The Data At Scale Challenges Designs PDF
This template illustrates that the high-performance computation engine of the analytics software company, the data platform connects to various data sources, automates the data preparation workflow, and scales to big data scenarios. This is a data interpretation and analysis playbook how to overcome analytics from all the data at scale challenges designs pdf template with various stages. Focus and dispense information on three stages using this creative set, that comes with editable features. It contains large content boxes to add your information on topics like marketing, analysis, capabilities, service, databases, sources. You can also showcase facts, figures, and other relevant content using this PPT layout. Grab it now.
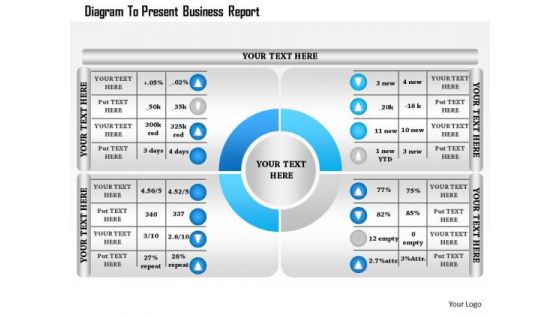
Business Diagram To Present Business Report Presentation Template
Four staged percentage personalized chart has been used to craft this power point template. This PPT contains the concept of data analysis and financial result analysis. This PPT can be used for your data and finance related topics in any business and marketing presentation.
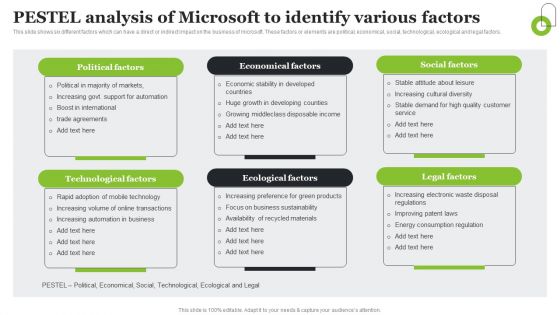
Microsoft Strategic Plan To Become Market Leader PESTLE Analysis Of Microsoft To Identify Various Factors Portrait PDF
This slide shows six different factors which can have a direct or indirect impact on the business of microsoft. These factors or elements are political, economical, social, technological, ecological and legal factors. If you are looking for a format to display your unique thoughts, then the professionally designed Microsoft Strategic Plan To Become Market Leader PESTLE Analysis Of Microsoft To Identify Various Factors Portrait PDF is the one for you. You can use it as a Google Slides template or a PowerPoint template. Incorporate impressive visuals, symbols, images, and other charts. Modify or reorganize the text boxes as you desire. Experiment with shade schemes and font pairings. Alter, share or cooperate with other people on your work. Download Microsoft Strategic Plan To Become Market Leader PESTLE Analysis Of Microsoft To Identify Various Factors Portrait PDF and find out how to give a successful presentation. Present a perfect display to your team and make your presentation unforgettable.
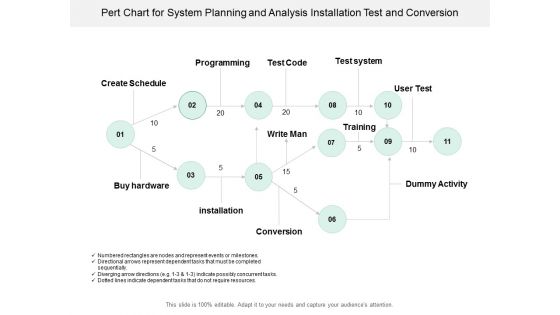
Pert Chart For System Planning And Analysis Installation Test And Conversion Ppt Powerpoint Presentation Pictures Graphics Tutorials
This is a pert chart for system planning and analysis installation test and conversion ppt powerpoint presentation pictures graphics tutorials. This is a eleven stage process. The stages in this process are pert chart, program evaluation and review technique, pert graph.
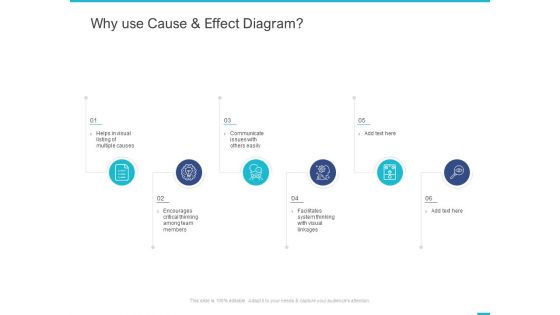
Fishbone Ishikawa Cause And Effect Analysis Why Use Cause And Effect Diagram Ppt PowerPoint Presentation Gallery Background PDF
Presenting this set of slides with name fishbone ishikawa cause and effect analysis why use cause and effect diagram ppt powerpoint presentation gallery background pdf. This is a six stage process. The stages in this process are facilitates system thinking, visual linkages, communicate. This is a completely editable PowerPoint presentation and is available for immediate download. Download now and impress your audience.
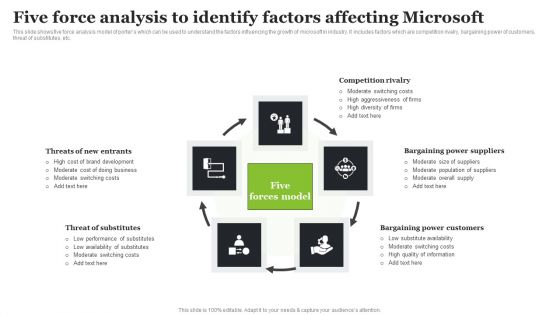
Microsoft Strategic Plan To Become Market Leader Five Force Analysis To Identify Factors Affecting Microsoft Diagrams PDF
This slide shows five force analysis model of porters which can be used to understand the factors influencing the growth of microsoft in industry. It includes factors which are competition rivalry, bargaining power of customers, threat of substitutes, etc. Do you know about Slidesgeeks Microsoft Strategic Plan To Become Market Leader Five Force Analysis To Identify Factors Affecting Microsoft Diagrams PDF These are perfect for delivering any kind od presentation. Using it, create PowerPoint presentations that communicate your ideas and engage audiences. Save time and effort by using our pre-designed presentation templates that are perfect for a wide range of topic. Our vast selection of designs covers a range of styles, from creative to business, and are all highly customizable and easy to edit. Download as a PowerPoint template or use them as Google Slides themes.
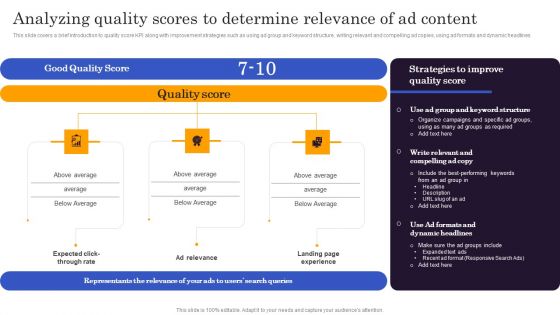
Marketers Guide To Data Analysis Optimization Analyzing Quality Scores To Determine Relevance Of Ad Content Diagrams PDF
This slide covers a brief introduction to quality score KPI along with improvement strategies such as using ad group and keyword structure, writing relevant and compelling ad copies, using ad formats and dynamic headlines. If you are looking for a format to display your unique thoughts, then the professionally designed Marketers Guide To Data Analysis Optimization Analyzing Quality Scores To Determine Relevance Of Ad Content Diagrams PDF is the one for you. You can use it as a Google Slides template or a PowerPoint template. Incorporate impressive visuals, symbols, images, and other charts. Modify or reorganize the text boxes as you desire. Experiment with shade schemes and font pairings. Alter, share or cooperate with other people on your work. Download Marketers Guide To Data Analysis Optimization Analyzing Quality Scores To Determine Relevance Of Ad Content Diagrams PDF and find out how to give a successful presentation. Present a perfect display to your team and make your presentation unforgettable.
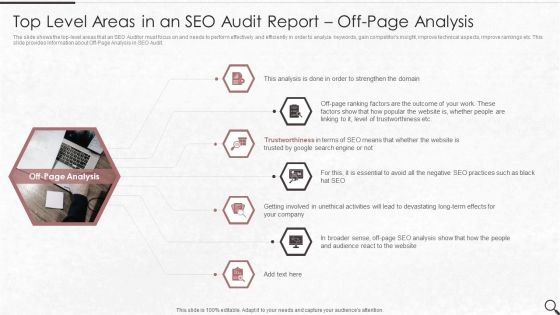
Clients Existing Website Traffic Assessment Top Level Areas In An SEO Audit Report Off Page Analysis Diagrams PDF
The slide shows the top level areas that an SEO Auditor must focus on and needs to perform effectively and efficiently in order to analyze keywords, gain competitors insight, improve technical aspects, improve rankings etc. This slide provides information about Off Page Analysis in SEO Audit.This is a Clients Existing Website Traffic Assessment Top Level Areas In An SEO Audit Report Off Page Analysis Diagrams PDF template with various stages. Focus and dispense information on seven stages using this creative set, that comes with editable features. It contains large content boxes to add your information on topics like Level Trustworthiness, Trustworthiness, Strengthen Domain. You can also showcase facts, figures, and other relevant content using this PPT layout. Grab it now.

Fishbone Ishikawa Cause And Effect Analysis What Is A Cause And Effect Diagram Ppt PowerPoint Presentation Ideas Portfolio PDF
Presenting this set of slides with name fishbone ishikawa cause and effect analysis what is a cause and effect diagram ppt powerpoint presentation ideas portfolio pdf. This is a one stage process. The stages in this process are equipment, process, specify cause category here, materials, environment, specify cause category . This is a completely editable PowerPoint presentation and is available for immediate download. Download now and impress your audience.
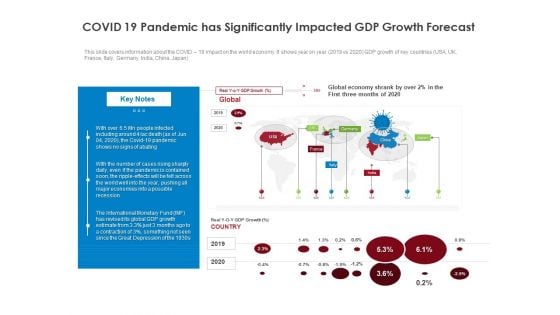
COVID 19 Risk Analysis Mitigation Policies Ocean Liner Sector COVID 19 Pandemic Has Significantly Impacted GDP Growth Forecast Themes PDF
This slide covers information about the COVID 19 impact on the world economy. It shows year on year 2019 vs 2020 GDP growth of key countries USA, UK, France, Italy, Germany, India, China, Japan. This is a covid 19 risk analysis mitigation policies ocean liner sector covid 19 pandemic has significantly impacted gdp growth forecast themes pdf template with various stages. Focus and dispense information one stage using this creative set, that comes with editable features. It contains large content boxes to add your information on topics like economies, pandemic, global, growth. You can also showcase facts, figures, and other relevant content using this PPT layout. Grab it now.
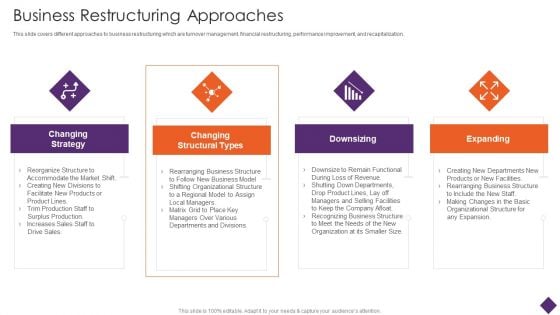
Business Restructuring Business Restructuring Approaches Ppt Ideas Layout Ideas PDF
This slide covers different approaches to business restructuring which are turnover management, financial restructuring, performance improvement, and recapitalization. This is a Business Restructuring Business Restructuring Approaches Ppt Ideas Layout Ideas PDF template with various stages. Focus and dispense information on four stages using this creative set, that comes with editable features. It contains large content boxes to add your information on topics like Changing Strategy Downsizing, Changing Structural Types. You can also showcase facts, figures, and other relevant content using this PPT layout. Grab it now.
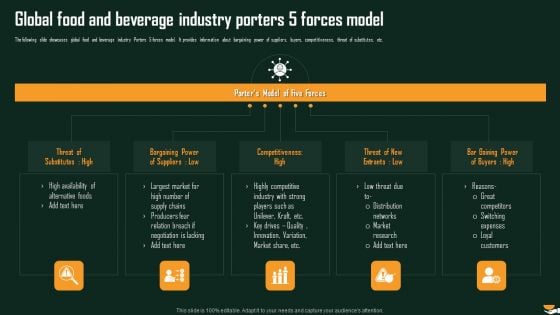
Global Food And Beverage Industry Porters 5 Forces Model International Food And Beverages Sector Analysis Mockup PDF
The following slide showcases global food and beverage industry Porters 5 forces model. It provides information about bargaining power of suppliers, buyers, competitiveness, threat of substitutes, etc. This is a Global Food And Beverage Industry Porters 5 Forces Model International Food And Beverages Sector Analysis Mockup PDF template with various stages. Focus and dispense information on five stages using this creative set, that comes with editable features. It contains large content boxes to add your information on topics like Competitiveness High, Threat Substitutes, Distribution. You can also showcase facts, figures, and other relevant content using this PPT layout. Grab it now.
Business Milestones Powerpoint Presentation Templates
This is a business milestones powerpoint presentation templates. This is a six stage process. The stages in this process are business, marketing, icon, presentation, management.
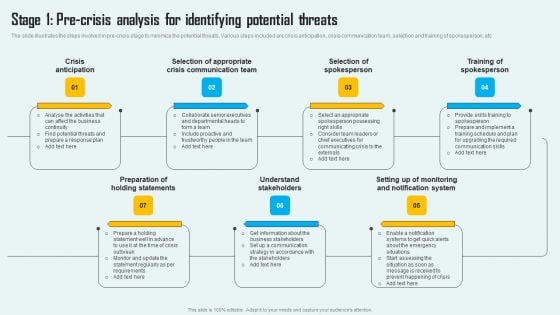
Key Phase Of Crisis Communication Management Plan Stage 1 Pre Crisis Analysis For Identifying Potential Threats Mockup PDF
The slide illustrates the steps involved in pre-crisis stage to minimize the potential threats. Various steps included are crisis anticipation, crisis communication team, selection and training of spokesperson, etc Coming up with a presentation necessitates that the majority of the effort goes into the content and the message you intend to convey. The visuals of a PowerPoint presentation can only be effective if it supplements and supports the story that is being told. Keeping this in mind our experts created Key Phase Of Crisis Communication Management Plan Stage 1 Pre Crisis Analysis For Identifying Potential Threats Mockup PDF to reduce the time that goes into designing the presentation. This way, you can concentrate on the message while our designers take care of providing you with the right template for the situation.
Data Requirements For Analytics Impact On Business Performance Icons PDF
This slide illustrates data requirement analysis impact before and after data collection on business performance. It also includes benefits such as business process improvement, understanding of customer likings and prompt decision making. Showcasing this set of slides titled data requirements for analytics impact on business performance icons pdf. The topics addressed in these templates are goals, business, process. All the content presented in this PPT design is completely editable. Download it and make adjustments in color, background, font etc. as per your unique business setting.
Various Stages Of Business Environmental Scanning Icons PDF
Following slide exhibits stages of business environment analysis that helps to gain competitive edge and sustainability. It includes pointers such as scanning, monitoring, forecasting etc. Explore a selection of the finest Various Stages Of Business Environmental Scanning Icons PDF here. With a plethora of professionally designed and pre-made slide templates, you can quickly and easily find the right one for your upcoming presentation. You can use our Various Stages Of Business Environmental Scanning Icons PDF to effectively convey your message to a wider audience. Slidegeeks has done a lot of research before preparing these presentation templates. The content can be personalized and the slides are highly editable. Grab templates today from Slidegeeks.
Tools For HR Business Analytics Application Of Business Intelligence In HR Operations Icons PDF
This slide represents the various ways in which business intelligence is applied in human resource operations. It includes application of business intelligence in HR department for aggregating data, data visualization and data analysis. Create an editable Tools For HR Business Analytics Application Of Business Intelligence In HR Operations Icons PDF that communicates your idea and engages your audience. Whether youre presenting a business or an educational presentation, pre-designed presentation templates help save time. Tools For HR Business Analytics Application Of Business Intelligence In HR Operations Icons PDF is highly customizable and very easy to edit, covering many different styles from creative to business presentations. Slidegeeks has creative team members who have crafted amazing templates. So, go and get them without any delay.
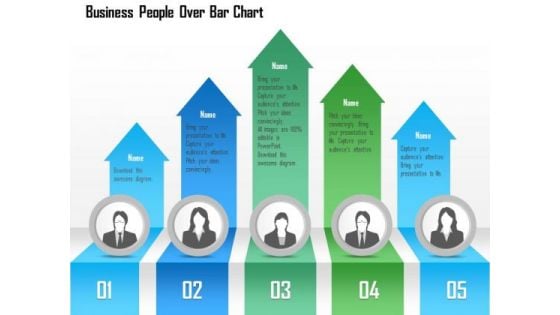
Business Diagram Business People Over Bar Chart PowerPoint Template
This Power Point template has been designed with graphic of business people and bar chart. This PPT contains the concept of result analysis and business data display. Use this PPT slide for your business and marketing related presentations.
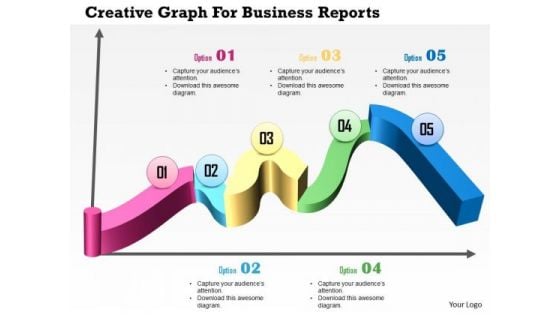
Business Diagram Creative Graph For Business Reports Presentation Template
Download this diagram to display planning and analysis concepts. This business diagram contains the graphic of creative graph for business reports. Use this template to highlight the key issues of your presentation.
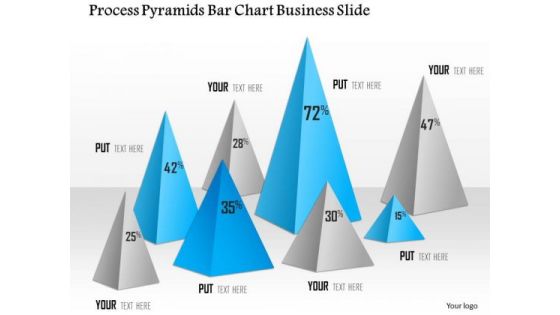
Business Diagram Process Pyramids Bar Chart Business Slide Presentation Template
Graphic of pyramid and bar chart has been used to design this power point template diagram. This PPT diagram contains the concept of business result analysis and process flow. Use this template slide and display result in your presentations.
Business To Business Digital Building Ad Sets And Ads Placements Icons PDF
This template covers the five-step account-based marketing approach. The strategy includes identification and profiling of accounts by the sales team, creating content, and launching campaigns by the marketing team. Lastly, it includes campaign performance measurement and analysis. Slidegeeks is one of the best resources for PowerPoint templates. You can download easily and regulate Business To Business Digital Building Ad Sets And Ads Placements Icons PDF for your personal presentations from our wonderful collection. A few clicks is all it takes to discover and get the most relevant and appropriate templates. Use our Templates to add a unique zing and appeal to your presentation and meetings. All the slides are easy to edit and you can use them even for advertisement purposes.
Business Diagram Illustration Of Light Bulb With Business Icons Presentation Template
This diagram of light bulb with business icons is useful to share brilliant ideas with your audiences. This diagram may also be used to create a business plan. This Professional diagram helps you to make a well-organized presentation.
Assessing The Impact Of COVID On Retail Business Segment Business Impact Assessment Icons PDF
Presenting this set of slides with name assessing the impact of covid on retail business segment business impact assessment icons pdf. The topics discussed in these slides are critical function, critical function priority, technology, time, information, suppliers and partners. This is a completely editable PowerPoint presentation and is available for immediate download. Download now and impress your audience.
Reshaping Business In Digital How Big Data Analytics Is Transforming The Business Icons PDF
This slide covers the impact of analytics on different departments in the business especially in R and D, sales and marketing, supply chain management, etc. Deliver an awe inspiring pitch with this creative Reshaping Business In Digital How Big Data Analytics Is Transforming The Business Icons PDF bundle. Topics like Sales And Marketing, Workplace Management, Moderate Change can be discussed with this completely editable template. It is available for immediate download depending on the needs and requirements of the user.
Business Management Research Your Investment For Business Research Plan Services Price Icons PDF
Presenting this set of slides with name business management research your investment for business research plan services price icons pdf. The topics discussed in these slides are opinion polls and political surveys, healthcare research, pr research, retail research. This is a completely editable PowerPoint presentation and is available for immediate download. Download now and impress your audience.
Impact Of Artificial Intelligence In Business Deploying Artificial Intelligence In Business Icons PDF
This pie chart focuses on the impact of AI after being implemented in the business such as rising revenues, better customer experience, improved decision making, etc.Deliver and pitch your topic in the best possible manner with this Impact Of Artificial Intelligence In Business Deploying Artificial Intelligence In Business Icons PDF. Use them to share invaluable insights on Improves Customer, Experience Support, Technologies Makes and impress your audience. This template can be altered and modified as per your expectations. So, grab it now.
Business To Business Competitor Tracking Ppt PowerPoint Presentation Pictures Icons Cpb
Presenting this set of slides with name business to business competitor tracking ppt powerpoint presentation pictures icons cpb. This is an editable Powerpoint one stages graphic that deals with topics like business to business competitor tracking to help convey your message better graphically. This product is a premium product available for immediate download and is 100 percent editable in Powerpoint. Download this now and use it in your presentations to impress your audience.
Icons Slide Digital Approaches To Increase Business Growth Infographics Pdf
Introducing our well designed Icons Slide Digital Approaches To Increase Business Growth Infographics Pdf set of slides. The slide displays editable icons to enhance your visual presentation. The icons can be edited easily. So customize according to your business to achieve a creative edge. Download and share it with your audience. Our Icons Slide Digital Approaches To Increase Business Growth Infographics Pdf are topically designed to provide an attractive backdrop to any subject. Use them to look like a presentation pro.
Business Diagram Multiple Icons In Human Brain For Business Presentation Template
This business diagram displays multiple icons on human brain. This slide contains the concept of idea generation, thinking and innovation. Use this slide to build a quality presentation for your viewers.

 Home
Home