Business Analytics Project
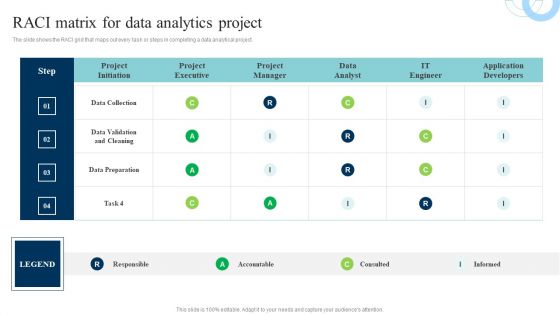
Data Evaluation And Processing Toolkit Raci Matrix For Data Analytics Project Infographics PDF
The slide shows the RACI grid that maps out every task or steps in completing a data analytical project. Whether you have daily or monthly meetings, a brilliant presentation is necessary. Data Evaluation And Processing Toolkit Raci Matrix For Data Analytics Project Infographics PDF can be your best option for delivering a presentation. Represent everything in detail using Data Evaluation And Processing Toolkit Raci Matrix For Data Analytics Project Infographics PDF and make yourself stand out in meetings. The template is versatile and follows a structure that will cater to your requirements. All the templates prepared by Slidegeeks are easy to download and edit. Our research experts have taken care of the corporate themes as well. So, give it a try and see the results.
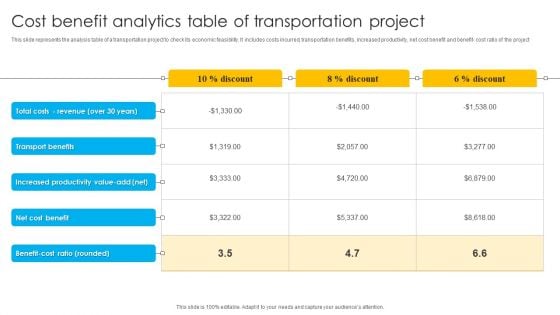
Cost Benefit Analytics Table Of Transportation Project Ppt Ideas Deck PDF
This slide represents the analysis table of a transportation project to check its economic feasibility. It includes costs incurred, transportation benefits, increased productivity, net cost benefit and benefit- cost ratio of the project. Showcasing this set of slides titled Cost Benefit Analytics Table Of Transportation Project Ppt Ideas Deck PDF. The topics addressed in these templates are Transport Benefits, Net Cost Benefit, Benefit Cost Ratio. All the content presented in this PPT design is completely editable. Download it and make adjustments in color, background, font etc. as per your unique business setting.
Transformation Toolkit Competitive Intelligence Information Analysis Key Steps For Predictive Data Analytics Project Icons PDF
The slide shows the predictive data analytics process focusing on data analysis, machine learning, predictive modelling and monitoring. Are you searching for a Transformation Toolkit Competitive Intelligence Information Analysis Key Steps For Predictive Data Analytics Project Icons PDF that is uncluttered, straightforward, and original Its easy to edit, and you can change the colors to suit your personal or business branding. For a presentation that expresses how much effort you have put in, this template is ideal With all of its features, including tables, diagrams, statistics, and lists, its perfect for a business plan presentation. Make your ideas more appealing with these professional slides. Download Transformation Toolkit Competitive Intelligence Information Analysis Key Steps For Predictive Data Analytics Project Icons PDF from Slidegeeks today.
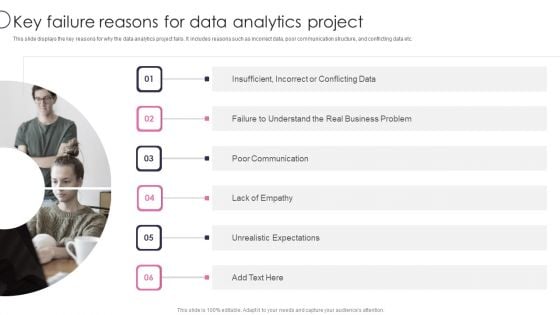
Information Transformation Process Toolkit Key Failure Reasons For Data Analytics Project Guidelines PDF
This slide displays the key reasons for why the data analytics project fails. It includes reasons such as incorrect data, poor communication structure, and conflicting data etc. This is a Information Transformation Process Toolkit Key Failure Reasons For Data Analytics Project Guidelines PDF template with various stages. Focus and dispense information on six stages using this creative set, that comes with editable features. It contains large content boxes to add your information on topics like Unrealistic Expectations, Real Business Problem, Poor Communication. You can also showcase facts, figures, and other relevant content using this PPT layout. Grab it now.
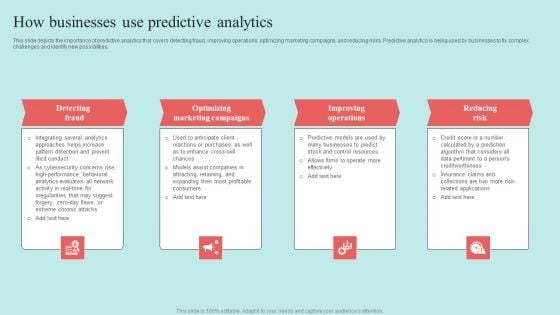
Predictive Data Model How Businesses Use Predictive Analytics Topics PDF

Tools For HR Business Analytics Analysis Of Business Intelligence Requirement In HR Slides PDF
This slide represents the need for implementing business intelligence in HR operations. It represents the requirement of prediction of employee performance for which BI is required. Boost your pitch with our creative Tools For HR Business Analytics Analysis Of Business Intelligence Requirement In HR Slides PDF. Deliver an awe-inspiring pitch that will mesmerize everyone. Using these presentation templates you will surely catch everyones attention. You can browse the ppts collection on our website. We have researchers who are experts at creating the right content for the templates. So you dont have to invest time in any additional work. Just grab the template now and use them.
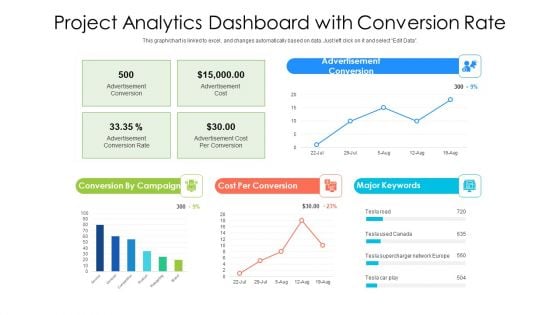
Project Analytics Dashboard With Conversion Rate Ppt PowerPoint Presentation File Deck PDF
Pitch your topic with ease and precision using this project analytics dashboard with conversion rate ppt powerpoint presentation gallery graphics template pdf. This layout presents information on cost per conversion, supercharger network, advertisement conversion, conversion by campaign. It is also available for immediate download and adjustment. So, changes can be made in the color, design, graphics or any other component to create a unique layout.
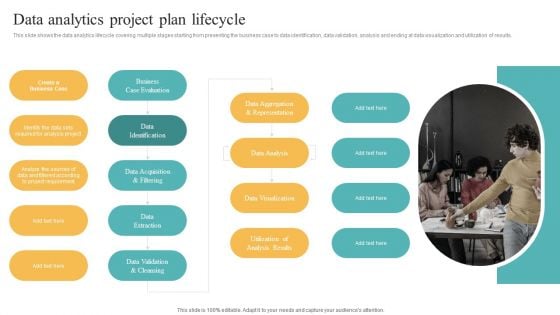
Data Analytics Project Plan Lifecycle Transformation Toolkit Competitive Intelligence Information Analysis Professional PDF
This slide shows the data analytics lifecycle covering multiple stages starting from presenting the business case to data identification, data validation, analysis and ending at data visualization and utilization of results. Want to ace your presentation in front of a live audience Our Data Analytics Project Plan Lifecycle Transformation Toolkit Competitive Intelligence Information Analysis Professional PDF can help you do that by engaging all the users towards you. Slidegeeks experts have put their efforts and expertise into creating these impeccable powerpoint presentations so that you can communicate your ideas clearly. Moreover, all the templates are customizable, and easy to edit and downloadable. Use these for both personal and commercial use.
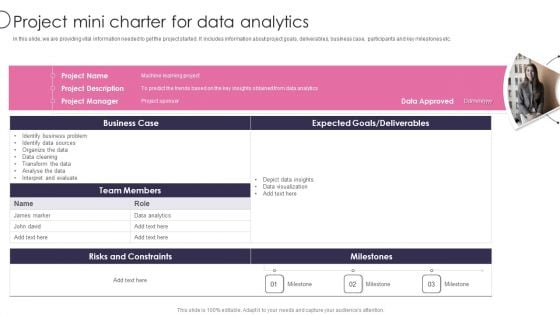
Information Transformation Process Toolkit Project Mini Charter For Data Analytics Background PDF
In this slide, we are providing vital information needed to get the project started. It includes information about project goals, deliverables, business case, participants and key milestones etc. Presenting Information Transformation Process Toolkit Project Mini Charter For Data Analytics Background PDF to provide visual cues and insights. Share and navigate important information on one stages that need your due attention. This template can be used to pitch topics like Team Members, Risks And Constraints, Data Analytics. In addtion, this PPT design contains high resolution images, graphics, etc, that are easily editable and available for immediate download.
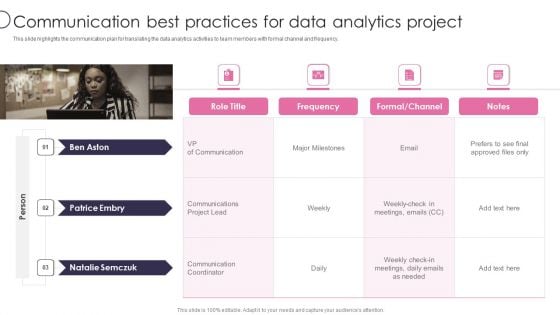
Information Transformation Process Toolkit Communication Best Practices For Data Analytics Project Professional PDF
This slide highlights the communication plan for translating the data analytics activities to team members with formal channel and frequency. Presenting Information Transformation Process Toolkit Communication Best Practices For Data Analytics Project Professional PDF to provide visual cues and insights. Share and navigate important information on four stages that need your due attention. This template can be used to pitch topics like Communication Best Practices, Data Analytics Project. In addtion, this PPT design contains high resolution images, graphics, etc, that are easily editable and available for immediate download.
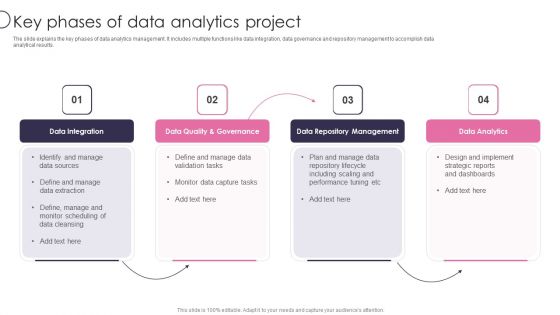
Information Transformation Process Toolkit Key Phases Of Data Analytics Project Summary PDF
The slide explains the key phases of data analytics management. It includes multiple functions like data integration, data governance and repository management to accomplish data analytical results. This is a Information Transformation Process Toolkit Key Phases Of Data Analytics Project Summary PDF template with various stages. Focus and dispense information on four stages using this creative set, that comes with editable features. It contains large content boxes to add your information on topics like Data Integration, Data Repository Management, Data Analytics. You can also showcase facts, figures, and other relevant content using this PPT layout. Grab it now.
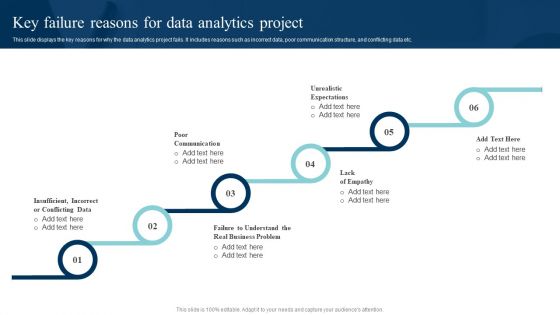
Data Evaluation And Processing Toolkit Key Failure Reasons For Data Analytics Project Information PDF
This slide displays the key reasons for why the data analytics project fails. It includes reasons such as incorrect data, poor communication structure, and conflicting data etc. This Data Evaluation And Processing Toolkit Key Failure Reasons For Data Analytics Project Information PDF from Slidegeeks makes it easy to present information on your topic with precision. It provides customization options, so you can make changes to the colors, design, graphics, or any other component to create a unique layout. It is also available for immediate download, so you can begin using it right away. Slidegeeks has done good research to ensure that you have everything you need to make your presentation stand out. Make a name out there for a brilliant performance.
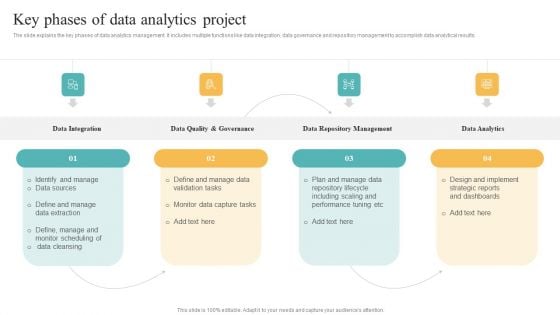
Transformation Toolkit Competitive Intelligence Information Analysis Key Phases Of Data Analytics Project Template PDF
The slide explains the key phases of data analytics management. It includes multiple functions like data integration, data governance and repository management to accomplish data analytical results. Explore a selection of the finest Transformation Toolkit Competitive Intelligence Information Analysis Key Phases Of Data Analytics Project Template PDF here. With a plethora of professionally designed and pre made slide templates, you can quickly and easily find the right one for your upcoming presentation. You can use our Transformation Toolkit Competitive Intelligence Information Analysis Key Phases Of Data Analytics Project Template PDF to effectively convey your message to a wider audience. Slidegeeks has done a lot of research before preparing these presentation templates. The content can be personalized and the slides are highly editable. Grab templates today from Slidegeeks.
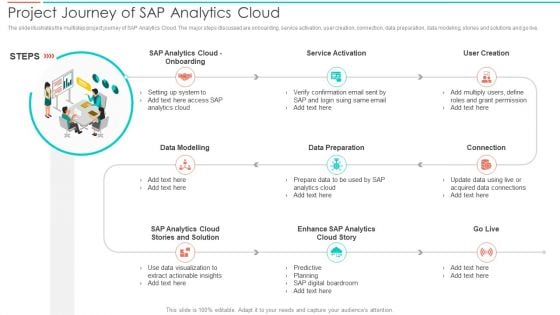
SAC Planning And Implementation Project Journey Of SAP Analytics Cloud Inspiration PDF
The slide illustrates the multistep project journey of SAP Analytics Cloud. The major steps discussed are onboarding, service activation, user creation, connection, data preparation, data modeling, stories and solutions and go live. This is a SAC Planning And Implementation Project Journey Of SAP Analytics Cloud Inspiration PDF template with various stages. Focus and dispense information on nine stages using this creative set, that comes with editable features. It contains large content boxes to add your information on topics like Data Modelling, Data Preparation, Service Activation. You can also showcase facts, figures, and other relevant content using this PPT layout. Grab it now.

Data Evaluation And Processing Toolkit Key Phases Of Data Analytics Project Professional PDF
The slide explains the key phases of data analytics management. It includes multiple functions like data integration, data governance and repository management to accomplish data analytical results. Boost your pitch with our creative Data Evaluation And Processing Toolkit Key Phases Of Data Analytics Project Professional PDF. Deliver an awe-inspiring pitch that will mesmerize everyone. Using these presentation templates you will surely catch everyones attention. You can browse the ppts collection on our website. We have researchers who are experts at creating the right content for the templates. So you dont have to invest time in any additional work. Just grab the template now and use them.
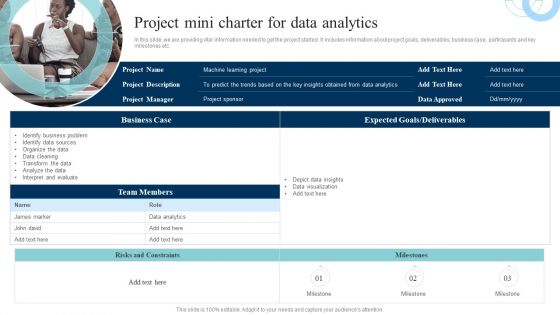
Data Evaluation And Processing Toolkit Project Mini Charter For Data Analytics Structure PDF
In this slide, we are providing vital information needed to get the project started. It includes information about project goals, deliverables, business case, participants and key milestones etc. Slidegeeks is here to make your presentations a breeze with Data Evaluation And Processing Toolkit Project Mini Charter For Data Analytics Structure PDF With our easy-to-use and customizable templates, you can focus on delivering your ideas rather than worrying about formatting. With a variety of designs to choose from, youre sure to find one that suits your needs. And with animations and unique photos, illustrations, and fonts, you can make your presentation pop. So whether youre giving a sales pitch or presenting to the board, make sure to check out Slidegeeks first.
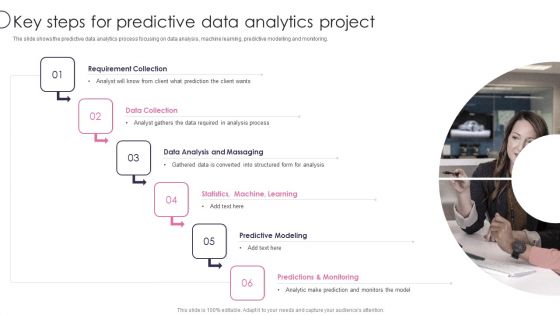
Information Transformation Process Toolkit Key Steps For Predictive Data Analytics Project Introduction PDF
The slide shows the predictive data analytics process focusing on data analysis, machine learning, predictive modelling and monitoring. Presenting Information Transformation Process Toolkit Key Steps For Predictive Data Analytics Project Introduction PDF to provide visual cues and insights. Share and navigate important information on six stages that need your due attention. This template can be used to pitch topics like Data Analysis And Massaging, Data Collection, Requirement Collection. In addtion, this PPT design contains high resolution images, graphics, etc, that are easily editable and available for immediate download.
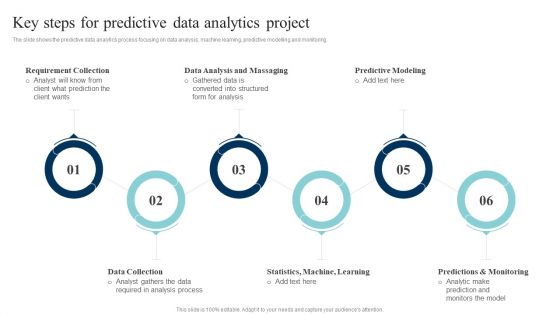
Data Evaluation And Processing Toolkit Key Steps For Predictive Data Analytics Project Portrait PDF
The slide shows the predictive data analytics process focusing on data analysis, machine learning, predictive modelling and monitoring. Want to ace your presentation in front of a live audience Our Data Evaluation And Processing Toolkit Key Steps For Predictive Data Analytics Project Portrait PDF can help you do that by engaging all the users towards you. Slidegeeks experts have put their efforts and expertise into creating these impeccable powerpoint presentations so that you can communicate your ideas clearly. Moreover, all the templates are customizable, and easy-to-edit and downloadable. Use these for both personal and commercial use.

Transformation Toolkit Competitive Intelligence Information Analysis Key Reasons For Failure Of Data Analytics Project Portrait PDF
This slide describes a list of key reasons responsible for the failure of delivering accurate data analytics results to the business. The best PPT templates are a great way to save time, energy, and resources. Slidegeeks have 100 percent editable powerpoint slides making them incredibly versatile. With these quality presentation templates, you can create a captivating and memorable presentation by combining visually appealing slides and effectively communicating your message. Download Transformation Toolkit Competitive Intelligence Information Analysis Key Reasons For Failure Of Data Analytics Project Portrait PDF from Slidegeeks and deliver a wonderful presentation.
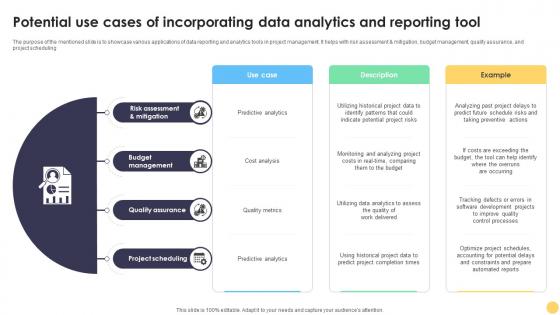
Digital Project Management Strategies Potential Use Cases Of Incorporating Data Analytics And Reporting
The purpose of the mentioned slide is to showcase various applications of data reporting and analytics tools in project management. It helps with risk assessment and mitigation, budget management, quality assurance, and project scheduling. The Digital Project Management Strategies Potential Use Cases Of Incorporating Data Analytics And Reporting is a compilation of the most recent design trends as a series of slides. It is suitable for any subject or industry presentation, containing attractive visuals and photo spots for businesses to clearly express their messages. This template contains a variety of slides for the user to input data, such as structures to contrast two elements, bullet points, and slides for written information. Slidegeeks is prepared to create an impression. The purpose of the mentioned slide is to showcase various applications of data reporting and analytics tools in project management. It helps with risk assessment and mitigation, budget management, quality assurance, and project scheduling.
Transformation Toolkit Competitive Intelligence Information Analysis Key Failure Reasons For Data Analytics Project Icons PDF
This slide displays the key reasons for why the data analytics project fails. It includes reasons such as incorrect data, poor communication structure, and conflicting data etc. Coming up with a presentation necessitates that the majority of the effort goes into the content and the message you intend to convey. The visuals of a PowerPoint presentation can only be effective if it supplements and supports the story that is being told. Keeping this in mind our experts created Transformation Toolkit Competitive Intelligence Information Analysis Key Failure Reasons For Data Analytics Project Icons PDF to reduce the time that goes into designing the presentation. This way, you can concentrate on the message while our designers take care of providing you with the right template for the situation.

Information Transformation Process Toolkit RACI Matrix For Data Analytics Project Portrait PDF
Presenting Information Transformation Process Toolkit RACI Matrix For Data Analytics Project Portrait PDF to provide visual cues and insights. Share and navigate important information on four stages that need your due attention. This template can be used to pitch topics like Responsible, Accountable, Consulted, Informed. In addtion, this PPT design contains high resolution images, graphics, etc, that are easily editable and available for immediate download.
Client Testimonials For Big Analytics Project Proposal One Pager Sample Example Document
Presenting you an exemplary Client Testimonials For Big Analytics Project Proposal One Pager Sample Example Document. Our one-pager comprises all the must-have essentials of an inclusive document. You can edit it with ease, as its layout is completely editable. With such freedom, you can tweak its design and other elements to your requirements. Download this Client Testimonials For Big Analytics Project Proposal One Pager Sample Example Document brilliant piece now.
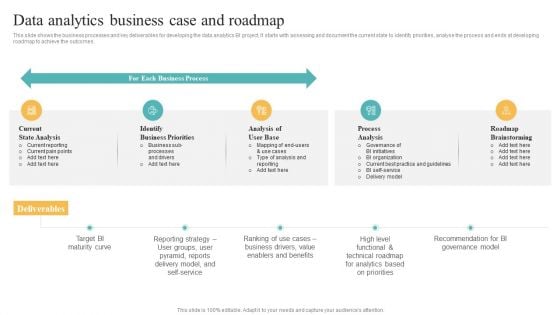
Data Analytics Business Case And Roadmap Transformation Toolkit Competitive Intelligence Information Themes PDF
This slide shows the business processes and key deliverables for developing the data analytics BI project. It starts with assessing and document the current state to identify priorities, analyse the process and ends at developing roadmap to achieve the outcomes. Create an editable Data Analytics Business Case And Roadmap Transformation Toolkit Competitive Intelligence Information Themes PDF that communicates your idea and engages your audience. Whether you are presenting a business or an educational presentation, pre designed presentation templates help save time. Data Analytics Business Case And Roadmap Transformation Toolkit Competitive Intelligence Information Themes PDF is highly customizable and very easy to edit, covering many different styles from creative to business presentations. Slidegeeks has creative team members who have crafted amazing templates. So, go and get them without any delay.
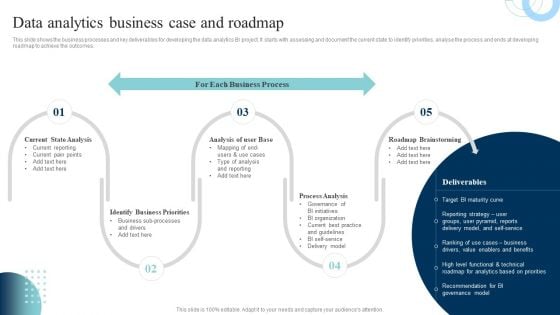
Data Evaluation And Processing Toolkit Data Analytics Business Case And Roadmap Guidelines PDF
This slide shows the business processes and key deliverables for developing the data analytics BI project. It starts with assessing and document the current state to identify priorities, analyse the process and ends at developing roadmap to achieve the outcomes. Find highly impressive Data Evaluation And Processing Toolkit Data Analytics Business Case And Roadmap Guidelines PDF on Slidegeeks to deliver a meaningful presentation. You can save an ample amount of time using these presentation templates. No need to worry to prepare everything from scratch because Slidegeeks experts have already done a huge research and work for you. You need to download Data Evaluation And Processing Toolkit Data Analytics Business Case And Roadmap Guidelines PDF for your upcoming presentation. All the presentation templates are 100 percent editable and you can change the color and personalize the content accordingly. Download now.
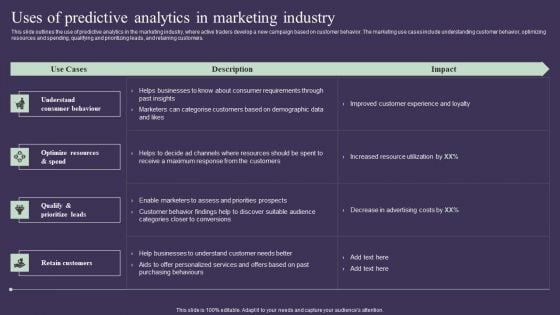
Projection Model Uses Of Predictive Analytics In Marketing Industry Infographics PDF
This slide outlines the use of predictive analytics in the marketing industry, where active traders develop a new campaign based on customer behavior. The marketing use cases include understanding customer behavior, optimizing resources and spending, qualifying and prioritizing leads, and retaining customers. Make sure to capture your audiences attention in your business displays with our gratis customizable Projection Model Uses Of Predictive Analytics In Marketing Industry Infographics PDF. These are great for business strategies, office conferences, capital raising or task suggestions. If you desire to acquire more customers for your tech business and ensure they stay satisfied, create your own sales presentation with these plain slides.
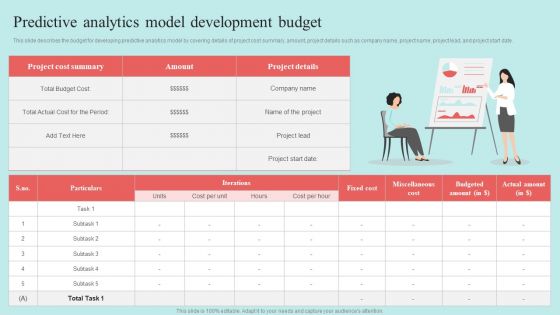
Predictive Data Model Predictive Analytics Model Development Budget Download PDF

Big Data Analytics Resources Database Ppt PowerPoint Presentation Complete Deck
Presenting this set of slides with name big data analytics resources database ppt powerpoint presentation complete deck. The topics discussed in these slides are analytical, development, resources, database, project lifecycle. This is a completely editable PowerPoint presentation and is available for immediate download. Download now and impress your audience.
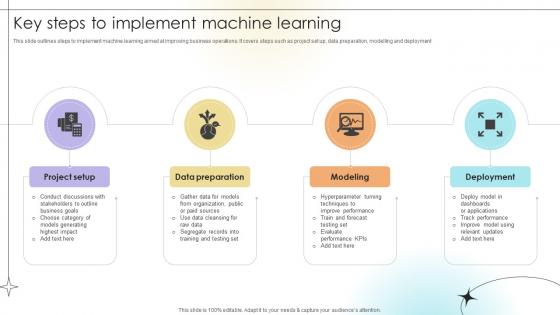
Key Steps To Implement Machine Learning Data Analytics SS V
This slide outlines steps to implement machine learning aimed at improving business operations. It covers steps such as project set up, data preparation, modelling and deployment. Whether you have daily or monthly meetings, a brilliant presentation is necessary. Key Steps To Implement Machine Learning Data Analytics SS V can be your best option for delivering a presentation. Represent everything in detail using Key Steps To Implement Machine Learning Data Analytics SS V and make yourself stand out in meetings. The template is versatile and follows a structure that will cater to your requirements. All the templates prepared by Slidegeeks are easy to download and edit. Our research experts have taken care of the corporate themes as well. So, give it a try and see the results. This slide outlines steps to implement machine learning aimed at improving business operations. It covers steps such as project set up, data preparation, modelling and deployment.
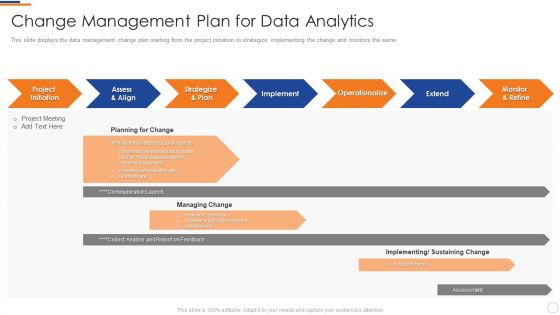
Business Intelligence And Big Change Management Plan For Data Analytics Themes PDF
This slide displays the data management change plan starting from the project initiation to strategize, implementing the change and monitors the same. Deliver and pitch your topic in the best possible manner with this business intelligence and big change management plan for data analytics themes pdf. Use them to share invaluable insights on project initiation, assess and align, strategize and plan, implement, operationalize and impress your audience. This template can be altered and modified as per your expectations. So, grab it now.
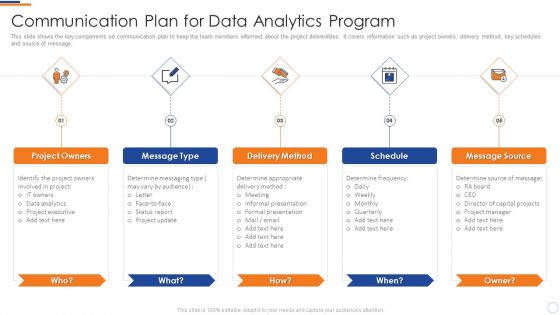
Communication Plan For Program Business Intelligence And Big Data Analytics Slides PDF
This slide shows the key components od communication plan to keep the team members informed about the project deliverables. It covers information such as project owners, delivery method, key schedules and source of message.Presenting communication plan for program business intelligence and big data analytics slides pdf to provide visual cues and insights. Share and navigate important information on five stages that need your due attention. This template can be used to pitch topics like project owners, message type, delivery method, schedule, message source. In addtion, this PPT design contains high resolution images, graphics, etc, that are easily editable and available for immediate download.
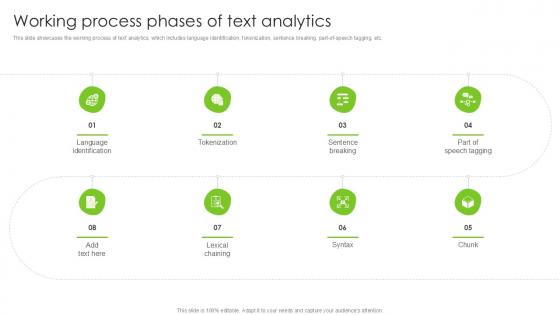
Working Process Phases Of Text Analytics PPT Slide SS
This slide showcases the working process of text analytics, which includes language identification, tokenization, sentence breaking, part-of-speech tagging, etc. Take your projects to the next level with our ultimate collection of Working Process Phases Of Text Analytics PPT Slide SS. Slidegeeks has designed a range of layouts that are perfect for representing task or activity duration, keeping track of all your deadlines at a glance. Tailor these designs to your exact needs and give them a truly corporate look with your own brand colors they will make your projects stand out from the rest This slide showcases the working process of text analytics, which includes language identification, tokenization, sentence breaking, part-of-speech tagging, etc.
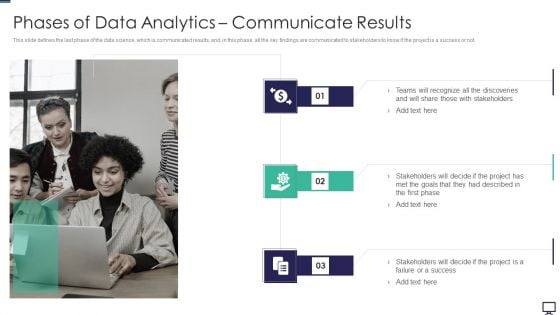
Phases Of Data Analytics Communicate Results Ppt Ideas Inspiration PDF
This slide defines the last phase of the data science, which is communicated results, and, in this phase, all the key findings are communicated to stakeholders to know if the project is a success or not. Presenting phases of data analytics communicate results ppt ideas inspiration pdf to provide visual cues and insights. Share and navigate important information on three stages that need your due attention. This template can be used to pitch topics like goals, project. In addtion, this PPT design contains high resolution images, graphics, etc, that are easily editable and available for immediate download.
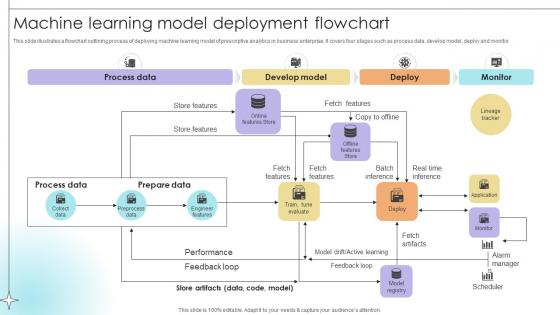
Machine Learning Model Deployment Flowchart Data Analytics SS V
This slide illustrates a flowchart outlining process of deploying machine learning model of prescriptive analytics in business enterprise. It covers four stages such as process data, develop model, deploy and monitor.If your project calls for a presentation, then Slidegeeks is your go-to partner because we have professionally designed, easy-to-edit templates that are perfect for any presentation. After downloading, you can easily edit Machine Learning Model Deployment Flowchart Data Analytics SS V and make the changes accordingly. You can rearrange slides or fill them with different images. Check out all the handy templates This slide illustrates a flowchart outlining process of deploying machine learning model of prescriptive analytics in business enterprise. It covers four stages such as process data, develop model, deploy and monitor.

Using Behavioral Analytics For Multiple Transactions And Profiles Pictures PDF
The following slide illustrates usage of behavioral analytics for multiple transactions and profiles. It provides information about transaction, collaborative, behavior sorted, user defined, global intelligent, merchant, risk sensitivity, false positives, financial crimes, etc. If your project calls for a presentation, then Slidegeeks is your go to partner because we have professionally designed, easy to edit templates that are perfect for any presentation. After downloading, you can easily edit Using Behavioral Analytics For Multiple Transactions And Profiles Pictures PDF and make the changes accordingly. You can rearrange slides or fill them with different images. Check out all the handy templates.
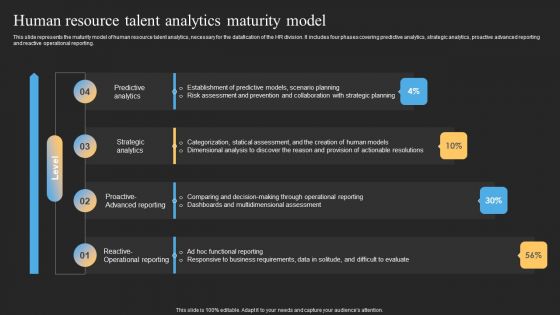
Datafy Human Resource Talent Analytics Maturity Model Microsoft PDF
This slide represents the maturity model of human resource talent analytics, necessary for the datafication of the HR division. It includes four phases covering predictive analytics, strategic analytics, proactive advanced reporting and reactive operational reporting. If your project calls for a presentation, then Slidegeeks is your go-to partner because we have professionally designed, easy-to-edit templates that are perfect for any presentation. After downloading, you can easily edit Datafy Human Resource Talent Analytics Maturity Model Microsoft PDF and make the changes accordingly. You can rearrange slides or fill them with different images. Check out all the handy templates
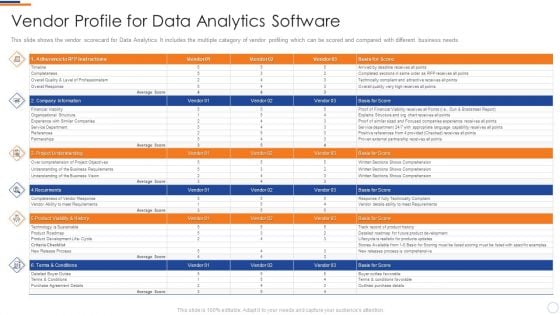
Business Intelligence And Vendor Profile For Data Analytics Software Topics PDF
This slide shows the vendor scorecard for Data Analytics. It includes the multiple category of vendor profiling which can be scored and compared with different business needs. Deliver an awe inspiring pitch with this creative business intelligence and vendor profile for data analytics software topics pdf bundle. Topics like company information, project understanding, recruitments, product viability and history can be discussed with this completely editable template. It is available for immediate download depending on the needs and requirements of the user.

Building Material And Expenses Analytics For Construction Site Designs PDF
This slide shows statistics for cash outflow in first six months of project and material requirement with rate per unit for build up area of 1000 SQFT. It includes details about fittings, cement, finishers, sand, steel, etc. Showcasing this set of slides titled Building Material And Expenses Analytics For Construction Site Designs PDF. The topics addressed in these templates are Building Material, Material Quantity, Construction Site. All the content presented in this PPT design is completely editable. Download it and make adjustments in color, background, font etc. as per your unique business setting.
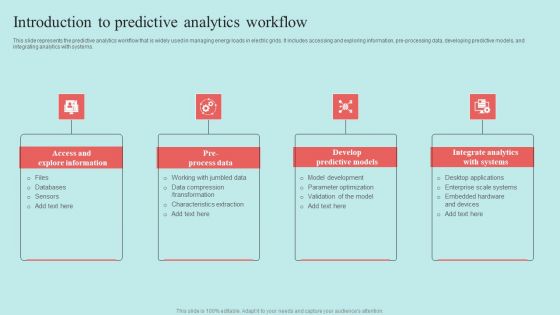
Predictive Data Model Introduction To Predictive Analytics Workflow Topics PDF
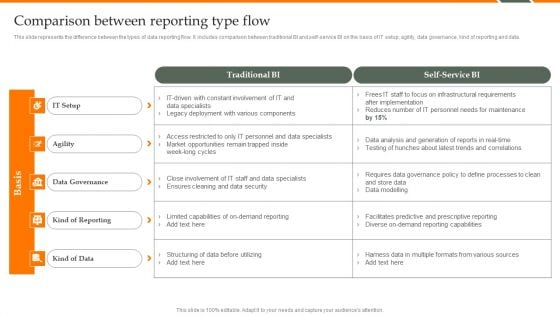
Human Resource Analytics Comparison Between Reporting Type Flow Demonstration PDF
This slide represents the difference between the types of data reporting flow. It includes comparison between traditional BI and self-service BI on the basis of IT setup, agility, data governance, kind of reporting and data. If your project calls for a presentation, then Slidegeeks is your go-to partner because we have professionally designed, easy-to-edit templates that are perfect for any presentation. After downloading, you can easily edit Human Resource Analytics Comparison Between Reporting Type Flow Demonstration PDF and make the changes accordingly. You can rearrange slides or fill them with different images. Check out all the handy templates.
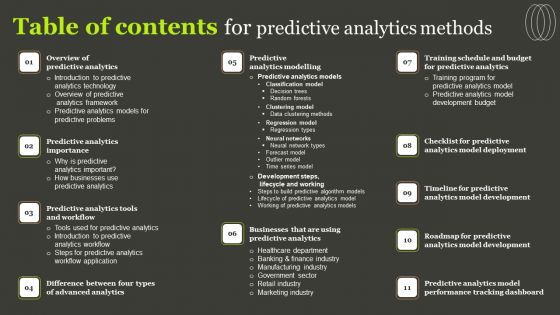
Table Of Contents For Predictive Analytics Methods Template PDF
If your project calls for a presentation, then Slidegeeks is your go to partner because we have professionally designed, easy to edit templates that are perfect for any presentation. After downloading, you can easily edit Table Of Contents For Predictive Analytics Methods Template PDF and make the changes accordingly. You can rearrange slides or fill them with different images. Check out all the handy templates.
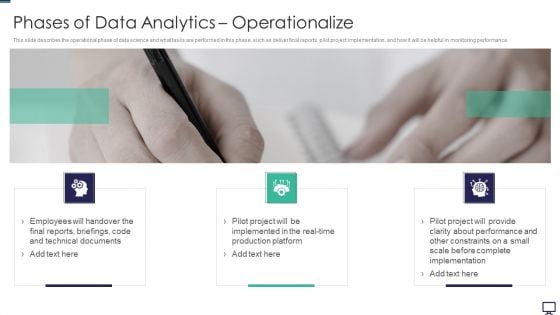
Phases Of Data Analytics Operationalize Ppt Pictures Files PDF
This slide describes the operational phase of data science and what tasks are performed in this phase, such as deliver final reports, pilot project implementation, and how it will be helpful in monitoring performance. Presenting phases of data analytics operationalize ppt pictures files pdf to provide visual cues and insights. Share and navigate important information on three stages that need your due attention. This template can be used to pitch topics like phases of data analytics operationalize. In addtion, this PPT design contains high resolution images, graphics, etc, that are easily editable and available for immediate download.

Comparative Analysis Of Product Analytics Tools Driving Business Success Integrating Product
This slide outlines comparative analysis of product analytics tools aimed at helping choose the best alternative. It covers comparison on the basis of USP, pricing and ratings If your project calls for a presentation, then Slidegeeks is your go-to partner because we have professionally designed, easy-to-edit templates that are perfect for any presentation. After downloading, you can easily edit Comparative Analysis Of Product Analytics Tools Driving Business Success Integrating Product and make the changes accordingly. You can rearrange slides or fill them with different images. Check out all the handy templates This slide outlines comparative analysis of product analytics tools aimed at helping choose the best alternative. It covers comparison on the basis of USP, pricing and ratings
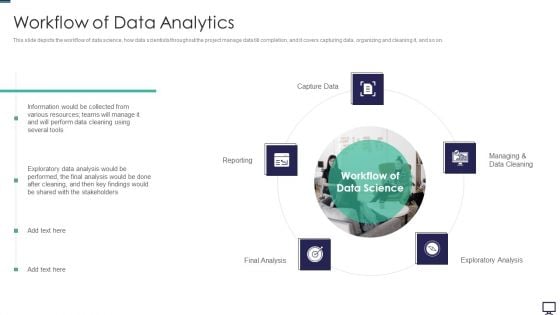
Workflow Of Data Analytics Ppt Styles Graphics Pictures PDF
This slide depicts the workflow of data science, how data scientists throughout the project manage data till completion, and it covers capturing data, organizing and cleaning it, and so on. Presenting workflow of data analytics ppt styles graphics pictures pdf to provide visual cues and insights. Share and navigate important information on five stages that need your due attention. This template can be used to pitch topics like teams, several, capture data, exploratory analysis. In addtion, this PPT design contains high resolution images, graphics, etc, that are easily editable and available for immediate download.
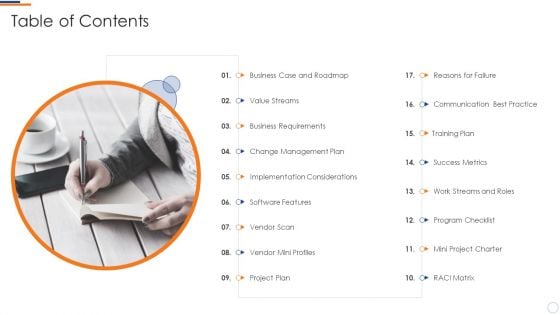
Business Intelligence And Big Data Analytics Transformation Toolkit Table Of Contents Diagrams PDF
This is a business intelligence and big data analytics transformation toolkit table of contents diagrams pdf template with various stages. Focus and dispense information on fiften stages using this creative set, that comes with editable features. It contains large content boxes to add your information on topics like business case and roadmap, value streams, software features, vendor scan, project plan. You can also showcase facts, figures, and other relevant content using this PPT layout. Grab it now.
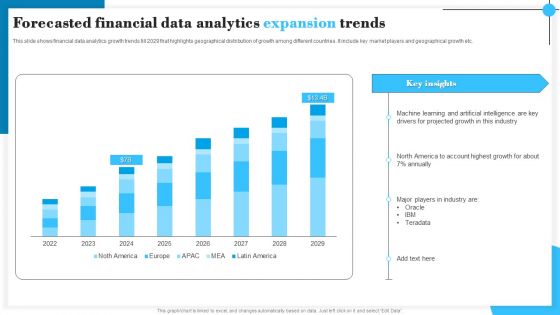
Forecasted Financial Data Analytics Expansion Trends Slides PDF
This slide shows financial data analytics growth trends till 2029 that highlights geographical distribution of growth among different countries. It include key market players and geographical growth etc. Showcasing this set of slides titled Forecasted Financial Data Analytics Expansion Trends Slides PDF. The topics addressed in these templates are Machine Learning, Projected Growth, Industry. All the content presented in this PPT design is completely editable. Download it and make adjustments in color, background, font etc. as per your unique business setting.
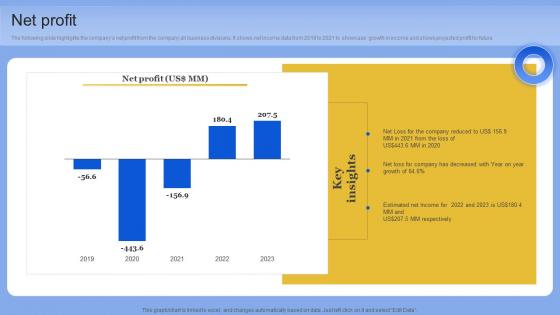
Net Profit Data Analytics Company Outline Diagrams PDF
The following slide highlights the companys net profit from the company all business divisions. It shows net income data from 2019 to 2021 to showcase growth in income and shows projected profit for future. Retrieve professionally designed Net Profit Data Analytics Company Outline Diagrams PDF to effectively convey your message and captivate your listeners. Save time by selecting pre-made slideshows that are appropriate for various topics, from business to educational purposes. These themes come in many different styles, from creative to corporate, and all of them are easily adjustable and can be edited quickly. Access them as PowerPoint templates or as Google Slides themes. You do not have to go on a hunt for the perfect presentation because Slidegeeks got you covered from everywhere. The following slide highlights the companys net profit from the company all business divisions. It shows net income data from 2019 to 2021 to showcase growth in income and shows projected profit for future

Business Intelligence And Big Value Stream Data Analytics Process Download PDF
This slide shows the step by step approach of data analytics project focusing on data gathering, consolidation and data analysis to build business insights for effective decision making. Presenting business intelligence and big value stream data analytics process download pdf to provide visual cues and insights. Share and navigate important information on six stages that need your due attention. This template can be used to pitch topics like data gathering, field level analysis, data analysis and business insights, data cleaning, data consolidation. In addtion, this PPT design contains high resolution images, graphics, etc, that are easily editable and available for immediate download.
Business Intelligence And Big Industry Data Analytics Value Stream Model Icons PDF
This slide illustrates the workflow related to performing the data analytics project along with key responsible owners to accomplish the activities. This is a business intelligence and big industry data analytics value stream model icons pdf template with various stages. Focus and dispense information on four stages using this creative set, that comes with editable features. It contains large content boxes to add your information on topics like business manager, it system management, data miner, data analyst. You can also showcase facts, figures, and other relevant content using this PPT layout. Grab it now.
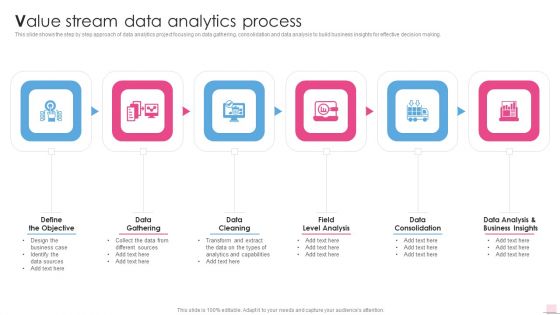
Value Stream Data Analytics Process Business Analysis Modification Toolkit Professional PDF
This slide shows the step by step approach of data analytics project focusing on data gathering, consolidation and data analysis to build business insights for effective decision making. This is a Value Stream Data Analytics Process Business Analysis Modification Toolkit Professional PDF template with various stages. Focus and dispense information on six stages using this creative set, that comes with editable features. It contains large content boxes to add your information on topics like Data Gathering, Data Cleaning, Data Consolidation. You can also showcase facts, figures, and other relevant content using this PPT layout. Grab it now.
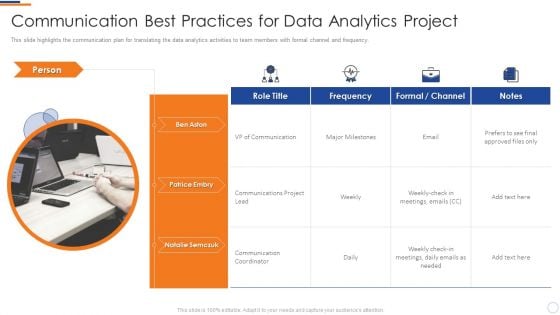
Business Intelligence And Big Communication Best Practices For Data Analytics Mockup PDF
This slide highlights the communication plan for translating the data analytics activities to team members with formal channel and frequency. Presenting business intelligence and big communication best practices for data analytics mockup pdf to provide visual cues and insights. Share and navigate important information on four stages that need your due attention. This template can be used to pitch topics like communications project lead, communication coordinator, vp communication. In addtion, this PPT design contains high resolution images, graphics, etc, that are easily editable and available for immediate download.
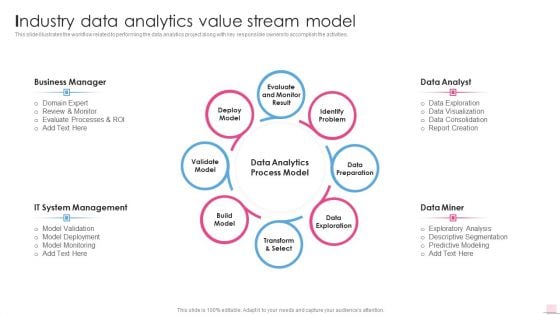
Industry Data Analytics Value Stream Model Business Analysis Modification Toolkit Mockup PDF
This slide illustrates the workflow related to performing the data analytics project along with key responsible owners to accomplish the activities.This is a Industry Data Analytics Value Stream Model Business Analysis Modification Toolkit Mockup PDF template with various stages. Focus and dispense information on eight stages using this creative set, that comes with editable features. It contains large content boxes to add your information on topics like Evaluate Processes, System Management, Data Visualization. You can also showcase facts, figures, and other relevant content using this PPT layout. Grab it now.
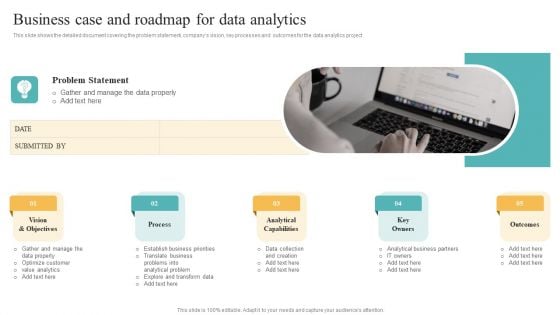
Transformation Toolkit Competitive Intelligence Information Analysis Business Case And Roadmap For Data Analytics Ideas PDF
This slide shows the detailed document covering the problem statement, companys vision, key processes and outcomes for the data analytics project Present like a pro with Transformation Toolkit Competitive Intelligence Information Analysis Business Case And Roadmap For Data Analytics Ideas PDF Create beautiful presentations together with your team, using our easy to use presentation slides. Share your ideas in real time and make changes on the fly by downloading our templates. So whether you are in the office, on the go, or in a remote location, you can stay in sync with your team and present your ideas with confidence. With Slidegeeks presentation got a whole lot easier. Grab these presentations today.
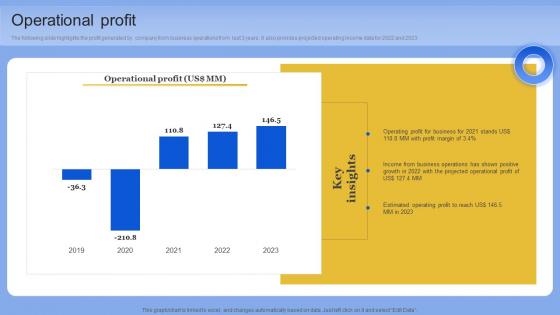
Operational Profit Data Analytics Company Outline Pictures PDF
The following slide highlights the profit generated by company from business operations from last 3 years. It also provides projected operating income data for 2022 and 2023. Slidegeeks has constructed Operational Profit Data Analytics Company Outline Pictures PDF after conducting extensive research and examination. These presentation templates are constantly being generated and modified based on user preferences and critiques from editors. Here, you will find the most attractive templates for a range of purposes while taking into account ratings and remarks from users regarding the content. This is an excellent jumping-off point to explore our content and will give new users an insight into our top-notch PowerPoint Templates. The following slide highlights the profit generated by company from business operations from last 3 years. It also provides projected operating income data for 2022 and 2023
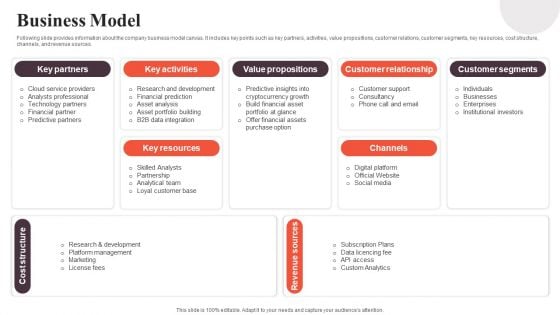
Financial Analytics Solution Investor Funding Elevator Pitch Deck Business Model Guidelines PDF
Following slide provides information about the company business model canvas. It includes key points such as key partners, activities, value propositions, customer relations, customer segments, key resources, cost structure, channels, and revenue sources. If your project calls for a presentation, then Slidegeeks is your go to partner because we have professionally designed, easy to edit templates that are perfect for any presentation. After downloading, you can easily edit Financial Analytics Solution Investor Funding Elevator Pitch Deck Business Model Guidelines PDF and make the changes accordingly. You can rearrange slides or fill them with different images. Check out all the handy templates
Online Marketing Analytics To Enhance Business Growth Website Landing Page KPI Tracking Dashboard Sample PDF
This slide covers a dashboard for analyzing the metrics of the website landing page. It includes KPIs such as conversions, conversion rate, sessions, bounce rate, engagement sickness, etc. If your project calls for a presentation, then Slidegeeks is your go to partner because we have professionally designed, easy to edit templates that are perfect for any presentation. After downloading, you can easily edit Online Marketing Analytics To Enhance Business Growth Website Landing Page KPI Tracking Dashboard Sample PDF and make the changes accordingly. You can rearrange slides or fill them with different images. Check out all the handy templates
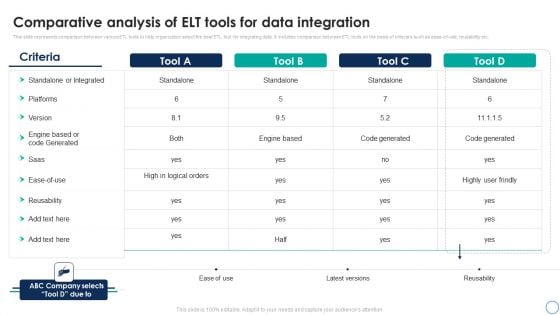
Business Analytics Application Comparative Analysis Of ETL Tools For Data Integration Background PDF
This slide represents comparison between various ETL tools to help organization select the best ETL tool for integrating data. It includes comparison between ETL tools on the basis of criterias such as ease-of-use, reusability etc. If your project calls for a presentation, then Slidegeeks is your go-to partner because we have professionally designed, easy-to-edit templates that are perfect for any presentation. After downloading, you can easily edit Business Analytics Application Comparative Analysis Of ETL Tools For Data Integration Background PDF and make the changes accordingly. You can rearrange slides or fill them with different images. Check out all the handy templates.
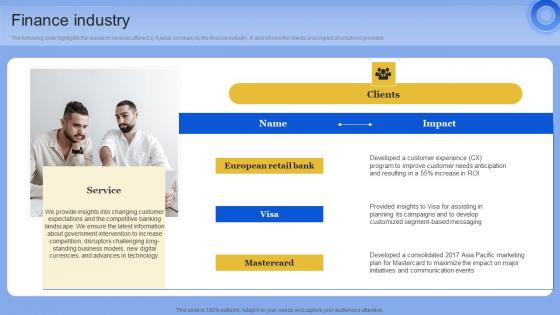
Finance Industry Data Analytics Company Outline Summary PDF
The following slide highlights the research services offered by Kantar company to the finance industry. It also shows the clients and impact of solutions provided. If your project calls for a presentation, then Slidegeeks is your go-to partner because we have professionally designed, easy-to-edit templates that are perfect for any presentation. After downloading, you can easily edit Finance Industry Data Analytics Company Outline Summary PDF and make the changes accordingly. You can rearrange slides or fill them with different images. Check out all the handy templates The following slide highlights the research services offered by Kantar company to the finance industry. It also shows the clients and impact of solutions provided
Tracking Leads Generated Through Social Media Online Marketing Analytics To Enhance Business Growth Rules PDF
This slide covers an overview of social media leads for increasing customer conversion rates. It also includes strategies to generate more social media leads, such as optimizing your profile, using social lead ads, and offering the right incentive. If your project calls for a presentation, then Slidegeeks is your go to partner because we have professionally designed, easy to edit templates that are perfect for any presentation. After downloading, you can easily edit Tracking Leads Generated Through Social Media Online Marketing Analytics To Enhance Business Growth Rules PDF and make the changes accordingly. You can rearrange slides or fill them with different images. Check out all the handy templates
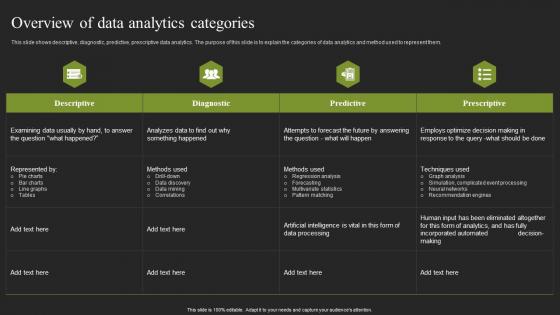
Overview Of Data Analytics Categories Cybernetic Systems Infographics Pdf
This slide shows descriptive, diagnostic, predictive, prescriptive data analytics. The purpose of this slide is to explain the categories of data analytics and method used to represent them. Create an editable Overview Of Data Analytics Categories Cybernetic Systems Infographics Pdf that communicates your idea and engages your audience. Whether you are presenting a business or an educational presentation, pre designed presentation templates help save time. Overview Of Data Analytics Categories Cybernetic Systems Infographics Pdf is highly customizable and very easy to edit, covering many different styles from creative to business presentations. Slidegeeks has creative team members who have crafted amazing templates. So, go and get them without any delay. This slide shows descriptive, diagnostic, predictive, prescriptive data analytics. The purpose of this slide is to explain the categories of data analytics and method used to represent them.


 Continue with Email

 Home
Home


