Business Analytics
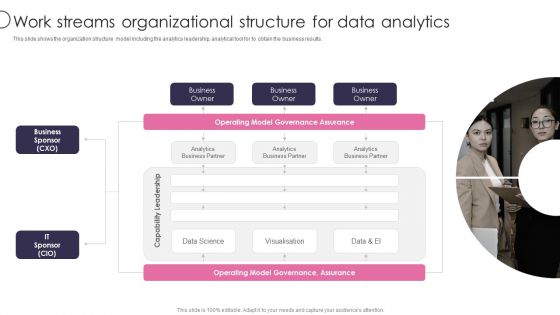
Information Transformation Process Toolkit Work Streams Organizational Structure For Data Analytics Guidelines PDF
This slide shows the organization structure model including the analytics leadership, analytical tool for to obtain the business results. This is a Information Transformation Process Toolkit Work Streams Organizational Structure For Data Analytics Guidelines PDF template with various stages. Focus and dispense information on one stages using this creative set, that comes with editable features. It contains large content boxes to add your information on topics like Business Owner, Business Sponsor, Data Science. You can also showcase facts, figures, and other relevant content using this PPT layout. Grab it now.
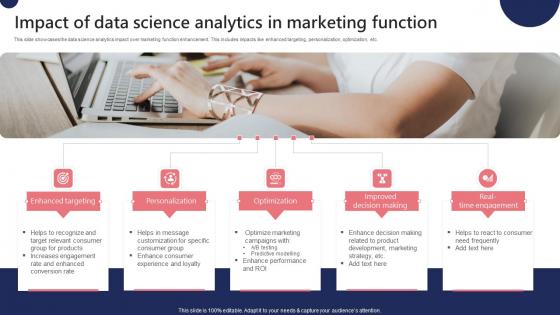
Impact Of Data Science Analytics In Marketing Function Ppt Ideas Templates Pdf
This slide showcases the data science analytics impact over marketing function enhancement. This includes impacts like enhanced targeting, personalization, optimization, etc. Showcasing this set of slides titled Impact Of Data Science Analytics In Marketing Function Ppt Ideas Templates Pdf. The topics addressed in these templates are Enhanced Targeting, Personalization, Optimization. All the content presented in this PPT design is completely editable. Download it and make adjustments in color, background, font etc. as per your unique business setting. This slide showcases the data science analytics impact over marketing function enhancement. This includes impacts like enhanced targeting, personalization, optimization, etc.
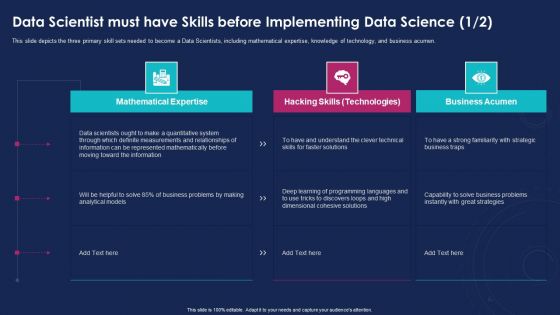
Data Analytics IT Data Scientist Must Have Skills Before Implementing Ppt Inspiration Tips PDF
This slide depicts the three primary skill sets needed to become a Data Scientists, including mathematical expertise, knowledge of technology, and business acumen. Deliver an awe inspiring pitch with this creative data analytics it data scientist must have skills before implementing ppt inspiration tips pdf bundle. Topics like mathematical expertise, knowledge of technology, business acumen can be discussed with this completely editable template. It is available for immediate download depending on the needs and requirements of the user.

Augmented Analytics Implementation IT Ppt PowerPoint Presentation Complete Deck With Slides
This complete deck covers various topics and highlights important concepts. It has PPT slides which cater to your business needs. This complete deck presentation emphasizes Augmented Analytics Implementation IT Ppt PowerPoint Presentation Complete Deck With Slides and has templates with professional background images and relevant content. This deck consists of total of fifty three slides. Our designers have created customizable templates, keeping your convenience in mind. You can edit the colour, text and font size with ease. Not just this, you can also add or delete the content if needed. Get access to this fully editable complete presentation by clicking the download button below.
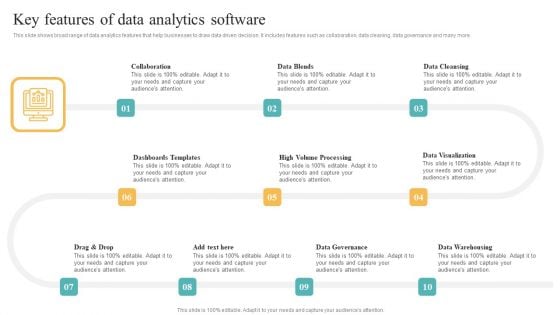
Transformation Toolkit Competitive Intelligence Information Analysis Key Features Of Data Analytics Software Elements PDF
This slide shows broad range of data analytics features that help businesses to draw data driven decision. It includes features such as collaboration, data cleaning, data governance and many more. This modern and well arranged Transformation Toolkit Competitive Intelligence Information Analysis Key Features Of Data Analytics Software Elements PDF provides lots of creative possibilities. It is very simple to customize and edit with the Powerpoint Software. Just drag and drop your pictures into the shapes. All facets of this template can be edited with Powerpoint no extra software is necessary. Add your own material, put your images in the places assigned for them, adjust the colors, and then you can show your slides to the world, with an animated slide included.
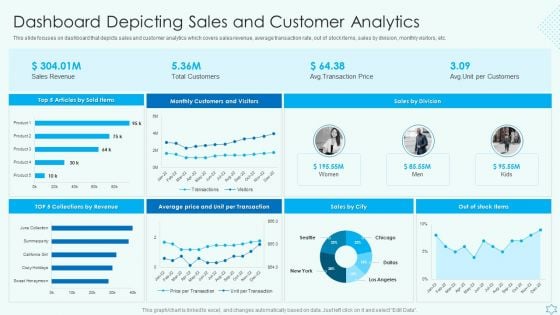
Deploy Merchandise Program To Enhance Sales Dashboard Depicting Sales And Customer Analytics Sample PDF
This slide focuses on dashboard that depicts sales and customer analytics which covers sales revenue, average transaction rate, out of stock items, sales by division, monthly visitors, etc. Make sure to capture your audiences attention in your business displays with our gratis customizable Deploy Merchandise Program To Enhance Sales Dashboard Depicting Sales And Customer Analytics Sample PDF. These are great for business strategies, office conferences, capital raising or task suggestions. If you desire to acquire more customers for your tech business and ensure they stay satisfied, create your own sales presentation with these plain slides.
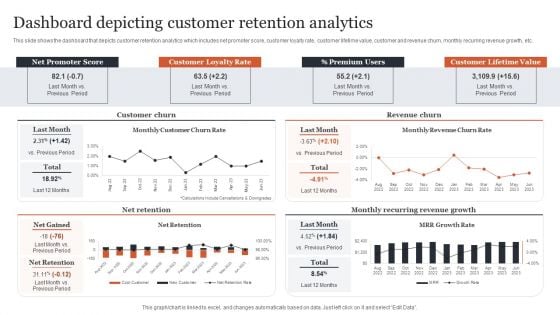
CRM Administration To Reduce Churn Rate Dashboard Depicting Customer Retention Analytics Themes PDF
This slide shows the dashboard that depicts customer retention analytics which includes net promoter score, customer loyalty rate, customer lifetime value, customer and revenue churn, monthly recurring revenue growth, etc. Make sure to capture your audiences attention in your business displays with our gratis customizable CRM Administration To Reduce Churn Rate Dashboard Depicting Customer Retention Analytics Themes PDF. These are great for business strategies, office conferences, capital raising or task suggestions. If you desire to acquire more customers for your tech business and ensure they stay satisfied, create your own sales presentation with these plain slides.
Icon Showing Strategy Planning For Capability Analytics Ppt Infographics Aids PDF
Showcasing this set of slides titled Icon Showing Strategy Planning For Capability Analytics Ppt Infographics Aids PDF. The topics addressed in these templates are Icon Showing, Strategy Planning, Capability Analytics. All the content presented in this PPT design is completely editable. Download it and make adjustments in color, background, font etc. as per your unique business setting. Our Icon Showing Strategy Planning For Capability Analytics Ppt Infographics Aids PDF are topically designed to provide an attractive backdrop to any subject. Use them to look like a presentation pro.
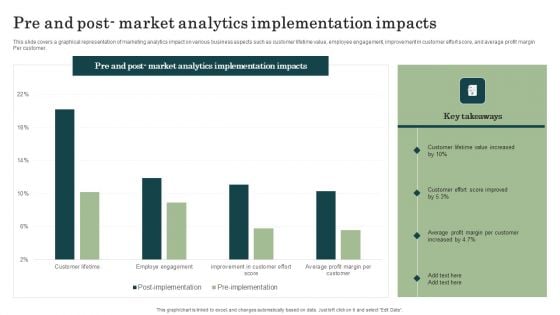
Marketing Success Metrics Pre And Post Market Analytics Implementation Information PDF
This slide covers a graphical representation of marketing analytics impact on various business aspects such as customer lifetime value, employee engagement, improvement in customer effort score, and average profit margin Per customer. Do you know about Slidesgeeks Marketing Success Metrics Pre And Post Market Analytics Implementation Information PDF These are perfect for delivering any kind od presentation. Using it, create PowerPoint presentations that communicate your ideas and engage audiences. Save time and effort by using our pre-designed presentation templates that are perfect for a wide range of topic. Our vast selection of designs covers a range of styles, from creative to business, and are all highly customizable and easy to edit. Download as a PowerPoint template or use them as Google Slides themes.
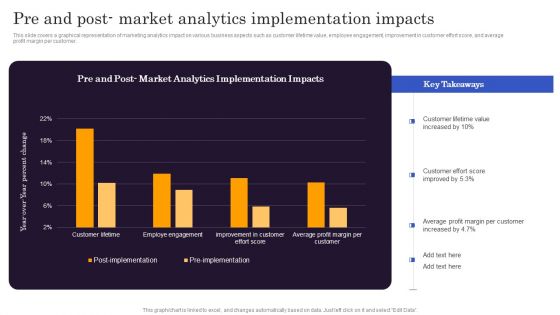
Marketers Guide To Data Analysis Optimization Pre And Post Market Analytics Implementation Impacts Formats PDF
This slide covers a graphical representation of marketing analytics impact on various business aspects such as customer lifetime value, employee engagement, improvement in customer effort score, and average profit margin per customer. Do you know about Slidesgeeks Marketers Guide To Data Analysis Optimization Pre And Post Market Analytics Implementation Impacts Formats PDF. These are perfect for delivering any kind od presentation. Using it, create PowerPoint presentations that communicate your ideas and engage audiences. Save time and effort by using our pre designed presentation templates that are perfect for a wide range of topic. Our vast selection of designs covers a range of styles, from creative to business, and are all highly customizable and easy to edit. Download as a PowerPoint template or use them as Google Slides themes.
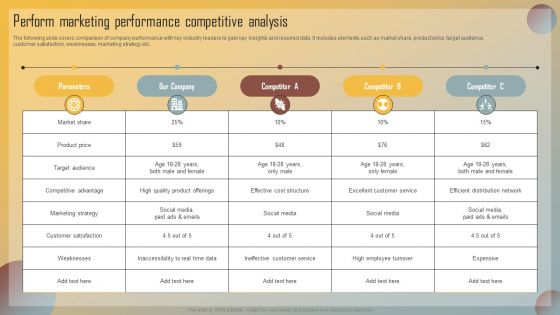
Guide For Marketing Analytics To Improve Decisions Perform Marketing Performance Competitive Analysis Sample PDF
The following slide covers comparison of company performance with key industry leaders to gain key insights and required data. It includes elements such as market share, product price, target audience, customer satisfaction, weaknesses, marketing strategy etc. Make sure to capture your audiences attention in your business displays with our gratis customizable Guide For Marketing Analytics To Improve Decisions Perform Marketing Performance Competitive Analysis Sample PDF. These are great for business strategies, office conferences, capital raising or task suggestions. If you desire to acquire more customers for your tech business and ensure they stay satisfied, create your own sales presentation with these plain slides.
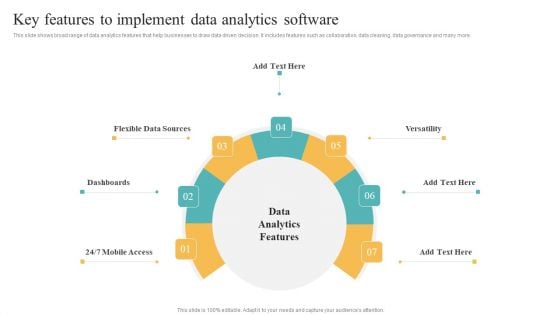
Transformation Toolkit Competitive Intelligence Information Analysis Key Features To Implement Data Analytics Software Pictures PDF
This slide shows broad range of data analytics features that help businesses to draw data driven decision. It includes features such as collaboration, data cleaning, data governance and many more. Welcome to our selection of the Transformation Toolkit Competitive Intelligence Information Analysis Key Features To Implement Data Analytics Software Pictures PDF. These are designed to help you showcase your creativity and bring your sphere to life. Planning and Innovation are essential for any business that is just starting out. This collection contains the designs that you need for your everyday presentations. All of our PowerPoints are 100 percent editable, so you can customize them to suit your needs. This multi purpose template can be used in various situations. Grab these presentation templates today.
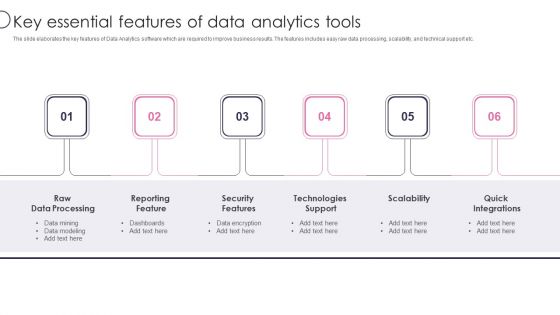
Information Transformation Process Toolkit Key Essential Features Of Data Analytics Tools Ideas PDF
The slide elaborates the key features of Data Analytics software which are required to improve business results. The features includes easy raw data processing, scalability, and technical support etc. Presenting Information Transformation Process Toolkit Key Essential Features Of Data Analytics Tools Ideas PDF to provide visual cues and insights. Share and navigate important information on six stages that need your due attention. This template can be used to pitch topics like Reporting Feature, Security Features, Technologies Support. In addtion, this PPT design contains high resolution images, graphics, etc, that are easily editable and available for immediate download.
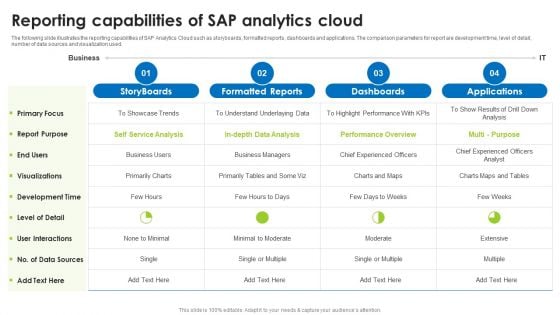
BI Technique For Data Informed Decisions Reporting Capabilities Of Sap Analytics Cloud Demonstration PDF
The following slide illustrates the reporting capabilities of SAP Analytics Cloud such as storyboards, formatted reports, dashboards and applications. The comparison parameters for report are development time, level of detail, number of data sources and visualization used. Make sure to capture your audiences attention in your business displays with our gratis customizable BI Technique For Data Informed Decisions Reporting Capabilities Of Sap Analytics Cloud Demonstration PDF. These are great for business strategies, office conferences, capital raising or task suggestions. If you desire to acquire more customers for your tech business and ensure they stay satisfied, create your own sales presentation with these plain slides.
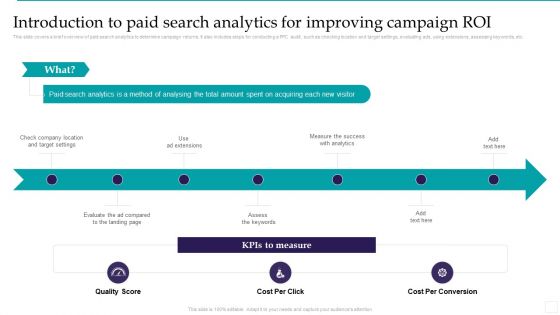
Introduction To Paid Search Analytics For Improving Campaign ROI Introduction PDF
This slide covers a brief overview of paid search analytics to determine campaign returns. It also includes steps for conducting a PPC audit, such as checking location and target settings, evaluating ads, using extensions, assessing keywords, etc. Make sure to capture your audiences attention in your business displays with our gratis customizable Introduction To Paid Search Analytics For Improving Campaign ROI Introduction PDF. These are great for business strategies, office conferences, capital raising or task suggestions. If you desire to acquire more customers for your tech business and ensure they stay satisfied, create your own sales presentation with these plain slides.
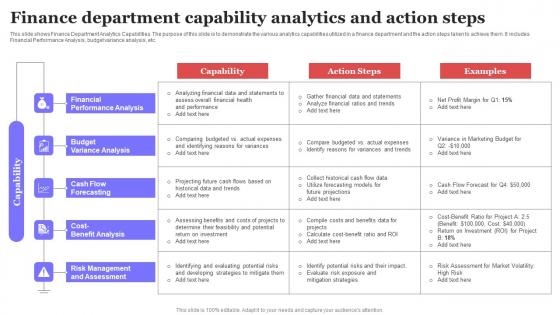
Finance Department Capability Analytics And Action Steps Ppt Layouts Templates PDF
This slide shows Finance Department Analytics Capabilities. The purpose of this slide is to demonstrate the various analytics capabilities utilized in a finance department and the action steps taken to achieve them. It includes Financial Performance Analysis, budget variance analysis, etc. Showcasing this set of slides titled Finance Department Capability Analytics And Action Steps Ppt Layouts Templates PDF. The topics addressed in these templates are Financial Performance,Analysis, Budget Variance Analysis. All the content presented in this PPT design is completely editable. Download it and make adjustments in color, background, font etc. as per your unique business setting. This slide shows Finance Department Analytics Capabilities. The purpose of this slide is to demonstrate the various analytics capabilities utilized in a finance department and the action steps taken to achieve them. It includes Financial Performance Analysis, budget variance analysis, etc.
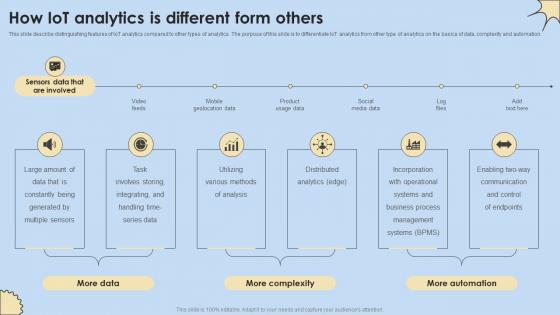
How IoT Analytics Is Different Form Others Internet Of Things Analysis Information Pdf
This slide describe distinguishing features of IoT analytics compared to other types of analytics. The purpose of this slide is to differentiate IoT analytics from other type of analytics on the basics of data, complexity and automation. Make sure to capture your audiences attention in your business displays with our gratis customizable How IoT Analytics Is Different Form Others Internet Of Things Analysis Information Pdf. These are great for business strategies, office conferences, capital raising or task suggestions. If you desire to acquire more customers for your tech business and ensure they stay satisfied, create your own sales presentation with these plain slides. This slide describe distinguishing features of IoT analytics compared to other types of analytics. The purpose of this slide is to differentiate IoT analytics from other type of analytics on the basics of data, complexity and automation.
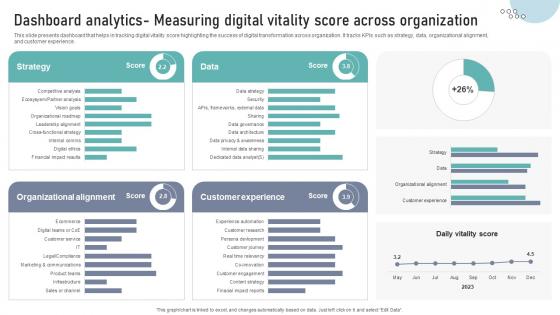
Dashboard Analytics Measuring Digital Vitality Score Across Organization DT SS V
This slide presents dashboard that helps in tracking digital vitality score highlighting the success of digital transformation across organization. It tracks KPIs such as strategy, data, organizational alignment,and customer experience.Make sure to capture your audiences attention in your business displays with our gratis customizable Dashboard Analytics Measuring Digital Vitality Score Across Organization DT SS V. These are great for business strategies, office conferences, capital raising or task suggestions. If you desire to acquire more customers for your tech business and ensure they stay satisfied, create your own sales presentation with these plain slides. This slide presents dashboard that helps in tracking digital vitality score highlighting the success of digital transformation across organization. It tracks KPIs such as strategy, data, organizational alignment,and customer experience.

BI Technique For Data Informed Decisions Major Users Of Sap Analytics Cloud Suite Summary PDF
The following slide illustrates the major user of SAP Analytics Cloud suite which are business users and business intelligence seekers. It also contains details regarding the usage statistics of both the users. Crafting an eye catching presentation has never been more straightforward. Let your presentation shine with this tasteful yet straightforward BI Technique For Data Informed Decisions Major Users Of Sap Analytics Cloud Suite Summary PDF template. It offers a minimalistic and classy look that is great for making a statement. The colors have been employed intelligently to add a bit of playfulness while still remaining professional. Construct the ideal BI Technique For Data Informed Decisions Major Users Of Sap Analytics Cloud Suite Summary PDF that effortlessly grabs the attention of your audience Begin now and be certain to wow your customers.

Deploying AML Transaction Monitoring Using Behavioral Analytics For Multiple Ideas PDF
The following slide illustrates usage of behavioral analytics for multiple transactions and profiles. It provides information about transaction, collaborative, behavior sorted, user defined, global intelligent, merchant, risk sensitivity, false positives, financial crimes, etc. Make sure to capture your audiences attention in your business displays with our gratis customizable Deploying AML Transaction Monitoring Using Behavioral Analytics For Multiple Ideas PDF. These are great for business strategies, office conferences, capital raising or task suggestions. If you desire to acquire more customers for your tech business and ensure they stay satisfied, create your own sales presentation with these plain slides.

Transforming Recruitment Process Effective Recruitment Analytics Best Practices CRP DK SS
This slide showcases best practices adopted to improve hiring process such as selecting relevant metric, advanced analysis and effective reporting. Make sure to capture your audiences attention in your business displays with our gratis customizable Transforming Recruitment Process Effective Recruitment Analytics Best Practices CRP DK SS. These are great for business strategies, office conferences, capital raising or task suggestions. If you desire to acquire more customers for your tech business and ensure they stay satisfied, create your own sales presentation with these plain slides. This slide showcases best practices adopted to improve hiring process such as selecting relevant metric, advanced analysis and effective reporting.

Data And Information Visualization Visual Analytics Branch Of Visualization Research Designs PDF
This slide shows visual analytics, the last branch of visualization research, which emerged from the advancements in the other two branches and mainly focused on analytical reasoning. Make sure to capture your audiences attention in your business displays with our gratis customizable Data And Information Visualization Visual Analytics Branch Of Visualization Research Designs PDF. These are great for business strategies, office conferences, capital raising or task suggestions. If you desire to acquire more customers for your tech business and ensure they stay satisfied, create your own sales presentation with these plain slides.
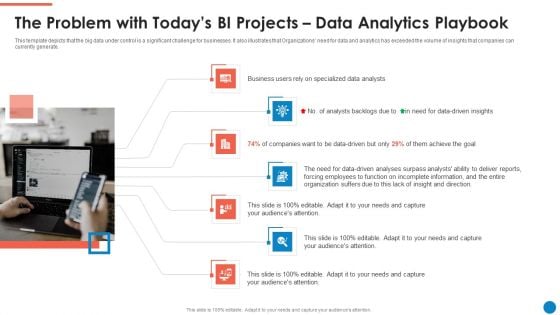
The Problem With Todays Bi Projects Data Analytics Playbook Ideas PDF
This template depicts that the big data under control is a significant challenge for businesses. It also illustrates that Organizations need for data and analytics has exceeded the volume of insights that companies can currently generate. This is a The Problem With Todays Bi Projects Data Analytics Playbook Ideas PDF template with various stages. Focus and dispense information on seven stages using this creative set, that comes with editable features. It contains large content boxes to add your information on topics like Business Users, Data Analysts, Analysts Backlogs, Employees. You can also showcase facts, figures, and other relevant content using this PPT layout. Grab it now.
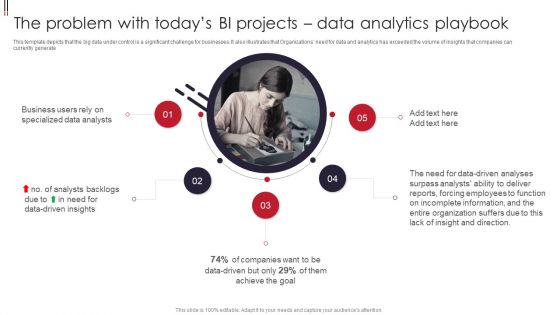
Information Visualizations Playbook The Problem With Todays BI Projects Data Analytics Playbook Portrait PDF
This template depicts that the big data under control is a significant challenge for businesses. It also illustrates that Organizations need for data and analytics has exceeded the volume of insights that companies can currently generate. Presenting Information Visualizations Playbook The Problem With Todays BI Projects Data Analytics Playbook Portrait PDF to provide visual cues and insights. Share and navigate important information on five stages that need your due attention. This template can be used to pitch topics like Business Users, Specialized Data Analysts, Data Driven Insights. In addtion, this PPT design contains high resolution images, graphics, etc, that are easily editable and available for immediate download.
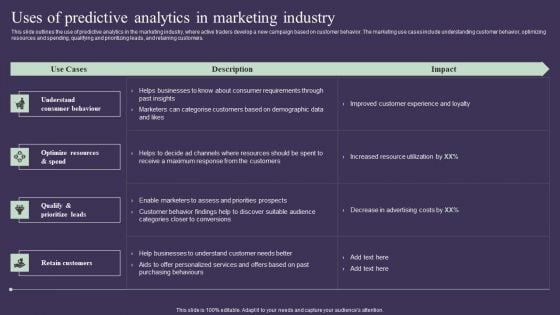
Projection Model Uses Of Predictive Analytics In Marketing Industry Infographics PDF
This slide outlines the use of predictive analytics in the marketing industry, where active traders develop a new campaign based on customer behavior. The marketing use cases include understanding customer behavior, optimizing resources and spending, qualifying and prioritizing leads, and retaining customers. Make sure to capture your audiences attention in your business displays with our gratis customizable Projection Model Uses Of Predictive Analytics In Marketing Industry Infographics PDF. These are great for business strategies, office conferences, capital raising or task suggestions. If you desire to acquire more customers for your tech business and ensure they stay satisfied, create your own sales presentation with these plain slides.
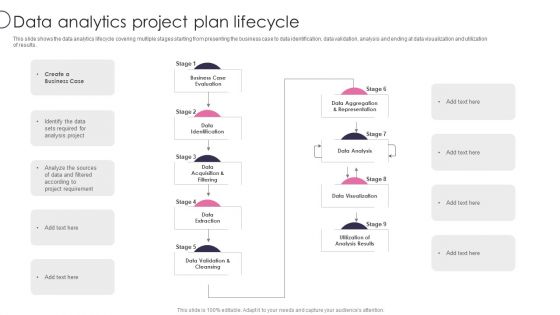
Information Transformation Process Toolkit Data Analytics Project Plan Lifecycle Designs PDF
This slide shows the data analytics lifecycle covering multiple stages starting from presenting the business case to data identification, data validation, analysis and ending at data visualization and utilization of results. Deliver and pitch your topic in the best possible manner with this Information Transformation Process Toolkit Data Analytics Project Plan Lifecycle Designs PDF. Use them to share invaluable insights on Analyze, Sources, Project Requirement and impress your audience. This template can be altered and modified as per your expectations. So, grab it now.
BI Technique For Data Informed Decisions Deployment Options For Sap Analytics Cloud Icons PDF
The purpose of this slide is to provide an information regarding the deployment methods for SAP Analytics Cloud implementation in the business organization. It also contains details of each deployment options key features. Slidegeeks is one of the best resources for PowerPoint templates. You can download easily and regulate BI Technique For Data Informed Decisions Deployment Options For Sap Analytics Cloud Icons PDF for your personal presentations from our wonderful collection. A few clicks is all it takes to discover and get the most relevant and appropriate templates. Use our Templates to add a unique zing and appeal to your presentation and meetings. All the slides are easy to edit and you can use them even for advertisement purposes.
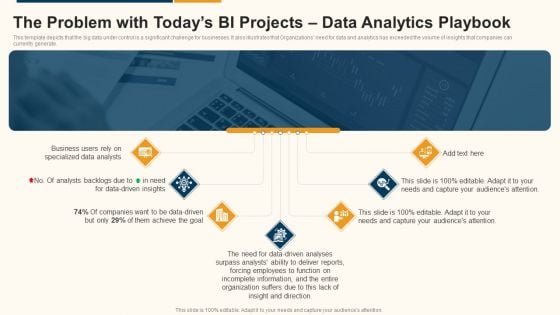
Data Interpretation And Analysis Playbook The Problem With Todays Bi Projects Data Analytics Playbook Introduction PDF
This template depicts that the big data under control is a significant challenge for businesses. It also illustrates that Organizations need for data and analytics has exceeded the volume of insights that companies can currently generate. This is a data interpretation and analysis playbook the problem with todays bi projects data analytics playbook introduction pdf template with various stages. Focus and dispense information on seven stages using this creative set, that comes with editable features. It contains large content boxes to add your information on topics like organization, analysts, business, data driven. You can also showcase facts, figures, and other relevant content using this PPT layout. Grab it now.
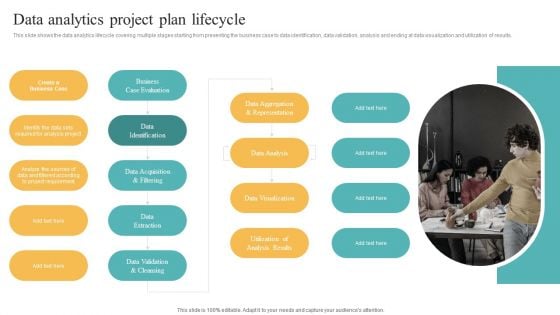
Data Analytics Project Plan Lifecycle Transformation Toolkit Competitive Intelligence Information Analysis Professional PDF
This slide shows the data analytics lifecycle covering multiple stages starting from presenting the business case to data identification, data validation, analysis and ending at data visualization and utilization of results. Want to ace your presentation in front of a live audience Our Data Analytics Project Plan Lifecycle Transformation Toolkit Competitive Intelligence Information Analysis Professional PDF can help you do that by engaging all the users towards you. Slidegeeks experts have put their efforts and expertise into creating these impeccable powerpoint presentations so that you can communicate your ideas clearly. Moreover, all the templates are customizable, and easy to edit and downloadable. Use these for both personal and commercial use.
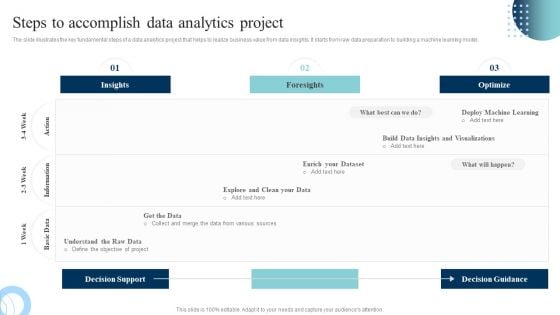
Data Evaluation And Processing Toolkit Steps To Accomplish Data Analytics Project Structure PDF
The slide illustrates the key fundamental steps of a data analytics project that helps to realize business value from data insights. It starts from raw data preparation to building a machine learning model. If you are looking for a format to display your unique thoughts, then the professionally designed Data Evaluation And Processing Toolkit Steps To Accomplish Data Analytics Project Structure PDF is the one for you. You can use it as a Google Slides template or a PowerPoint template. Incorporate impressive visuals, symbols, images, and other charts. Modify or reorganize the text boxes as you desire. Experiment with shade schemes and font pairings. Alter, share or cooperate with other people on your work. Download Data Evaluation And Processing Toolkit Steps To Accomplish Data Analytics Project Structure PDF and find out how to give a successful presentation. Present a perfect display to your team and make your presentation unforgettable.
BI Technique For Data Informed Decisions Global Market Landscape Of Sap Analytics Cloud Suite Icons PDF
The purpose of this slide is to showcase the global market landscape of SAP analytics cloud as BI tool. It also contains information regarding the business intelligence BI software market share and SAP analytics cloud customers by industry. Are you in need of a template that can accommodate all of your creative concepts This one is crafted professionally and can be altered to fit any style. Use it with Google Slides or PowerPoint. Include striking photographs, symbols, depictions, and other visuals. Fill, move around, or remove text boxes as desired. Test out color palettes and font mixtures. Edit and save your work, or work with colleagues. Download BI Technique For Data Informed Decisions Global Market Landscape Of Sap Analytics Cloud Suite Icons PDF and observe how to make your presentation outstanding. Give an impeccable presentation to your group and make your presentation unforgettable.
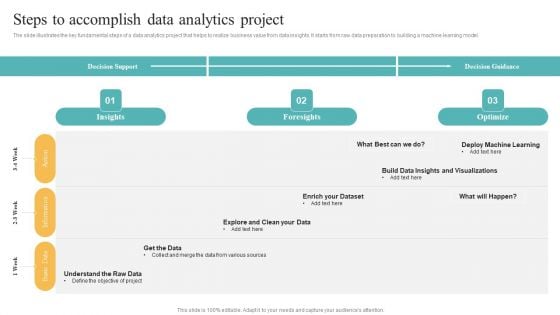
Transformation Toolkit Competitive Intelligence Information Analysis Steps To Accomplish Data Analytics Project Slides PDF
The slide illustrates the key fundamental steps of a data analytics project that helps to realize business value from data insights. It starts from raw data preparation to building a machine learning model. Do you know about Slidesgeeks Transformation Toolkit Competitive Intelligence Information Analysis Steps To Accomplish Data Analytics Project Slides PDF These are perfect for delivering any kind od presentation. Using it, create PowerPoint presentations that communicate your ideas and engage audiences. Save time and effort by using our pre designed presentation templates that are perfect for a wide range of topic. Our vast selection of designs covers a range of styles, from creative to business, and are all highly customizable and easy to edit. Download as a PowerPoint template or use them as Google Slides themes.
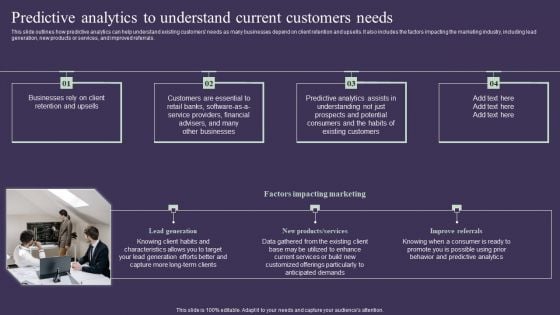
Projection Model Predictive Analytics To Understand Current Customers Needs Inspiration PDF
This slide outlines how predictive analytics can help understand existing customers needs as many businesses depend on client retention and upsells. It also includes the factors impacting the marketing industry, including lead generation, new products or services, and improved referrals. There are so many reasons you need a Projection Model Predictive Analytics To Understand Current Customers Needs Inspiration PDF. The first reason is you can not spend time making everything from scratch, Thus, Slidegeeks has made presentation templates for you too. You can easily download these templates from our website easily.
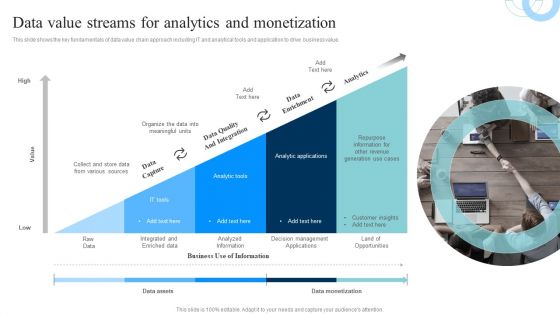
Data Evaluation And Processing Toolkit Data Value Streams For Analytics And Monetization Rules PDF
This slide shows the key fundamentals of data value chain approach including IT and analytical tools and application to drive business value. This Data Evaluation And Processing Toolkit Data Value Streams For Analytics And Monetization Rules PDF is perfect for any presentation, be it in front of clients or colleagues. It is a versatile and stylish solution for organizing your meetings. The Data Evaluation And Processing Toolkit Data Value Streams For Analytics And Monetization Rules PDF features a modern design for your presentation meetings. The adjustable and customizable slides provide unlimited possibilities for acing up your presentation. Slidegeeks has done all the homework before launching the product for you. So, dont wait, grab the presentation templates today.
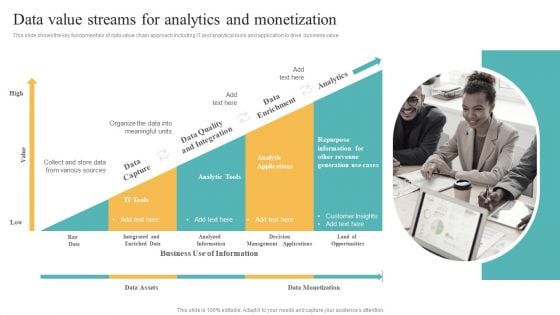
Transformation Toolkit Competitive Intelligence Information Analysis Data Value Streams For Analytics And Monetization Designs PDF
This slide shows the key fundamentals of data value chain approach including IT and analytical tools and application to drive business value. Get a simple yet stunning designed Transformation Toolkit Competitive Intelligence Information Analysis Data Value Streams For Analytics And Monetization Designs PDF. It is the best one to establish the tone in your meetings. It is an excellent way to make your presentations highly effective. So, download this PPT today from Slidegeeks and see the positive impacts. Our easy to edit Transformation Toolkit Competitive Intelligence Information Analysis Data Value Streams For Analytics And Monetization Designs PDF can be your go to option for all upcoming conferences and meetings. So, what are you waiting for Grab this template today.
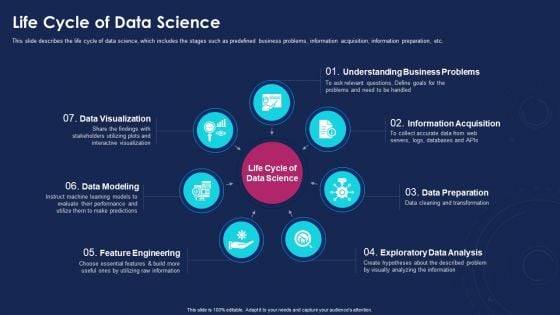
Data Analytics IT Life Cycle Of Data Science Ppt Pictures Gallery PDF
This slide describes the life cycle of data science, which includes the stages such as predefined business problems, information acquisition, information preparation, etc. This is a data analytics it life cycle of data science ppt pictures gallery pdf template with various stages. Focus and dispense information on seven stages using this creative set, that comes with editable features. It contains large content boxes to add your information on topics like data visualization, data modeling, feature engineering, exploratory data analysis, data preparation. You can also showcase facts, figures, and other relevant content using this PPT layout. Grab it now.

The Digital Project Managers Factors To Consider While Selecting Analytics Tool
The purpose of the mentioned slide is to outline various factors to examine before incorporating them into the project management. It includes various attributes such as factors, description, considerations, and compatibility. Make sure to capture your audiences attention in your business displays with our gratis customizable The Digital Project Managers Factors To Consider While Selecting Analytics Tool. These are great for business strategies, office conferences, capital raising or task suggestions. If you desire to acquire more customers for your tech business and ensure they stay satisfied, create your own sales presentation with these plain slides. The purpose of the mentioned slide is to outline various factors to examine before incorporating them into the project management. It includes various attributes such as factors, description, considerations, and compatibility.
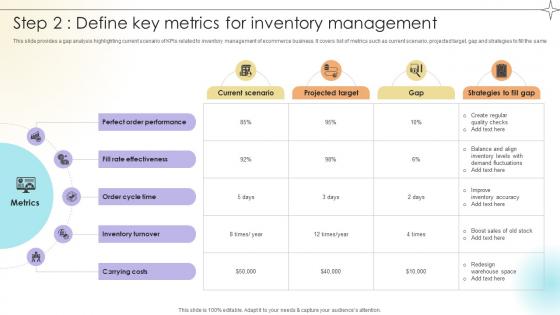
Step 2 Define Key Metrics For Inventory Management Data Analytics SS V
This slide provides a gap analysis highlighting current scenario of KPIs related to inventory management of ecommerce business. It covers list of metrics such as current scenario, projected target, gap and strategies to fill the same.Make sure to capture your audiences attention in your business displays with our gratis customizable Step 2 Define Key Metrics For Inventory Management Data Analytics SS V. These are great for business strategies, office conferences, capital raising or task suggestions. If you desire to acquire more customers for your tech business and ensure they stay satisfied, create your own sales presentation with these plain slides. This slide provides a gap analysis highlighting current scenario of KPIs related to inventory management of ecommerce business. It covers list of metrics such as current scenario, projected target, gap and strategies to fill the same.
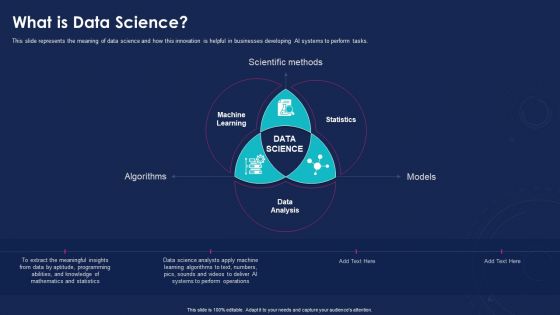
Data Analytics IT What Is Data Science Ppt Infographics Design Templates PDF
This slide represents the meaning of data science and how this innovation is helpful in businesses developing AI systems to perform tasks. This is a data analytics it what is data science ppt infographics design templates pdf template with various stages. Focus and dispense information on three stages using this creative set, that comes with editable features. It contains large content boxes to add your information on topics like algorithms, models, scientific methods. You can also showcase facts, figures, and other relevant content using this PPT layout. Grab it now.

Big Data Types Analyzed To Drive Valuable Developing Strategic Insights Using Big Data Analytics SS V
This slide showcases various types of big data that is used for data analysis which helps in creating deeper insights to enhance business operations. It provides information regarding structure , unstructured and semi structured data. Make sure to capture your audiences attention in your business displays with our gratis customizable Big Data Types Analyzed To Drive Valuable Developing Strategic Insights Using Big Data Analytics SS V. These are great for business strategies, office conferences, capital raising or task suggestions. If you desire to acquire more customers for your tech business and ensure they stay satisfied, create your own sales presentation with these plain slides. This slide showcases various types of big data that is used for data analysis which helps in creating deeper insights to enhance business operations. It provides information regarding structure , unstructured and semi structured data.
Data Modeling Approaches For Modern Analytics Ppt Powerpoint Presentation Complete Deck With Slides
Here is another predesigned PowerPoint Template for professionals looking to bring global recall and recognition to this business. Use this content ready Data Modeling Approaches For Modern Analytics Ppt Powerpoint Presentation Complete Deck With Slides to introduce your business to the larger audience. This readily available complete deck has fifty eight slides and is perfect for helping you give a brief background on your business,specialties,services,etc. Use this aesthetically pleasing PPT Template to streamline your efforts. The presentation template is also equipped to do this with its 100 percent editable and customizable capability. Download now Our Data Modeling Approaches For Modern Analytics Ppt Powerpoint Presentation Complete Deck With Slides are topically designed to provide an attractive backdrop to any subject. Use them to look like a presentation pro.
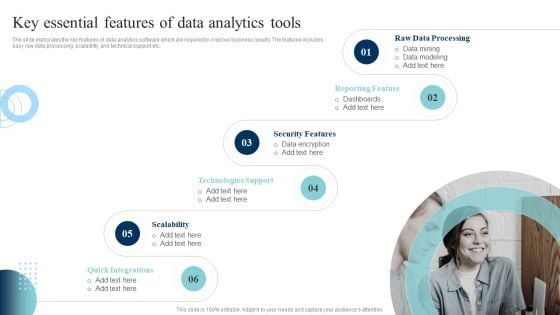
Data Evaluation And Processing Toolkit Key Essential Features Of Data Analytics Tools Inspiration PDF
The slide elaborates the key features of data analytics software which are required to improve business results. The features includes easy raw data processing, scalability, and technical support etc. Here you can discover an assortment of the finest PowerPoint and Google Slides templates. With these templates, you can create presentations for a variety of purposes while simultaneously providing your audience with an eye-catching visual experience. Download Data Evaluation And Processing Toolkit Key Essential Features Of Data Analytics Tools Inspiration PDF to deliver an impeccable presentation. These templates will make your job of preparing presentations much quicker, yet still, maintain a high level of quality. Slidegeeks has experienced researchers who prepare these templates and write high-quality content for you. Later on, you can personalize the content by editing the Data Evaluation And Processing Toolkit Key Essential Features Of Data Analytics Tools Inspiration PDF.
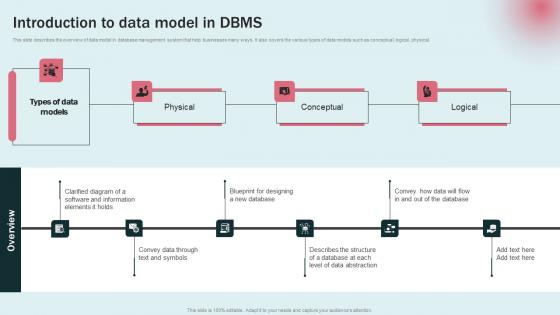
Introduction To Data Model In DBMS Data Modeling Approaches For Modern Analytics Pictures Pdf
This slide describes the overview of data model in database management system that help businesses many ways . It also covers the various types of data models such as conceptual, logical, physical. Make sure to capture your audiences attention in your business displays with our gratis customizable Introduction To Data Model In DBMS Data Modeling Approaches For Modern Analytics Pictures Pdf. These are great for business strategies, office conferences, capital raising or task suggestions. If you desire to acquire more customers for your tech business and ensure they stay satisfied, create your own sales presentation with these plain slides. This slide describes the overview of data model in database management system that help businesses many ways . It also covers the various types of data models such as conceptual, logical, physical.
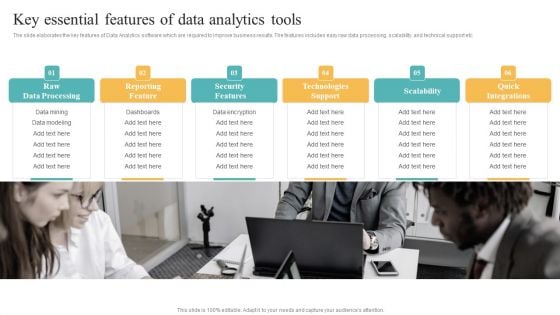
Transformation Toolkit Competitive Intelligence Information Analysis Key Essential Features Of Data Analytics Tools Formats PDF
The slide elaborates the key features of Data Analytics software which are required to improve business results. The features includes easy raw data processing, scalability, and technical support etc Formulating a presentation can take up a lot of effort and time, so the content and message should always be the primary focus. The visuals of the PowerPoint can enhance the presenters message, so our Transformation Toolkit Competitive Intelligence Information Analysis Key Essential Features Of Data Analytics Tools Formats PDF was created to help save time. Instead of worrying about the design, the presenter can concentrate on the message while our designers work on creating the ideal templates for whatever situation is needed. Slidegeeks has experts for everything from amazing designs to valuable content, we have put everything into Transformation Toolkit Competitive Intelligence Information Analysis Key Essential Features Of Data Analytics Tools Formats PDF
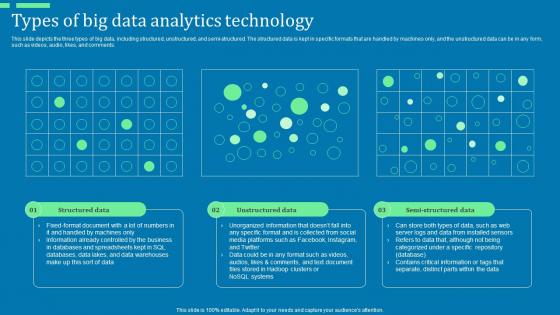
Types Of Big Data Analytics Technology Advanced Tools For Hyperautomation Ppt File Graphics Pictures Pdf
This slide depicts the three types of big data, including structured, unstructured, and semi-structured. The structured data is kept in specific formats that are handled by machines only, and the unstructured data can be in any form, such as videos, audio, likes, and comments. Make sure to capture your audiences attention in your business displays with our gratis customizable Types Of Big Data Analytics Technology Advanced Tools For Hyperautomation Ppt File Graphics Pictures Pdf. These are great for business strategies, office conferences, capital raising or task suggestions. If you desire to acquire more customers for your tech business and ensure they stay satisfied, create your own sales presentation with these plain slides. This slide depicts the three types of big data, including structured, unstructured, and semi-structured. The structured data is kept in specific formats that are handled by machines only, and the unstructured data can be in any form, such as videos, audio, likes, and comments.
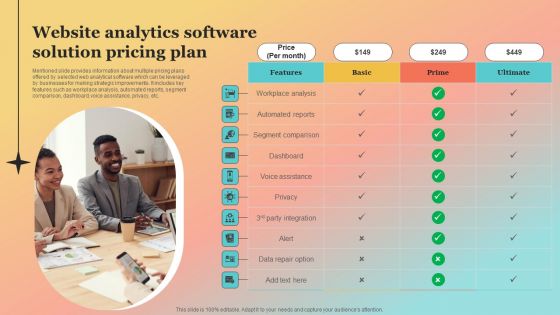
New Website Launch Strategy Website Analytics Software Solution Pricing Plan Microsoft PDF
Mentioned slide provides information about multiple pricing plans offered by selected web analytical software which can be leveraged by businesses for making strategic improvements. It includes key features such as workplace analysis, automated reports, segment comparison, dashboard, voice assistance, privacy, etc. The New Website Launch Strategy Website Analytics Software Solution Pricing Plan Microsoft PDF is a compilation of the most recent design trends as a series of slides. It is suitable for any subject or industry presentation, containing attractive visuals and photo spots for businesses to clearly express their messages. This template contains a variety of slides for the user to input data, such as structures to contrast two elements, bullet points, and slides for written information. Slidegeeks is prepared to create an impression.
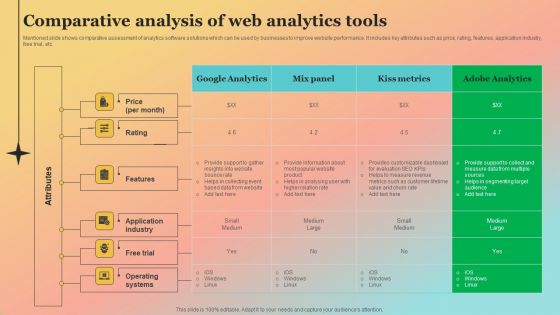
New Website Launch Strategy Comparative Analysis Of Web Analytics Tools Pictures PDF
Mentioned slide shows comparative assessment of analytics software solutions which can be used by businesses to improve website performance. It includes key attributes such as price, rating, features, application industry, free trial, etc. Here you can discover an assortment of the finest PowerPoint and Google Slides templates. With these templates, you can create presentations for a variety of purposes while simultaneously providing your audience with an eye catching visual experience. Download New Website Launch Strategy Comparative Analysis Of Web Analytics Tools Pictures PDF to deliver an impeccable presentation. These templates will make your job of preparing presentations much quicker, yet still, maintain a high level of quality. Slidegeeks has experienced researchers who prepare these templates and write high quality content for you. Later on, you can personalize the content by editing the New Website Launch Strategy Comparative Analysis Of Web Analytics Tools Pictures PDF.
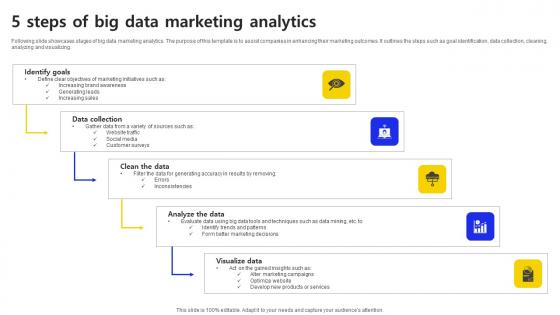
5 Steps Of Big Data Marketing Analytics Ppt Outline Example File PDF
Following slide showcases stages of big data marketing analytics. The purpose of this template is to assist companies in enhancing their marketing outcomes. It outlines the steps such as goal identification, data collection, cleaning, analyzing and visualizing. Showcasing this set of slides titled 5 Steps Of Big Data Marketing Analytics Ppt Outline Example File PDF. The topics addressed in these templates are Goal Identification, Data Collection, Cleaning. All the content presented in this PPT design is completely editable. Download it and make adjustments in color, background, font etc. as per your unique business setting. Following slide showcases stages of big data marketing analytics. The purpose of this template is to assist companies in enhancing their marketing outcomes. It outlines the steps such as goal identification, data collection, cleaning, analyzing and visualizing.
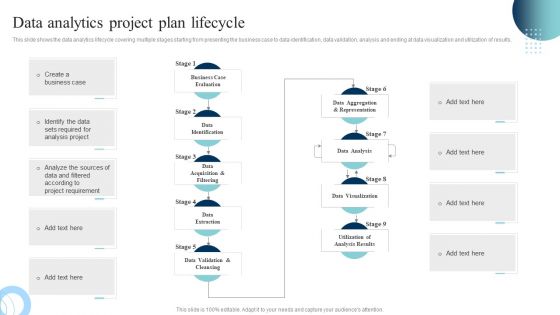
Data Evaluation And Processing Toolkit Data Analytics Project Plan Lifecycle Background PDF
This slide shows the data analytics lifecycle covering multiple stages starting from presenting the business case to data identification, data validation, analysis and ending at data visualization and utilization of results. Are you in need of a template that can accommodate all of your creative concepts This one is crafted professionally and can be altered to fit any style. Use it with Google Slides or PowerPoint. Include striking photographs, symbols, depictions, and other visuals. Fill, move around, or remove text boxes as desired. Test out color palettes and font mixtures. Edit and save your work, or work with colleagues. Download Data Evaluation And Processing Toolkit Data Analytics Project Plan Lifecycle Background PDF and observe how to make your presentation outstanding. Give an impeccable presentation to your group and make your presentation unforgettable.

Government And Public Sector Industry Data Analytics Company Outline Clipart PDF
The following slide highlights the research services offered by Kantar company to the government and public sector industry. It also shows the clients and impact of solutions provided. Make sure to capture your audiences attention in your business displays with our gratis customizable Government And Public Sector Industry Data Analytics Company Outline Clipart PDF These are great for business strategies, office conferences, capital raising or task suggestions. If you desire to acquire more customers for your tech business and ensure they stay satisfied, create your own sales presentation with these plain slides. The following slide highlights the research services offered by Kantar company to the government and public sector industry. It also shows the clients and impact of solutions provided

Current Scenario Analysis Of Big Data Management And Analytics Streamlining Production Ppt Slide
The following slide showcases current scenario analysis of big data management to assess scope of improvement. It includes KPIs such as data accuracy, downtime reduction, etc. Make sure to capture your audiences attention in your business displays with our gratis customizable Current Scenario Analysis Of Big Data Management And Analytics Streamlining Production Ppt Slide These are great for business strategies, office conferences, capital raising or task suggestions. If you desire to acquire more customers for your tech business and ensure they stay satisfied, create your own sales presentation with these plain slides. The following slide showcases current scenario analysis of big data management to assess scope of improvement. It includes KPIs such as data accuracy, downtime reduction, etc.

Information Analysis And BI Playbook The Problem With Todays BI Projects Data Analytics Playbook Portrait PDF
This template depicts that the big data under control is a significant challenge for businesses. It also illustrates that Organizations need for data and analytics has exceeded the volume of insights that companies can currently generate. Do you have an important presentation coming up Are you looking for something that will make your presentation stand out from the rest Look no further than Information Analysis And BI Playbook The Problem With Todays BI Projects Data Analytics Playbook Portrait PDF. With our professional designs, you can trust that your presentation will pop and make delivering it a smooth process. And with Slidegeeks, you can trust that your presentation will be unique and memorable. So why wait Grab Information Analysis And BI Playbook The Problem With Todays BI Projects Data Analytics Playbook Portrait PDF today and make your presentation stand out from the rest.
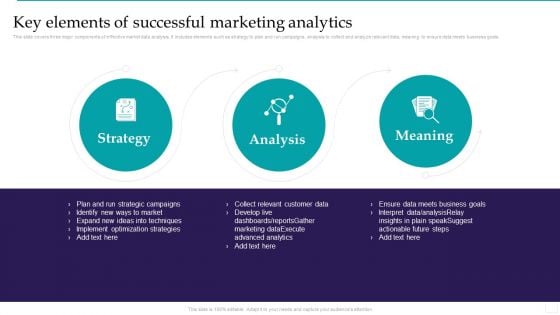
Optimizing Marketing Analytics To Enhance Organizational Growth Key Elements Of Successful Information PDF
This slide covers three major components of effective market data analysis. It includes elements such as strategy to plan and run campaigns, analysis to collect and analyze relevant data, meaning to ensure data meets business goals. Welcome to our selection of the Optimizing Marketing Analytics To Enhance Organizational Growth Key Elements Of Successful Information PDF. These are designed to help you showcase your creativity and bring your sphere to life. Planning and Innovation are essential for any business that is just starting out. This collection contains the designs that you need for your everyday presentations. All of our PowerPoints are 100 percent editable, so you can customize them to suit your needs. This multi purpose template can be used in various situations. Grab these presentation templates today.
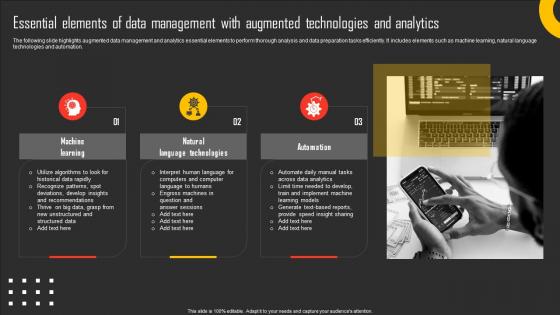
Essential Elements Of Data Management With Augmented Technologies And Analytics Professional Pdf
The following slide highlights augmented data management and analytics essential elements to perform thorough analysis and data preparation tasks efficiently. It includes elements such as machine learning, natural language technologies and automation. Showcasing this set of slides titled Essential Elements Of Data Management With Augmented Technologies And Analytics Professional Pdf. The topics addressed in these templates are Machine Learning, Natural Language Technologies, Automation. All the content presented in this PPT design is completely editable. Download it and make adjustments in color, background, font etc. as per your unique business setting. The following slide highlights augmented data management and analytics essential elements to perform thorough analysis and data preparation tasks efficiently. It includes elements such as machine learning, natural language technologies and automation.
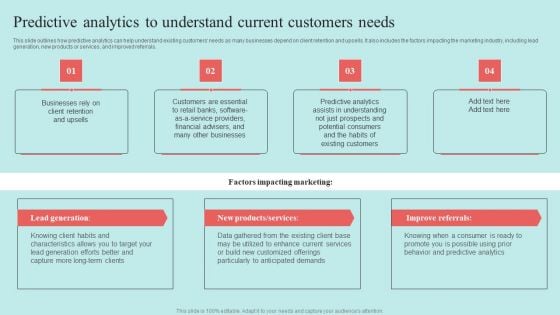
Predictive Data Model Predictive Analytics To Understand Current Customers Needs Infographics PDF
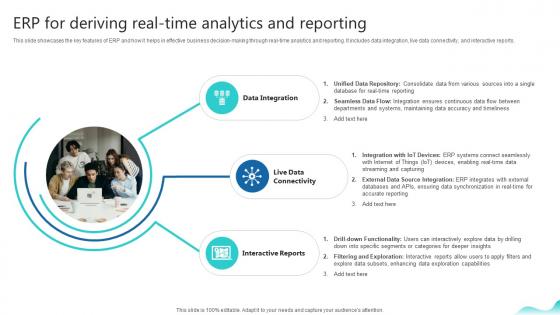
Erp For Deriving Real Time Analytics And Reporting Erp And Digital Transformation For Maximizing DT SS V
This slide showcases the key features of ERP and how it helps in effective business decision-making through real-time analytics and reporting. It includes data integration, live data connectivity, and interactive reports.Retrieve professionally designed Erp For Deriving Real Time Analytics And Reporting Erp And Digital Transformation For Maximizing DT SS V to effectively convey your message and captivate your listeners. Save time by selecting pre-made slideshows that are appropriate for various topics, from business to educational purposes. These themes come in many different styles, from creative to corporate, and all of them are easily adjustable and can be edited quickly. Access them as PowerPoint templates or as Google Slides themes. You do not have to go on a hunt for the perfect presentation because Slidegeeks got you covered from everywhere. This slide showcases the key features of ERP and how it helps in effective business decision-making through real-time analytics and reporting. It includes data integration, live data connectivity, and interactive reports.
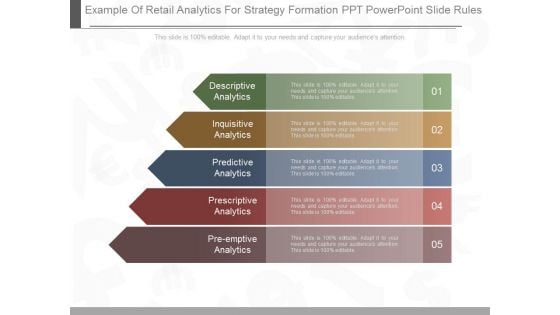
Example Of Retail Analytics For Strategy Formation Ppt Powerpoint Slide Rules
This is a example of retail analytics for strategy formation ppt powerpoint slide rules. This is a five stage process. The stages in this process are descriptive analytics, inquisitive analytics, predictive analytics, prescriptive analytics, pre emptive analytics.

Main Tools Used For Social Media Analytics Cracking The Code Of Social Media
This slide showcases the main tools used for Social Media Analytics. The purpose of this slide is to highlight the major tools of Social Media Analytics such as Hootsuite analytics, Google Analytics, RivalIQ, Brandwatch, etc. Create an editable Main Tools Used For Social Media Analytics Cracking The Code Of Social Media that communicates your idea and engages your audience. Whether you are presenting a business or an educational presentation, pre-designed presentation templates help save time. Main Tools Used For Social Media Analytics Cracking The Code Of Social Media is highly customizable and very easy to edit, covering many different styles from creative to business presentations. Slidegeeks has creative team members who have crafted amazing templates. So, go and get them without any delay. This slide showcases the main tools used for Social Media Analytics. The purpose of this slide is to highlight the major tools of Social Media Analytics such as Hootsuite analytics, Google Analytics, RivalIQ, Brandwatch, etc.
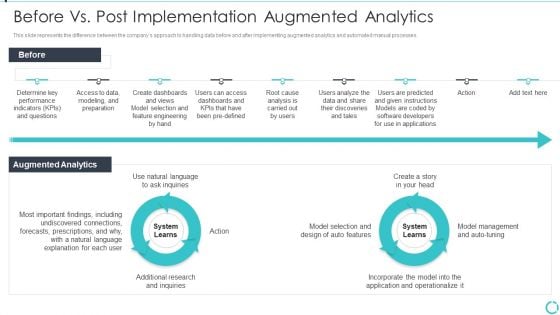
Augmented Analytics Implementation IT Before Vs Post Implementation Augmented Inspiration PDF
This slide represents the difference between the companys approach to handling data before and after implementing augmented analytics and automated manual processes. Deliver and pitch your topic in the best possible manner with this Augmented Analytics Implementation IT Before Vs Post Implementation Augmented Inspiration PDF. Use them to share invaluable insights on Augmented Analytics, Additional Research And Inquiries, Natural Language and impress your audience. This template can be altered and modified as per your expectations. So, grab it now.
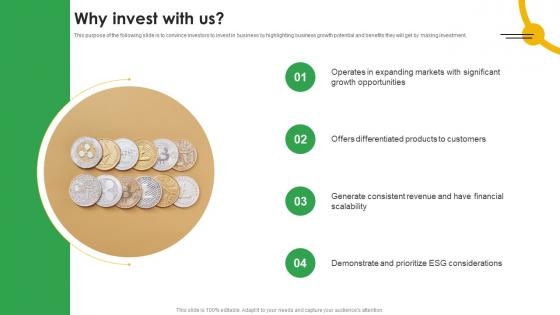
Why Invest With Us Mobile App Analytics Company Fund Raising Pitch Deck Pictures Pdf
This purpose of the following slide is to convince investors to invest in business by highlighting business growth potential and benefits they will get by making investment. Crafting an eye catching presentation has never been more straightforward. Let your presentation shine with this tasteful yet straightforward Why Invest With Us Mobile App Analytics Company Fund Raising Pitch Deck Pictures Pdf template. It offers a minimalistic and classy look that is great for making a statement. The colors have been employed intelligently to add a bit of playfulness while still remaining professional. Construct the ideal Why Invest With Us Mobile App Analytics Company Fund Raising Pitch Deck Pictures Pdf that effortlessly grabs the attention of your audience Begin now and be certain to wow your customers This purpose of the following slide is to convince investors to invest in business by highlighting business growth potential and benefits they will get by making investment.


 Continue with Email

 Home
Home


