Business Analytics

Data Analytics Work Streams With Its Roles And Responsibilities Business Analysis Modification Toolkit Inspiration PDF
This slide highlights the key responsibilities, data work streams and. And data head roles for constructing data analytics project.Deliver an awe inspiring pitch with this creative Data Analytics Work Streams With Its Roles And Responsibilities Business Analysis Modification Toolkit Inspiration PDF bundle. Topics like Machine Learning, Reporting Visualization can be discussed with this completely editable template. It is available for immediate download depending on the needs and requirements of the user.
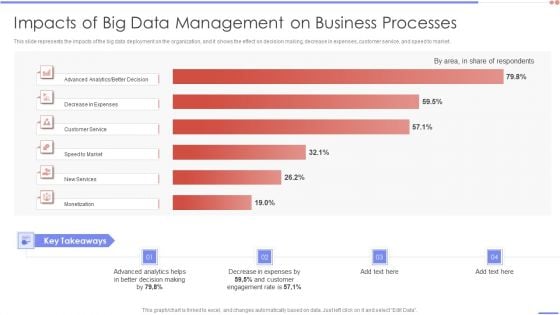
Data Analytics Management Impacts Of Big Data Management On Business Processes Sample PDF
This slide represents the impacts of the big data deployment on the organization, and it shows the effect on decision making, decrease in expenses, customer service, and speed to market.Deliver and pitch your topic in the best possible manner with this Data Analytics Management Impacts Of Big Data Management On Business Processes Sample PDF. Use them to share invaluable insights on Advanced Analytics, Decrease Expenses, Customer Service and impress your audience. This template can be altered and modified as per your expectations. So, grab it now.
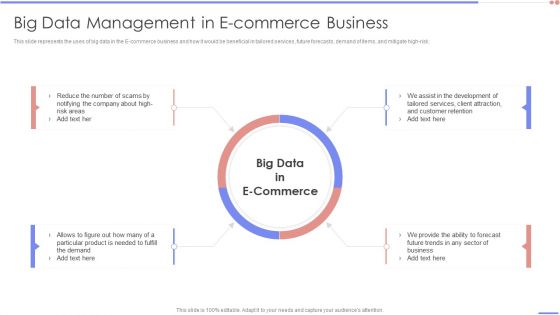
Data Analytics Management Big Data Management In E Commerce Business Structure PDF
This slide represents the uses of big data in the E-commerce business and how it would be beneficial in tailored services, future forecasts, demand of items, and mitigate high-risk.Presenting Data Analytics Management Big Data Management In E Commerce Business Structure PDF to provide visual cues and insights. Share and navigate important information on four stages that need your due attention. This template can be used to pitch topics like Customer Retention, Allows Figure, Particular Product. In addtion, this PPT design contains high resolution images, graphics, etc, that are easily editable and available for immediate download.
Optimizing Marketing Analytics To Enhance Organizational Growth Dashboard For Tracking Business Designs PDF
This slide covers the dashboard for analyzing blogging KPIs such as performance, published posts, views, new blog subscribers, top blog posts by pageviews, top blog posts by CTR, etc. Do you know about Slidesgeeks Optimizing Marketing Analytics To Enhance Organizational Growth Dashboard For Tracking Business Designs PDF These are perfect for delivering any kind od presentation. Using it, create PowerPoint presentations that communicate your ideas and engage audiences. Save time and effort by using our pre designed presentation templates that are perfect for a wide range of topic. Our vast selection of designs covers a range of styles, from creative to business, and are all highly customizable and easy to edit. Download as a PowerPoint template or use them as Google Slides themes.
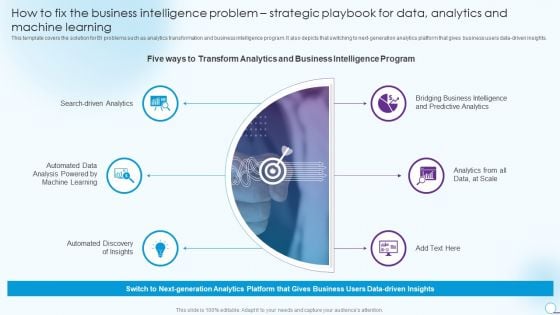
How To Fix The Business Intelligence Problem Strategic Playbook For Data Analytics And Machine Learning Designs PDF
This template covers the solution for BI problems such as analytics transformation and business intelligence program. It also depicts that switching to next generation analytics platform that gives business users data driven insights. This is a How To Fix The Business Intelligence Problem Strategic Playbook For Data Analytics And Machine Learning Designs PDF template with various stages. Focus and dispense information on six stages using this creative set, that comes with editable features. It contains large content boxes to add your information on topics like Automated Data Analysis, Search Driven Analytics, Predictive Analytics. You can also showcase facts, figures, and other relevant content using this PPT layout. Grab it now.
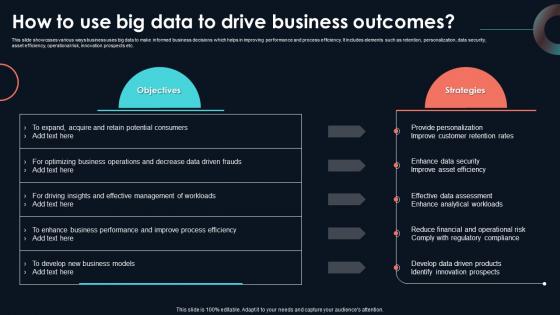
How To Use Big Data To Drive Business Developing Strategic Insights Using Big Data Analytics SS V
This slide showcases various ways business uses big data to make informed business decisions which helps in improving performance and process efficiency. It includes elements such as retention, personalization, data security, asset efficiency, operational risk, innovation prospects etc. Here you can discover an assortment of the finest PowerPoint and Google Slides templates. With these templates, you can create presentations for a variety of purposes while simultaneously providing your audience with an eye-catching visual experience. Download How To Use Big Data To Drive Business Developing Strategic Insights Using Big Data Analytics SS V to deliver an impeccable presentation. These templates will make your job of preparing presentations much quicker, yet still, maintain a high level of quality. Slidegeeks has experienced researchers who prepare these templates and write high-quality content for you. Later on, you can personalize the content by editing the How To Use Big Data To Drive Business Developing Strategic Insights Using Big Data Analytics SS V. This slide showcases various ways business uses big data to make informed business decisions which helps in improving performance and process efficiency. It includes elements such as retention, personalization, data security, asset efficiency, operational risk, innovation prospects etc.

Business Intelligence And Big Data Work Streams Organizational Structure For Data Analytics Formats PDF
This slide shows the organization structure model including the analytics leadership, analytical tool for to obtain the business results. Presenting business intelligence and big data work streams organizational structure for data analytics formats pdf to provide visual cues and insights. Share and navigate important information on two stages that need your due attention. This template can be used to pitch topics like business sponsor, analytics leadership, business owner, it owner. In addtion, this PPT design contains high resolution images, graphics, etc, that are easily editable and available for immediate download.
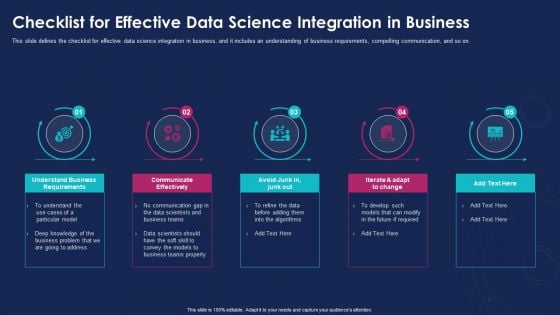
Data Analytics IT Checklist For Effective Data Science Integration In Business Professional PDF
This slide defines the checklist for effective data science integration in business, and it includes an understanding of business requirements, compelling communication, and so on. This is a data analytics it checklist for effective data science integration in business professional pdf template with various stages. Focus and dispense information on five stages using this creative set, that comes with editable features. It contains large content boxes to add your information on topics like business requirements, communicate effectively, iterate and adapt to change. You can also showcase facts, figures, and other relevant content using this PPT layout. Grab it now.
Cognitive Analytics Strategy And Techniques How Cognitive Technology Affects Functional Business Areas Icons PDF
This slide provides information regarding how cognitive technology affect core functional business areas such as front office, middle office and back office. Slidegeeks is one of the best resources for PowerPoint templates. You can download easily and regulate Cognitive Analytics Strategy And Techniques How Cognitive Technology Affects Functional Business Areas Icons PDF for your personal presentations from our wonderful collection. A few clicks is all it takes to discover and get the most relevant and appropriate templates. Use our Templates to add a unique zing and appeal to your presentation and meetings. All the slides are easy to edit and you can use them even for advertisement purposes.
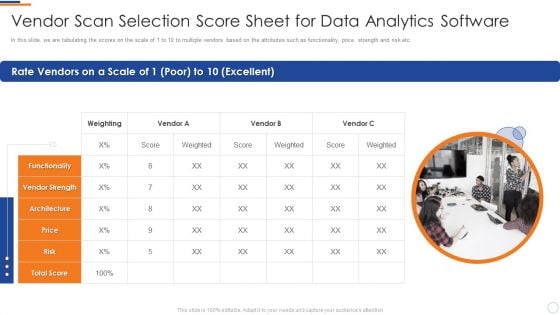
Business Intelligence And Big Vendor Scan Selection Score Sheet For Data Analytics Designs PDF
In this slide, we are tabulating the scores on the scale of 1 to 10 to multiple vendors based on the attributes such as functionality, price, strength and risk etc. Presenting business intelligence and big vendor scan selection score sheet for data analytics designs pdf to provide visual cues and insights. Share and navigate important information on one stages that need your due attention. This template can be used to pitch topics like rate vendors vendor strength, price, risk. In addtion, this PPT design contains high resolution images, graphics, etc, that are easily editable and available for immediate download.
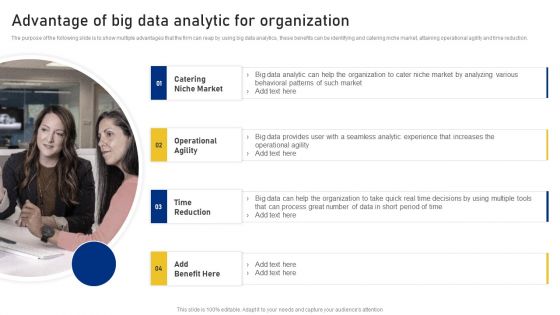
Reshaping Business In Digital Advantage Of Big Data Analytic For Organization Mockup PDF
The purpose of the following slide is to show multiple advantages that the firm can reap by using big data analytics, these benefits can be identifying and catering niche market, attaining This is a Reshaping Business In Digital Advantage Of Big Data Analytic For Organization Mockup PDF template with various stages. Focus and dispense information on four stages using this creative set, that comes with editable features. It contains large content boxes to add your information on topics like Catering Niche Market, Operational Agility, Time Reduction. You can also showcase facts, figures, and other relevant content using this PPT layout. Grab it now.
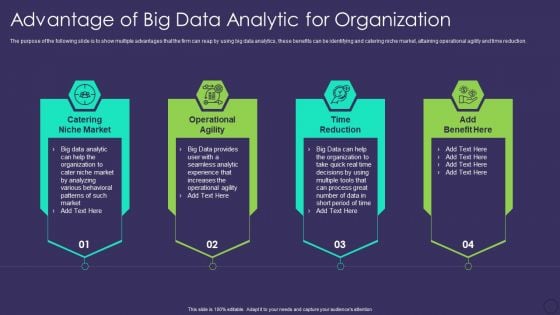
Comprehensive Business Digitization Deck Advantage Of Big Data Analytic For Organization Sample PDF
The purpose of the following slide is to show multiple advantages that the firm can reap by using big data analytics, these benefits can be identifying and catering niche market, attaining operational agility and time reduction. Presenting comprehensive business digitization deck advantage of big data analytic for organization sample pdf to provide visual cues and insights. Share and navigate important information on four stages that need your due attention. This template can be used to pitch topics like catering niche market, operational agility, time reduction. In addtion, this PPT design contains high resolution images, graphics, etc, that are easily editable and available for immediate download.
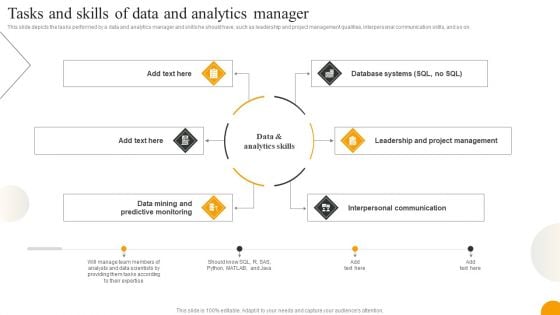
Using Data Science Technologies For Business Transformation Tasks And Skills Of Data And Analytics Manager Brochure PDF
This slide depicts the tasks performed by a data and analytics manager and skills he should have, such as leadership and project management qualities, interpersonal communication skills, and so on. Are you in need of a template that can accommodate all of your creative concepts This one is crafted professionally and can be altered to fit any style. Use it with Google Slides or PowerPoint. Include striking photographs, symbols, depictions, and other visuals. Fill, move around, or remove text boxes as desired. Test out color palettes and font mixtures. Edit and save your work, or work with colleagues. Download Using Data Science Technologies For Business Transformation Tasks And Skills Of Data And Analytics Manager Brochure PDF and observe how to make your presentation outstanding. Give an impeccable presentation to your group and make your presentation unforgettable.
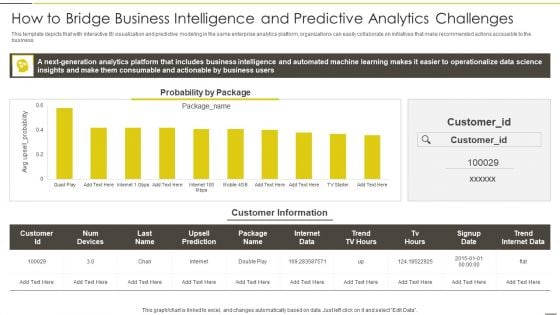
Administered Data And Analytic Quality Playbook How To Bridge Business Intelligence Sample PDF
This template depicts that with interactive BI visualization and predictive modeling in the same enterprise analytics platform, organizations can easily collaborate on initiatives that make recommended actions accessible to the business.Deliver an awe inspiring pitch with this creative Administered Data And Analytic Quality Playbook How To Bridge Business Intelligence Sample PDF bundle. Topics like Generation Analytics, Consumable Actionable, Operationalize Science can be discussed with this completely editable template. It is available for immediate download depending on the needs and requirements of the user.
Administered Data And Analytic Quality Playbook How To Fix The Business Intelligence Problem Icons PDF
This template covers the solution for BI problems such as analytics transformation and business intelligence program. It also depicts that switching to next-generation analytics platform that gives business users data driven insights.This is a Administered Data And Analytic Quality Playbook How To Fix The Business Intelligence Problem Icons PDF template with various stages. Focus and dispense information on six stages using this creative set, that comes with editable features. It contains large content boxes to add your information on topics like Driven Analytics, Automated Discovery, Bridging Business You can also showcase facts, figures, and other relevant content using this PPT layout. Grab it now.
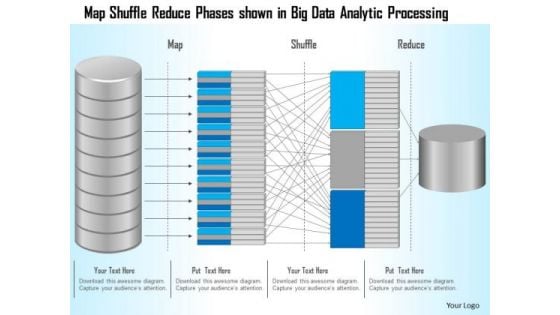
Business Diagram Map Shuffle Reduce Phases Shown In Big Data Analytic Processing Ppt Slide
This technology slide has been designed with graphic of map and data text. This diagram helps to depict concept of data analysis and processing. Use this diagram slide for computer technology related presentations.
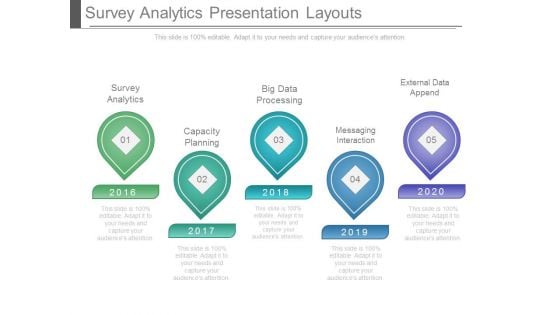
Survey Analytics Presentation Layouts
This is a survey analytics presentation layouts. This is a five stage process. The stages in this process are survey analytics, capacity planning, big data processing, messaging interaction, external data append.
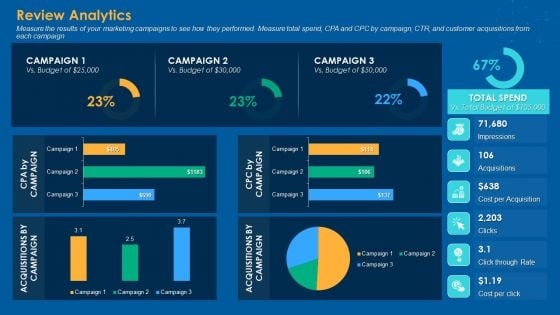
Review Analytics Elements PDF
Deliver and pitch your topic in the best possible manner with this review analytics elements pdf. Use them to share invaluable insights on impressions, acquisitions, cost per acquisition, click through rate, cost per click and impress your audience. This template can be altered and modified as per your expectations. So, grab it now.
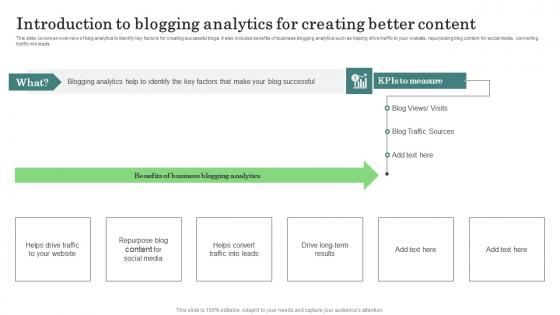
Introduction Blogging Analytics Major Promotional Analytics Future Trends Information Pdf
This slide covers an overview of blog analytics to identify key factors for creating successful blogs. It also includes benefits of business blogging analytics such as helping drive traffic to your website, repurposing blog content for social media, converting traffic into leads Crafting an eye catching presentation has never been more straightforward. Let your presentation shine with this tasteful yet straightforward Introduction Blogging Analytics Major Promotional Analytics Future Trends Information Pdf template. It offers a minimalistic and classy look that is great for making a statement. The colors have been employed intelligently to add a bit of playfulness while still remaining professional. Construct the ideal Introduction Blogging Analytics Major Promotional Analytics Future Trends Information Pdf that effortlessly grabs the attention of your audience Begin now and be certain to wow your customers This slide covers an overview of blog analytics to identify key factors for creating successful blogs. It also includes benefits of business blogging analytics such as helping drive traffic to your website, repurposing blog content for social media, converting traffic into leads

Graph Illustrating Impact Of Prescriptive Analytics Data Analytics SS V
This slide showcases graph highlighting impact analysis of prescriptive analytics on businesses via use of major performance indicators. It provides information total revenue, inventory levels and labour costs with key insights.Take your projects to the next level with our ultimate collection of Graph Illustrating Impact Of Prescriptive Analytics Data Analytics SS V. Slidegeeks has designed a range of layouts that are perfect for representing task or activity duration, keeping track of all your deadlines at a glance. Tailor these designs to your exact needs and give them a truly corporate look with your own brand colors they will make your projects stand out from the rest This slide showcases graph highlighting impact analysis of prescriptive analytics on businesses via use of major performance indicators. It provides information total revenue, inventory levels and labour costs with key insights.
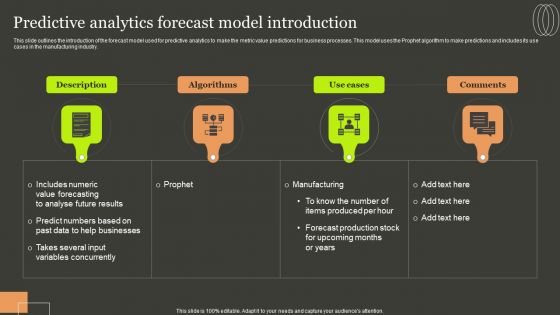
Predictive Analytics Methods Predictive Analytics Forecast Model Introduction Rules PDF
This slide outlines the introduction of the forecast model used for predictive analytics to make the metric value predictions for business processes. This model uses the Prophet algorithm to make predictions and includes its use cases in the manufacturing industry. Make sure to capture your audiences attention in your business displays with our gratis customizable Predictive Analytics Methods Predictive Analytics Forecast Model Introduction Rules PDF. These are great for business strategies, office conferences, capital raising or task suggestions. If you desire to acquire more customers for your tech business and ensure they stay satisfied, create your own sales presentation with these plain slides.

Prescriptive Analytics Software Tool Rapidminer Data Analytics SS V
This slide provides overview of RapidMiner as a prescriptive analytics tool to help businesses evaluate its usability. It covers details of RapidMiner regarding description, features and pricing plans.Are you searching for a Prescriptive Analytics Software Tool Rapidminer Data Analytics SS V that is uncluttered, straightforward, and original Its easy to edit, and you can change the colors to suit your personal or business branding. For a presentation that expresses how much effort you have put in, this template is ideal With all of its features, including tables, diagrams, statistics, and lists, its perfect for a business plan presentation. Make your ideas more appealing with these professional slides. Download Prescriptive Analytics Software Tool Rapidminer Data Analytics SS V from Slidegeeks today. This slide provides overview of RapidMiner as a prescriptive analytics tool to help businesses evaluate its usability. It covers details of RapidMiner regarding description, features and pricing plans.
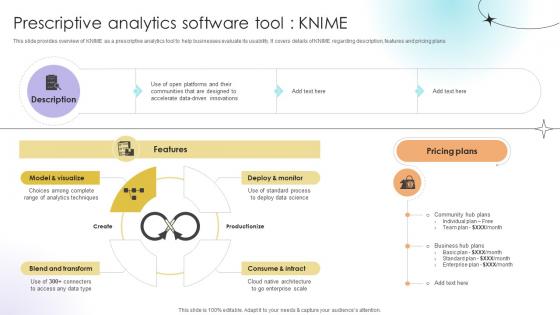
Prescriptive Analytics Software Tool Knime Data Analytics SS V
This slide provides overview of KNIME as a prescriptive analytics tool to help businesses evaluate its usability. It covers details of KNIME regarding description, features and pricing plans.The Prescriptive Analytics Software Tool Knime Data Analytics SS V is a compilation of the most recent design trends as a series of slides. It is suitable for any subject or industry presentation, containing attractive visuals and photo spots for businesses to clearly express their messages. This template contains a variety of slides for the user to input data, such as structures to contrast two elements, bullet points, and slides for written information. Slidegeeks is prepared to create an impression. This slide provides overview of KNIME as a prescriptive analytics tool to help businesses evaluate its usability. It covers details of KNIME regarding description, features and pricing plans.
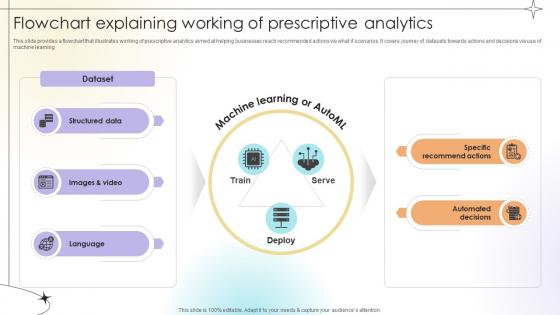
Flowchart Explaining Working Of Prescriptive Analytics Data Analytics SS V
This slide provides a flowchart that illustrates working of prescriptive analytics aimed at helping businesses reach recommended actions via what if scenarios. It covers journey of datasets towards actions and decisions via use of machine learning.This Flowchart Explaining Working Of Prescriptive Analytics Data Analytics SS V from Slidegeeks makes it easy to present information on your topic with precision. It provides customization options, so you can make changes to the colors, design, graphics, or any other component to create a unique layout. It is also available for immediate download, so you can begin using it right away. Slidegeeks has done good research to ensure that you have everything you need to make your presentation stand out. Make a name out there for a brilliant performance. This slide provides a flowchart that illustrates working of prescriptive analytics aimed at helping businesses reach recommended actions via what if scenarios. It covers journey of datasets towards actions and decisions via use of machine learning.
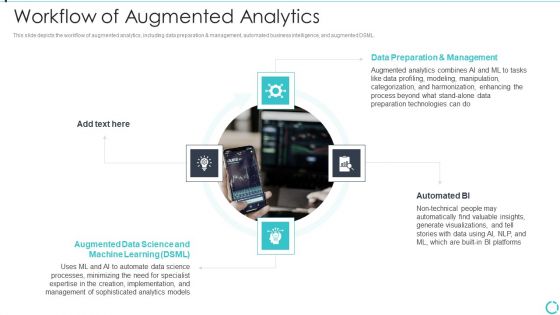
Augmented Analytics Implementation IT Workflow Of Augmented Analytics Demonstration PDF
This slide depicts the workflow of augmented analytics, including data preparation and management, automated business intelligence, and augmented DSML. This is a Augmented Analytics Implementation IT Workflow Of Augmented Analytics Demonstration PDF template with various stages. Focus and dispense information on four stages using this creative set, that comes with editable features. It contains large content boxes to add your information on topics like Data Preparation And Management, Automated BI, Augmented Data Science And Machine Learning. You can also showcase facts, figures, and other relevant content using this PPT layout. Grab it now.
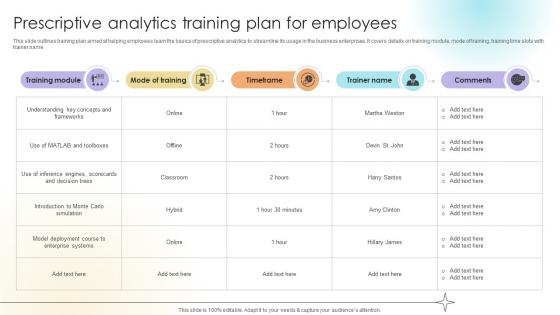
Prescriptive Analytics Training Plan For Employees Data Analytics SS V
This slide outlines training plan aimed at helping employees learn the basics of prescriptive analytics to streamline its usage in the business enterprises. It covers details on training module, mode of training, training time slots with trainer name.Slidegeeks has constructed Prescriptive Analytics Training Plan For Employees Data Analytics SS V after conducting extensive research and examination. These presentation templates are constantly being generated and modified based on user preferences and critiques from editors. Here, you will find the most attractive templates for a range of purposes while taking into account ratings and remarks from users regarding the content. This is an excellent jumping-off point to explore our content and will give new users an insight into our top-notch PowerPoint Templates. This slide outlines training plan aimed at helping employees learn the basics of prescriptive analytics to streamline its usage in the business enterprises. It covers details on training module, mode of training, training time slots with trainer name.
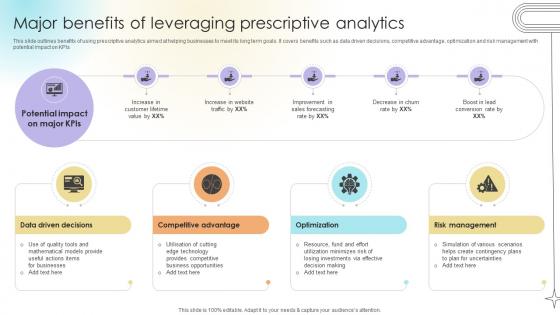
Major Benefits Of Leveraging Prescriptive Analytics Data Analytics SS V
This slide outlines benefits of using prescriptive analytics aimed at helping businesses to meet its long term goals. It covers benefits such as data driven decisions, competitive advantage, optimization and risk management with potential impact on KPIs.Are you in need of a template that can accommodate all of your creative concepts This one is crafted professionally and can be altered to fit any style. Use it with Google Slides or PowerPoint. Include striking photographs, symbols, depictions, and other visuals. Fill, move around, or remove text boxes as desired. Test out color palettes and font mixtures. Edit and save your work, or work with colleagues. Download Major Benefits Of Leveraging Prescriptive Analytics Data Analytics SS V and observe how to make your presentation outstanding. Give an impeccable presentation to your group and make your presentation unforgettable. This slide outlines benefits of using prescriptive analytics aimed at helping businesses to meet its long term goals. It covers benefits such as data driven decisions, competitive advantage, optimization and risk management with potential impact on KPIs.
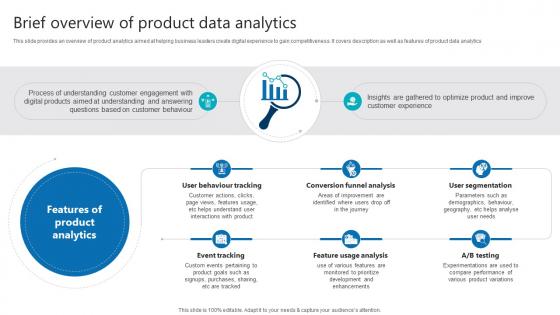
Brief Overview Of Product Data Analytics Product Analytics Implementation Data Analytics V
This slide provides an overview of product analytics aimed at helping business leaders create digital experience to gain competitiveness. It covers description as well as features of product data analytics Get a simple yet stunning designed Brief Overview Of Product Data Analytics Product Analytics Implementation Data Analytics V. It is the best one to establish the tone in your meetings. It is an excellent way to make your presentations highly effective. So, download this PPT today from Slidegeeks and see the positive impacts. Our easy-to-edit Brief Overview Of Product Data Analytics Product Analytics Implementation Data Analytics V can be your go-to option for all upcoming conferences and meetings. So, what are you waiting for Grab this template today. This slide provides an overview of product analytics aimed at helping business leaders create digital experience to gain competitiveness. It covers description as well as features of product data analytics

Implementation Timeline Of Product Analytics In Organisation Product Analytics Implementation Data Analytics V
This slide illustrates a weekly timeline of activities undertaken while implementing product analytics in businesses to streamline operations. It covers activities under four heads choose simple use case, implement data governance, democratize product analytics and build expe4rimentataion culture Retrieve professionally designed Implementation Timeline Of Product Analytics In Organisation Product Analytics Implementation Data Analytics V to effectively convey your message and captivate your listeners. Save time by selecting pre-made slideshows that are appropriate for various topics, from business to educational purposes. These themes come in many different styles, from creative to corporate, and all of them are easily adjustable and can be edited quickly. Access them as PowerPoint templates or as Google Slides themes. You do not have to go on a hunt for the perfect presentation because Slidegeeks got you covered from everywhere. This slide illustrates a weekly timeline of activities undertaken while implementing product analytics in businesses to streamline operations. It covers activities under four heads choose simple use case, implement data governance, democratize product analytics and build expe4rimentataion culture
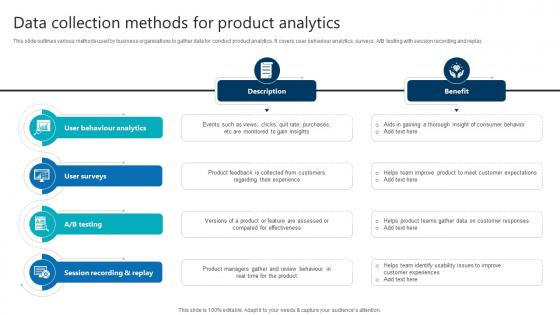
Data Collection Methods For Product Analytics Product Analytics Implementation Data Analytics V
This slide outlines various methods used by business organisations to gather data for conduct product analytics. It covers user behaviour analytics, surveys, A or B testing with session recording and replay.Crafting an eye-catching presentation has never been more straightforward. Let your presentation shine with this tasteful yet straightforward Data Collection Methods For Product Analytics Product Analytics Implementation Data Analytics V template. It offers a minimalistic and classy look that is great for making a statement. The colors have been employed intelligently to add a bit of playfulness while still remaining professional. Construct the ideal Data Collection Methods For Product Analytics Product Analytics Implementation Data Analytics V that effortlessly grabs the attention of your audience Begin now and be certain to wow your customers This slide outlines various methods used by business organisations to gather data for conduct product analytics. It covers user behaviour analytics, surveys, A or B testing with session recording and replay.

Types Of Data Monitored In Product Analytics Product Analytics Implementation Data Analytics V
This slide outlines major categories of data tracked using product analytics aimed at improving performance to increase business revenue. It covers categories such as event tracking as well as properties Are you searching for a Types Of Data Monitored In Product Analytics Product Analytics Implementation Data Analytics V that is uncluttered, straightforward, and original Its easy to edit, and you can change the colors to suit your personal or business branding. For a presentation that expresses how much effort you have put in, this template is ideal With all of its features, including tables, diagrams, statistics, and lists, its perfect for a business plan presentation. Make your ideas more appealing with these professional slides. Download Types Of Data Monitored In Product Analytics Product Analytics Implementation Data Analytics V from Slidegeeks today. This slide outlines major categories of data tracked using product analytics aimed at improving performance to increase business revenue. It covers categories such as event tracking as well as properties
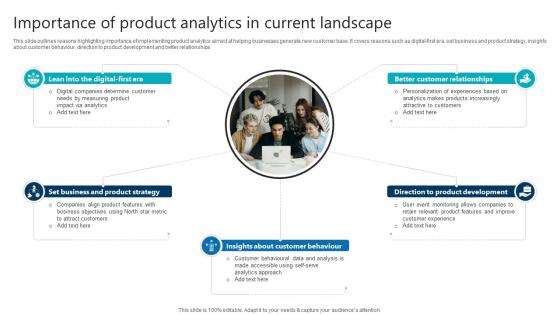
Importance Of Product Analytics In Current Landscape Product Analytics Implementation Data Analytics V
This slide outlines reasons highlighting importance of implementing product analytics aimed at helping businesses generate new customer base. It covers reasons such as digital-first era, set business and product strategy, insights about customer behaviour, direction to product development and better relationships Slidegeeks has constructed Importance Of Product Analytics In Current Landscape Product Analytics Implementation Data Analytics V after conducting extensive research and examination. These presentation templates are constantly being generated and modified based on user preferences and critiques from editors. Here, you will find the most attractive templates for a range of purposes while taking into account ratings and remarks from users regarding the content. This is an excellent jumping-off point to explore our content and will give new users an insight into our top-notch PowerPoint Templates. This slide outlines reasons highlighting importance of implementing product analytics aimed at helping businesses generate new customer base. It covers reasons such as digital-first era, set business and product strategy, insights about customer behaviour, direction to product development and better relationships
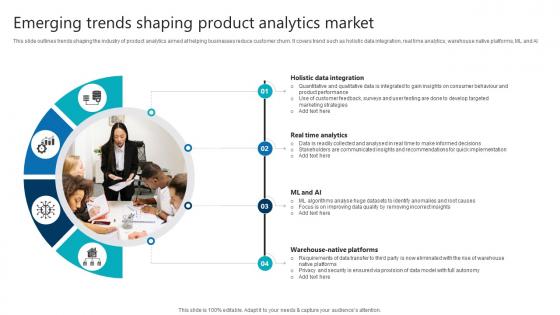
Emerging Trends Shaping Product Analytics Market Product Analytics Implementation Data Analytics V
This slide outlines trends shaping the industry of product analytics aimed at helping businesses reduce customer churn. It covers trend such as holistic data integration, real time analytics, warehouse native platforms, ML and AI Formulating a presentation can take up a lot of effort and time, so the content and message should always be the primary focus. The visuals of the PowerPoint can enhance the presenters message, so our Emerging Trends Shaping Product Analytics Market Product Analytics Implementation Data Analytics V was created to help save time. Instead of worrying about the design, the presenter can concentrate on the message while our designers work on creating the ideal templates for whatever situation is needed. Slidegeeks has experts for everything from amazing designs to valuable content, we have put everything into Emerging Trends Shaping Product Analytics Market Product Analytics Implementation Data Analytics V. This slide outlines trends shaping the industry of product analytics aimed at helping businesses reduce customer churn. It covers trend such as holistic data integration, real time analytics, warehouse native platforms, ML and AI

Product Analytics Training Plan For Employees Product Analytics Implementation Data Analytics V
This slide outlines training plan aimed at helping employees learn the basics of product analytics to streamline its usage in the business enterprises. It covers details on training module, mode of training, training time slots with trainer name.Whether you have daily or monthly meetings, a brilliant presentation is necessary. Product Analytics Training Plan For Employees Product Analytics Implementation Data Analytics V can be your best option for delivering a presentation. Represent everything in detail using Product Analytics Training Plan For Employees Product Analytics Implementation Data Analytics V and make yourself stand out in meetings. The template is versatile and follows a structure that will cater to your requirements. All the templates prepared by Slidegeeks are easy to download and edit. Our research experts have taken care of the corporate themes as well. So, give it a try and see the results. This slide outlines training plan aimed at helping employees learn the basics of product analytics to streamline its usage in the business enterprises. It covers details on training module, mode of training, training time slots with trainer name.
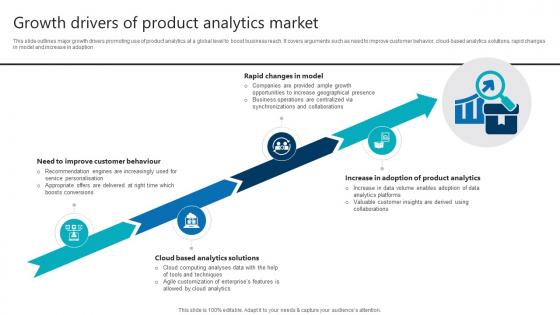
Growth Drivers Of Product Analytics Market Product Analytics Implementation Data Analytics V
This slide outlines major growth drivers promoting use of product analytics at a global level to boost business reach. It covers arguments such as need to improve customer behavior, cloud-based analytics solutions, rapid changes in model and increase in adoption This modern and well-arranged Growth Drivers Of Product Analytics Market Product Analytics Implementation Data Analytics V provides lots of creative possibilities. It is very simple to customize and edit with the Powerpoint Software. Just drag and drop your pictures into the shapes. All facets of this template can be edited with Powerpoint, no extra software is necessary. Add your own material, put your images in the places assigned for them, adjust the colors, and then you can show your slides to the world, with an animated slide included. This slide outlines major growth drivers promoting use of product analytics at a global level to boost business reach. It covers arguments such as need to improve customer behavior, cloud-based analytics solutions, rapid changes in model and increase in adoption
Oracle Analytics Cloud Solutions Predictive Analytics Icons PDF
This slide represents the predictive analytics solution of the oracle analytics cloud and how it is helpful to predict outputs and display quickly with the help of ML. Deliver an awe inspiring pitch with this creative oracle analytics cloud solutions predictive analytics icons pdf bundle. Topics like oracle analytics cloud solutions predictive analytics can be discussed with this completely editable template. It is available for immediate download depending on the needs and requirements of the user.
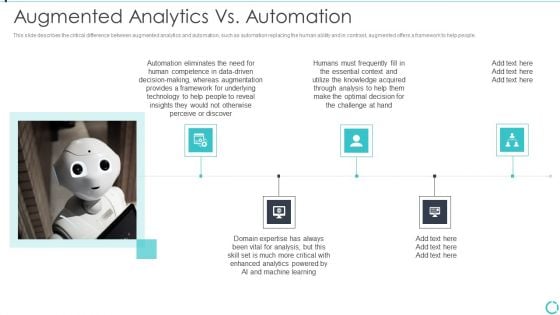
Augmented Analytics Implementation IT Augmented Analytics Vs Automation Topics PDF
This slide describes the critical difference between augmented analytics and automation, such as automation replacing the human ability and in contrast, augmented offers a framework to help people. Deliver an awe inspiring pitch with this creative Augmented Analytics Implementation IT Augmented Analytics Vs Automation Topics PDF bundle. Topics like Automation Eliminates, Human Competence, Domain Expertise, Machine Learning can be discussed with this completely editable template. It is available for immediate download depending on the needs and requirements of the user.
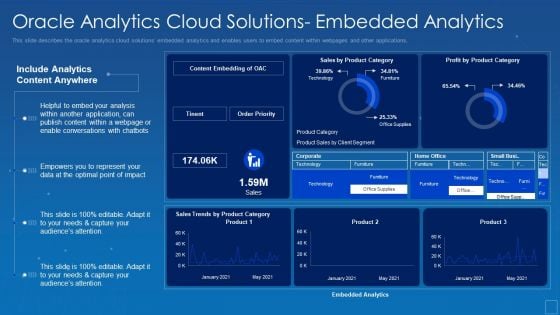
Oracle Analytics Cloud Solutions Embedded Analytics Elements PDF
This slide describes the oracle analytics cloud solutions embedded analytics and enables users to embed content within webpages and other applications. Deliver an awe inspiring pitch with this creative oracle analytics cloud solutions embedded analytics elements pdf bundle. Topics like application, conversations, optimal, empowers, analytics can be discussed with this completely editable template. It is available for immediate download depending on the needs and requirements of the user.
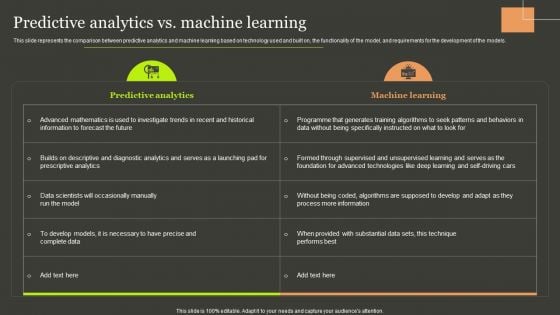
Predictive Analytics Methods Predictive Analytics Vs Machine Learning Background PDF
This slide represents the comparison between predictive analytics and machine learning based on technology used and built on, the functionality of the model, and requirements for the development of the models. There are so many reasons you need a Predictive Analytics Methods Predictive Analytics Vs Machine Learning Background PDF. The first reason is you can not spend time making everything from scratch, Thus, Slidegeeks has made presentation templates for you too. You can easily download these templates from our website easily.
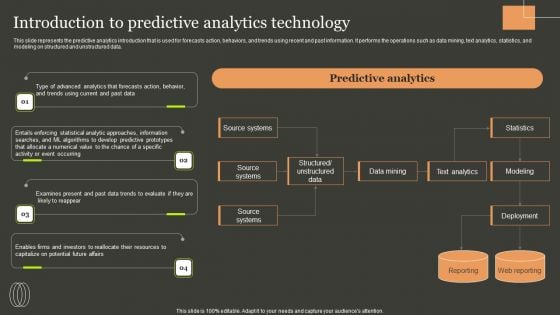
Predictive Analytics Methods Introduction To Predictive Analytics Technology Clipart PDF
This slide represents the predictive analytics introduction that is used for forecasts action, behaviors, and trends using recent and past information. It performs the operations such as data mining, text analytics, statistics, and modeling on structured and unstructured data. Do you have to make sure that everyone on your team knows about any specific topic I yes, then you should give Predictive Analytics Methods Introduction To Predictive Analytics Technology Clipart PDF a try. Our experts have put a lot of knowledge and effort into creating this impeccable Predictive Analytics Methods Introduction To Predictive Analytics Technology Clipart PDF. You can use this template for your upcoming presentations, as the slides are perfect to represent even the tiniest detail. You can download these templates from the Slidegeeks website and these are easy to edit. So grab these today.
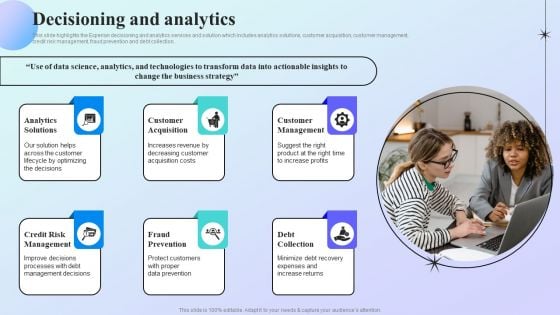
Information Analytics Company Outline Decisioning And Analytics Professional PDF
This slide highlights the Experian decisioning and analytics services and solution which includes analytics solutions, customer acquisition, customer management, credit risk management, fraud prevention and debt collection. There are so many reasons you need a Information Analytics Company Outline Decisioning And Analytics Professional PDF. The first reason is you cannot spend time making everything from scratch, Thus, Slidegeeks has made presentation templates for you too. You can easily download these templates from our website easily.
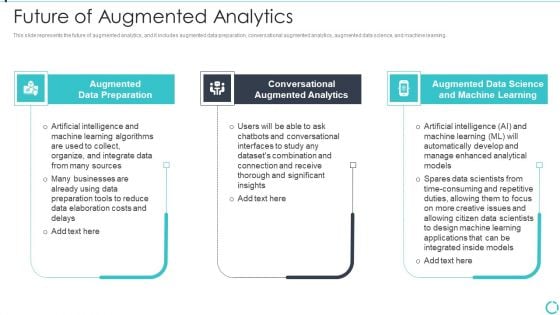
Augmented Analytics Implementation IT Future Of Augmented Analytics Brochure PDF
This slide represents the future of augmented analytics, and it includes augmented data preparation, conversational augmented analytics, augmented data science, and machine learning. Presenting Augmented Analytics Implementation IT Future Of Augmented Analytics Brochure PDF to provide visual cues and insights. Share and navigate important information on three stages that need your due attention. This template can be used to pitch topics like Augmented Data Preparation, Conversational Augmented Analytics, Augmented Data Science, Machine Learning. In addtion, this PPT design contains high resolution images, graphics, etc, that are easily editable and available for immediate download.
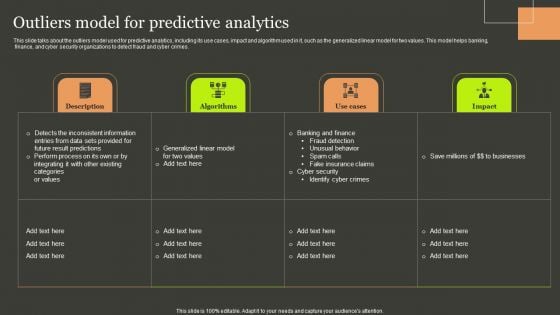
Predictive Analytics Methods Outliers Model For Predictive Analytics Designs PDF
This slide talks about the outliers model used for predictive analytics, including its use cases, impact and algorithm used in it, such as the generalized linear model for two values. This model helps banking, finance, and cyber security organizations to detect fraud and cyber crimes. From laying roadmaps to briefing everything in detail, our templates are perfect for you. You can set the stage with your presentation slides. All you have to do is download these easy to edit and customizable templates. Predictive Analytics Methods Outliers Model For Predictive Analytics Designs PDF will help you deliver an outstanding performance that everyone would remember and praise you for. Do download this presentation today.

Prescriptive Analytics Software Tool Tableau Data Analytics SS V
This slide provides overview of Tableau as a data analytics tools providing data visualization features. It covers details of Tableau regarding description, features and pricing plans.Retrieve professionally designed Prescriptive Analytics Software Tool Tableau Data Analytics SS V to effectively convey your message and captivate your listeners. Save time by selecting pre-made slideshows that are appropriate for various topics, from business to educational purposes. These themes come in many different styles, from creative to corporate, and all of them are easily adjustable and can be edited quickly. Access them as PowerPoint templates or as Google Slides themes. You do not have to go on a hunt for the perfect presentation because Slidegeeks got you covered from everywhere. This slide provides overview of Tableau as a data analytics tools providing data visualization features. It covers details of Tableau regarding description, features and pricing plans.

Predictive Analytics Methods Tools Used For Predictive Analytics Formats PDF
This slide depicts the tools used for predictive analytics to perform operations in predictive models. These tools include SPSS statistics, SAS advanced analytics, SAP predictive analytics, TIBCO Statistica, H2O, and Q research. From laying roadmaps to briefing everything in detail, our templates are perfect for you. You can set the stage with your presentation slides. All you have to do is download these easy to edit and customizable templates. Predictive Analytics Methods Tools Used For Predictive Analytics Formats PDF will help you deliver an outstanding performance that everyone would remember and praise you for. Do download this presentation today.
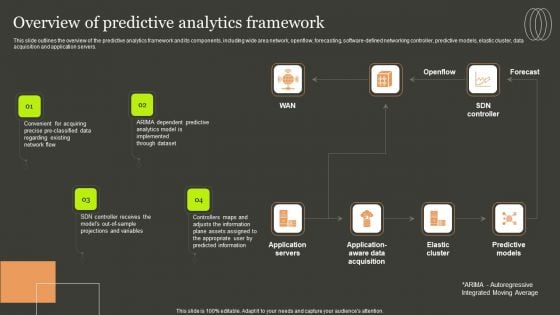
Predictive Analytics Methods Overview Of Predictive Analytics Framework Introduction PDF
This slide outlines the overview of the predictive analytics framework and its components, including wide area network, openflow, forecasting, software-defined networking controller, predictive models, elastic cluster, data acquisition and application servers. Slidegeeks is here to make your presentations a breeze with Predictive Analytics Methods Overview Of Predictive Analytics Framework Introduction PDF With our easy to use and customizable templates, you can focus on delivering your ideas rather than worrying about formatting. With a variety of designs to choose from, you are sure to find one that suits your needs. And with animations and unique photos, illustrations, and fonts, you can make your presentation pop. So whether you are giving a sales pitch or presenting to the board, make sure to check out Slidegeeks first.
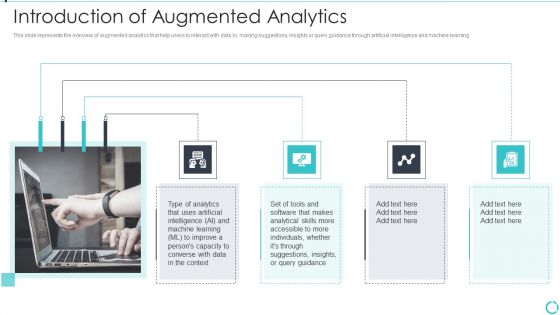
Augmented Analytics Implementation IT Introduction Of Augmented Analytics Portrait PDF
This slide represents the overview of augmented analytics that help users to interact with data by making suggestions, insights or query guidance through artificial intelligence and machine learning. Presenting Augmented Analytics Implementation IT Introduction Of Augmented Analytics Portrait PDF to provide visual cues and insights. Share and navigate important information on four stages that need your due attention. This template can be used to pitch topics like Analytics, Converse Data, Analytical Skills. In addtion, this PPT design contains high resolution images, graphics, etc, that are easily editable and available for immediate download.
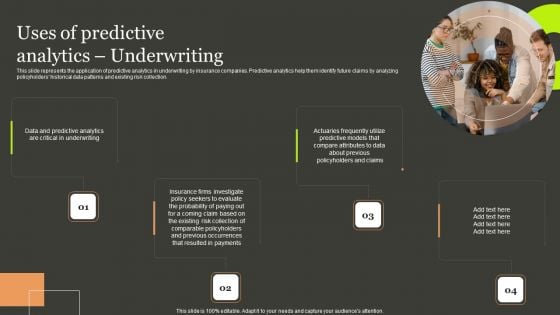
Predictive Analytics Methods Uses Of Predictive Analytics Underwriting Infographics PDF
This slide represents the application of predictive analytics in underwriting by insurance companies. Predictive analytics help them identify future claims by analyzing policyholders historical data patterns and existing risk collection. Do you have an important presentation coming up Are you looking for something that will make your presentation stand out from the rest Look no further than Predictive Analytics Methods Uses Of Predictive Analytics Underwriting Infographics PDF. With our professional designs, you can trust that your presentation will pop and make delivering it a smooth process. And with Slidegeeks, you can trust that your presentation will be unique and memorable. So why wait Grab Predictive Analytics Methods Uses Of Predictive Analytics Underwriting Infographics PDF today and make your presentation stand out from the rest.
Customer Behavioral Data And Analytics Purchasing Behavior Analytics Brochure PDF
This is a customer behavioral data and analytics purchasing behavior analytics brochure pdf template with various stages. Focus and dispense information on two stages using this creative set, that comes with editable features. It contains large content boxes to add your information on topics like purchasing behavior analytics. You can also showcase facts, figures, and other relevant content using this PPT layout. Grab it now.
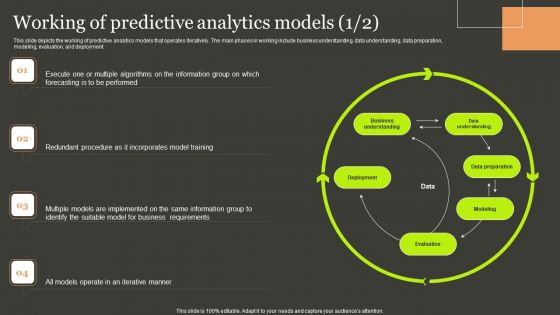
Predictive Analytics Methods Working Of Predictive Analytics Models Summary PDF
This slide depicts the working of predictive analytics models that operates iteratively. The main phases in working include business understanding, data understanding, data preparation, modeling, evaluation, and deployment. Find highly impressive Predictive Analytics Methods Working Of Predictive Analytics Models Summary PDF on Slidegeeks to deliver a meaningful presentation. You can save an ample amount of time using these presentation templates. No need to worry to prepare everything from scratch because Slidegeeks experts have already done a huge research and work for you. You need to download Predictive Analytics Methods Working Of Predictive Analytics Models Summary PDF for your upcoming presentation. All the presentation templates are 100 percent editable and you can change the color and personalize the content accordingly. Download now.
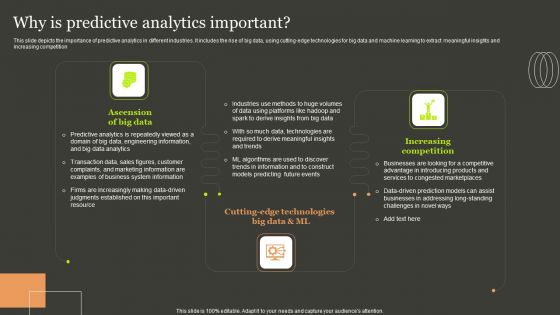
Predictive Analytics Methods Why Is Predictive Analytics Important Ideas PDF
This slide depicts the importance of predictive analytics in different industries. It includes the rise of big data, using cutting-edge technologies for big data and machine learning to extract meaningful insights and increasing competition. Whether you have daily or monthly meetings, a brilliant presentation is necessary. Predictive Analytics Methods Why Is Predictive Analytics Important Ideas PDF can be your best option for delivering a presentation. Represent everything in detail using Predictive Analytics Methods Why Is Predictive Analytics Important Ideas PDF and make yourself stand out in meetings. The template is versatile and follows a structure that will cater to your requirements. All the templates prepared by Slidegeeks are easy to download and edit. Our research experts have taken care of the corporate themes as well. So, give it a try and see the results.
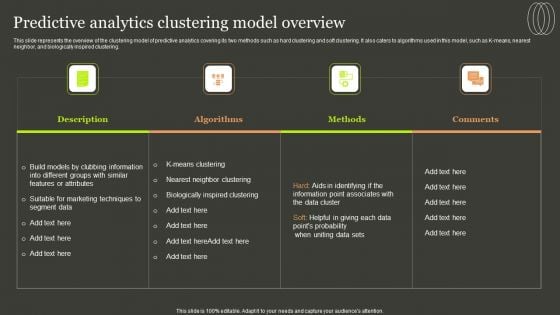
Predictive Analytics Methods Predictive Analytics Clustering Model Overview Template PDF
This slide represents the overview of the clustering model of predictive analytics covering its two methods such as hard clustering and soft clustering. It also caters to algorithms used in this model, such as K-means, nearest neighbor, and biologically inspired clustering. Whether you have daily or monthly meetings, a brilliant presentation is necessary. Predictive Analytics Methods Predictive Analytics Clustering Model Overview Template PDF can be your best option for delivering a presentation. Represent everything in detail using Predictive Analytics Methods Predictive Analytics Clustering Model Overview Template PDF and make yourself stand out in meetings. The template is versatile and follows a structure that will cater to your requirements. All the templates prepared by Slidegeeks are easy to download and edit. Our research experts have taken care of the corporate themes as well. So, give it a try and see the results.
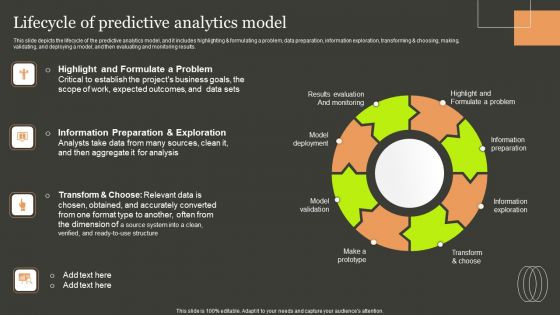
Predictive Analytics Methods Lifecycle Of Predictive Analytics Model Portrait PDF
This slide depicts the lifecycle of the predictive analytics model, and it includes highlighting and formulating a problem, data preparation, information exploration, transforming and choosing, making, validating, and deploying a model, and then evaluating and monitoring results. Crafting an eye catching presentation has never been more straightforward. Let your presentation shine with this tasteful yet straightforward Predictive Analytics Methods Lifecycle Of Predictive Analytics Model Portrait PDF template. It offers a minimalistic and classy look that is great for making a statement. The colors have been employed intelligently to add a bit of playfulness while still remaining professional. Construct the ideal Predictive Analytics Methods Lifecycle Of Predictive Analytics Model Portrait PDF that effortlessly grabs the attention of your audience Begin now and be certain to wow your customers.

Predictive Analytics Methods Predictive Analytics Classification Model Introduction Designs PDF
This slide describes the overview of the classification model used in predictive analytics, including the questions it answers. It also contains algorithms used in this model, such as random forest, gradient boosted model, convolution neural network, bagging, and stacking. Do you have an important presentation coming up Are you looking for something that will make your presentation stand out from the rest Look no further than Predictive Analytics Methods Predictive Analytics Classification Model Introduction Designs PDF. With our professional designs, you can trust that your presentation will pop and make delivering it a smooth process. And with Slidegeeks, you can trust that your presentation will be unique and memorable. So why wait Grab Predictive Analytics Methods Predictive Analytics Classification Model Introduction Designs PDF today and make your presentation stand out from the rest.
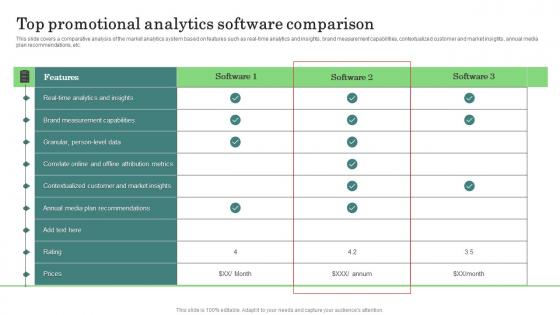
Top Promotional Analytics Major Promotional Analytics Future Trends Diagrams Pdf
This slide covers a comparative analysis of the market analytics system based on features such as real time analytics and insights, brand measurement capabilities, contextualized customer and market insights, annual media plan recommendations, etc. Do you know about Slidesgeeks Top Promotional Analytics Major Promotional Analytics Future Trends Diagrams Pdf These are perfect for delivering any kind od presentation. Using it, create PowerPoint presentations that communicate your ideas and engage audiences. Save time and effort by using our pre designed presentation templates that are perfect for a wide range of topic. Our vast selection of designs covers a range of styles, from creative to business, and are all highly customizable and easy to edit. Download as a PowerPoint template or use them as Google Slides themes. This slide covers a comparative analysis of the market analytics system based on features such as real time analytics and insights, brand measurement capabilities, contextualized customer and market insights, annual media plan recommendations, etc.

Predictive Analytics Methods Predictive Analytics Model Development Budget Background PDF
This slide describes the budget for developing predictive analytics model by covering details of project cost summary, amount, project details such as company name, project name, project lead, and project start date. The best PPT templates are a great way to save time, energy, and resources. Slidegeeks have 100 percent editable powerpoint slides making them incredibly versatile. With these quality presentation templates, you can create a captivating and memorable presentation by combining visually appealing slides and effectively communicating your message. Download Predictive Analytics Methods Predictive Analytics Model Development Budget Background PDF from Slidegeeks and deliver a wonderful presentation.
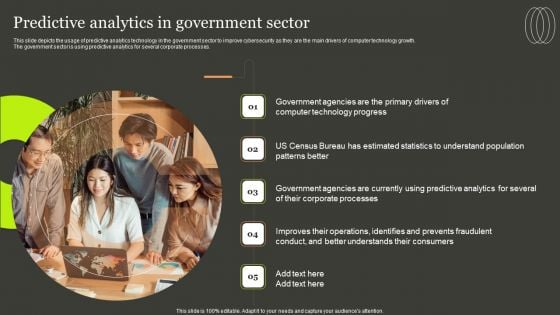
Predictive Analytics Methods Predictive Analytics In Government Sector Information PDF
This slide depicts the usage of predictive analytics technology in the government sector to improve cybersecurity as they are the main drivers of computer technology growth. The government sector is using predictive analytics for several corporate processes. This modern and well arranged Predictive Analytics Methods Predictive Analytics In Government Sector Information PDF provides lots of creative possibilities. It is very simple to customize and edit with the Powerpoint Software. Just drag and drop your pictures into the shapes. All facets of this template can be edited with Powerpoint no extra software is necessary. Add your own material, put your images in the places assigned for them, adjust the colors, and then you can show your slides to the world, with an animated slide included.
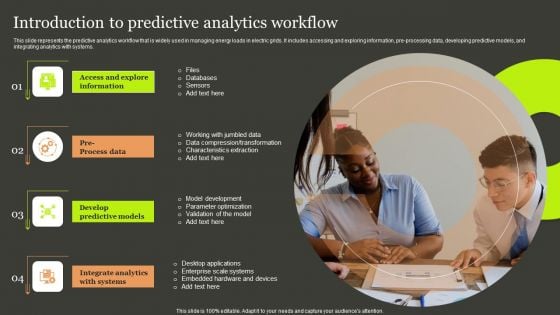
Predictive Analytics Methods Introduction To Predictive Analytics Workflow Slides PDF
This slide represents the predictive analytics workflow that is widely used in managing energy loads in electric grids. It includes accessing and exploring information, pre-processing data, developing predictive models, and integrating analytics with systems. Are you in need of a template that can accommodate all of your creative concepts This one is crafted professionally and can be altered to fit any style. Use it with Google Slides or PowerPoint. Include striking photographs, symbols, depictions, and other visuals. Fill, move around, or remove text boxes as desired. Test out color palettes and font mixtures. Edit and save your work, or work with colleagues. Download Predictive Analytics Methods Introduction To Predictive Analytics Workflow Slides PDF and observe how to make your presentation outstanding. Give an impeccable presentation to your group and make your presentation unforgettable.
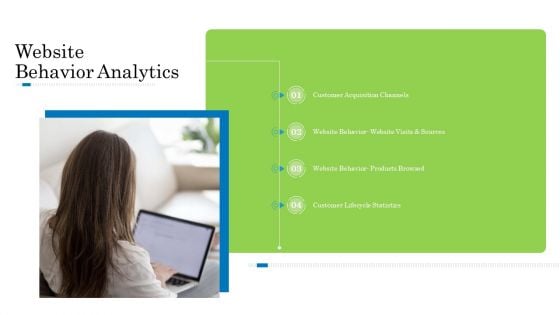
Customer Behavioral Data And Analytics Website Behavior Analytics Elements PDF
Presenting customer behavioral data and analytics website behavior analytics elements pdf to provide visual cues and insights. Share and navigate important information on four stages that need your due attention. This template can be used to pitch topics like customer acquisition channels, website behavior website visits and sources, website behavior products browsed, customer lifecycle statistics. In addtion, this PPT design contains high resolution images, graphics, etc, that are easily editable and available for immediate download.
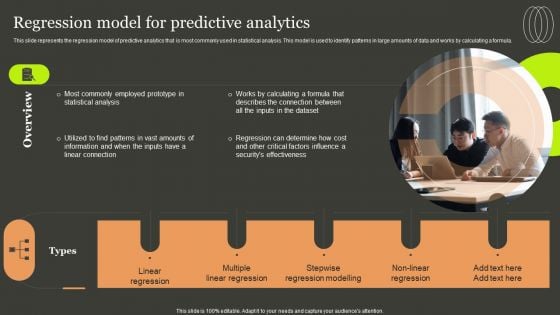
Predictive Analytics Methods Regression Model For Predictive Analytics Template PDF
This slide represents the regression model of predictive analytics that is most commonly used in statistical analysis. This model is used to identify patterns in large amounts of data and works by calculating a formula. Retrieve professionally designed Predictive Analytics Methods Regression Model For Predictive Analytics Template PDF to effectively convey your message and captivate your listeners. Save time by selecting pre made slideshows that are appropriate for various topics, from business to educational purposes. These themes come in many different styles, from creative to corporate, and all of them are easily adjustable and can be edited quickly. Access them as PowerPoint templates or as Google Slides themes. You do not have to go on a hunt for the perfect presentation because Slidegeeks got you covered from everywhere.


 Continue with Email

 Home
Home


