Business Performance Dashboard
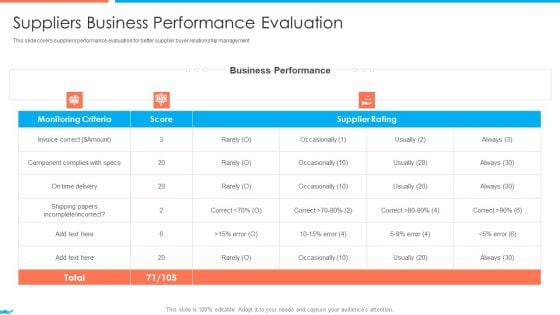
Supplier Association Management Techniques Suppliers Business Performance Evaluation Summary PDF
This slide covers suppliers performance evaluation for better supplier buyer relationship management. Deliver an awe inspiring pitch with this creative supplier association management techniques supplier performance management kpi dashboards guidelines pdf bundle. Topics like suppliers business performance evaluation can be discussed with this completely editable template. It is available for immediate download depending on the needs and requirements of the user.
Web Consulting Business Various Kpis For Tracking Business Performance
Mentioned slide provide insights into various key performance indicators to determine business performance. It includes KPIs such as business financials, website traffic, customer case, customer engagement, conversion rate, customer retention, customer bounce rate, employee turnover, etc. This modern and well-arranged Web Consulting Business Various Kpis For Tracking Business Performance provides lots of creative possibilities. It is very simple to customize and edit with the Powerpoint Software. Just drag and drop your pictures into the shapes. All facets of this template can be edited with Powerpoint, no extra software is necessary. Add your own material, put your images in the places assigned for them, adjust the colors, and then you can show your slides to the world, with an animated slide included. Mentioned slide provide insights into various key performance indicators to determine business performance. It includes KPIs such as business financials, website traffic, customer case, customer engagement, conversion rate, customer retention, customer bounce rate, employee turnover, etc.
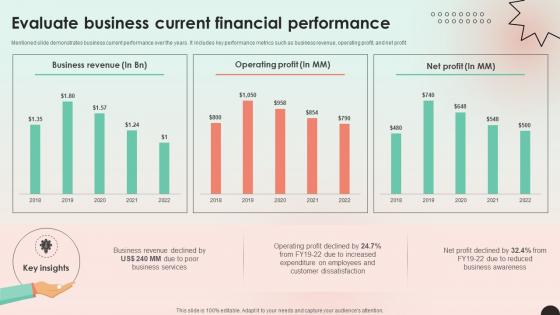
Web Consulting Business Evaluate Business Current Financial Performance
Mentioned slide demonstrates business current performance over the years. It includes key performance metrics such as business revenue, operating profit, and net profit. Are you searching for a Web Consulting Business Evaluate Business Current Financial Performance that is uncluttered, straightforward, and original Its easy to edit, and you can change the colors to suit your personal or business branding. For a presentation that expresses how much effort you have put in, this template is ideal With all of its features, including tables, diagrams, statistics, and lists, its perfect for a business plan presentation. Make your ideas more appealing with these professional slides. Download Web Consulting Business Evaluate Business Current Financial Performance from Slidegeeks today. Mentioned slide demonstrates business current performance over the years. It includes key performance metrics such as business revenue, operating profit, and net profit.
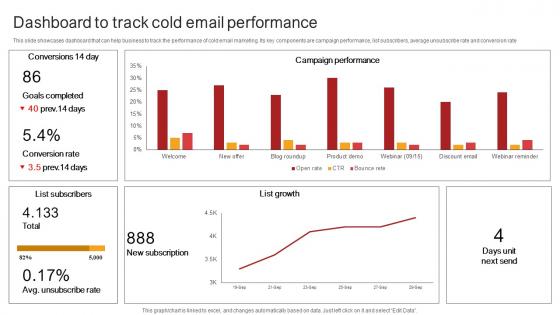
Remote Sales Plan For Dashboard To Track Cold Email Performance Strategy SS V
This slide showcases dashboard that can help business to track the performance of cold email marketing. Its key components are campaign performance, list subscribers, average unsubscribe rate and conversion rate. Slidegeeks is here to make your presentations a breeze with Remote Sales Plan For Dashboard To Track Cold Email Performance Strategy SS V With our easy-to-use and customizable templates, you can focus on delivering your ideas rather than worrying about formatting. With a variety of designs to choose from, you are sure to find one that suits your needs. And with animations and unique photos, illustrations, and fonts, you can make your presentation pop. So whether you are giving a sales pitch or presenting to the board, make sure to check out Slidegeeks first This slide showcases dashboard that can help business to track the performance of cold email marketing. Its key components are campaign performance, list subscribers, average unsubscribe rate and conversion rate.
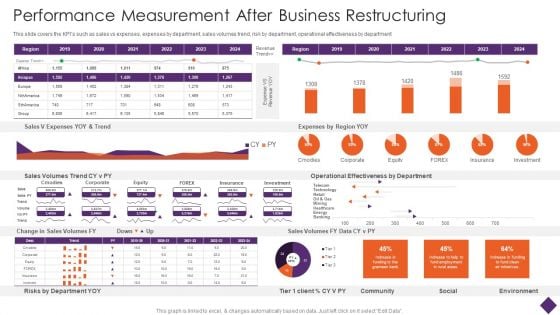
Business Restructuring Performance Measurement After Business Restructuring Themes PDF
This slide covers the KPIs such as sales vs expenses, expenses by department, sales volumes trend, risk by department, operational effectiveness by department. Deliver an awe inspiring pitch with this creative Business Restructuring Performance Measurement After Business Restructuring Themes PDF bundle. Topics like Sales V Expenses, YOY And Trend, Expenses Region YOY can be discussed with this completely editable template. It is available for immediate download depending on the needs and requirements of the user.
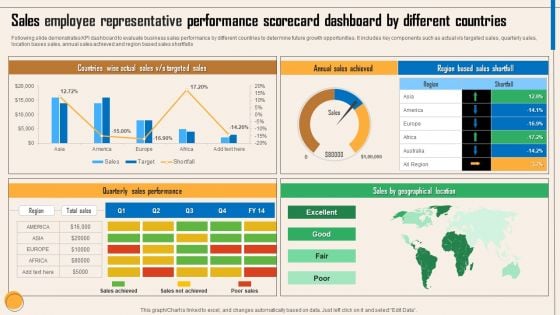
Sales Employee Representative Performance Scorecard Dashboard By Different Countries Themes PDF
Following slide demonstrates KPI dashboard to evaluate business sales performance by different countries to determine future growth opportunities. It includes key components such as actual v or s targeted sales, quarterly sales, location bases sales, annual sales achieved and region based sales shortfalls. Showcasing this set of slides titled Sales Employee Representative Performance Scorecard Dashboard By Different Countries Themes PDF. The topics addressed in these templates are Countries Wise Actual Sales, V Or S Targeted Sales, Annual Sales Achieved, Quarterly Sales Performance, Sales By Geographical Location. All the content presented in this PPT design is completely editable. Download it and make adjustments in color, background, font etc. as per your unique business setting.
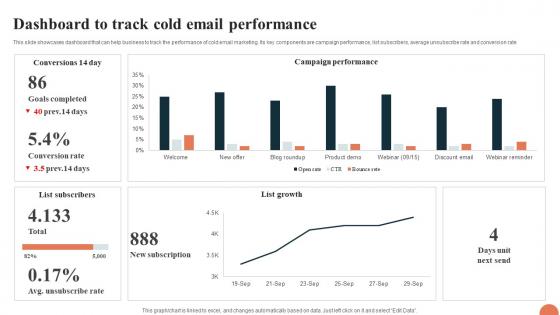
Telesales Strategy For Targeting Dashboard To Track Cold Email Performance Strategy SS V
This slide showcases dashboard that can help business to track the performance of cold email marketing. Its key components are campaign performance, list subscribers, average unsubscribe rate and conversion rate. Find highly impressive Telesales Strategy For Targeting Dashboard To Track Cold Email Performance Strategy SS V on Slidegeeks to deliver a meaningful presentation. You can save an ample amount of time using these presentation templates. No need to worry to prepare everything from scratch because Slidegeeks experts have already done a huge research and work for you. You need to download Telesales Strategy For Targeting Dashboard To Track Cold Email Performance Strategy SS V for your upcoming presentation. All the presentation templates are 100 percent editable and you can change the color and personalize the content accordingly. Download now This slide showcases dashboard that can help business to track the performance of cold email marketing. Its key components are campaign performance, list subscribers, average unsubscribe rate and conversion rate.
Product Branding To Enhance Product Sales Performance Tracking Dashboard Infographics PDF
This slide provides information regarding product branding performance tracking dashboard in terms of revenues, new customers, customer satisfaction rate. Make sure to capture your audiences attention in your business displays with our gratis customizable Product Branding To Enhance Product Sales Performance Tracking Dashboard Infographics PDF. These are great for business strategies, office conferences, capital raising or task suggestions. If you desire to acquire more customers for your tech business and ensure they stay satisfied, create your own sales presentation with these plain slides.
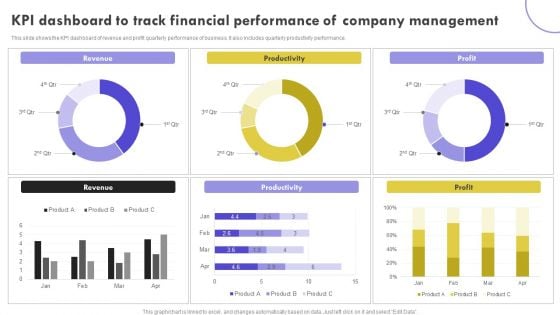
KPI Dashboard To Track Financial Performance Of Company Management Clipart PDF
This slide shows the KPI dashboard of revenue and profit quarterly performance of business. It also includes quarterly productivity performance. Pitch your topic with ease and precision using this KPI Dashboard To Track Financial Performance Of Company Management Clipart PDF. This layout presents information on Revenue, Productivity, Profit. It is also available for immediate download and adjustment. So, changes can be made in the color, design, graphics or any other component to create a unique layout.

Operational Performance Management Powerpoint Layout
This is a operational performance management powerpoint layout. This is a one stage process. The stages in this process are dashboard, measure, business.
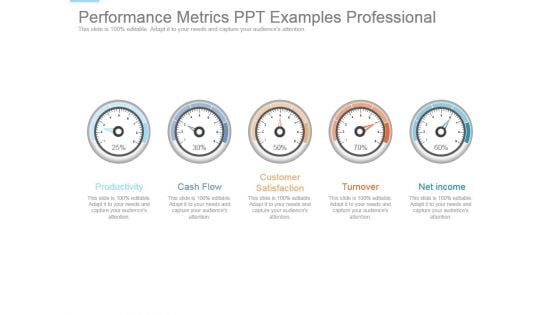
Performance Metrics Ppt Examples Professional
This is a performance metrics ppt examples professional. This is a five stage process. The stages in this process are productivity, cash flow, customer satisfaction, turnover, net income.
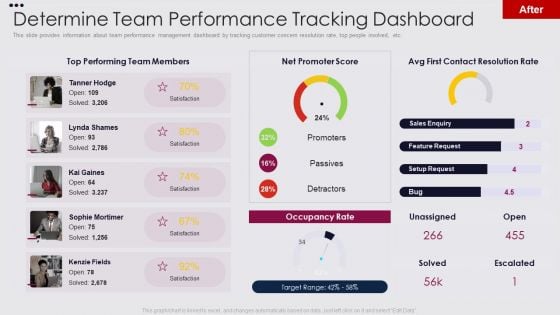
Employee Performance Improvement Framework Determine Team Performance Ideas PDF
This slide provides information about team performance management dashboard by tracking customer concern resolution rate, top people involved, etc. Deliver and pitch your topic in the best possible manner with this employee performance improvement framework determine team performance ideas pdf. Use them to share invaluable insights on determine team performance tracking dashboard and impress your audience. This template can be altered and modified as per your expectations. So, grab it now.
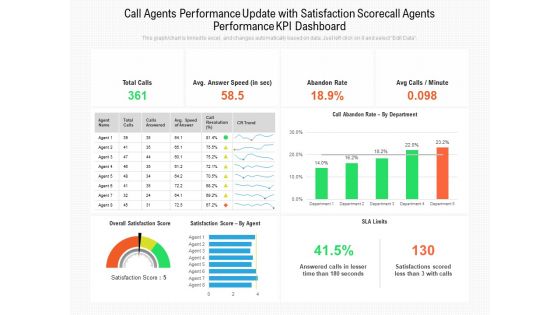
Call Agents Performance Update With Satisfaction Scorecall Agents Performance Kpi Dashboard Ppt PowerPoint Presentation Gallery Background PDF
Presenting this set of slides with name call agents performance update with satisfaction scorecall agents performance kpi dashboard ppt powerpoint presentation gallery background pdf. The topics discussed in these slides are total calls, avg answer speed, abandon rate, avg calls, minute, satisfaction score by agent, sla limits. This is a completely editable PowerPoint presentation and is available for immediate download. Download now and impress your audience.
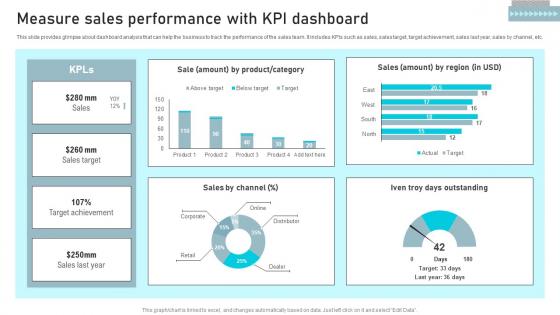
Measure Sales Performance With Business Sales Enhancement Campaign Inspiration Pdf
This slide provides glimpse about dashboard analysis that can help the business to track the performance of the sales team. It includes KPIs such as sales, sales target, target achievement, sales last year, sales by channel, etc. The Measure Sales Performance With Business Sales Enhancement Campaign Inspiration Pdf is a compilation of the most recent design trends as a series of slides. It is suitable for any subject or industry presentation, containing attractive visuals and photo spots for businesses to clearly express their messages. This template contains a variety of slides for the user to input data, such as structures to contrast two elements, bullet points, and slides for written information. Slidegeeks is prepared to create an impression. This slide provides glimpse about dashboard analysis that can help the business to track the performance of the sales team. It includes KPIs such as sales, sales target, target achievement, sales last year, sales by channel, etc.
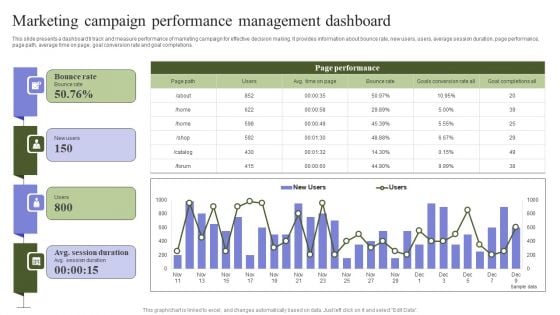
Marketing Mix Strategy Handbook Marketing Campaign Performance Management Dashboard Professional PDF
This slide presents a dashboard ti track and measure performance of marketing campaign for effective decision making. It provides information about bounce rate, new users, users, average session duration, page performance, page path, average time on page, goal conversion rate and goal completions. Make sure to capture your audiences attention in your business displays with our gratis customizable Marketing Mix Strategy Handbook Marketing Campaign Performance Management Dashboard Professional PDF. These are great for business strategies, office conferences, capital raising or task suggestions. If you desire to acquire more customers for your tech business and ensure they stay satisfied, create your own sales presentation with these plain slides.
Developing Brand Awareness To Gain Customer Attention Different Brands Performance Tracking Dashboard Introduction PDF
This slide provides information regarding different brands performance tracking dashboard in terms of brand metric, brand commitment, advertising metrics, and purchase metrics. Make sure to capture your audiences attention in your business displays with our gratis customizable Developing Brand Awareness To Gain Customer Attention Different Brands Performance Tracking Dashboard Introduction PDF. These are great for business strategies, office conferences, capital raising or task suggestions. If you desire to acquire more customers for your tech business and ensure they stay satisfied, create your own sales presentation with these plain slides.

KPI Dashboard To Track Performance Of Sales To Cash Process Download PDF
This slide depicts a dashboard for business managers to keep the track of performance order to cash process for effective decision making. The key elements are orders received, cash receivables, order to cash key performance indicators, days of inventory outstanding etc. Showcasing this set of slides titled KPI Dashboard To Track Performance Of Sales To Cash Process Download PDF. The topics addressed in these templates are Orders Received, Cash Receivables, Days Inventory Outstanding. All the content presented in this PPT design is completely editable. Download it and make adjustments in color, background, font etc. as per your unique business setting.
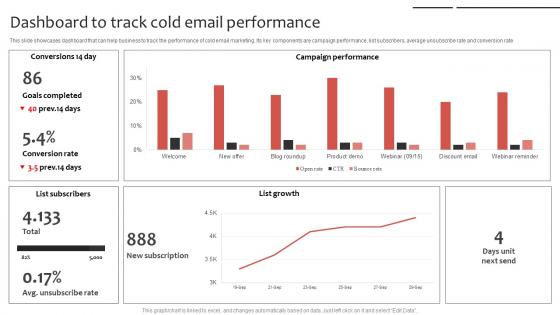
Phone Sales Strategy To Drive Dashboard To Track Cold Email Performance Strategy SS V
This slide showcases dashboard that can help business to track the performance of cold email marketing. Its key components are campaign performance, list subscribers, average unsubscribe rate and conversion rate. Whether you have daily or monthly meetings, a brilliant presentation is necessary. Phone Sales Strategy To Drive Dashboard To Track Cold Email Performance Strategy SS V can be your best option for delivering a presentation. Represent everything in detail using Phone Sales Strategy To Drive Dashboard To Track Cold Email Performance Strategy SS V and make yourself stand out in meetings. The template is versatile and follows a structure that will cater to your requirements. All the templates prepared by Slidegeeks are easy to download and edit. Our research experts have taken care of the corporate themes as well. So, give it a try and see the results. This slide showcases dashboard that can help business to track the performance of cold email marketing. Its key components are campaign performance, list subscribers, average unsubscribe rate and conversion rate
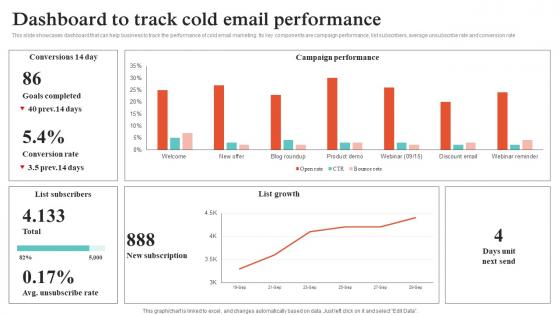
Virtual Sales Strategies Dashboard To Track Cold Email Performance Strategy SS V
This slide showcases dashboard that can help business to track the performance of cold email marketing. Its key components are campaign performance, list subscribers, average unsubscribe rate and conversion rate. Whether you have daily or monthly meetings, a brilliant presentation is necessary. Virtual Sales Strategies Dashboard To Track Cold Email Performance Strategy SS V can be your best option for delivering a presentation. Represent everything in detail using Virtual Sales Strategies Dashboard To Track Cold Email Performance Strategy SS V and make yourself stand out in meetings. The template is versatile and follows a structure that will cater to your requirements. All the templates prepared by Slidegeeks are easy to download and edit. Our research experts have taken care of the corporate themes as well. So, give it a try and see the results. This slide showcases dashboard that can help business to track the performance of cold email marketing. Its key components are campaign performance, list subscribers, average unsubscribe rate and conversion rate.
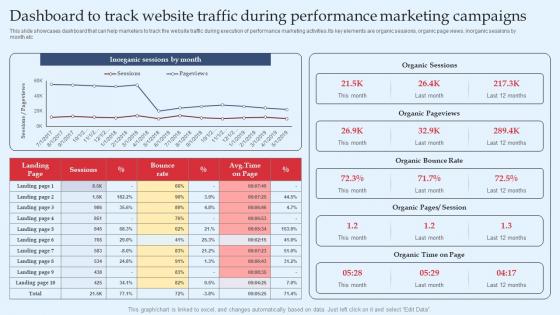
Strategic Performance Marketing Campaign Dashboard To Track Website Traffic During Clipart Pdf
This slide showcases dashboard that can help marketers to track the website traffic during execution of performance marketing activities.Its key elements are organic sessions, organic page views, inorganic sessions by month etc. Make sure to capture your audiences attention in your business displays with our gratis customizable Strategic Performance Marketing Campaign Dashboard To Track Website Traffic During Clipart Pdf. These are great for business strategies, office conferences, capital raising or task suggestions. If you desire to acquire more customers for your tech business and ensure they stay satisfied, create your own sales presentation with these plain slides. This slide showcases dashboard that can help marketers to track the website traffic during execution of performance marketing activities.Its key elements are organic sessions, organic page views, inorganic sessions by month etc.

Annual Business Financial Summary Dashboard Themes PDF
This slide shows annual financial report dashboard of company to monitor yearly business performance. It includes various indicators such as revenue, net profits, costs and breakdown of cost. Showcasing this set of slides titled Annual Business Financial Summary Dashboard Themes PDF. The topics addressed in these templates are Revenue, Costs, Net Profit. All the content presented in this PPT design is completely editable. Download it and make adjustments in color, background, font etc. as per your unique business setting.

Online Rating Scale For Analyzing Business Performance Structure PDF
Pitch your topic with ease and precision using this online rating scale for analyzing business performance structure pdf. This layout presents information on online rating scale for analyzing business performance. It is also available for immediate download and adjustment. So, changes can be made in the color, design, graphics or any other component to create a unique layout.
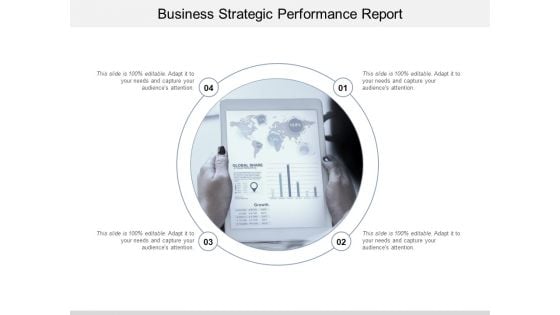
Business Strategic Performance Report Ppt Powerpoint Presentation Show Background Image
This is a business strategic performance report ppt powerpoint presentation show background image. This is a four stage process. The stages in this process are business metrics, business kpi, business dashboard.
Employee Performance Improvement Framework Determine Employee Performance Tracker Infographics PDF
This slide provides information about employee performance tracker dashboard which covers details in context to employee training, etc. Deliver an awe inspiring pitch with this creative employee performance improvement framework determine employee performance tracker infographics pdf bundle. Topics like outstanding, needs improvement sufficient, strong, current quarterly review can be discussed with this completely editable template. It is available for immediate download depending on the needs and requirements of the user.
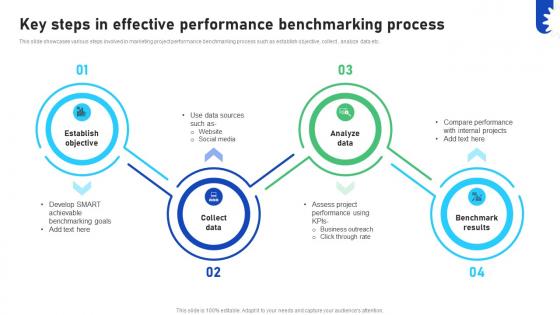
Improving Business Marketing Performance Key Steps In Effective Performance CRP DK SS V
This slide showcases various steps involved in marketing project performance benchmarking process such as establish objective, collect , analyze data etc. Slidegeeks has constructed Improving Business Marketing Performance Key Steps In Effective Performance CRP DK SS V after conducting extensive research and examination. These presentation templates are constantly being generated and modified based on user preferences and critiques from editors. Here, you will find the most attractive templates for a range of purposes while taking into account ratings and remarks from users regarding the content. This is an excellent jumping-off point to explore our content and will give new users an insight into our top-notch PowerPoint Templates. This slide showcases various steps involved in marketing project performance benchmarking process such as establish objective, collect , analyze data etc.
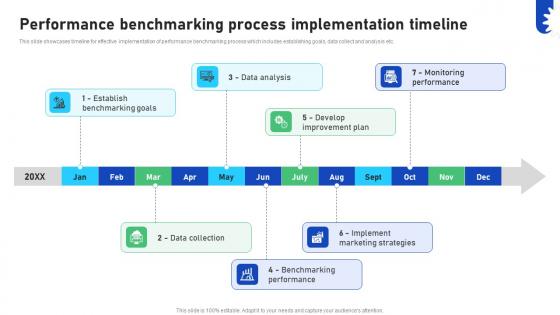
Improving Business Marketing Performance Performance Benchmarking Process CRP DK SS V
This slide showcases timeline for effective implementation of performance benchmarking process which includes establishing goals, data collect and analysis etc. Do you know about Slidesgeeks Improving Business Marketing Performance Performance Benchmarking Process CRP DK SS V These are perfect for delivering any kind od presentation. Using it, create PowerPoint presentations that communicate your ideas and engage audiences. Save time and effort by using our pre-designed presentation templates that are perfect for a wide range of topic. Our vast selection of designs covers a range of styles, from creative to business, and are all highly customizable and easy to edit. Download as a PowerPoint template or use them as Google Slides themes. This slide showcases timeline for effective implementation of performance benchmarking process which includes establishing goals, data collect and analysis etc.
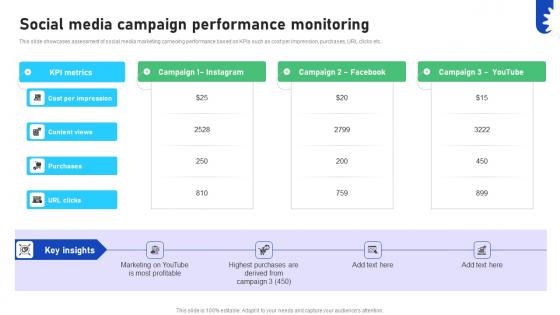
Improving Business Marketing Performance Social Media Campaign Performance CRP DK SS V
This slide showcases assessment of social media marketing cameoing performance based on KPIs such as cost per impression, purchases, URL clicks etc. Want to ace your presentation in front of a live audience Our Improving Business Marketing Performance Social Media Campaign Performance CRP DK SS V can help you do that by engaging all the users towards you. Slidegeeks experts have put their efforts and expertise into creating these impeccable powerpoint presentations so that you can communicate your ideas clearly. Moreover, all the templates are customizable, and easy-to-edit and downloadable. Use these for both personal and commercial use. This slide showcases assessment of social media marketing cameoing performance based on KPIs such as cost per impression, purchases, URL clicks etc.

Improving Business Marketing Performance Best Practices To Optimize Performance CRP DK SS V
This slide showcases tips which can be adopted to enhance marketing performance benchmarking process such as prioritize KPIs, ensure regularity etc. Slidegeeks is here to make your presentations a breeze with Improving Business Marketing Performance Best Practices To Optimize Performance CRP DK SS V With our easy-to-use and customizable templates, you can focus on delivering your ideas rather than worrying about formatting. With a variety of designs to choose from, you are sure to find one that suits your needs. And with animations and unique photos, illustrations, and fonts, you can make your presentation pop. So whether you are giving a sales pitch or presenting to the board, make sure to check out Slidegeeks first This slide showcases tips which can be adopted to enhance marketing performance benchmarking process such as prioritize KPIs, ensure regularity etc.
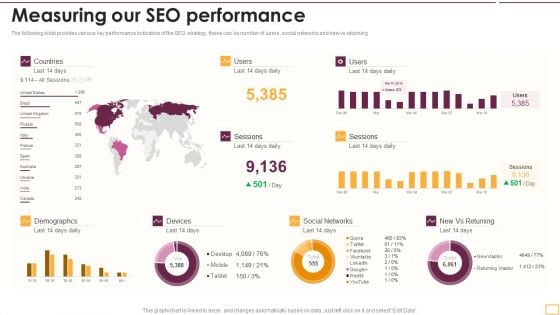
Implementing SEO Strategy To Enhance Business Performance Measuring Our SEO Performance Sample PDF
The following slide provides various key performance indicators of the SEO strategy, these can be number of users, social networks and new vs returning. Deliver an awe inspiring pitch with this creative Implementing SEO Strategy To Enhance Business Performance Measuring Our SEO Performance Sample PDF bundle. Topics like Social Network, Demographcs, Devices can be discussed with this completely editable template. It is available for immediate download depending on the needs and requirements of the user.
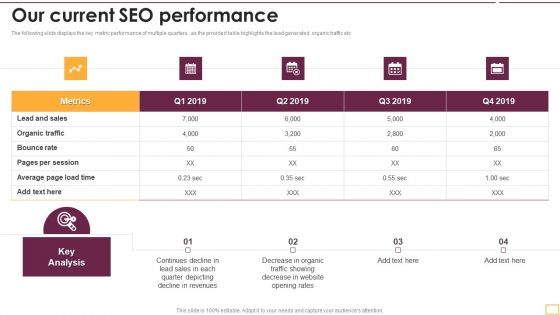
Implementing SEO Strategy To Enhance Business Performance Our Current SEO Performance Sample PDF
The following slide displays the key metric performance of multiple quarters , as the provided table highlights the lead generated, organic traffic etc. Deliver an awe inspiring pitch with this creative Implementing SEO Strategy To Enhance Business Performance Our Current SEO Performance Sample PDF bundle. Topics like Average Page Load, Bounce Rate, Organic Traffic can be discussed with this completely editable template. It is available for immediate download depending on the needs and requirements of the user.
Performance Analysis Of New Product Development Product Performance Dashboards Icons PDF
The following slide displays the dashboard which highlights the performance of the product, multiple metrics such as Revenues, New customer, gross profit, customer satisfaction and global sales breakdown. Deliver and pitch your topic in the best possible manner with this performance analysis of new product development product performance dashboards icons pdf. Use them to share invaluable insights on revenue, sales comparison, customer satisfaction, gross profit, new customers, sale by product category and impress your audience. This template can be altered and modified as per your expectations. So, grab it now.
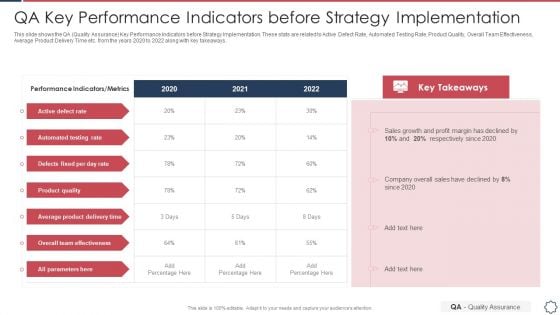
Quality Assurance Transformation Strategies To Improve Business Performance Efficiency QA Key Performance Indicators Information PDF
This slide shows the QA Quality Assurance Key Performance Indicators before Strategy Implementation. These stats are related to Active Defect Rate, Automated Testing Rate, Product Quality, Overall Team Effectiveness, Average Product Delivery Time etc. from the years 2020 to 2022 along with key takeaways. Deliver an awe inspiring pitch with this creative quality assurance transformation strategies to improve business performance efficiency qa key performance indicators information pdf bundle. Topics like automated testing rate, defects fixed per day rate, overall team effectiveness can be discussed with this completely editable template. It is available for immediate download depending on the needs and requirements of the user.
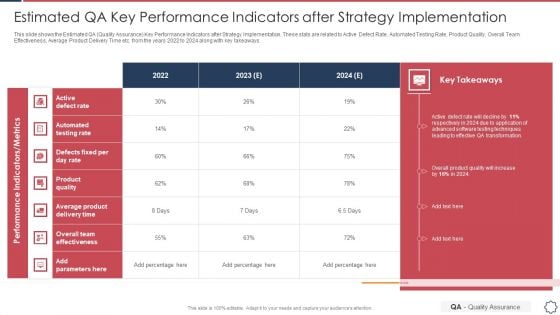
Quality Assurance Transformation Strategies To Improve Business Performance Efficiency Estimated QA Key Performance Topics PDF
This slide shows the Estimated QA Quality Assurance Key Performance Indicators after Strategy Implementation. These stats are related to Active Defect Rate, Automated Testing Rate, Product Quality, Overall Team Effectiveness, Average Product Delivery Time etc. from the years 2022 to 2024 along with key takeaways. Deliver and pitch your topic in the best possible manner with this quality assurance transformation strategies to improve business performance efficiency estimated qa key performance topics pdf. Use them to share invaluable insights on automated testing rate, average product delivery time, active defect rate and impress your audience. This template can be altered and modified as per your expectations. So, grab it now.
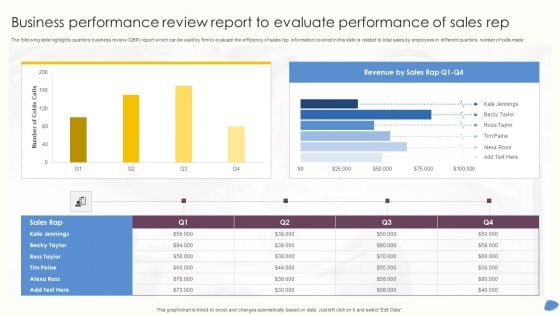
Business Performance Review Report To Evaluate Performance Of Sales Rep Infographics PDF
The following slide highlights quarterly business review QBR report which can be used by firm to evaluate the efficiency of sales rep. information covered in this slide is related to total sales by employees in different quarters, number of calls made. Pitch your topic with ease and precision using this Business Performance Review Report To Evaluate Performance Of Sales Rep Infographics PDF. This layout presents information on Revenue Sales, Tim Paine, Number Colds Calls. It is also available for immediate download and adjustment. So, changes can be made in the color, design, graphics or any other component to create a unique layout.
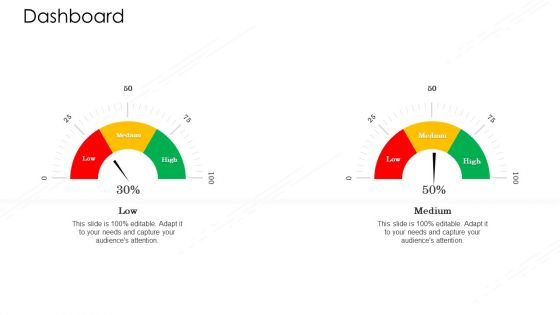
Value Chain Techniques For Performance Assessment Dashboard Ppt Layouts Microsoft PDF
This is a value chain techniques for performance assessment dashboard ppt layouts microsoft pdf. template with various stages. Focus and dispense information on two showcase facts, figures, and other relevant content using this PPT layout. Grab it now.
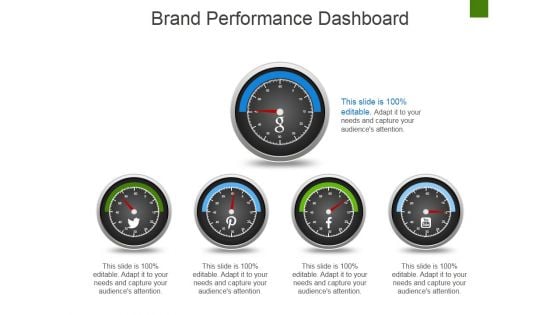
Brand Performance Dashboard Template 1 Ppt PowerPoint Presentation Infographic Template Vector
This is a brand performance dashboard template 1 ppt powerpoint presentation infographic template vector. This is a five stage process. The stages in this process are dashboard, measurement, analysis, strategy, business.
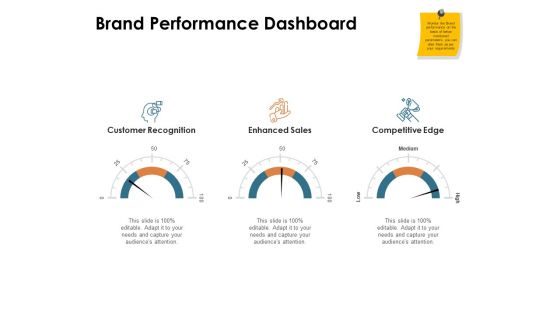
Brand Identity How Build It Brand Performance Dashboard Ppt Professional Mockup PDF
Presenting this set of slides with name brand identity how build it brand performance dashboard ppt professional mockup pdf. This is a three stage process. The stages in this process are customer recognition, enhanced sales, competitive edge. This is a completely editable PowerPoint presentation and is available for immediate download. Download now and impress your audience.
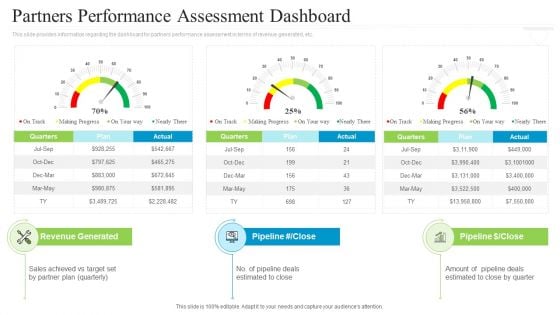
Collaborative Marketing To Attain New Customers Partners Performance Assessment Dashboard Microsoft PDF
This slide provides information regarding the dashboard for partners performance assessment in terms of revenue generated, etc. Deliver and pitch your topic in the best possible manner with this collaborative marketing to attain new customers partners performance assessment dashboard microsoft pdf. Use them to share invaluable insights on partners performance assessment dashboard and impress your audience. This template can be altered and modified as per your expectations. So, grab it now.

Actual And Planned Partner Executive Performance Dashboard Ppt Show Outline PDF
This slide covers the partner executive dashboard that focuses on revenues, pipeline, capability scoreboard, along with actual and planned values quarterly. Deliver an awe inspiring pitch with this creative actual and planned partner executive performance dashboard ppt show outline pdf bundle. Topics like actual and planned partner executive performance dashboard can be discussed with this completely editable template. It is available for immediate download depending on the needs and requirements of the user.
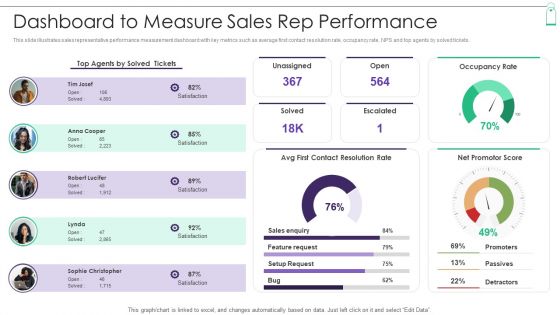
New Product Sales Strategy And Marketing Dashboard To Measure Sales Rep Performance Guidelines PDF
This slide illustrates sales representative performance measurement dashboard with key metrics such as average first contact resolution rate, occupancy rate, NPS and top agents by solved tickets. Deliver an awe inspiring pitch with this creative New Product Sales Strategy And Marketing Dashboard To Measure Sales Rep Performance Guidelines PDF bundle. Topics like Contact Resolution Rate, Contact Resolution Rate, Net Promoter Score can be discussed with this completely editable template. It is available for immediate download depending on the needs and requirements of the user.
Dashboard Showing Website Analytics And Performance Ppt PowerPoint Presentation Portfolio Inspiration PDF
Persuade your audience using this dashboard showing website analytics and performance ppt powerpoint presentation portfolio inspiration pdf. This PPT design covers four stages, thus making it a great tool to use. It also caters to a variety of topics including dashboard showing website analytics and performance. Download this PPT design now to present a convincing pitch that not only emphasizes the topic but also showcases your presentation skills.
Employee Key Performance Indicators Performance Indicators Report Icon Structure PDF
Showcasing this set of slides titled Employee Key Performance Indicators Performance Indicators Report Icon Structure PDF The topics addressed in these templates are Employee Key, Performance, Indicators Performance All the content presented in this PPT design is completely editable. Download it and make adjustments in color, background, font etc. as per your unique business setting.
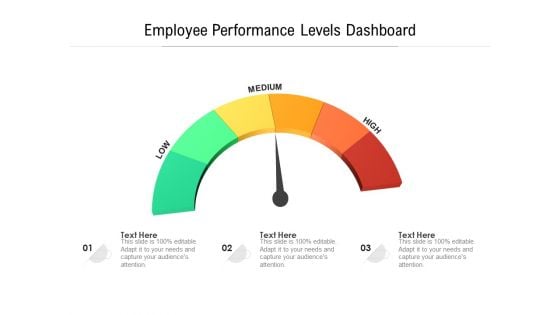
Employee Performance Levels Dashboard Ppt PowerPoint Presentation Slides Design Templates PDF
Presenting employee performance levels dashboard ppt powerpoint presentation slides design templates pdf to dispense important information. This template comprises three stages. It also presents valuable insights into the topics including low, medium, high. This is a completely customizable PowerPoint theme that can be put to use immediately. So, download it and address the topic impactfully.
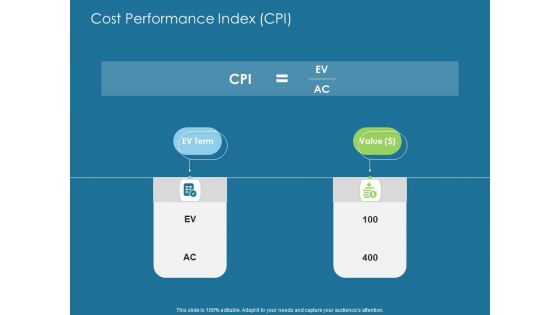
Evaluating Performance Cost Performance Index CPI Ppt Infographics Background PDF
Deliver an awe-inspiring pitch with this creative evaluating performance cost performance index CPI ppt infographics background pdf bundle. Topics like cost performance index CPI can be discussed with this completely editable template. It is available for immediate download depending on the needs and requirements of the user.
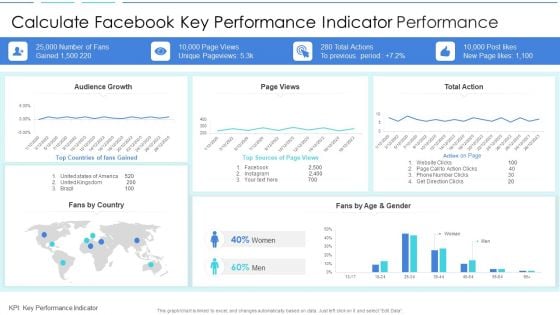
Calculate Facebook Key Performance Indicator Performance Sample PDF
Pitch your topic with ease and precision using this calculate facebook key performance indicator performance sample pdf. This layout presents information on calculate facebook key performance indicator performance. It is also available for immediate download and adjustment. So, changes can be made in the color, design, graphics or any other component to create a unique layout.
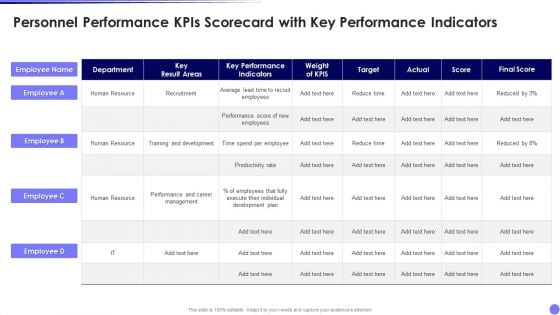
Personnel Performance Kpis Scorecard With Key Performance Indicators Designs PDF
Pitch your topic with ease and precision using this Personnel Performance Kpis Scorecard With Key Performance Indicators Designs PDF. This layout presents information on Key Performance Indicators, Target, Final Score, Employee. It is also available for immediate download and adjustment. So, changes can be made in the color, design, graphics or any other component to create a unique layout.
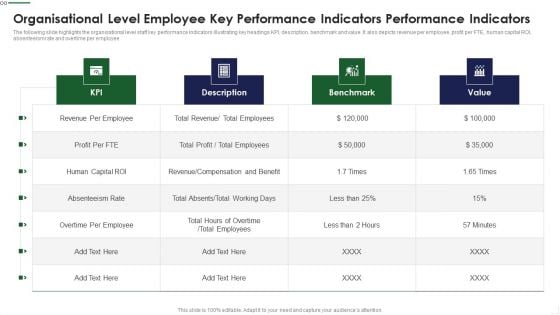
Organisational Level Employee Key Performance Indicators Performance Indicators Rules PDF
The following slide highlights the organisational level staff key performance Indicators illustrating key headings KPI, description, benchmark and value. It also depicts revenue per employee, profit per FTE, human capital ROI, absenteeism rate and overtime per employee Showcasing this set of slides titled Organisational Level Employee Key Performance Indicators Performance Indicators Rules PDF The topics addressed in these templates are Revenue Compensation, Overtime Employee, Benchmark All the content presented in this PPT design is completely editable. Download it and make adjustments in color, background, font etc. as per your unique business setting.

Workforce Performance KPI Scorecard To Measure Employee Performance Formats PDF
Mentioned slide outlines a comprehensive scorecard which can assist HR to measure the overall performance of employees by tracking various KPIs. The KPIs could be employment compensation culture and performance. Showcasing this set of slides titled Workforce Performance KPI Scorecard To Measure Employee Performance Formats PDF. The topics addressed in these templates are Industry Standard, Satisfaction Index, Performance Standards. All the content presented in this PPT design is completely editable. Download it and make adjustments in color, background, font etc. as per your unique business setting.
Meter Performance Dashboard Vector Icon Ppt PowerPoint Presentation Gallery Backgrounds PDF
Presenting this set of slides with name meter performance dashboard vector icon ppt powerpoint presentation gallery backgrounds pdf. This is a three stage process. The stages in this process are meter performance dashboard vector icon. This is a completely editable PowerPoint presentation and is available for immediate download. Download now and impress your audience.
Performance Tracking Dashboard Vector Icon Ppt PowerPoint Presentation File Background Image PDF
Presenting this set of slides with name performance tracking dashboard vector icon ppt powerpoint presentation file background image pdf. This is a two stage process. The stages in this process are performance tracking dashboard vector icon. This is a completely editable PowerPoint presentation and is available for immediate download. Download now and impress your audience.
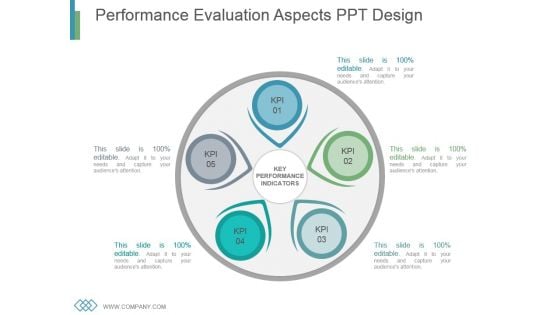
Performance Evaluation Aspects Ppt Design
This is a performance evaluation aspects ppt design. This is a five stage process. The stages in this process are business, marketing, process, strategy, management.
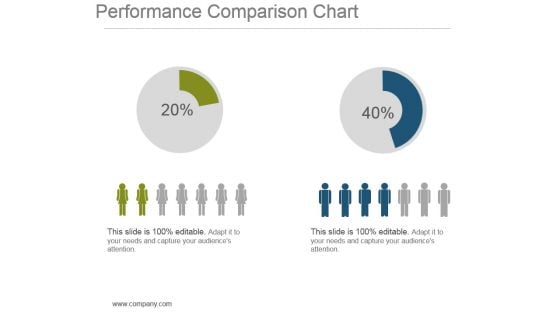
Performance Comparison Chart Powerpoint Show
This is a performance comparison chart powerpoint show. This is a two stage process. The stages in this process are finance, compare, strategy, management, planning.
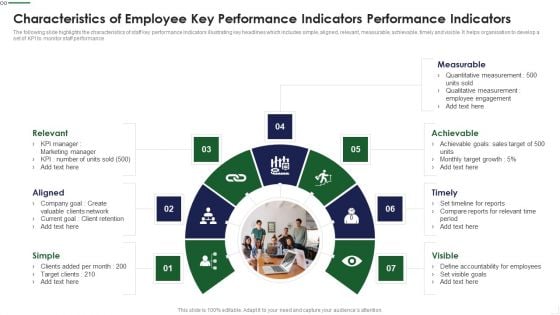
Characteristics Of Employee Key Performance Indicators Performance Indicators Guidelines PDF
The following slide highlights the characteristics of staff key performance Indicators illustrating key headlines which includes simple, aligned, relevant, measurable, achievable, timely and visible. It helps organisation to develop a set of KPI to monitor staff performance Presenting Characteristics Of Employee Key Performance Indicators Performance Indicators Guidelines PDF to dispense important information. This template comprises seven stages. It also presents valuable insights into the topics including Measurable, Achievable, Timely, Visible, Simple This is a completely customizable PowerPoint theme that can be put to use immediately. So, download it and address the topic impactfully.
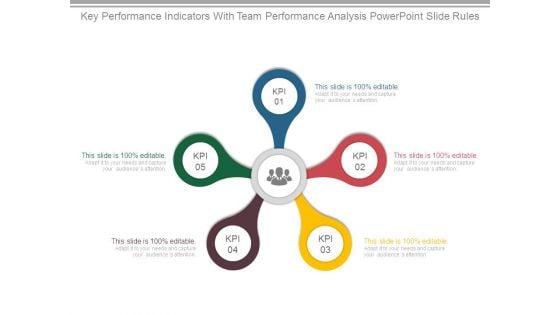
Key Performance Indicators With Team Performance Analysis Powerpoint Slide Rules
This is a key performance indicators with team performance analysis powerpoint slide rules. This is a five stage process. The stages in this process are business, strategy, marketing, success, process, icons.
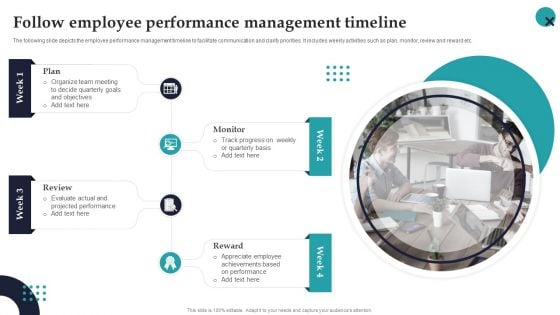
Follow Employee Performance Management Timeline Employee Performance Management Infographics PDF
The following slide depicts the employee performance management timeline to facilitate communication and clarify priorities. It includes weekly activities such as plan, monitor, review and reward etc.If you are looking for a format to display your unique thoughts, then the professionally designed Follow Employee Performance Management Timeline Employee Performance Management Infographics PDF is the one for you. You can use it as a Google Slides template or a PowerPoint template. Incorporate impressive visuals, symbols, images, and other charts. Modify or reorganize the text boxes as you desire. Experiment with shade schemes and font pairings. Alter, share or cooperate with other people on your work. Download Follow Employee Performance Management Timeline Employee Performance Management Infographics PDF and find out how to give a successful presentation. Present a perfect display to your team and make your presentation unforgettable.
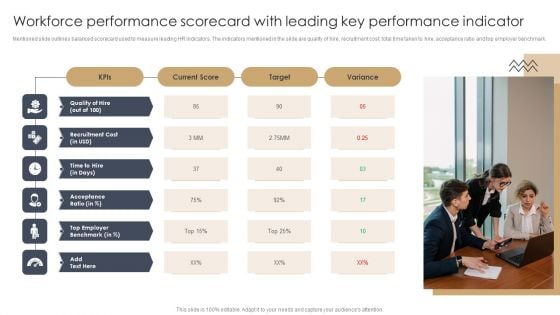
Workforce Performance Scorecard With Leading Key Performance Indicator Information PDF
Mentioned slide outlines balanced scorecard used to measure leading HR indicators. The indicators mentioned in the slide are quality of hire, recruitment cost, total time taken to hire, acceptance ratio and top employer benchmark.Presenting Workforce Performance Scorecard With Leading Key Performance Indicator Information PDF to dispense important information. This template comprises one stage. It also presents valuable insights into the topics including Top Employer, Acceptance Ratio, Recruitment Cost. This is a completely customizable PowerPoint theme that can be put to use immediately. So, download it and address the topic impactfully.
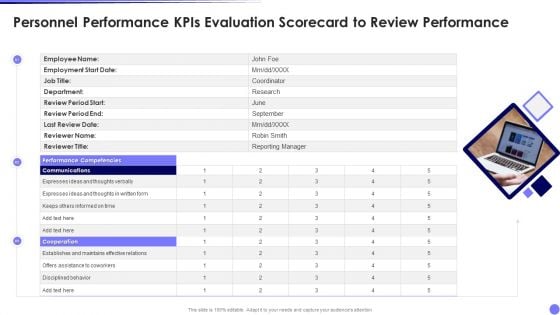
Personnel Performance Kpis Evaluation Scorecard To Review Performance Summary PDF
Persuade your audience using this Personnel Performance Kpis Evaluation Scorecard To Review Performance Summary PDF. This PPT design covers three stages, thus making it a great tool to use. It also caters to a variety of topics including Performance Competencies, Communications, Cooperation. Download this PPT design now to present a convincing pitch that not only emphasizes the topic but also showcases your presentation skills.
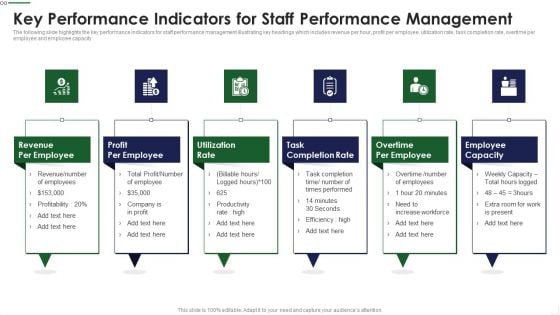
Key Performance Indicators For Staff Performance Management Clipart PDF
The following slide highlights the key performance Indicators for staff performance management illustrating key headings which includes revenue per hour, profit per employee, utilization rate, task completion rate, overtime per employee and employee capacity Persuade your audience using this Key Performance Indicators For Staff Growth Topics PDF This PPT design covers six stages, thus making it a great tool to use. It also caters to a variety of topics including Revenue Employee, Profit Employee, Task Completion Download this PPT design now to present a convincing pitch that not only emphasizes the topic but also showcases your presentation skills.
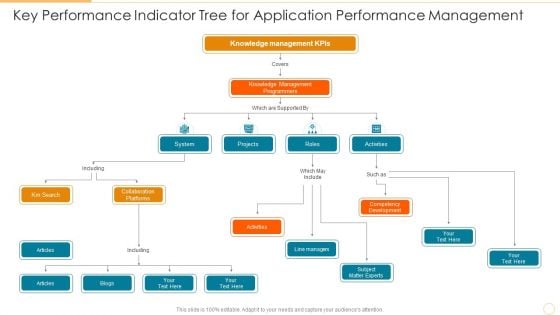
Key Performance Indicator Tree For Application Performance Management Background PDF
Persuade your audience using this key performance indicator tree for application performance management background pdf. This PPT design covers six stages, thus making it a great tool to use. It also caters to a variety of topics including collaboration platforms, competency development, knowledge management programmers. Download this PPT design now to present a convincing pitch that not only emphasizes the topic but also showcases your presentation skills.
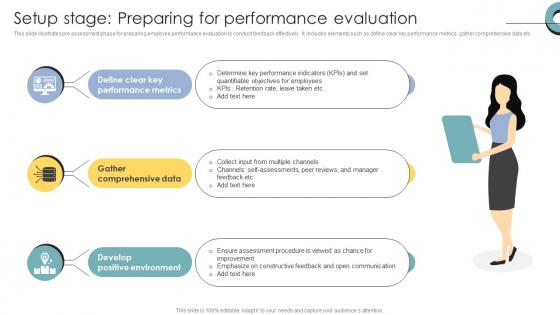
Skill Enhancement Performance Setup Stage Preparing For Performance Evaluation
This slide illustrates pre assessment phase for preparing employee performance evaluation to conduct feedback effectively. It includes elements such as define clear key performance metrics, gather comprehensive data etc. The Skill Enhancement Performance Reasons To Conduct Performance Evaluation Using Online Survey is a compilation of the most recent design trends as a series of slides. It is suitable for any subject or industry presentation, containing attractive visuals and photo spots for businesses to clearly express their messages. This template contains a variety of slides for the user to input data, such as structures to contrast two elements, bullet points, and slides for written information. Slidegeeks is prepared to create an impression. This slide illustrates pre assessment phase for preparing employee performance evaluation to conduct feedback effectively. It includes elements such as define clear key performance metrics, gather comprehensive data etc.


 Continue with Email

 Home
Home


