Business Performance Dashboard
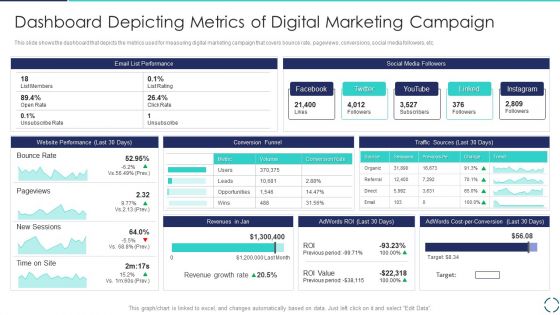
Optimizing E Business Promotion Plan Dashboard Depicting Metrics Of Digital Marketing Campaign Pictures PDF
This slide shows the dashboard that depicts the metrics used for measuring digital marketing campaign that covers bounce rate, pageviews, conversions, social media followers, etc. Deliver and pitch your topic in the best possible manner with this Optimizing E Business Promotion Plan Dashboard Depicting Metrics Of Digital Marketing Campaign Pictures PDF. Use them to share invaluable insights on Social Media, Revenues, Website Performance and impress your audience. This template can be altered and modified as per your expectations. So, grab it now.
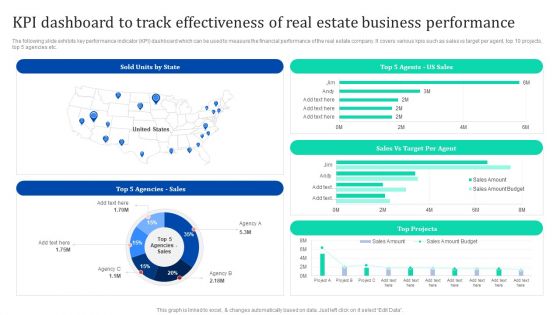
KPI Dashboard To Track Effectiveness Of Real Estate Business Enhancing Process Improvement By Regularly Themes PDF
The following slide exhibits key performance indicator KPI dashboard which can be used to measure the financial performance of the real estate company. It covers various kpis such as sales vs target per agent, top 10 projects, top 5 agencies etc. Welcome to our selection of the KPI Dashboard To Track Effectiveness Of Real Estate Business Enhancing Process Improvement By Regularly Themes PDF. These are designed to help you showcase your creativity and bring your sphere to life. Planning and Innovation are essential for any business that is just starting out. This collection contains the designs that you need for your everyday presentations. All of our PowerPoints are 100 parcent editable, so you can customize them to suit your needs. This multi-purpose template can be used in various situations. Grab these presentation templates today.
Client Support Satisfaction Dashboard Icons PDF
This slide shows KPI dashboard which can be used to track customer satisfaction level. It includes key performance indicators such as total requests, cases by channel, customer satisfaction by subject, etc. Showcasing this set of slides titled Client Support Satisfaction Dashboard Icons PDF. The topics addressed in these templates are Client Support, Satisfaction Dashboard. All the content presented in this PPT design is completely editable. Download it and make adjustments in color, background, font etc. as per your unique business setting.
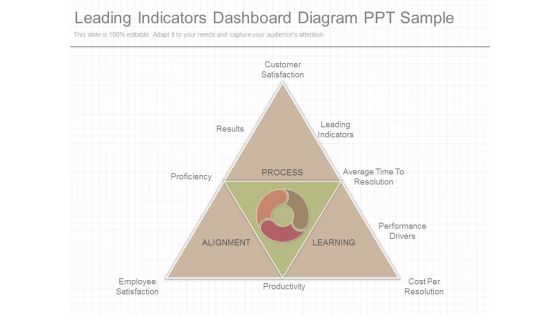
Leading Indicators Dashboard Diagram Ppt Sample
This is a leading indicators dashboard diagram ppt sample. This is a five stage process. The stages in this process are customer satisfaction, leading indicators, average time to resolution, performance drivers, cost per resolution, productivity, employee satisfaction, proficiency, results, process, learning, alignment.
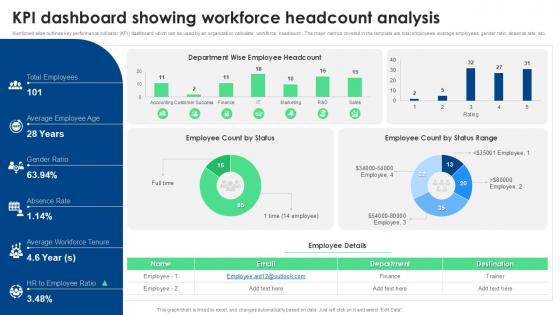
KPI Dashboard Snapshot Showing Workforce Headcount Analysis
From laying roadmaps to briefing everything in detail, our templates are perfect for you. You can set the stage with your presentation slides. All you have to do is download these easy-to-edit and customizable templates. KPI Dashboard Snapshot Showing Workforce Headcount Analysis will help you deliver an outstanding performance that everyone would remember and praise you for. Do download this presentation today. The KPI Dashboard Snapshot Showing Workforce Headcount Analysis is a visually compelling PowerPoint template designed to present key metrics related to workforce composition. It includes dynamic charts and graphs showcasing headcount trends, department breakdowns, gender ratios, and more. This template is perfect for HR teams and executives who need a concise overview of workforce analytics for strategic decision-making and operational efficiency.
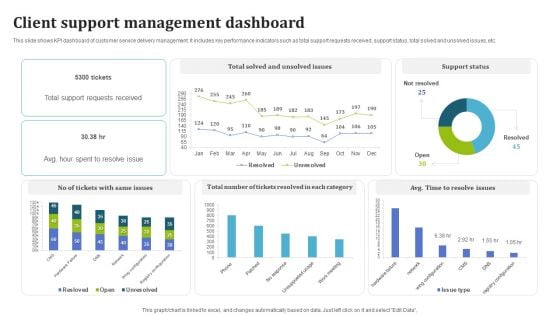
Client Support Management Dashboard Designs PDF
This slide shows KPI dashboard of customer service delivery management. It includes key performance indicators such as total support requests received, support status, total solved and unsolved issues, etc. Pitch your topic with ease and precision using this Client Support Management Dashboard Designs PDF. This layout presents information on Client Support, Management Dashboard. It is also available for immediate download and adjustment. So, changes can be made in the color, design, graphics or any other component to create a unique layout.
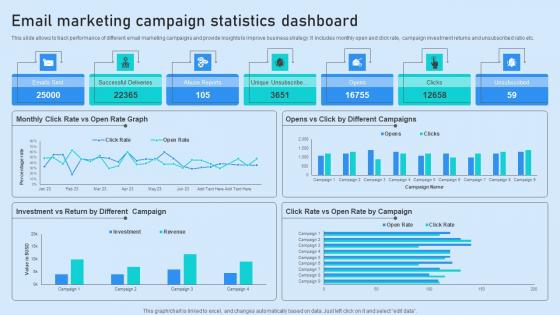
Email Marketing Campaign Statistics Dashboard Introduction Pdf
This slide allows to track performance of different email marketing campaigns and provide insights to improve business strategy. It includes monthly open and click rate, campaign investment returns and unsubscribed ratio etc. Showcasing this set of slides titled Email Marketing Campaign Statistics Dashboard Introduction Pdf. The topics addressed in these templates are Successful Deliveries, Abuse Reports, Unique Unsubscribe. All the content presented in this PPT design is completely editable. Download it and make adjustments in color, background, font etc. as per your unique business setting. This slide allows to track performance of different email marketing campaigns and provide insights to improve business strategy. It includes monthly open and click rate, campaign investment returns and unsubscribed ratio etc.
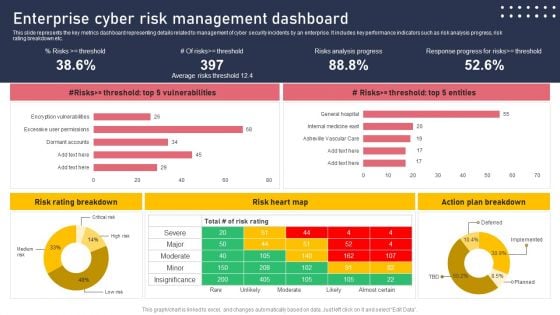
Enterprise Cyber Risk Management Dashboard Sample PDF
This slide represents the key metrics dashboard representing details related to management of cyber security incidents by an enterprise. It includes key performance indicators such as risk analysis progress, risk rating breakdown etc. There are so many reasons you need a Enterprise Cyber Risk Management Dashboard Sample PDF. The first reason is you cannot spend time making everything from scratch, Thus, Slidegeeks has made presentation templates for you too. You can easily download these templates from our website easily.
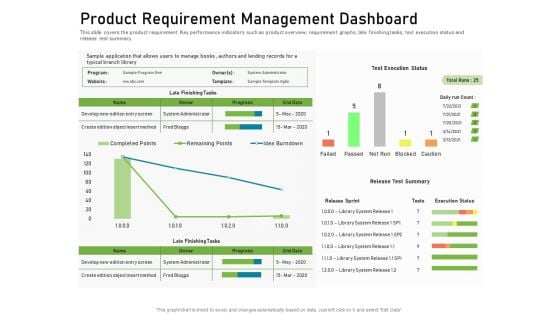
Product Requirement Management Dashboard Graphics PDF
This slide covers the product requirement Key performance indicators such as product overview, requirement graphs, late finishing tasks, text execution status and release test summary. Deliver and pitch your topic in the best possible manner with this product requirement management dashboard graphics pdf. Use them to share invaluable insights on product requirement management dashboard and impress your audience. This template can be altered and modified as per your expectations. So, grab it now.
Factory Waste Management Tracking Dashboard Inspiration PDF
This slide covers the key performance indicators for waste management including waste trucks tracker, green house gasses emissions, energy used and many more Deliver and pitch your topic in the best possible manner with this factory waste management tracking dashboard inspiration pdf. Use them to share invaluable insights on factory waste management tracking dashboard and impress your audience. This template can be altered and modified as per your expectations. So, grab it now.

KPI Dashboard Showcasing Product Management Guidelines PDF
This slide showcases dashboard providing product development team performance status with determined KPIs. It provides details such as product development team score, average result scores and result KPIs. Pitch your topic with ease and precision using this KPI Dashboard Showcasing Product Management Guidelines PDF. This layout presents information on Average Rating, Innovation, Design. It is also available for immediate download and adjustment. So, changes can be made in the color, design, graphics or any other component to create a unique layout.
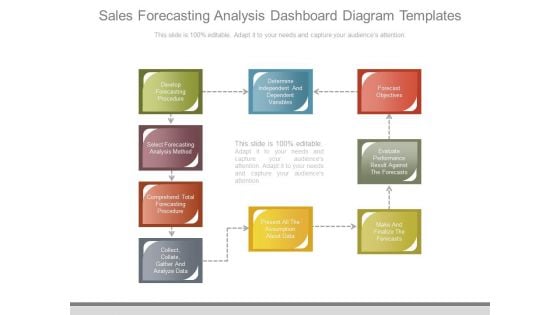
Sales Forecasting Analysis Dashboard Diagram Templates
This is a sales forecasting analysis dashboard diagram templates. This is a nine stage process. The stages in this process are develop forecasting procedure, select forecasting analysis method, comprehend total forecasting procedure, collect collate gather and analyze data, determine independent and dependent variables, present all the assumption about data, forecast objectives, evaluate performance result against the forecasts, make and finalize the forecasts.
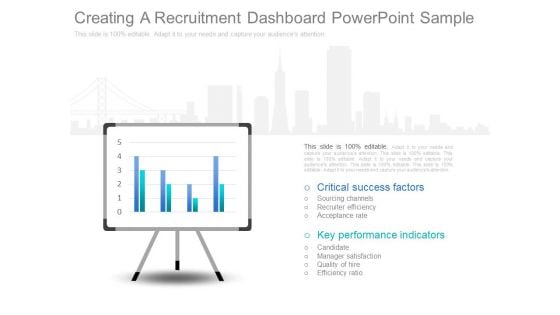
Creating A Recruitment Dashboard Powerpoint Sample
This is a creating a recruitment dashboard powerpoint sample. This is a two stage process. The stages in this process are critical success factors, sourcing channels, recruiter efficiency, acceptance rate, key performance indicators, candidate, manager satisfaction, quality of hire, efficiency ratio.
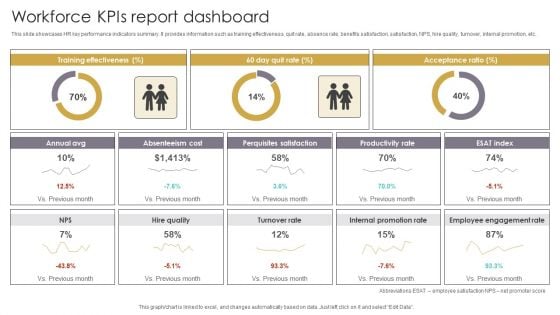
Workforce Kpis Report Dashboard Slides PDF
This slide showcases HR key performance indicators summary. It provides information such as training effectiveness, quit rate, absence rate, benefits satisfaction, satisfaction, NPS, hire quality, turnover, internal promotion, etc. Pitch your topic with ease and precision using this Workforce Kpis Report Dashboard Slides PDF. This layout presents information on Acceptance Ratio, Absenteeism Cost, Perquisites Satisfaction. It is also available for immediate download and adjustment. So, changes can be made in the color, design, graphics or any other component to create a unique layout.
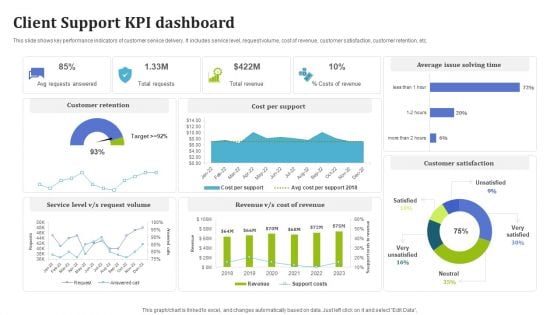
Client Support KPI Dashboard Rules PDF
This slide shows key performance indicators of customer service delivery. It includes service level, request volume, cost of revenue, customer satisfaction, customer retention, etc. Pitch your topic with ease and precision using this Client Support KPI Dashboard Rules PDF. This layout presents information on Customer Retention, Cost Per Support, Average Issue Solving Time. It is also available for immediate download and adjustment. So, changes can be made in the color, design, graphics or any other component to create a unique layout.
Implementing Change Management Strategy To Transform Business Processes Dashboard Depicting Kpis To Track Icons PDF
This slide covers the dashboard that depicts metrics to track company sales performance that focuses on number of sales, cost breakdown, accumulated revenues, incremental sales, etc. Boost your pitch with our creative Implementing Change Management Strategy To Transform Business Processes Dashboard Depicting Kpis To Track Icons PDF. Deliver an awe-inspiring pitch that will mesmerize everyone. Using these presentation templates you will surely catch everyones attention. You can browse the ppts collection on our website. We have researchers who are experts at creating the right content for the templates. So you do not have to invest time in any additional work. Just grab the template now and use them.
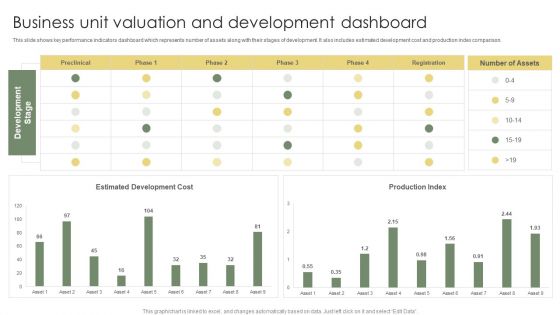
Business Unit Valuation And Development Dashboard Ppt Professional Graphic Tips PDF
This slide shows key performance indicators dashboard which represents number of assets along with their stages of development. It also includes estimated development cost and production index comparison. Pitch your topic with ease and precision using this Business Unit Valuation And Development Dashboard Ppt Professional Graphic Tips PDF. This layout presents information on Estimated Development Cost, Production Index, Development Stage. It is also available for immediate download and adjustment. So, changes can be made in the color, design, graphics or any other component to create a unique layout.
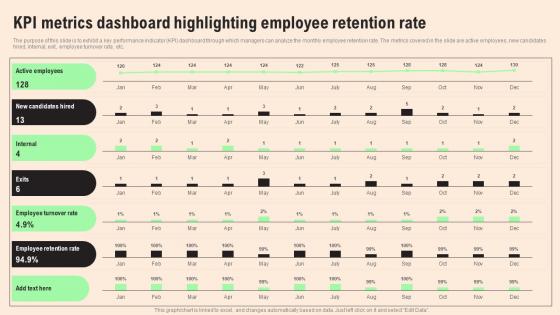
KPI Metrics Dashboard Highlighting HR Retention Techniques For Business Owners Slides Pdf
The purpose of this slide is to exhibit a key performance indicator KPI dashboard through which managers can analyze the monthly employee retention rate. The metrics covered in the slide are active employees, new candidates hired, internal, exit, employee turnover rate, etc. Slidegeeks is one of the best resources for PowerPoint templates. You can download easily and regulate KPI Metrics Dashboard Highlighting HR Retention Techniques For Business Owners Slides Pdf for your personal presentations from our wonderful collection. A few clicks is all it takes to discover and get the most relevant and appropriate templates. Use our Templates to add a unique zing and appeal to your presentation and meetings. All the slides are easy to edit and you can use them even for advertisement purposes. The purpose of this slide is to exhibit a key performance indicator KPI dashboard through which managers can analyze the monthly employee retention rate. The metrics covered in the slide are active employees, new candidates hired, internal, exit, employee turnover rate, etc.
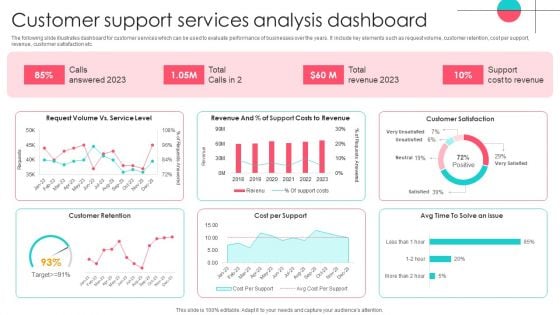
Customer Support Services Analysis Dashboard Template PDF
The following slide illustrates dashboard for customer services which can be used to evaluate performance of businesses over the years. It include key elements such as request volume, customer retention, cost per support, revenue, customer satisfaction etc. Showcasing this set of slides titled Customer Support Services Analysis Dashboard Template PDF. The topics addressed in these templates are Customer Support Services, Analysis Dashboard. All the content presented in this PPT design is completely editable. Download it and make adjustments in color, background, font etc. as per your unique business setting.
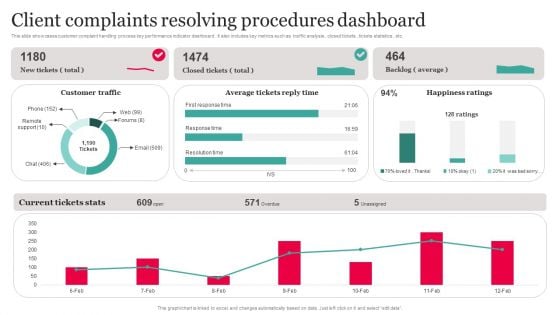
Client Complaints Resolving Procedures Dashboard Download PDF
This slide showcases customer complaint handling process key performance indicator dashboard. It also includes key metrics such as traffic analysis , closed tickets , tickets statistics , etc. Showcasing this set of slides titled Client Complaints Resolving Procedures Dashboard Download PDF The topics addressed in these templates are Customer Traffic, Average Tickets Reply Time, Resolving Procedures Dashboard. All the content presented in this PPT design is completely editable. Download it and make adjustments in color, background, font etc. as per your unique business setting.
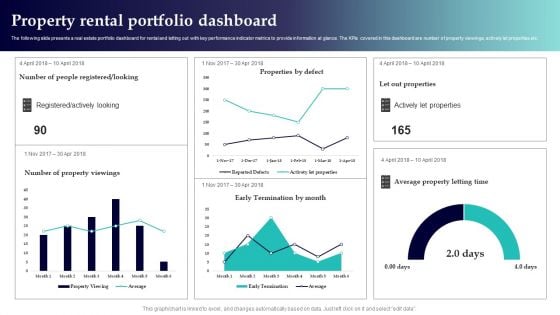
Property Rental Portfolio Dashboard Topics PDF
The following slide presents a real estate portfolio dashboard for rental and letting out with key performance indicator metrics to provide information at glance. The KPIs covered in this dashboard are number of property viewings, actively let properties etc. Showcasing this set of slides titled Property Rental Portfolio Dashboard Topics PDF. The topics addressed in these templates are People Registered Looking, Actively Let Properties, Average Property Letting Time. All the content presented in this PPT design is completely editable. Download it and make adjustments in color, background, font etc. as per your unique business setting.
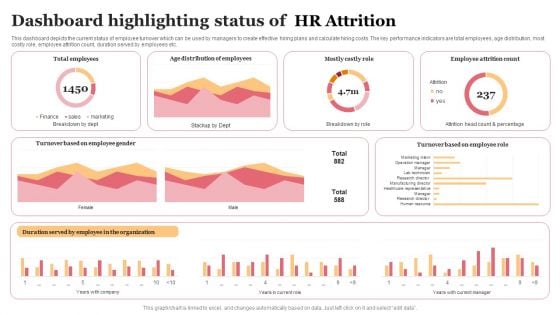
Dashboard Highlighting Status Of Clipart PDF
This dashboard depicts the current status of employee turnover which can be used by managers to create effective hiring plans and calculate hiring costs. The key performance indicators are total employees, age distribution, most costly role, employee attrition count, duration served by employees etc. Showcasing this set of slides titled Dashboard Highlighting Status Of Clipart PDF. The topics addressed in these templates are Dashboard Highlighting Status, HR Attrition. All the content presented in this PPT design is completely editable. Download it and make adjustments in color, background, font etc. as per your unique business setting.
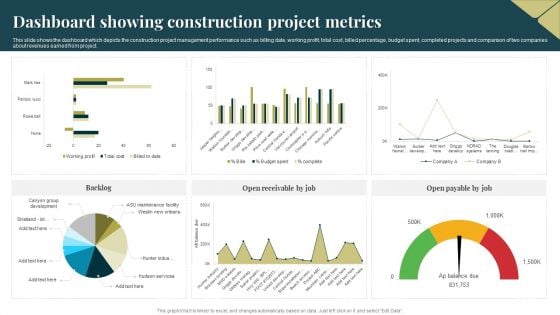
Dashboard Showing Construction Project Metrics Sample PDF
This slide shows the dashboard which depicts the construction project management performance such as billing date, working profit, total cost, billed percentage, budget spent, completed projects and comparison of two companies about revenues earned from project. Showcasing this set of slides titled Dashboard Showing Construction Project Metrics Sample PDF. The topics addressed in these templates are Dashboard, Construction Project Metrics. All the content presented in this PPT design is completely editable. Download it and make adjustments in color, background, font etc. as per your unique business setting.
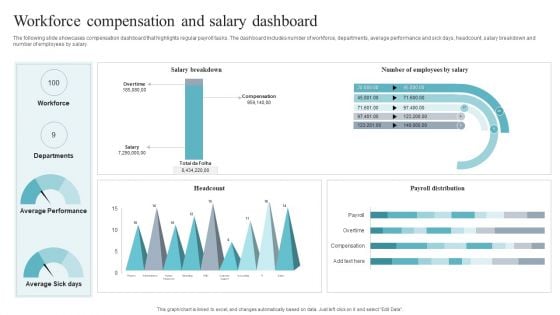
Workforce Compensation And Salary Dashboard Brochure PDF
The following slide showcases compensation dashboard that highlights regular payroll tasks. The dashboard includes number of workforce, departments, average performance and sick days, headcount, salary breakdown and number of employees by salary. Pitch your topic with ease and precision using this Workforce Compensation And Salary Dashboard Brochure PDF. This layout presents information on Workforce Compensation, Salary Dashboard. It is also available for immediate download and adjustment. So, changes can be made in the color, design, graphics or any other component to create a unique layout.
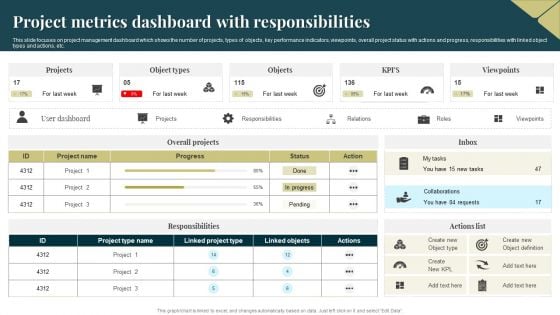
Project Metrics Dashboard With Responsibilities Graphics PDF
This slide focuses on project management dashboard which shows the number of projects, types of objects, key performance indicators, viewpoints, overall project status with actions and progress, responsibilities with linked object types and actions, etc. Pitch your topic with ease and precision using this Project Metrics Dashboard With Responsibilities Graphics PDF. This layout presents information on Project Metrics, Dashboard With Responsibilities. It is also available for immediate download and adjustment. So, changes can be made in the color, design, graphics or any other component to create a unique layout.
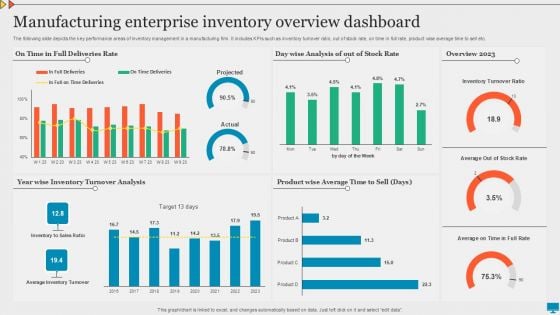
Manufacturing Enterprise Inventory Overview Dashboard Graphics PDF
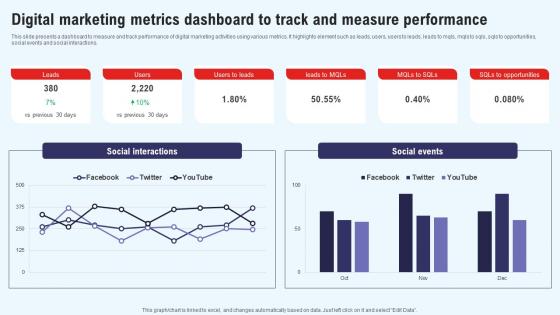
Efficient Marketing Process For Business Digital Marketing Metrics Dashboard To Track Professional Pdf
This slide presents a dashboard to measure and track performance of digital marketing activities using various metrics. It highlights element such as leads, users, users to leads, leads to mqls, mqls to sqls, sqls to opportunities, social events and social interactions. Whether you have daily or monthly meetings, a brilliant presentation is necessary. Efficient Marketing Process For Business Digital Marketing Metrics Dashboard To Track Professional Pdf can be your best option for delivering a presentation. Represent everything in detail using Efficient Marketing Process For Business Digital Marketing Metrics Dashboard To Track Professional Pdf and make yourself stand out in meetings. The template is versatile and follows a structure that will cater to your requirements. All the templates prepared by Slidegeeks are easy to download and edit. Our research experts have taken care of the corporate themes as well. So, give it a try and see the results. This slide presents a dashboard to measure and track performance of digital marketing activities using various metrics. It highlights element such as leads, users, users to leads, leads to mqls, mqls to sqls, sqls to opportunities, social events and social interactions.
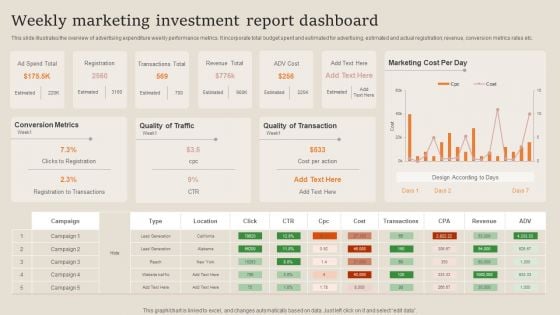
Weekly Marketing Investment Report Dashboard Ideas PDF
This slide illustrates the overview of advertising expenditure weekly performance metrics. It incorporate total budget spent and estimated for advertising, estimated and actual registration, revenue, conversion metrics rates etc. Showcasing this set of slides titled Weekly Marketing Investment Report Dashboard Ideas PDF. The topics addressed in these templates are Conversion Metrics, Quality Of Traffic, Quality Of Transaction. All the content presented in this PPT design is completely editable. Download it and make adjustments in color, background, font etc. as per your unique business setting.
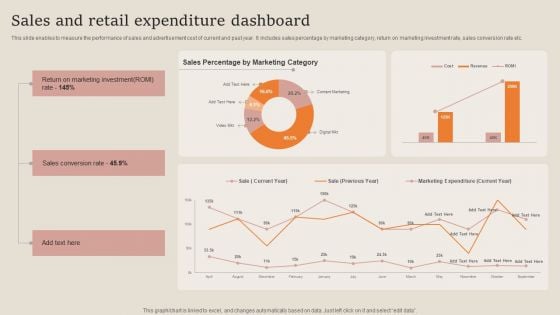
Sales And Retail Expenditure Dashboard Guidelines PDF
This slide enables to measure the performance of sales and advertisement cost of current and past year. It includes sales percentage by marketing category, return on marketing investment rate, sales conversion rate etc. Pitch your topic with ease and precision using this Sales And Retail Expenditure Dashboard Guidelines PDF. This layout presents information on Sales Conversion Rate, Marketing Investment. It is also available for immediate download and adjustment. So, changes can be made in the color, design, graphics or any other component to create a unique layout.

Estimating Business Overall Kpi Metrics Dashboard Highlighting Organization Revenue Clipart PDF
The following slide outlines key performance indicator KPI dashboard showcasing various financial metrics of the organization. The key metrics are gross revenue, product revenue, service revenue, gross profit, net profit etc. Formulating a presentation can take up a lot of effort and time, so the content and message should always be the primary focus. The visuals of the PowerPoint can enhance the presenters message, so our Estimating Business Overall Kpi Metrics Dashboard Highlighting Organization Revenue Clipart PDF was created to help save time. Instead of worrying about the design, the presenter can concentrate on the message while our designers work on creating the ideal templates for whatever situation is needed. Slidegeeks has experts for everything from amazing designs to valuable content, we have put everything into Estimating Business Overall Kpi Metrics Dashboard Highlighting Organization Revenue Clipart PDF.
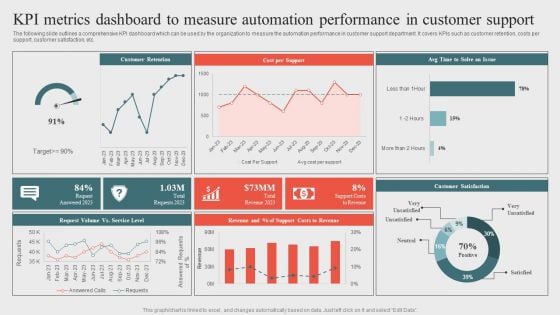
Kpi Metrics Dashboard To Measure Automation Performanceoptimizing Business Processes Through Automation Download PDF
The following slide outlines a comprehensive KPI dashboard which can be used by the organization to measure the automation performance in customer support department. It covers KPIs such as customer retention, costs per support, customer satisfaction, etc. Get a simple yet stunning designed Kpi Metrics Dashboard To Measure Automation Performanceoptimizing Business Processes Through Automation Download PDF. It is the best one to establish the tone in your meetings. It is an excellent way to make your presentations highly effective. So, download this PPT today from Slidegeeks and see the positive impacts. Our easy to edit Kpi Metrics Dashboard To Measure Automation Performanceoptimizing Business Processes Through Automation Download PDF can be your go to option for all upcoming conferences and meetings. So, what are you waiting for Grab this template today.
Overview Of BI For Enhanced Decision Making Business Intelligence Key Metrics Dashboard Icons PDF
This slide covers the key performance tracking dashboard of an organization prepared with the help of BI software. It includes key metrics such as data exchange trend, department distribution, data sampling etc. Slidegeeks is one of the best resources for PowerPoint templates. You can download easily and regulate Overview Of BI For Enhanced Decision Making Business Intelligence Key Metrics Dashboard Icons PDF for your personal presentations from our wonderful collection. A few clicks is all it takes to discover and get the most relevant and appropriate templates. Use our Templates to add a unique zing and appeal to your presentation and meetings. All the slides are easy to edit and you can use them even for advertisement purposes.
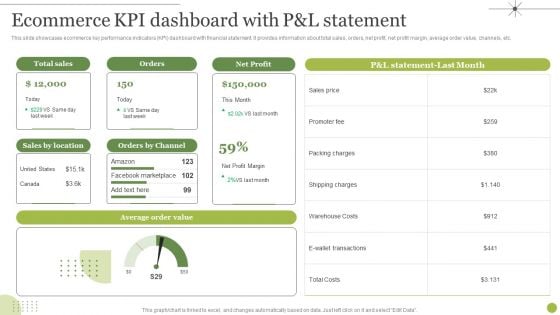
Managing E Commerce Business Accounting Ecommerce KPI Dashboard With P And L Statement Diagrams PDF
This slide showcases ecommerce key performance indicators KPI dashboard with financial statement. It provides information about total sales, orders, net profit, net profit margin, average order value, channels, etc. Present like a pro with Managing E Commerce Business Accounting Ecommerce KPI Dashboard With P And L Statement Diagrams PDF Create beautiful presentations together with your team, using our easy to use presentation slides. Share your ideas in real time and make changes on the fly by downloading our templates. So whether you are in the office, on the go, or in a remote location, you can stay in sync with your team and present your ideas with confidence. With Slidegeeks presentation got a whole lot easier. Grab these presentations today.

Enterprise Dashboard Ppt Presentation Powerpoint Example
This is a enterprise dashboard ppt presentation powerpoint example. This is a three stage process. The stages in this process are balance scorecard, enterprise performance, industry trends.
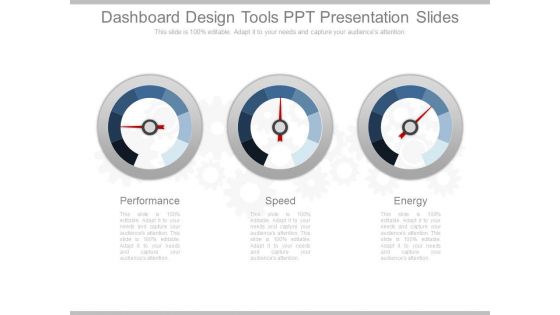
Dashboard Design Tools Ppt Presentation Slides
This is a dashboard design tools ppt presentation slides. This is a three stage process. The stages in this process are performance, speed, energy.
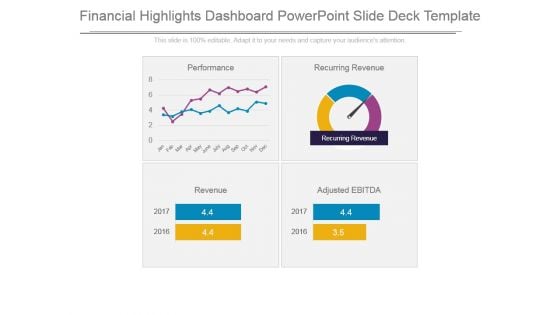
Financial Highlights Dashboard Powerpoint Slide Deck Template
This is a financial highlights dashboard powerpoint slide deck template. This is a four stage process. The stages in this process are recurring revenue, performance, revenue, adjusted ebitda.
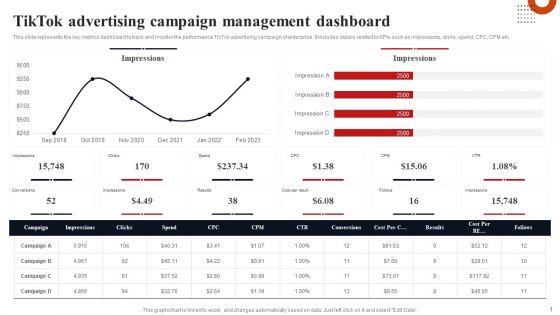
Tiktok Advertising Campaign Management Dashboard Pictures PDF
This slide represents the key metrics dashboard to track and monitor the performance TikTok advertising campaign of enterprise. It includes details related to KPIs such as impressions, clicks, spend, CPC, CPM etc. Crafting an eye catching presentation has never been more straightforward. Let your presentation shine with this tasteful yet straightforward Tiktok Advertising Campaign Management Dashboard Pictures PDF template. It offers a minimalistic and classy look that is great for making a statement. The colors have been employed intelligently to add a bit of playfulness while still remaining professional. Construct the ideal Tiktok Advertising Campaign Management Dashboard Pictures PDF that effortlessly grabs the attention of your audience Begin now and be certain to wow your customers.
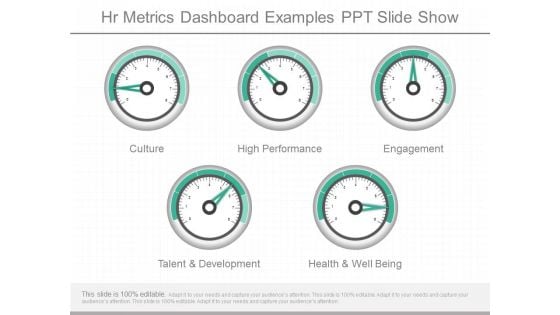
Hr Metrics Dashboard Examples Ppt Slide Show
This is a hr metrics dashboard examples ppt slide show. This is a five stage process. The stages in this process are culture, high performance, engagement, talent and development, health and well being.
Project Tracking Cost Tracker Dashboard Elements PDF
The following slide highlights the cost analysis of various projects to perform feasibility analysis. It includes budgeted versus actual cost, project wise cost and revenue allocation etc. Showcasing this set of slides titled Project Tracking Cost Tracker Dashboard Elements PDF. The topics addressed in these templates are Budgeted Costs, Resource Allocation, Project Costs. All the content presented in this PPT design is completely editable. Download it and make adjustments in color, background, font etc. as per your unique business setting.
Project Tracking Dashboard Template Ppt Sample
This is a project tracking dashboard template ppt sample. This is a five stage process. The stages in this process are requirements, analytics, needs, performance, analysis.
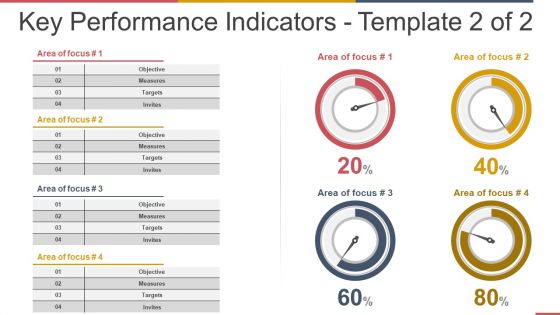
Key Performance Indicators Template 2 Ppt PowerPoint Presentation Ideas Background Images
This is a key performance indicators template 2 ppt powerpoint presentation ideas background images. This is a four stage process. The stages in this process are objective, measures, targets, invites.
Storage Logistics Warehouse Management Dashboard Icons PDF
The slide demonstrates information regarding the warehouse management dashboard in order to track key activities. Deliver an awe inspiring pitch with this creative storage logistics warehouse management dashboard icons pdf bundle. Topics like orders, kpls monthly, global financial performances can be discussed with this completely editable template. It is available for immediate download depending on the needs and requirements of the user.
IT Alignment For Strategic Dashboard For Tracking Business And IT Alignment Professional PDF
This slide depicts the dashboard for business and IT alignment by covering details of total sales, customer support service, percentage of business operations aligned IT, usage of communication channels, and top performer associates. Formulating a presentation can take up a lot of effort and time, so the content and message should always be the primary focus. The visuals of the PowerPoint can enhance the presenters message, so our IT Alignment For Strategic Dashboard For Tracking Business And IT Alignment Professional PDF was created to help save time. Instead of worrying about the design, the presenter can concentrate on the message while our designers work on creating the ideal templates for whatever situation is needed. Slidegeeks has experts for everything from amazing designs to valuable content, we have put everything into IT Alignment For Strategic Dashboard For Tracking Business And IT Alignment Professional PDF.
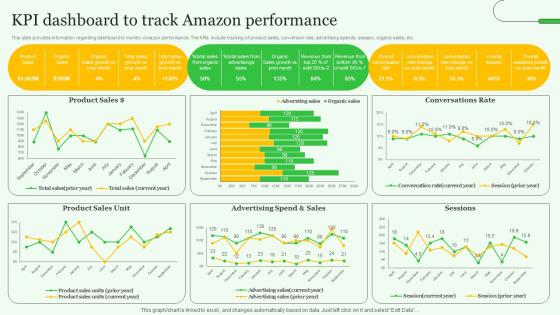
KPI Dashboard To Track Amazon Exploring Amazons Global Business Model Growth Themes Pdf
This slide provides information regarding dashboard to monitor Amazon performance. The KPIs include tracking of product sales, conversion rate, advertising spends, session, organic sales, etc. Are you searching for a KPI Dashboard To Track Amazon Exploring Amazons Global Business Model Growth Themes Pdf that is uncluttered, straightforward, and original Its easy to edit, and you can change the colors to suit your personal or business branding. For a presentation that expresses how much effort you have put in, this template is ideal With all of its features, including tables, diagrams, statistics, and lists, its perfect for a business plan presentation. Make your ideas more appealing with these professional slides. Download KPI Dashboard To Track Amazon Exploring Amazons Global Business Model Growth Themes Pdf from Slidegeeks today. This slide provides information regarding dashboard to monitor Amazon performance. The KPIs include tracking of product sales, conversion rate, advertising spends, session, organic sales, etc.
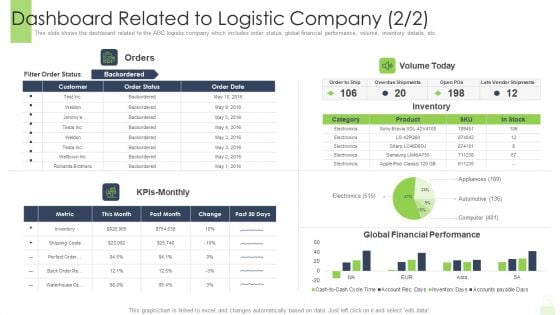
Developing Functional Logistic Plan Business Dashboard Related To Logistic Company Inspiration PDF
This slide shows the dashboard related to the ABC logistic company which includes order status, global financial performance, volume, inventory details, etc. Deliver and pitch your topic in the best possible manner with this developing functional logistic plan business dashboard related to logistic company inspiration pdf. Use them to share invaluable insights on dashboard related to logistic company and impress your audience. This template can be altered and modified as per your expectations. So, grab it now.
Client Relationship Management Tracking Dashboard Topics PDF
The following slide depicts the key performing indicators of customer lead management. It includes the platform wise customer lead, upcoming and achieved targets, country wise customer leads etc. Showcasing this set of slides titled Client Relationship Management Tracking Dashboard Topics PDF. The topics addressed in these templates are Targets, Country Wise Customer Leads, Platform Wise Customer Lead. All the content presented in this PPT design is completely editable. Download it and make adjustments in color, background, font etc. as per your unique business setting.
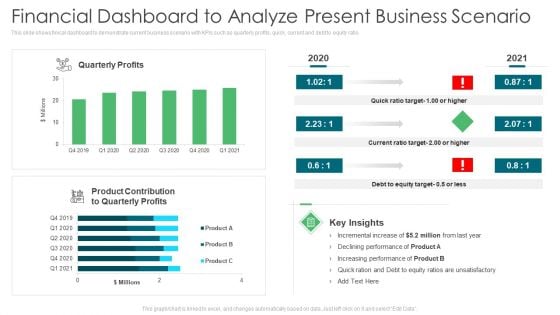
Environmental Assessment Financial Dashboard To Analyze Present Business Scenario Ppt Infographics Ideas PDF
This slide shows finical dashboard to demonstrate current business scenario with KPIs such as quarterly profits, quick, current and debt to equity ratio. Deliver an awe inspiring pitch with this creative environmental assessment financial dashboard to analyze present business scenario ppt infographics ideas pdf bundle. Topics like product contribution, increasing performance, equity target can be discussed with this completely editable template. It is available for immediate download depending on the needs and requirements of the user.
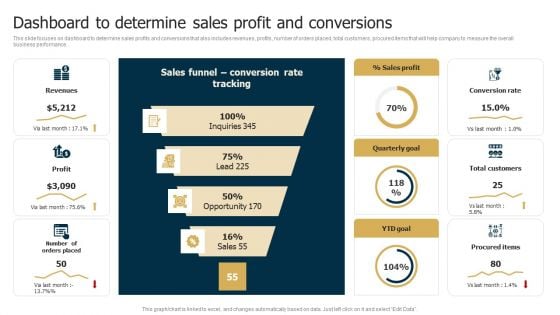
Business Restructuring Process Dashboard To Determine Sales Profit And Conversions Inspiration PDF
This slide focuses on dashboard to determine sales profits and conversions that also includes revenues, profits, number of orders placed, total customers, procured items that will help company to measure the overall business performance. There are so many reasons you need a Business Restructuring Process Dashboard To Determine Sales Profit And Conversions Inspiration PDF. The first reason is you cant spend time making everything from scratch, Thus, Slidegeeks has made presentation templates for you too. You can easily download these templates from our website easily.
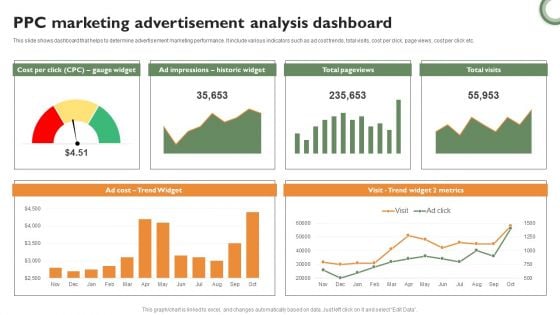
PPC Marketing Advertisement Analysis Dashboard Background PDF
This slide shows dashboard that helps to determine advertisement marketing performance. It include various indicators such as ad cost trends, total visits, cost per click, page views, cost per click etc. Showcasing this set of slides titled PPC Marketing Advertisement Analysis Dashboard Background PDF. The topics addressed in these templates are PPC Marketing, Advertisement Analysis Dashboard. All the content presented in this PPT design is completely editable. Download it and make adjustments in color, background, font etc. as per your unique business setting.
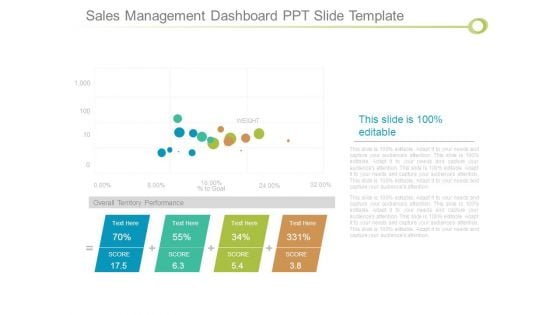
Sales Management Dashboard Ppt Slide Template
This is a sales management dashboard ppt slide template. This is a four stage process. The stages in this process are weight, goal, overall territory performance, score.
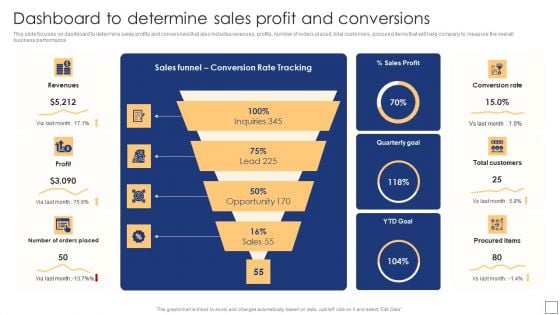
Business Process Redesigning Dashboard To Determine Sales Profit And Conversions Slides PDF
This slide focuses on dashboard to determine sales profits and conversions that also includes revenues, profits, number of orders placed, total customers, procured items that will help company to measure the overall business performance. There are so many reasons you need a Business Process Redesigning Dashboard To Determine Sales Profit And Conversions Slides PDF. The first reason is you cant spend time making everything from scratch, Thus, Slidegeeks has made presentation templates for you too. You can easily download these templates from our website easily.
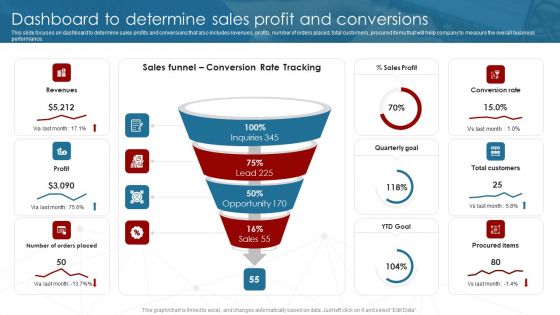
Deployment Of Business Process Dashboard To Determine Sales Profit And Conversions Demonstration PDF
This slide focuses on dashboard to determine sales profits and conversions that also includes revenues, profits, number of orders placed, total customers, procured items that will help company to measure the overall business performance. There are so many reasons you need a Deployment Of Business Process Dashboard To Determine Sales Profit And Conversions Demonstration PDF. The first reason is you cant spend time making everything from scratch, Thus, Slidegeeks has made presentation templates for you too. You can easily download these templates from our website easily.
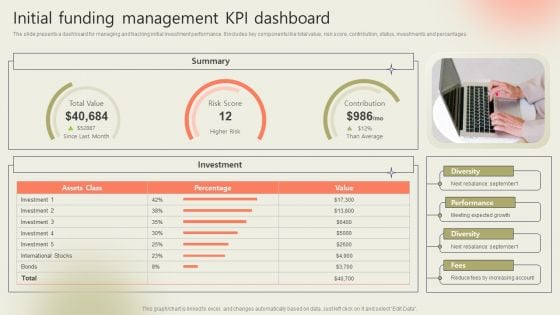
Initial Funding Management Kpi Dashboard Rules PDF
The slide presents a dashboard for managing and tracking initial investment performance. It includes key components like total value, risk score, contribution, status, investments and percentages. Pitch your topic with ease and precision using this Initial Funding Management Kpi Dashboard Rules PDF. This layout presents information on Performance, Diversity, Expected Growth. It is also available for immediate download and adjustment. So, changes can be made in the color, design, graphics or any other component to create a unique layout.
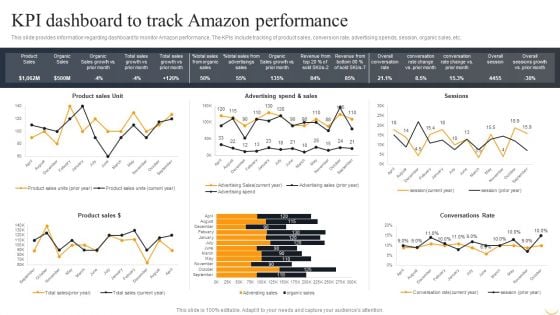
Amazon Business Strategies To Gain Competitive Advantage KPI Dashboard To Track Amazon Background PDF
This slide provides information regarding dashboard to monitor Amazon performance. The KPIs include tracking of product sales, conversion rate, advertising spends, session, organic sales, etc. Do you have to make sure that everyone on your team knows about any specific topic I yes, then you should give Amazon Business Strategies To Gain Competitive Advantage KPI Dashboard To Track Amazon Background PDF a try. Our experts have put a lot of knowledge and effort into creating this impeccable Amazon Business Strategies To Gain Competitive Advantage KPI Dashboard To Track Amazon Background PDF. You can use this template for your upcoming presentations, as the slides are perfect to represent even the tiniest detail. You can download these templates from the Slidegeeks website and these are easy to edit. So grab these today.
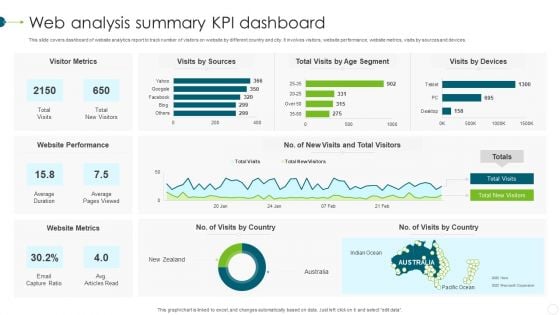
Web Analysis Summary KPI Dashboard Template PDF
This slide covers dashboard of website analytics report to track number of visitors on website by different country and city. It involves visitors, website performance, website metrics, visits by sources and devices. Showcasing this set of slides titled Web Analysis Summary KPI Dashboard Template PDF. The topics addressed in these templates are Website Metrics, Website Performance, Visitor Metrics. All the content presented in this PPT design is completely editable. Download it and make adjustments in color, background, font etc. as per your unique business setting.
Marketing Success Metrics Dashboard For Tracking Business Blog Kpis Brochure PDF
This slide covers the dashboard for analyzing blogging KPIs such as performance, published posts, views, new blog subscribers, top blog posts by pageviews, top blog posts by CTR, etc. Retrieve professionally designed Marketing Success Metrics Dashboard For Tracking Business Blog Kpis Brochure PDF to effectively convey your message and captivate your listeners. Save time by selecting pre-made slideshows that are appropriate for various topics, from business to educational purposes. These themes come in many different styles, from creative to corporate, and all of them are easily adjustable and can be edited quickly. Access them as PowerPoint templates or as Google Slides themes. You dont have to go on a hunt for the perfect presentation because Slidegeeks got you covered from everywhere.
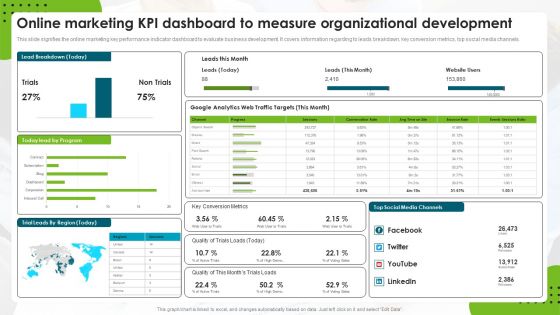
Online Marketing Kpi Dashboard To Measure Organizational Development Rules PDF
This slide signifies the online marketing key performance indicator dashboard to evaluate business development. It covers information regarding to leads breakdown, key conversion metrics, top social media channels. Pitch your topic with ease and precision using this Online Marketing Kpi Dashboard To Measure Organizational Development Rules PDF. This layout presents information on Web Traffic Targets, Google Analytics, Social Media Channels. It is also available for immediate download and adjustment. So, changes can be made in the color, design, graphics or any other component to create a unique layout.
Optimizing Marketing Analytics To Enhance Organizational Growth Dashboard For Tracking Business Designs PDF
This slide covers the dashboard for analyzing blogging KPIs such as performance, published posts, views, new blog subscribers, top blog posts by pageviews, top blog posts by CTR, etc. Do you know about Slidesgeeks Optimizing Marketing Analytics To Enhance Organizational Growth Dashboard For Tracking Business Designs PDF These are perfect for delivering any kind od presentation. Using it, create PowerPoint presentations that communicate your ideas and engage audiences. Save time and effort by using our pre designed presentation templates that are perfect for a wide range of topic. Our vast selection of designs covers a range of styles, from creative to business, and are all highly customizable and easy to edit. Download as a PowerPoint template or use them as Google Slides themes.
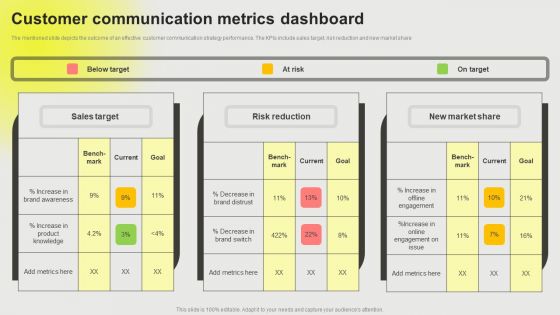
Developing A Successful Business Communication Plan Customer Communication Metrics Dashboard Download PDF
The mentioned slide depicts the outcome of an effective customer communication strategy performance. The KPIs include sales target, risk reduction and new market share Whether you have daily or monthly meetings, a brilliant presentation is necessary. Developing A Successful Business Communication Plan Customer Communication Metrics Dashboard Download PDF can be your best option for delivering a presentation. Represent everything in detail using Developing A Successful Business Communication Plan Customer Communication Metrics Dashboard Download PDF and make yourself stand out in meetings. The template is versatile and follows a structure that will cater to your requirements. All the templates prepared by Slidegeeks are easy to download and edit. Our research experts have taken care of the corporate themes as well. So, give it a try and see the results.
Marketers Guide To Data Analysis Optimization Dashboard For Tracking Business Blog Kpis Infographics PDF
This slide covers the dashboard for analyzing blogging KPIs such as performance, published posts, views, new blog subscribers, top blog posts by pageviews, top blog posts by CTR, etc. Coming up with a presentation necessitates that the majority of the effort goes into the content and the message you intend to convey. The visuals of a PowerPoint presentation can only be effective if it supplements and supports the story that is being told. Keeping this in mind our experts created Marketers Guide To Data Analysis Optimization Dashboard For Tracking Business Blog Kpis Infographics PDF to reduce the time that goes into designing the presentation. This way, you can concentrate on the message while our designers take care of providing you with the right template for the situation.


 Continue with Email

 Home
Home


