Business Performance Dashboard
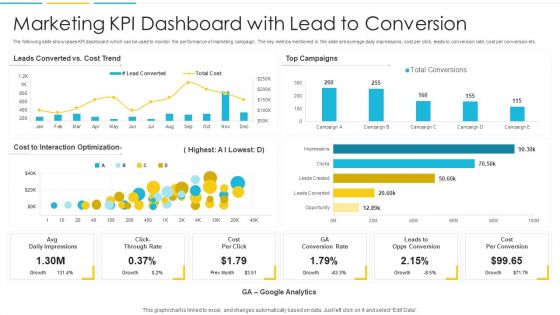
Marketing KPI Dashboard With Lead To Conversion Structure PDF
The following slide showcases KPI dashboard which can be used to monitor the performance of marketing campaign. The key metrics mentioned in the slide are average daily impressions, cost per click, leads to conversion rate, cost per conversion etc. Showcasing this set of slides titled Marketing KPI Dashboard With Lead To Conversion Structure PDF. The topics addressed in these templates are Impressions, Optimization, Cost. All the content presented in this PPT design is completely editable. Download it and make adjustments in color, background, font etc. as per your unique business setting.
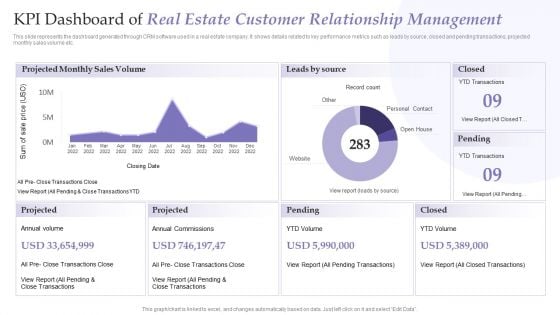
KPI Dashboard Of Real Estate Customer Relationship Management Pictures PDF
This slide represents the dashboard generated through CRM software used in a real estate company. It shows details related to key performance metrics such as leads by source, closed and pending transactions, projected monthly sales volume etc. Showcasing this set of slides titled KPI Dashboard Of Real Estate Customer Relationship Management Pictures PDF. The topics addressed in these templates are Projected Monthly Sales Volume, Leads By Source, Annual Commissions. All the content presented in this PPT design is completely editable. Download it and make adjustments in color, background, font etc. as per your unique business setting.
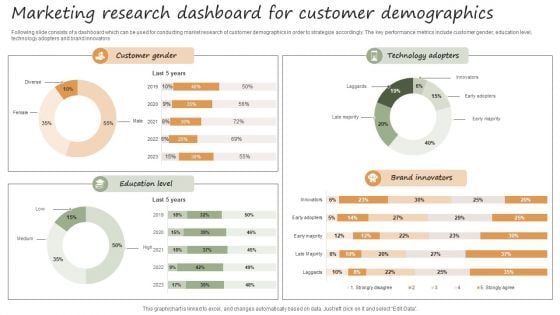
Marketing Research Dashboard For Customer Demographics Guidelines PDF
Following slide consists of a dashboard which can be used for conducting market research of customer demographics in order to strategize accordingly. The key performance metrics include customer gender, education level, technology adopters and brand innovators. Showcasing this set of slides titled Marketing Research Dashboard For Customer Demographics Guidelines PDF. The topics addressed in these templates are Customer Gender, Technology Adopters, Education Level. All the content presented in this PPT design is completely editable. Download it and make adjustments in color, background, font etc. as per your unique business setting.

Infrastructure Expansion KPI Dashboard For Investment Project Management Inspiration PDF
This slide covers management dashboard for analyzing the project performance and progress. It include KPIs such as total claims to date, total costs to date, project status, profits, number of days left, etc. Showcasing this set of slides titled Infrastructure Expansion KPI Dashboard For Investment Project Management Inspiration PDF. The topics addressed in these templates are Claims And Costs, Project Status, Profits. All the content presented in this PPT design is completely editable. Download it and make adjustments in color, background, font etc. as per your unique business setting.

KPI Dashboard To Manage And Track Personnel Administration Summary PDF
This slide shows the dashboard which can be used to monitor performance of employees in an organization. It includes metrics such as headcount, average employee age, gender diversity ratio, absenteeism, etc. Showcasing this set of slides titled KPI Dashboard To Manage And Track Personnel Administration Summary PDF. The topics addressed in these templates are Employee Count Status, Employee Count Department, Employee Count Salary Range. All the content presented in this PPT design is completely editable. Download it and make adjustments in color, background, font etc. as per your unique business setting.
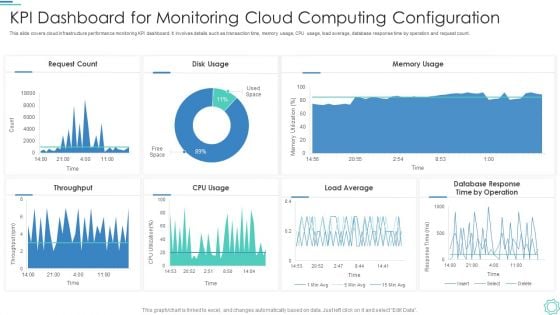
Kpi Dashboard For Monitoring Cloud Computing Configuration Portrait PDF
This slide covers cloud infrastructure performance monitoring KPI dashboard. It involves details such as transaction time, memory usage, CPU usage, load average, database response time by operation and request count.Showcasing this set of slides titled Kpi Dashboard For Monitoring Cloud Computing Configuration Portrait PDF. The topics addressed in these templates are Request Count, Disk Usage, Memory Usage. All the content presented in this PPT design is completely editable. Download it and make adjustments in color, background, font etc. as per your unique business setting.
Financial Procedure Dashboard Indicating Yearly Revenue Analysis Icons PDF
This slide illustrates finance process dashboard indicating yearly revenue analysis which contains gross profit margin, operating profit ratio, net profit, revenue and cost of goods sold cogs operating expenses, etc. It can be referred by company owners who can compare it with previous years performance and make related decisions for future. Showcasing this set of slides titled Financial Procedure Dashboard Indicating Yearly Revenue Analysis Icons PDF. The topics addressed in these templates are Operating Profit Percentage, Net Profit Percentage, Operating Profit Ratio. All the content presented in this PPT design is completely editable. Download it and make adjustments in color, background, font etc. as per your unique business setting.
IT Project Management Progress Tracking KPI Dashboard Template PDF
This slide provides IT project development dashboard which helps managers performance status. It provides information regarding team velocity, work in story points, product estimation status, closed story point vs epic story point and pending story points. Showcasing this set of slides titled IT Project Management Progress Tracking KPI Dashboard Template PDF. The topics addressed in these templates are Team Velocity, Product Estimation Status, Pending Story Points. All the content presented in this PPT design is completely editable. Download it and make adjustments in color, background, font etc. as per your unique business setting.
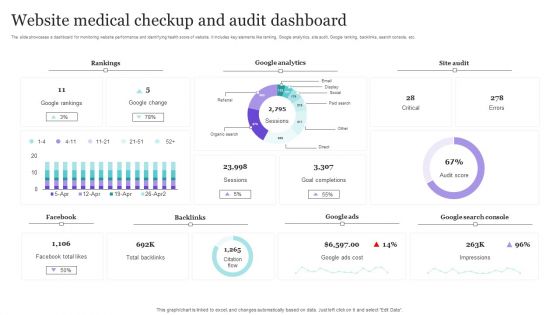
Website Medical Checkup And Audit Dashboard Background PDF
The slide showcases a dashboard for monitoring website performance and identifying health score of website. It includes key elements like ranking, Google analytics, site audit, Google ranking, backlinks, search console, etc. Showcasing this set of slides titled Website Medical Checkup And Audit Dashboard Background PDF. The topics addressed in these templates are Rankings, Google Analytics, Site Audit. All the content presented in this PPT design is completely editable. Download it and make adjustments in color, background, font etc. as per your unique business setting.
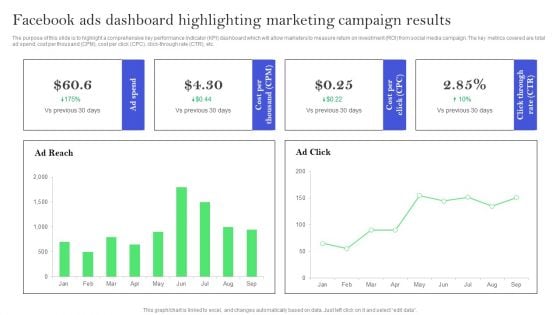
Facebook Ads Dashboard Highlighting Marketing Campaign Results Slides PDF
The purpose of this slide is to highlight a comprehensive key performance indicator KPI dashboard which will allow marketers to measure return on investment ROI from social media campaign. The key metrics covered are total ad spend, cost per thousand CPM, cost per click CPC, click through rate CTR, etc. From laying roadmaps to briefing everything in detail, our templates are perfect for you. You can set the stage with your presentation slides. All you have to do is download these easy to edit and customizable templates. Facebook Ads Dashboard Highlighting Marketing Campaign Results Slides PDF will help you deliver an outstanding performance that everyone would remember and praise you for. Do download this presentation today.
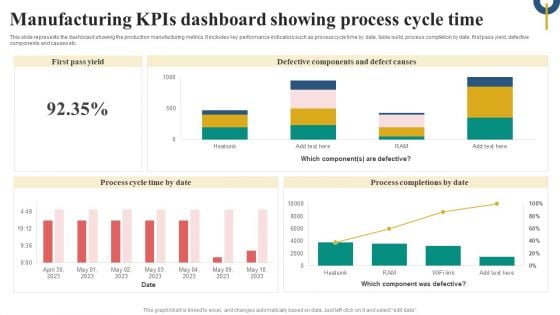
Manufacturing Kpis Dashboard Showing Process Cycle Time Microsoft PDF
This slide represents the dashboard showing the production manufacturing metrics. It includes key performance indicators such as process cycle time by date, table build, process completion by date, first pass yield, defective components and causes etc. Pitch your topic with ease and precision using this Manufacturing Kpis Dashboard Showing Process Cycle Time Microsoft PDF. This layout presents information on Defective Components Defect Causes, Process Cycle, Time By Date, Process Completions By Date. It is also available for immediate download and adjustment. So, changes can be made in the color, design, graphics or any other component to create a unique layout.
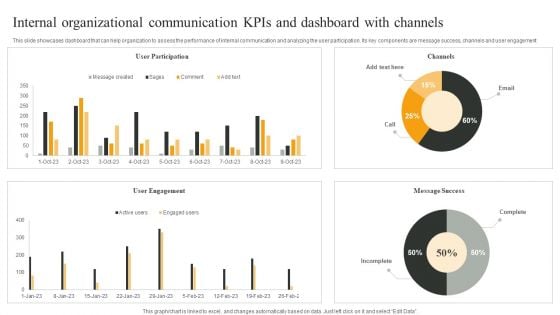
Internal Organizational Communication Kpis And Dashboard With Channels Infographics PDF
This slide showcases dashboard that can help organization to assess the performance of internal communication and analyzing the user participation. Its key components are message success, channels and user engagement. Pitch your topic with ease and precision using this Internal Organizational Communication Kpis And Dashboard With Channels Infographics PDF. This layout presents information on User Participation, User Engagement, Message Success. It is also available for immediate download and adjustment. So, changes can be made in the color, design, graphics or any other component to create a unique layout.

Internal Audit Metrics Analysis Dashboard Ppt Ideas Clipart Images PDF
This slide depicts the key performance indicator dashboard and status for internal audit. It includes information related to the audit observations and plan status. Pitch your topic with ease and precision using this Internal Audit Metrics Analysis Dashboard Ppt Ideas Clipart Images PDF. This layout presents information on Quarterly Audit Observations, Financial Year Internal, Audit Plan Status. It is also available for immediate download and adjustment. So, changes can be made in the color, design, graphics or any other component to create a unique layout.
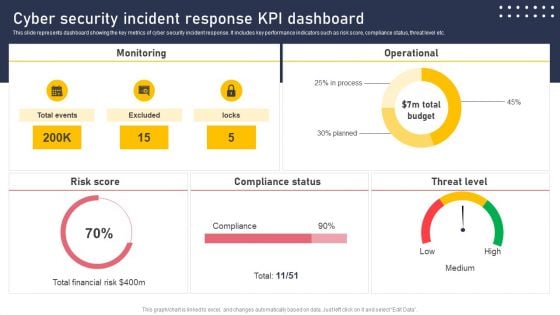
Cyber Security Incident Response KPI Dashboard Microsoft PDF
This slide represents dashboard showing the key metrics of cyber security incident response. It includes key performance indicators such as risk score, compliance status, threat level etc. Slidegeeks has constructed Cyber Security Incident Response KPI Dashboard Microsoft PDF after conducting extensive research and examination. These presentation templates are constantly being generated and modified based on user preferences and critiques from editors. Here, you will find the most attractive templates for a range of purposes while taking into account ratings and remarks from users regarding the content. This is an excellent jumping off point to explore our content and will give new users an insight into our top notch PowerPoint Templates.
Lead Tracking Dashboard With Metric Comparison Brochure PDF
This slide showcases dashboard of lead pipeline that can help to identify total number of leads generated and expenses incurred to acquire the audience. It also showcases other key performance metrics like lead breakdown by status and number of leads per month. Pitch your topic with ease and precision using this Lead Tracking Dashboard With Metric Comparison Brochure PDF. This layout presents information on Metric Comparison, Lead Pipeline, Lead Breakdown Status. It is also available for immediate download and adjustment. So, changes can be made in the color, design, graphics or any other component to create a unique layout.
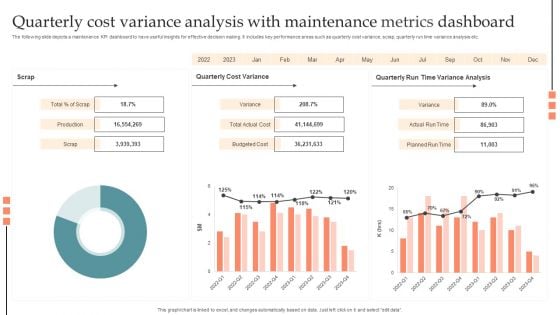
Quarterly Cost Variance Analysis With Maintenance Metrics Dashboard Information PDF
The following slide depicts a maintenance KPI dashboard to have useful insights for effective decision making. It includes key performance areas such as quarterly cost variance, scrap, quarterly run time variance analysis etc. Pitch your topic with ease and precision using this Quarterly Cost Variance Analysis With Maintenance Metrics Dashboard Information PDF. This layout presents information on Production, Budgeted Cost, Planned Run Time, Actual Run Time. It is also available for immediate download and adjustment. So, changes can be made in the color, design, graphics or any other component to create a unique layout.
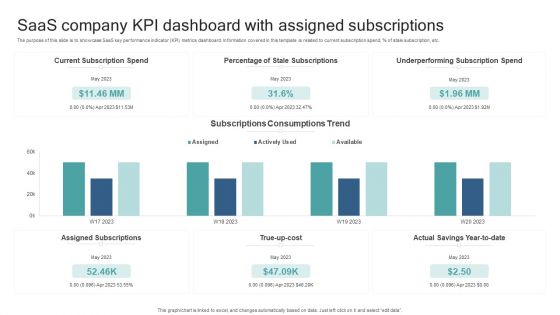
Saas Company KPI Dashboard With Assigned Subscriptions Formats PDF
The purpose of this slide is to showcase SaaS key performance indicator KPI metrics dashboard. Information covered in this template is related to current subscription spend, percent of stale subscription, etc. Pitch your topic with ease and precision using this Saas Company KPI Dashboard With Assigned Subscriptions Formats PDF. This layout presents information on Current Subscription Spend, Percentage Of Stale Subscriptions, True Up Cost, Underperforming Subscription Spend. It is also available for immediate download and adjustment. So, changes can be made in the color, design, graphics or any other component to create a unique layout.
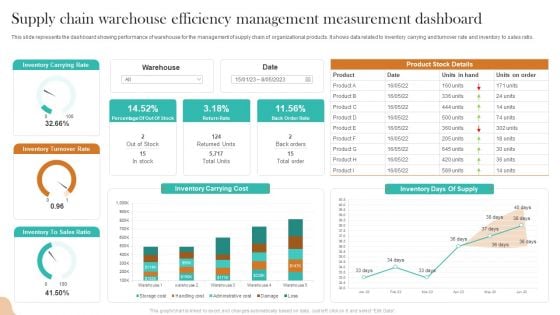
Supply Chain Warehouse Efficiency Management Measurement Dashboard Inspiration PDF
This slide represents the dashboard showing performance of warehouse for the management of supply chain of organizational products. It shows data related to inventory carrying and turnover rate and inventory to sales ratio. Pitch your topic with ease and precision using this Supply Chain Warehouse Efficiency Management Measurement Dashboard Inspiration PDF. This layout presents information on Inventory Carrying Rate, Inventory Turnover Rate, Inventory Carrying Cost. It is also available for immediate download and adjustment. So, changes can be made in the color, design, graphics or any other component to create a unique layout.
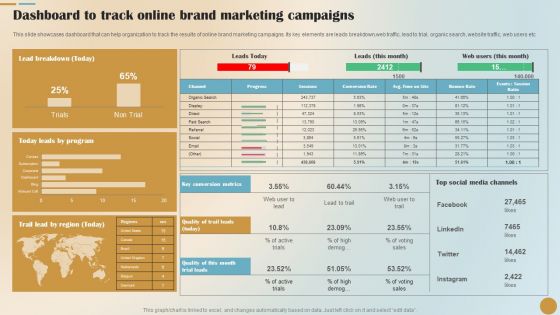
Dashboard To Track Online Brand Marketing Campaigns Guidelines PDF
This slide showcases dashboard that can help organization to track the results of online brand marketing campaigns. Its key elements are leads breakdown,web traffic, lead to trial, organic search, website traffic, web users etc. From laying roadmaps to briefing everything in detail, our templates are perfect for you. You can set the stage with your presentation slides. All you have to do is download these easy to edit and customizable templates. Dashboard To Track Online Brand Marketing Campaigns Guidelines PDF will help you deliver an outstanding performance that everyone would remember and praise you for. Do download this presentation today.
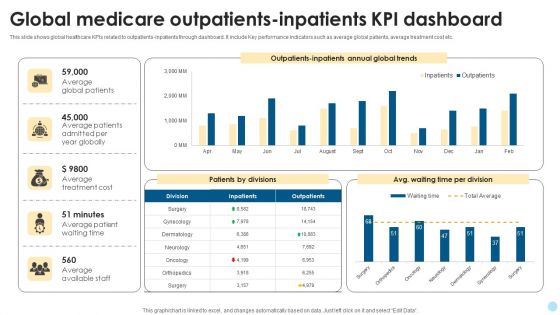
Global Medicare Outpatients Inpatients Kpi Dashboard Template PDF
This slide shows global healthcare KPIs related to outpatients-inpatients through dashboard. It include Key performance indicators such as average global patients, average treatment cost etc. Pitch your topic with ease and precision using this Global Medicare Outpatients Inpatients Kpi Dashboard Template PDF. This layout presents information on Average Treatment Cost, Average Global Patients, Average Available Staff. It is also available for immediate download and adjustment. So, changes can be made in the color, design, graphics or any other component to create a unique layout.
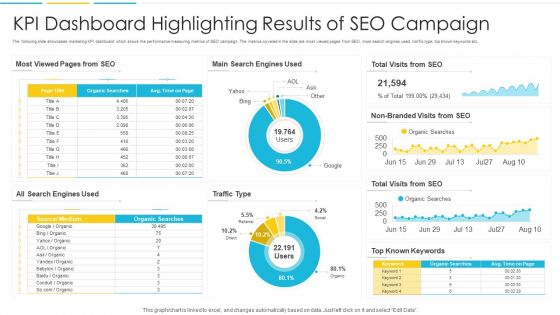
KPI Dashboard Highlighting Results Of SEO Campaign Topics PDF
The following slide showcases marketing KPI dashboard which shows the performance measuring metrics of SEO campaign. The metrics covered in the slide are most viewed pages from SEO, most search engines used, traffic type, top known keywords etc. Pitch your topic with ease and precision using this KPI Dashboard Highlighting Results Of SEO Campaign Topics PDF. This layout presents information on Search Engines, Traffic, Organic. It is also available for immediate download and adjustment. So, changes can be made in the color, design, graphics or any other component to create a unique layout.
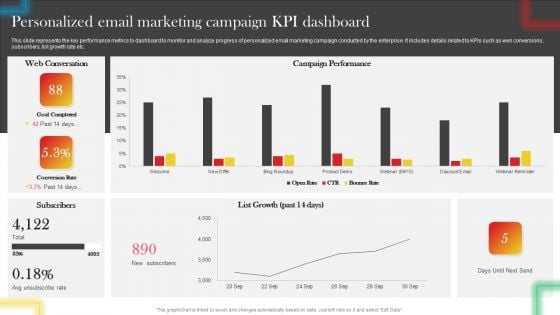
Personalized Email Marketing Campaign KPI Dashboard Inspiration PDF
This slide represents the key performance metrics to dashboard to monitor and analyze progress of personalized email marketing campaign conducted by the enterprise. It includes details related to KPIs such as wen conversions, subscribers, list growth rate etc. If your project calls for a presentation, then Slidegeeks is your go-to partner because we have professionally designed, easy-to-edit templates that are perfect for any presentation. After downloading, you can easily edit Personalized Email Marketing Campaign KPI Dashboard Inspiration PDF and make the changes accordingly. You can rearrange slides or fill them with different images. Check out all the handy templates
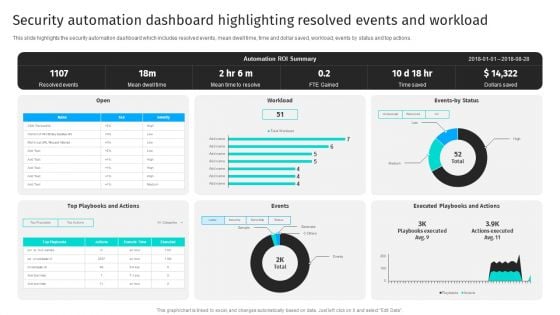
Security Automation Dashboard Highlighting Resolved Events And Workload Portrait PDF
This slide highlights the security automation dashboard which includes resolved events, mean dwell time, time and dollar saved, workload, events by status and top actions.From laying roadmaps to briefing everything in detail, our templates are perfect for you. You can set the stage with your presentation slides. All you have to do is download these easy-to-edit and customizable templates. Security Automation Dashboard Highlighting Resolved Events And Workload Portrait PDF will help you deliver an outstanding performance that everyone would remember and praise you for. Do download this presentation today.
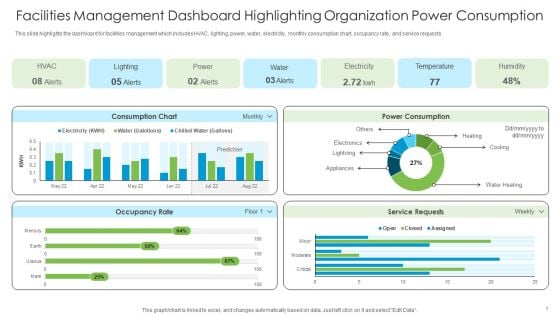
Facilities Management Dashboard Highlighting Organization Power Consumption Sample PDF
This slide highlights the dashboard for facilities management which includes HVAC, lighting, power, water, electricity, monthly consumption chart, occupancy rate, and service requests.From laying roadmaps to briefing everything in detail, our templates are perfect for you. You can set the stage with your presentation slides. All you have to do is download these easy-to-edit and customizable templates. Facilities Management Dashboard Highlighting Organization Power Consumption Sample PDF will help you deliver an outstanding performance that everyone would remember and praise you for. Do download this presentation today.

Health And Risk KPI Dashboard Ppt Pictures Designs Download PDF
The slide highlights the health and safety key performance indicator dashboard illustrating key headings which includes key objectives, inspections, total reports vs over due reports, injuries by body part and accident trends. Pitch your topic with ease and precision using this Health And Risk KPI Dashboard Ppt Pictures Designs Download PDF. This layout presents information on Key Objectives, Inspections, Accidents Trends. It is also available for immediate download and adjustment. So, changes can be made in the color, design, graphics or any other component to create a unique layout.
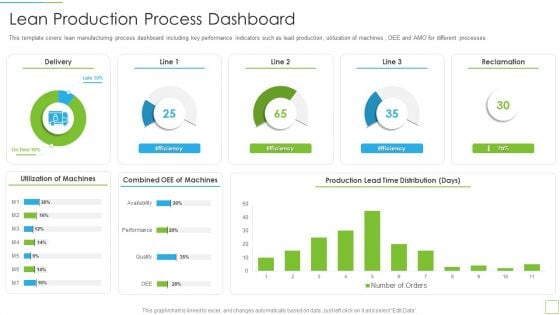
Hoshin Kanri Pitch Deck Lean Production Process Dashboard Guidelines PDF
This template covers lean manufacturing process dashboard including key performance indicators such as lead production, utilization of machines , OEE and AMO for different processes Deliver and pitch your topic in the best possible manner with this hoshin kanri pitch deck lean production process dashboard guidelines pdf Use them to share invaluable insights on utilization of machines, combined oee of machines, production lead time distribution and impress your audience. This template can be altered and modified as per your expectations. So, grab it now.
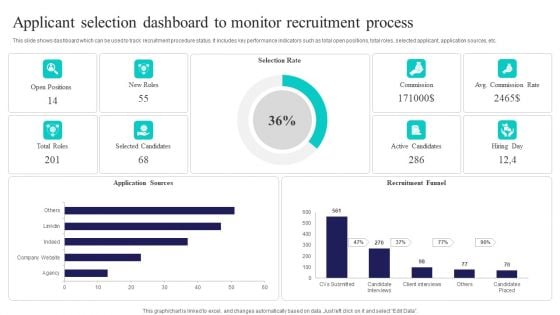
Applicant Selection Dashboard To Monitor Recruitment Process Sample PDF
This slide shows dashboard which can be used to track recruitment procedure status. It includes key performance indicators such as total open positions, total roles, selected applicant, application sources, etc. Pitch your topic with ease and precision using this Applicant Selection Dashboard To Monitor Recruitment Process Sample PDF. This layout presents information on Selection Rate, Recruitment Funnel, Application Sources. It is also available for immediate download and adjustment. So, changes can be made in the color, design, graphics or any other component to create a unique layout.
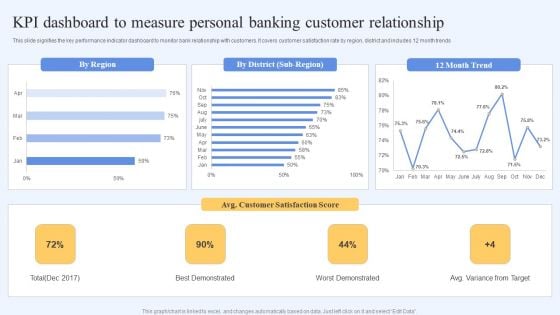
Kpi Dashboard To Measure Personal Banking Customer Relationship Themes PDF
This slide signifies the key performance indicator dashboard to monitor bank relationship with customers. It covers customer satisfaction rate by region, district and includes 12 month trends. Pitch your topic with ease and precision using this Kpi Dashboard To Measure Personal Banking Customer Relationship Themes PDF. This layout presents information on Customer Satisfaction, Best Demonstrated, Worst Demonstrated. It is also available for immediate download and adjustment. So, changes can be made in the color, design, graphics or any other component to create a unique layout.
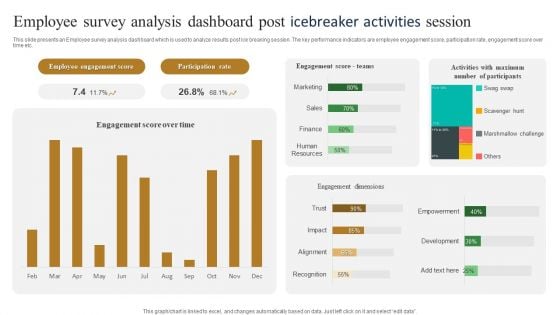
Employee Survey Analysis Dashboard Post Icebreaker Activities Session Slides PDF
This slide presents an Employee survey analysis dashboard which is used to analyze results post ice breaking session. The key performance indicators are employee engagement score, participation rate, engagement score over time etc. Pitch your topic with ease and precision using this Employee Survey Analysis Dashboard Post Icebreaker Activities Session Slides PDF. This layout presents information on Participation Rate, Employee Engagement Score. It is also available for immediate download and adjustment. So, changes can be made in the color, design, graphics or any other component to create a unique layout.
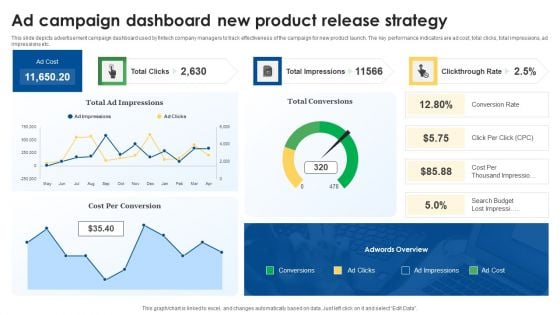
Ad Campaign Dashboard New Product Release Strategy Guidelines PDF
This slide depicts advertisement campaign dashboard used by fintech company managers to track effectiveness of the campaign for new product launch. The key performance indicators are ad cost, total clicks, total impressions, ad impressions etc. Pitch your topic with ease and precision using this Ad Campaign Dashboard New Product Release Strategy Guidelines PDF. This layout presents information on Impressions, Conversion, Strategy. It is also available for immediate download and adjustment. So, changes can be made in the color, design, graphics or any other component to create a unique layout.
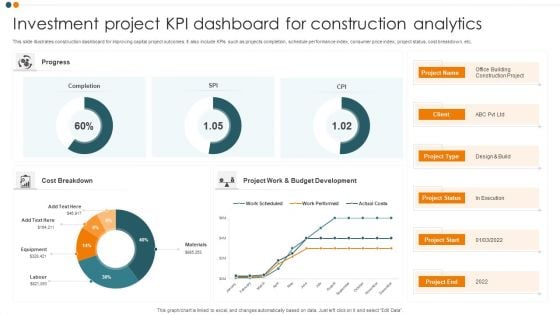
Investment Project KPI Dashboard For Construction Analytics Background PDF
This slide illustrates construction dashboard for improving capital project outcomes. It also include KPIs such as projects completion, schedule performance index, consumer price index, project status, cost breakdown, etc. Pitch your topic with ease and precision using this Investment Project KPI Dashboard For Construction Analytics Background PDF. This layout presents information on Cost Breakdown, Completion, Progress. It is also available for immediate download and adjustment. So, changes can be made in the color, design, graphics or any other component to create a unique layout.

Skill Enhancement Plan Dashboard For Training Program Evaluation Download PDF
This slide showcases dashboard that can help organization to evaluate the training program implemented in organization. Its key components are training cost, number of participants, hours of training, cost per participant and occupancy rate. From laying roadmaps to briefing everything in detail, our templates are perfect for you. You can set the stage with your presentation slides. All you have to do is download these easy-to-edit and customizable templates. Skill Enhancement Plan Dashboard For Training Program Evaluation Download PDF will help you deliver an outstanding performance that everyone would remember and praise you for. Do download this presentation today.
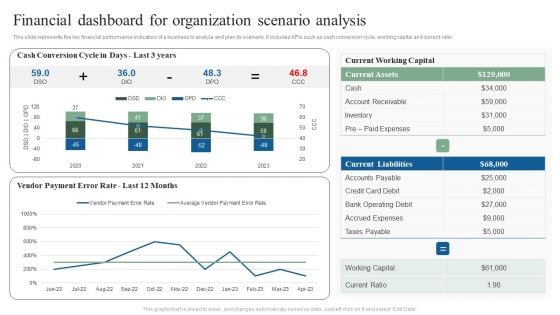
Financial Dashboard For Organization Scenario Analysis Ppt Show Ideas PDF
This slide represents the key financial performance indicators of a business to analyze and plan its scenario. It includes KPIs such as cash conversion cycle, working capital and current ratio. Showcasing this set of slides titled Financial Dashboard For Organization Scenario Analysis Ppt Show Ideas PDF. The topics addressed in these templates are Current Working Capital, Current Liabilities, Current Assets. All the content presented in this PPT design is completely editable. Download it and make adjustments in color, background, font etc. as per your unique business setting.
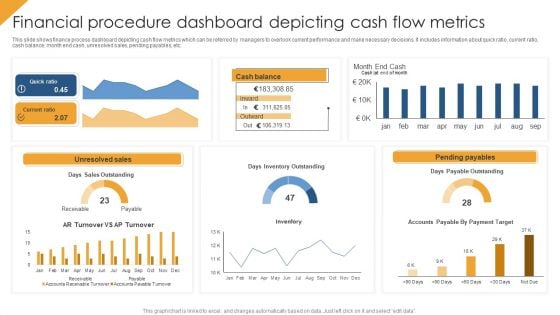
Financial Procedure Dashboard Depicting Cash Flow Metrics Structure PDF
This slide shows finance process dashboard depicting cash flow metrics which can be referred by managers to overlook current performance and make necessary decisions. It includes information about quick ratio, current ratio, cash balance, month end cash, unresolved sales, pending payables, etc. Pitch your topic with ease and precision using this Financial Procedure Dashboard Depicting Cash Flow Metrics Structure PDF. This layout presents information on Quick Ratio, Unresolved Sales, Pending Payables. It is also available for immediate download and adjustment. So, changes can be made in the color, design, graphics or any other component to create a unique layout.
Increasing Customer Kpi Dashboard For Tracking Customer Retention Download PDF
This slide covers the dashboard for analyzing customer loyalty with metrics such as NPS, loyal customer rate, premium users, CLV, customer churn, revenue churn, net retention, MRR growth, etc. From laying roadmaps to briefing everything in detail, our templates are perfect for you. You can set the stage with your presentation slides. All you have to do is download these easy-to-edit and customizable templates. Increasing Customer Kpi Dashboard For Tracking Customer Retention Download PDF will help you deliver an outstanding performance that everyone would remember and praise you for. Do download this presentation today.
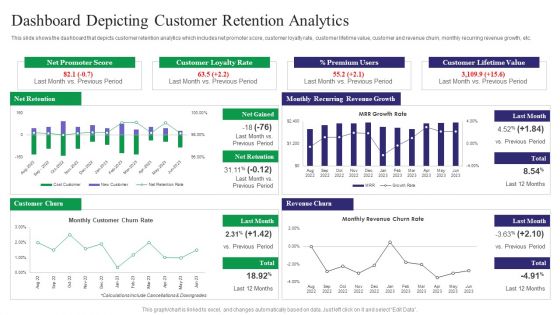
Reducing Customer Turnover Rates Dashboard Depicting Customer Retention Brochure PDF
This slide shows the dashboard that depicts customer retention analytics which includes net promoter score, customer loyalty rate, customer lifetime value, customer and revenue churn, monthly recurring revenue growth, etc. From laying roadmaps to briefing everything in detail, our templates are perfect for you. You can set the stage with your presentation slides. All you have to do is download these easy-to-edit and customizable templates. Reducing Customer Turnover Rates Dashboard Depicting Customer Retention Brochure PDF will help you deliver an outstanding performance that everyone would remember and praise you for. Do download this presentation today.
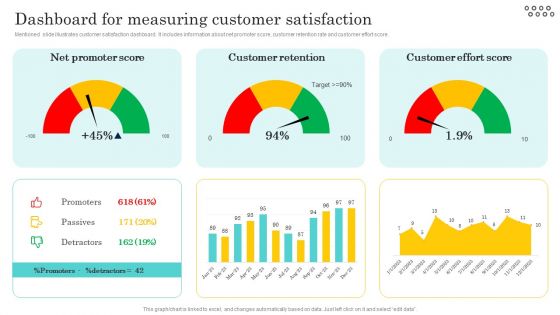
Optimizing And Managing Retail Dashboard For Measuring Customer Formats PDF
Mentioned slide illustrates customer satisfaction dashboard. It includes information about net promoter score, customer retention rate and customer effort score.. From laying roadmaps to briefing everything in detail, our templates are perfect for you. You can set the stage with your presentation slides. All you have to do is download these easy-to-edit and customizable templates. Optimizing And Managing Retail Dashboard For Measuring Customer Formats PDF will help you deliver an outstanding performance that everyone would remember and praise you for. Do download this presentation today.
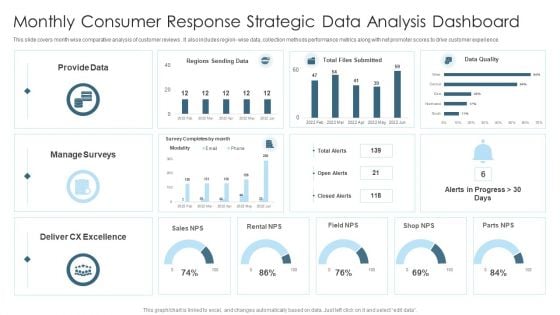
Monthly Consumer Response Strategic Data Analysis Dashboard Graphics PDF
This slide covers month wise comparative analysis of customer reviews . It also includes region wise data, collection methods performance metrics along with net promoter scores to drive customer experience. Showcasing this set of slides titled Monthly Consumer Response Strategic Data Analysis Dashboard Graphics PDF. The topics addressed in these templates are Provide Data, Sales, Manage Surveys. All the content presented in this PPT design is completely editable. Download it and make adjustments in color, background, font etc. as per your unique business setting.
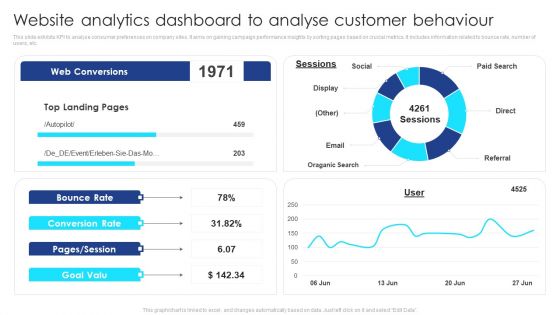
Website Analytics Dashboard To Analyse Customer Behaviour Themes PDF
This slide exhibits KPI to analyse consumer preferences on company sites. It aims on gaining campaign performance insights by sorting pages based on crucial metrics. It includes information related to bounce rate, number of users, etc. Showcasing this set of slides titled Website Analytics Dashboard To Analyse Customer Behaviour Themes PDF. The topics addressed in these templates are Social, Paid Search, Referral, Email, Oraganic Search. All the content presented in this PPT design is completely editable. Download it and make adjustments in color, background, font etc. as per your unique business setting.
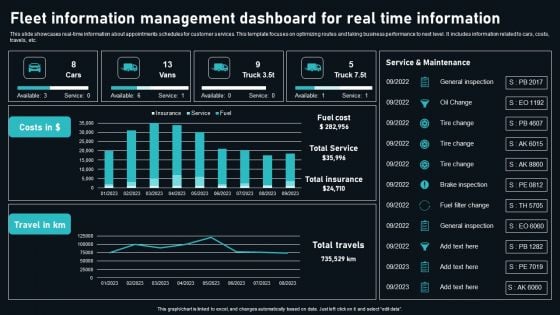
Fleet Information Management Dashboard For Real Time Information Graphics PDF
This slide showcases real time information about appointments schedules for customer services. This template focuses on optimizing routes and taking business performance to next level. It includes information related to cars, costs, travels, etc. Pitch your topic with ease and precision using this Fleet Information Management Dashboard For Real Time Information Graphics PDF. This layout presents information on General Inspection, Oil Change, Tire Change. It is also available for immediate download and adjustment. So, changes can be made in the color, design, graphics or any other component to create a unique layout.
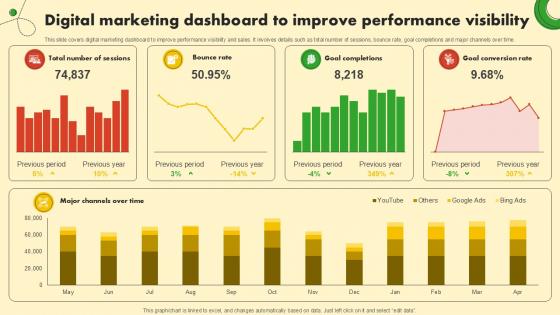
Digital Marketing Dashboard To Food And Grocery Retail Ppt Slide
This slide covers digital marketing dashboard to improve performance visibility and sales. It involves details such as total number of sessions, bounce rate, goal completions and major channels over time. Do you have an important presentation coming up Are you looking for something that will make your presentation stand out from the rest Look no further than Digital Marketing Dashboard To Food And Grocery Retail Ppt Slide. With our professional designs, you can trust that your presentation will pop and make delivering it a smooth process. And with Slidegeeks, you can trust that your presentation will be unique and memorable. So why wait Grab Digital Marketing Dashboard To Food And Grocery Retail Ppt Slide today and make your presentation stand out from the rest This slide covers digital marketing dashboard to improve performance visibility and sales. It involves details such as total number of sessions, bounce rate, goal completions and major channels over time.
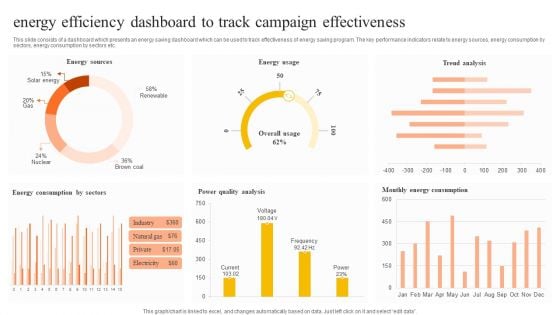
Energy Efficiency Dashboard To Track Campaign Effectiveness Pictures PDF
This slide consists of a dashboard which presents an energy saving dashboard which can be used to track effectiveness of energy saving program. The key performance indicators relate to energy sources, energy consumption by sectors, energy consumption by sectors etc. Pitch your topic with ease and precision using this Energy Efficiency Dashboard To Track Campaign Effectiveness Pictures PDF. This layout presents information on Energy Sources, Energy Usage, Trend Analysis. It is also available for immediate download and adjustment. So, changes can be made in the color, design, graphics or any other component to create a unique layout.
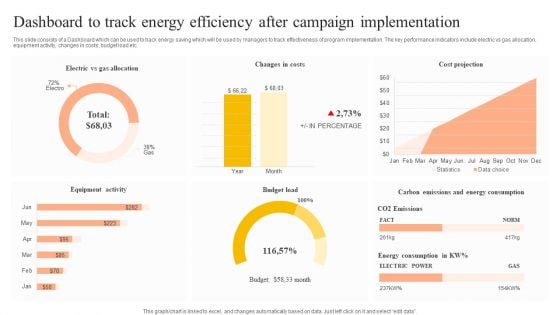
Dashboard To Track Energy Efficiency After Campaign Implementation Pictures PDF
This slide consists of a Dashboard which can be used to track energy saving which will be used by managers to track effectiveness of program implementation. The key performance indicators include electric vs gas allocation, equipment activity, changes in costs, budget load etc. Showcasing this set of slides titled Dashboard To Track Energy Efficiency After Campaign Implementation Pictures PDF. The topics addressed in these templates are Equipment Activity, Budget Load, Cost Projection. All the content presented in this PPT design is completely editable. Download it and make adjustments in color, background, font etc. as per your unique business setting.
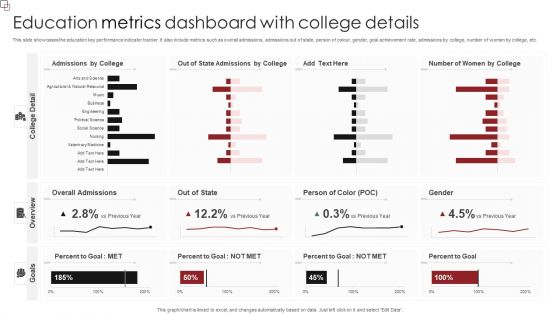
Education Metrics Dashboard With College Details Formats PDF
This slide showcases the education key performance indicator tracker. It also include metrics such as overall admissions, admissions out of state, person of colour, gender, goal achievement rate, admissions by college, number of women by college, etc. Pitch your topic with ease and precision using this Education Metrics Dashboard With College Details Formats PDF. This layout presents information on Overall Admissions, Person Of Color, Percent To Goal. It is also available for immediate download and adjustment. So, changes can be made in the color, design, graphics or any other component to create a unique layout.
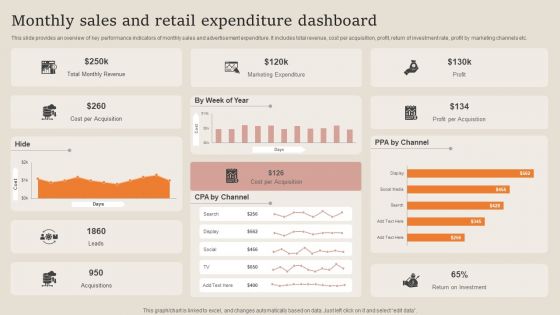
Monthly Sales And Retail Expenditure Dashboard Summary PDF
This slide provides an overview of key performance indicators of monthly sales and advertisement expenditure. It includes total revenue, cost per acquisition, profit, return of investment rate, profit by marketing channels etc. Pitch your topic with ease and precision using this Monthly Sales And Retail Expenditure Dashboard Summary PDF. This layout presents information on Marketing Expenditure, Revenue, Cost Per Acquisition. It is also available for immediate download and adjustment. So, changes can be made in the color, design, graphics or any other component to create a unique layout.
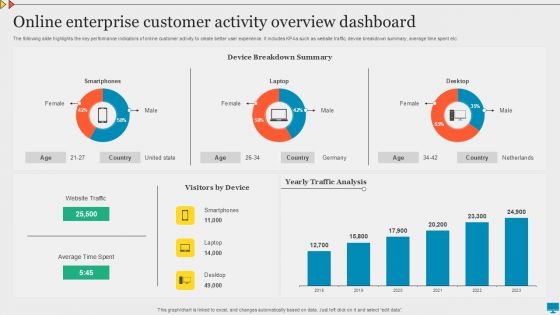
Online Enterprise Customer Activity Overview Dashboard Download PDF
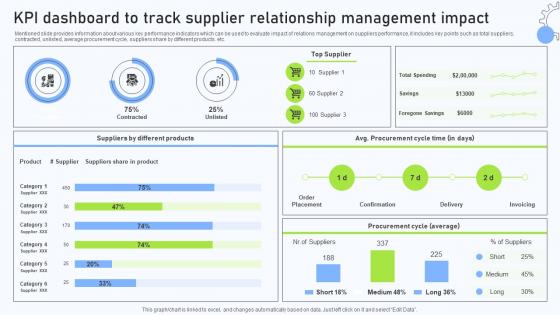
Relationship Management Automation KPI Dashboard To Track Supplier Relationship
Mentioned slide provides information about various key performance indicators which can be used to evaluate impact of relations management on suppliers performance, it includes key points such as total suppliers, contracted, unlisted, average procurement cycle, suppliers share by different products. etc. This Relationship Management Automation KPI Dashboard To Track Supplier Relationship is perfect for any presentation, be it in front of clients or colleagues. It is a versatile and stylish solution for organizing your meetings. The Relationship Management Automation KPI Dashboard To Track Supplier Relationship features a modern design for your presentation meetings. The adjustable and customizable slides provide unlimited possibilities for acing up your presentation. Slidegeeks has done all the homework before launching the product for you. So, do not wait, grab the presentation templates today Mentioned slide provides information about various key performance indicators which can be used to evaluate impact of relations management on suppliers performance, it includes key points such as total suppliers, contracted, unlisted, average procurement cycle, suppliers share by different products. etc.
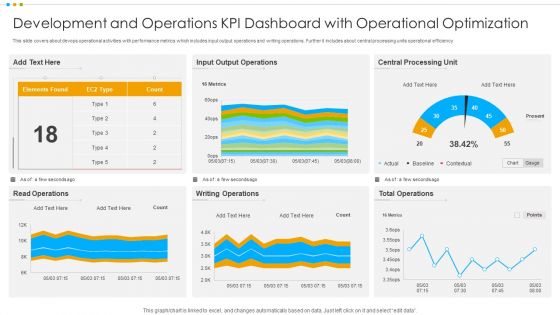
Development And Operations KPI Dashboard With Operational Optimization Pictures PDF
This slide covers about devops operational activities with performance metrics which includes input output operations and writing operations. Further it includes about central processing units operational efficiency.Pitch your topic with ease and precision using this Development And Operations KPI Dashboard With Operational Optimization Pictures PDF This layout presents information on Output Operations, Central Processing, Total Operations It is also available for immediate download and adjustment. So, changes can be made in the color, design, graphics or any other component to create a unique layout.
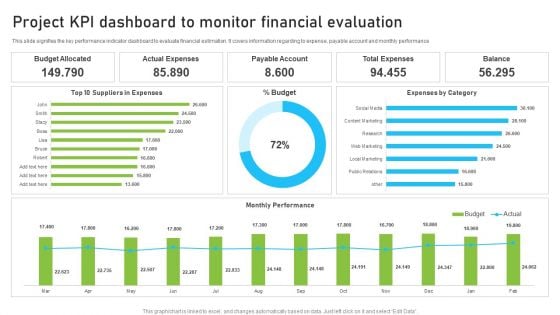
Project KPI Dashboard To Monitor Financial Evaluation Background PDF
This slide signifies the construction project management projection plan. It covers information regarding to the estimate ID, Task, effort hours, resource quantity, performance factor and duration evaluation. Pitch your topic with ease and precision using this Project KPI Dashboard To Monitor Financial Evaluation Background PDF. This layout presents information on Actual Expenses, Payable Account, Budget Allocated. It is also available for immediate download and adjustment. So, changes can be made in the color, design, graphics or any other component to create a unique layout.
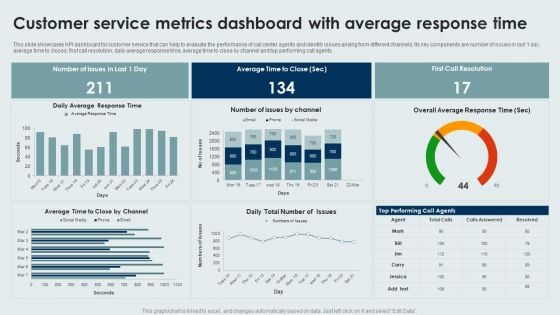
Customer Service Metrics Dashboard With Average Response Time Formats PDF
This slide showcases KPI dashboard for customer service that can help to evaluate the performance of call center agents and identify issues arising from different channels. Its key components are number of issues in last 1 day, average time to closes, first call resolution, daily average response time, average time to close by channel and top performing call agents. Pitch your topic with ease and precision using this Customer Service Metrics Dashboard With Average Response Time Formats PDF. This layout presents information on Customer Service, Metrics Dashboard, Average Response Time. It is also available for immediate download and adjustment. So, changes can be made in the color, design, graphics or any other component to create a unique layout.
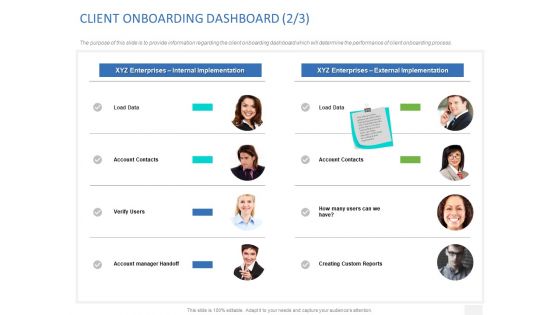
Organizational Socialization CLIENT ONBOARDING DASHBOARD Internal Ppt Ideas Maker PDF
The purpose of this slide is to provide information regarding the client onboarding dashboard which will determine the performance of client onboarding process. Presenting organizational socialization client onboarding dashboard internal ppt ideas maker pdf. to provide visual cues and insights. share and navigate important information on eight stages that need your due attention. this template can be used to pitch topics like verify users, account contacts, account manager handoff, creating custom reports. in addtion, this ppt design contains high resolution images, graphics, etc, that are easily editable and available for immediate download of the user.
KPI Dashboard For Tracking Project Summary Ppt Status Themes PDF
This slide brings forth dashboard which assists project managers in tracking the status of projects . The key performance indicators are project title, tag, responsibility, date assigned, project team, progress, deadline and status. Persuade your audience using this KPI Dashboard For Tracking Project Summary Ppt Status Themes PDF. This PPT design covers one stages, thus making it a great tool to use. It also caters to a variety of topics including Project Title, Responsibility, Date Assigned. Download this PPT design now to present a convincing pitch that not only emphasizes the topic but also showcases your presentation skills.
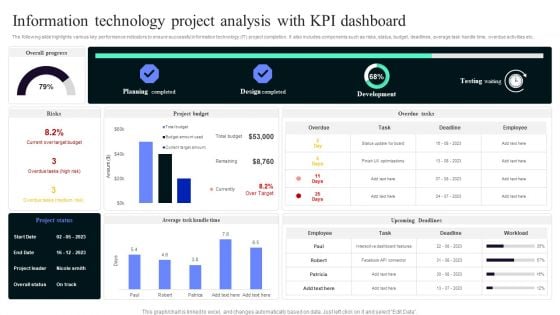
Information Technology Project Analysis With Kpi Dashboard Portrait PDF
The following slide highlights various key performance indicators to ensure successful information technology IT project completion. It also includes components such as risks, status, budget, deadlines, average task handle time, overdue activities etc. Pitch your topic with ease and precision using this Information Technology Project Analysis With Kpi Dashboard Portrait PDF. This layout presents information on Planning Completed, Design Completed, Development . It is also available for immediate download and adjustment. So, changes can be made in the color, design, graphics or any other component to create a unique layout.
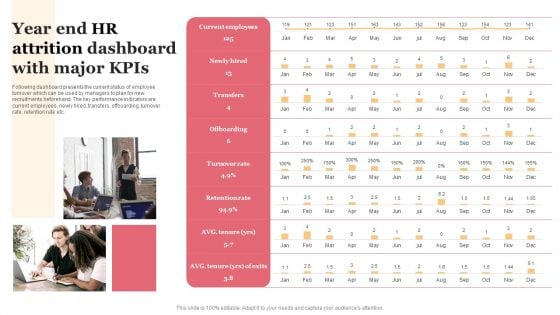
Year End HR Attrition Dashboard With Major Kpis Demonstration PDF
Following dashboard presents the current status of employee turnover which can be used by managers to plan for new recruitments beforehand. The key performance indicators are current employees, newly hired, transfers, offboarding, turnover rate, retention rate etc. Persuade your audience using this Year End HR Attrition Dashboard With Major Kpis Demonstration PDF. This PPT design covers one stages, thus making it a great tool to use. It also caters to a variety of topics including Retention Rate, Turnover Rate, Offboarding. Download this PPT design now to present a convincing pitch that not only emphasizes the topic but also showcases your presentation skills.
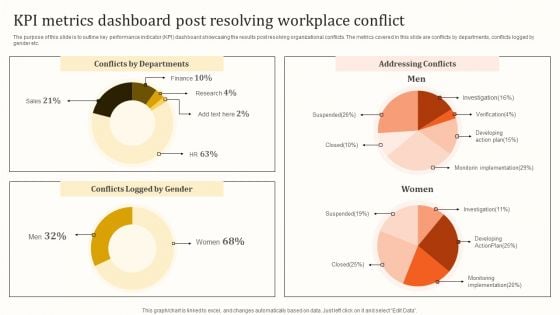
KPI Metrics Dashboard Post Resolving Workplace Conflict Template PDF
The purpose of this slide is to outline key performance indicator KPI dashboard showcasing the results post resolving organizational conflicts. The metrics covered in this slide are conflicts by departments, conflicts logged by gender etc. Presenting this PowerPoint presentation, titled KPI Metrics Dashboard Post Resolving Workplace Conflict Template PDF, with topics curated by our researchers after extensive research. This editable presentation is available for immediate download and provides attractive features when used. Download now and captivate your audience. Presenting this KPI Metrics Dashboard Post Resolving Workplace Conflict Template PDF. Our researchers have carefully researched and created these slides with all aspects taken into consideration. This is a completely customizable KPI Metrics Dashboard Post Resolving Workplace Conflict Template PDF that is available for immediate downloading. Download now and make an impact on your audience. Highlight the attractive features available with our PPTs.
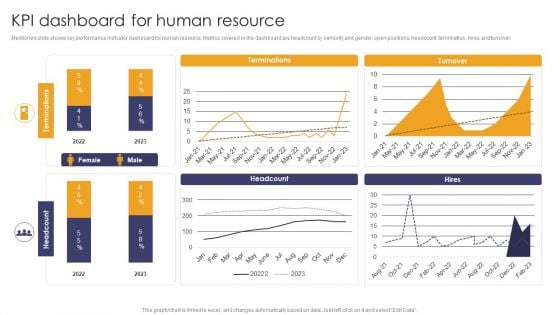
Implementing Succession Planning KPI Dashboard For Human Resource Template PDF
Mentioned slide shows key performance indicator dashboard for human resource. Metrics covered in the dashboard are headcount by seniority and gender, open positions, headcount, termination, hires and turnover. If you are looking for a format to display your unique thoughts, then the professionally designed Implementing Succession Planning KPI Dashboard For Human Resource Template PDF is the one for you. You can use it as a Google Slides template or a PowerPoint template. Incorporate impressive visuals, symbols, images, and other charts. Modify or reorganize the text boxes as you desire. Experiment with shade schemes and font pairings. Alter, share or cooperate with other people on your work. Download Implementing Succession Planning KPI Dashboard For Human Resource Template PDF and find out how to give a successful presentation. Present a perfect display to your team and make your presentation unforgettable.

Internal Employee Succession KPI Dashboard For Human Resource Information PDF
Mentioned slide shows key performance indicator dashboard for human resource. Metrics covered in the dashboard are headcount by seniority and gender, open positions, headcount, termination, hires and turnover. If you are looking for a format to display your unique thoughts, then the professionally designed Internal Employee Succession KPI Dashboard For Human Resource Information PDF is the one for you. You can use it as a Google Slides template or a PowerPoint template. Incorporate impressive visuals, symbols, images, and other charts. Modify or reorganize the text boxes as you desire. Experiment with shade schemes and font pairings. Alter, share or cooperate with other people on your work. Download Internal Employee Succession KPI Dashboard For Human Resource Information PDF and find out how to give a successful presentation. Present a perfect display to your team and make your presentation unforgettable.
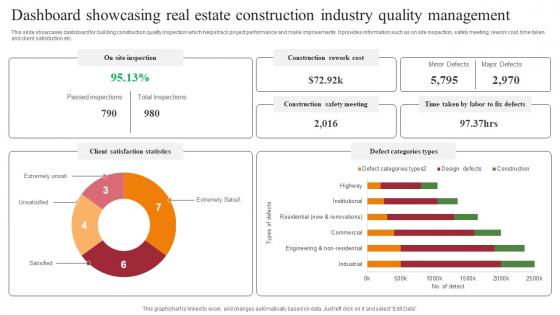
Dashboard Showcasing Real Estate Construction Industry Quality Management Topics Pdf
This slide showcases dashboard for building construction quality inspection which helps track project performance and make improvements. It provides information such as on site inspection, safety meeting, rework cost, time taken and client satisfaction etc. Pitch your topic with ease and precision using this Dashboard Showcasing Real Estate Construction Industry Quality Management Topics Pdf. This layout presents information on Client Satisfaction Statistics, Defect Categories Types. It is also available for immediate download and adjustment. So, changes can be made in the color, design, graphics or any other component to create a unique layout. This slide showcases dashboard for building construction quality inspection which helps track project performance and make improvements. It provides information such as on site inspection, safety meeting, rework cost, time taken and client satisfaction etc.
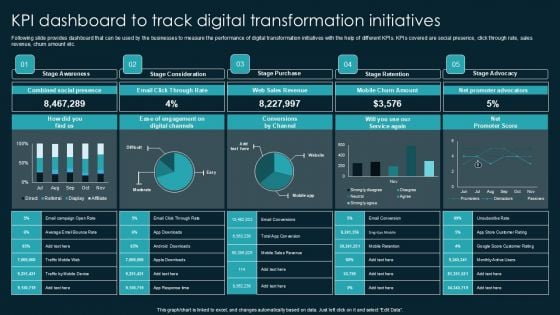
Kpi Dashboard To Track Digital Transformation Initiatives Formats PDF
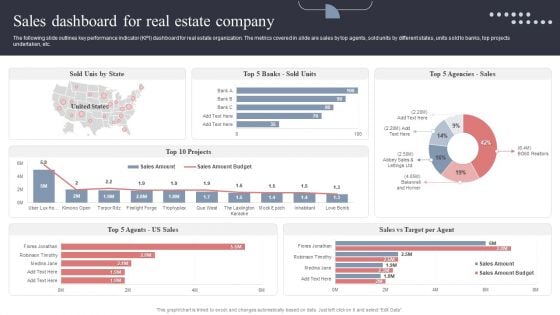
Sales Dashboard For Real Estate Company Topics PDF
The following slide outlines key performance indicator KPI dashboard for real estate organization. The metrics covered in slide are sales by top agents, sold units by different states, units sold to banks, top projects undertaken, etc. This Sales Dashboard For Real Estate Company Topics PDF is perfect for any presentation, be it in front of clients or colleagues. It is a versatile and stylish solution for organizing your meetings. The Sales Dashboard For Real Estate Company Topics PDF features a modern design for your presentation meetings. The adjustable and customizable slides provide unlimited possibilities for acing up your presentation. Slidegeeks has done all the homework before launching the product for you. So, do not wait, grab the presentation templates today


 Continue with Email

 Home
Home


