Business Performance Dashboard
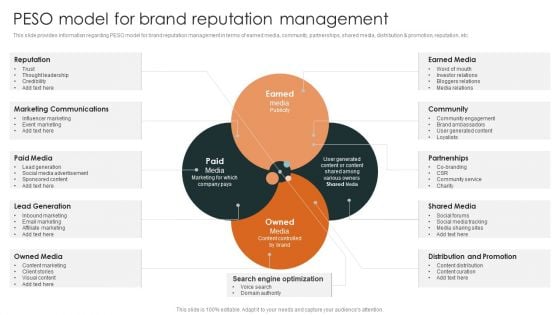
Effective Brand Reputation Management Peso Model For Brand Reputation Management Clipart PDF
This slide provides information regarding monitoring dashboard to track brand performance through monitoring of session, new users, bounce rate, etc. Find highly impressive Effective Brand Reputation Management Peso Model For Brand Reputation Management Clipart PDF on Slidegeeks to deliver a meaningful presentation. You can save an ample amount of time using these presentation templates. No need to worry to prepare everything from scratch because Slidegeeks experts have already done a huge research and work for you. You need to download Effective Brand Reputation Management Peso Model For Brand Reputation Management Clipart PDF for your upcoming presentation. All the presentation templates are 100 precent editable and you can change the color and personalize the content accordingly. Download now.
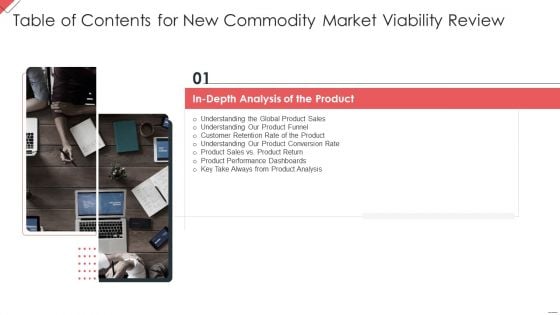
Table Of Contents For New Commodity Market Viability Review Slide Ideas PDF
This is a Table Of Contents For New Commodity Market Viability Review Slide Ideas PDF template with various stages. Focus and dispense information on one stage using this creative set, that comes with editable features. It contains large content boxes to add your information on topics like Customer Retention, Understanding Product, Performance Dashboards You can also showcase facts, figures, and other relevant content using this PPT layout. Grab it now.
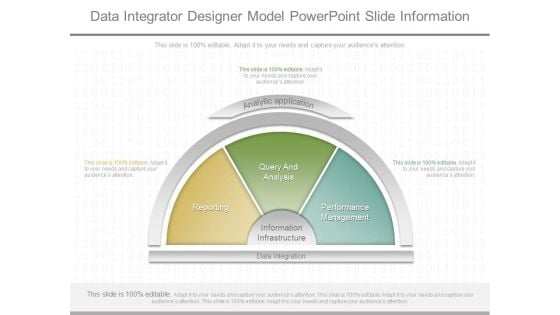
Data Integrator Designer Model Powerpoint Slide Information
This is a data integrator designer model powerpoint slide information. This is a three stage process. The stages in this process are reporting, query and analysis, performance management, analytic application, information infrastructure.
Comparative Analysis Of Traditional And Scrum Kpis Ppt Icon Designs Download PDF
This slide illustrates comparison of traditional and agile scrum measures. It includes parameters like cost, schedule, performance and quality. Showcasing this set of slides titled Comparative Analysis Of Traditional And Scrum Kpis Ppt Icon Designs Download PDF. The topics addressed in these templates are Cost, Performance, Quality. All the content presented in this PPT design is completely editable. Download it and make adjustments in color, background, font etc. as per your unique business setting.
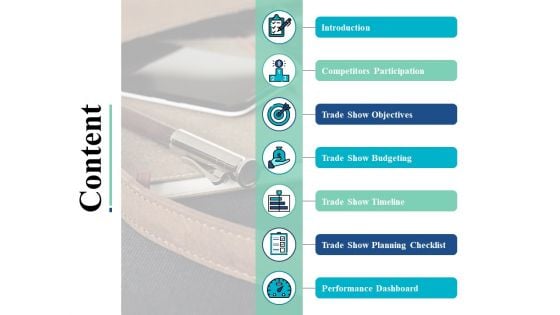
Content Introduction Ppt PowerPoint Presentation Infographic Template Design Templates
This is a content introduction ppt powerpoint presentation infographic template design templates. This is a seven stage process. The stages in this process are introduction, performance dashboard, competitors participation, trade show budgeting, marketing.

Content Introduction Ppt PowerPoint Presentation Infographic Template Skills
This is a content introduction ppt powerpoint presentation infographic template skills. This is a seven stage process. The stages in this process are introduction, performance dashboard, competitors participation, trade show budgeting, marketing.

Project And Change Management Powerpoint Ideas
This is a project and change management powerpoint ideas. This is a seven stage process. The stages in this process are process visualization, project and change management, procedure quality management, performance metric system, scorecards and dashboards, process mapping, process simulation.
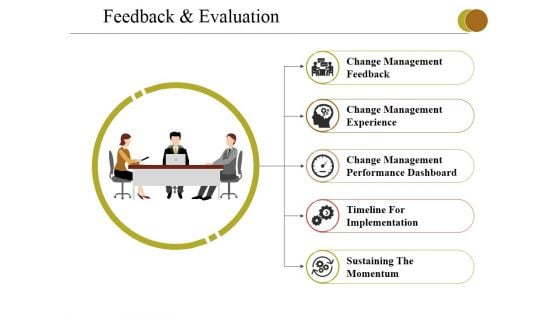
Feedback And Evaluation Ppt PowerPoint Presentation Slides Graphics Example
This is a feedback and evaluation ppt powerpoint presentation slides graphics example. This is a five stage process. The stages in this process are change management feedback, change management experience, change management performance dashboard, timeline for implementation, sustaining the momentum.
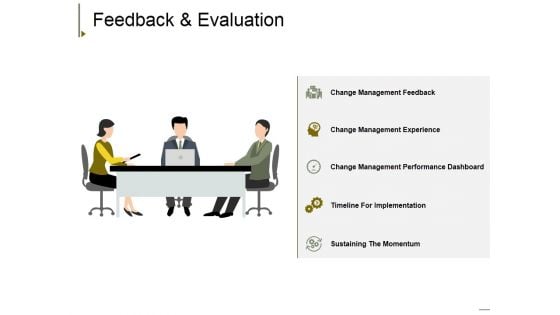
Feedback And Evaluation Ppt PowerPoint Presentation File Aids
This is a feedback and evaluation ppt powerpoint presentation file aids. This is a five stage process. The stages in this process are change management feedback , change management experience, change management performance dashboard, timeline for implementation, sustaining the momentum.
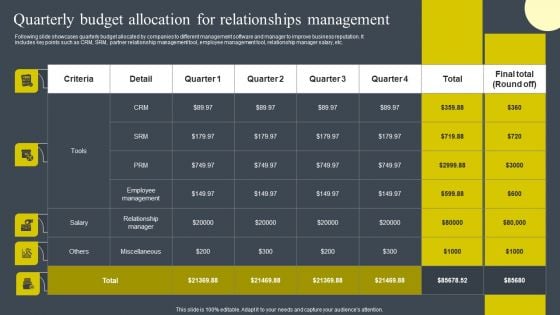
Quarterly Budget Allocation For Relationships Management Clipart PDF
Mentioned slide demonstrates impact of customer management solutions on business key performance indicators. It includes key performance indicators such as customer retention, loyal customer base, customer abandonment rate, customer satisfaction, etc. There are so many reasons you need a Quarterly Budget Allocation For Relationships Management Clipart PDF. The first reason is you can not spend time making everything from scratch, Thus, Slidegeeks has made presentation templates for you too. You can easily download these templates from our website easily.
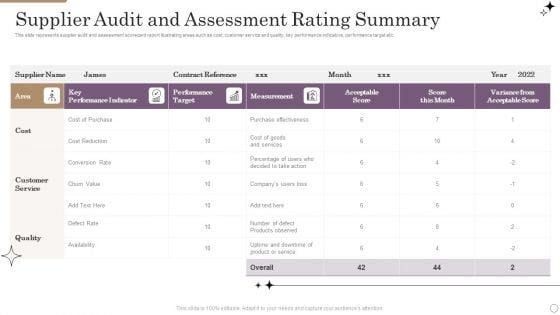
Supplier Audit And Assessment Rating Summary Background PDF
This slide represents supplier audit and assessment scorecard report illustrating areas such as cost, customer service and quality, key performance indicators, performance target etc. Showcasing this set of slides titled Supplier Audit And Assessment Rating Summary Background PDF. The topics addressed in these templates are Customer Service, Quality, Cost. All the content presented in this PPT design is completely editable. Download it and make adjustments in color, background, font etc. as per your unique business setting.
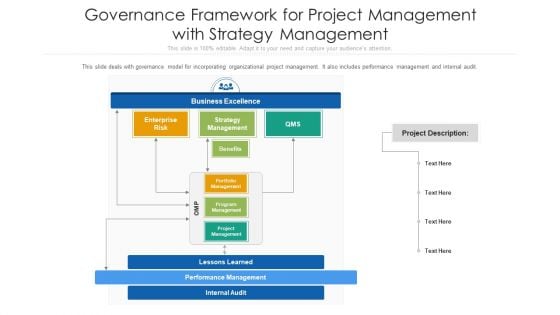
Governance Framework For Project Management With Strategy Management Ppt Infographics Aids PDF
This slide deals with governance model for incorporating organizational project management. It also includes performance management and internal audit. Deliver and pitch your topic in the best possible manner with this governance framework for project management with strategy management ppt infographics aids pdf. Use them to share invaluable insights on strategy management, enterprise risk, business excellence, performance management and impress your audience. This template can be altered and modified as per your expectations. So, grab it now.
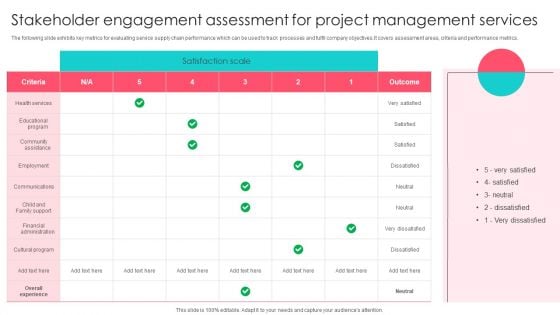
Stakeholder Engagement Assessment For Project Management Services Graphics PDF
The following slide exhibits key metrics for evaluating service supply chain performance which can be used to track processes and fulfil company objectives.It covers assessment areas, criteria and performance metrics. Showcasing this set of slides titled Stakeholder Engagement Assessment For Project Management Services Graphics PDF. The topics addressed in these templates are Communications, Financial Administration, Employment. All the content presented in this PPT design is completely editable. Download it and make adjustments in color, background, font etc. as per your unique business setting.
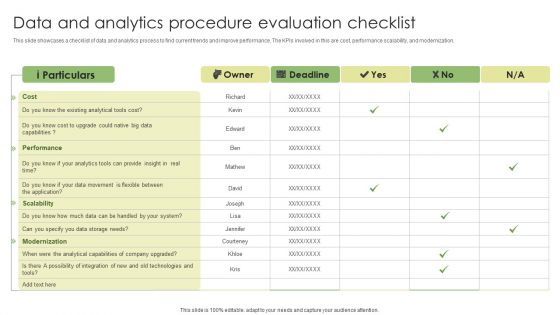
Data And Analytics Procedure Evaluation Checklist Infographics PDF
This slide showcases a checklist of data and analytics process to find current trends and improve performance. The KPIs involved in this are cost, performance scalability, and modernization. Pitch your topic with ease and precision using this Data And Analytics Procedure Evaluation Checklist Infographics PDF. This layout presents information on Particulars, Owner, Deadline. It is also available for immediate download and adjustment. So, changes can be made in the color, design, graphics or any other component to create a unique layout.
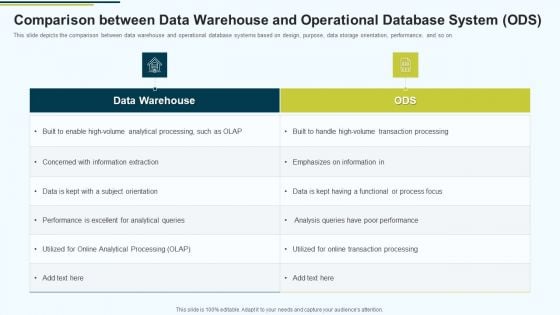
MIS Comparison Between Data Warehouse And Operational Database System ODS Ppt PowerPoint Presentation Show Images PDF
This slide depicts the comparison between data warehouse and operational database systems based on design, purpose, data storage orientation, performance, and so on.Deliver an awe inspiring pitch with this creative MIS Comparison Between Data Warehouse And Operational Database System ODS Ppt PowerPoint Presentation Show Images PDF bundle. Topics like Concerned With Information, Performance Is Excellent, Analytical Processing can be discussed with this completely editable template. It is available for immediate download depending on the needs and requirements of the user.
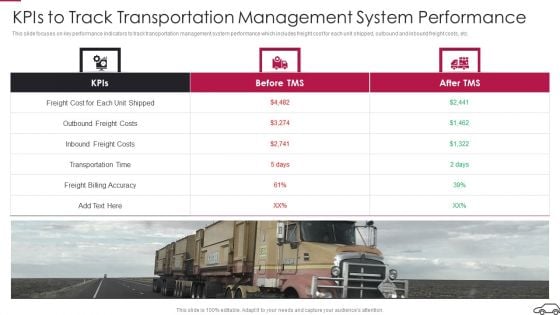
Continual Improvement Procedure In Supply Chain Kpis To Track Transportation Management Infographics PDF
This slide focuses on key performance indicators to track transportation management system performance which includes freight cost for each unit shipped, outbound and inbound freight costs, etc.Deliver and pitch your topic in the best possible manner with this Continual Improvement Procedure In Supply Chain Kpis To Track Transportation Management Infographics PDF. Use them to share invaluable insights on Outbound Freight, Transportation Time, Billing Accuracy and impress your audience. This template can be altered and modified as per your expectations. So, grab it now.
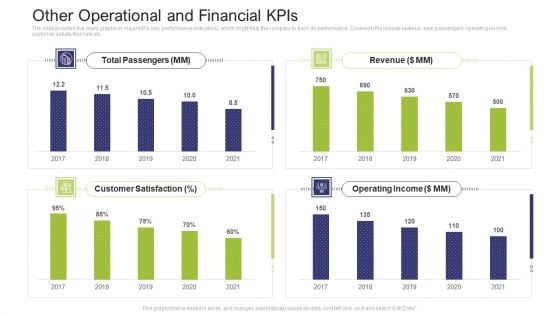
Other Operational And Financial Kpis Inspiration PDF
The slide provides five years graphs of major KPIs key performance indicators, which might help the company to track its performance. Covered KPIs include revenue, total passengers, operating income, customer satisfaction rate etc.Deliver an awe-inspiring pitch with this creative other operational and financial KPIs inspiration pdf. bundle. Topics like total passengers, operating income, revenue, 2017 to 2021 can be discussed with this completely editable template. It is available for immediate download depending on the needs and requirements of the user.
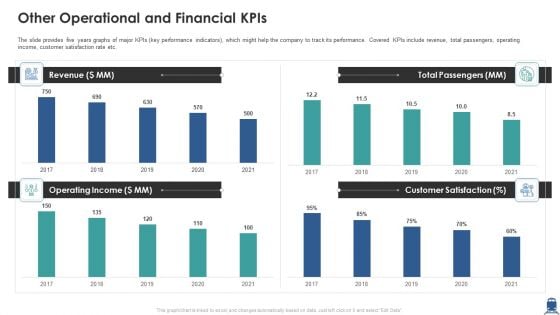
Other Operational And Financial Kpis Information PDF
The slide provides five years graphs of major KPIs key performance indicators, which might help the company to track its performance. Covered KPIs include revenue, total passengers, operating income, customer satisfaction rate etc. Deliver an awe inspiring pitch with this creative other operational and financial kpis information pdf bundle. Topics like revenue, operating income, customer satisfaction can be discussed with this completely editable template. It is available for immediate download depending on the needs and requirements of the user.
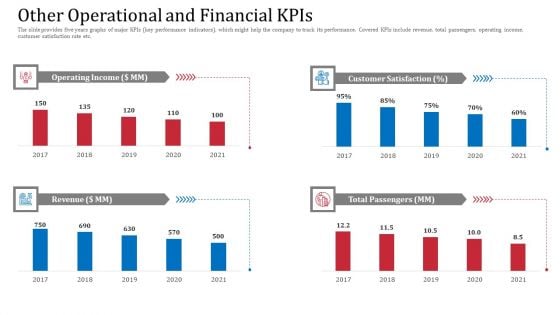
Other Operational And Financial Kpis Demonstration PDF
The slide provides five years graphs of major KPIs key performance indicators, which might help the company to track its performance. Covered KPIs include revenue, total passengers, operating income, customer satisfaction rate etc.Deliver and pitch your topic in the best possible manner with this other operational and financial kpis demonstration pdf. Use them to share invaluable insights on customer satisfaction, operating income, total passengers and impress your audience. This template can be altered and modified as per your expectations. So, grab it now.

Data Analysis Types Provides By BI Mockup Pdf
This slide represents the type of analytics provided by the business intelligence for business performance enhancement. This includes descriptive analysis, diagnostic analysis, predictive analytics, etc. Pitch your topic with ease and precision using this Data Analysis Types Provides By BI Mockup Pdf. This layout presents information on Descriptive Analytics, Diagnostic Analytics, Predictive Analytics. It is also available for immediate download and adjustment. So, changes can be made in the color, design, graphics or any other component to create a unique layout. This slide represents the type of analytics provided by the business intelligence for business performance enhancement. This includes descriptive analysis, diagnostic analysis, predictive analytics, etc.
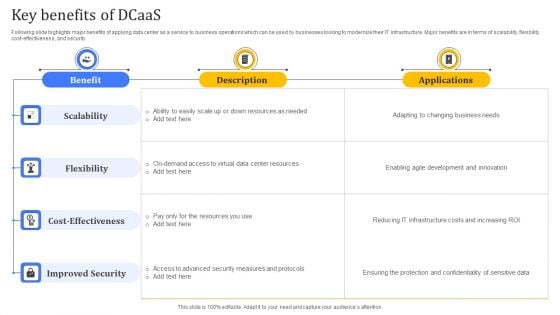
Key Benefits Of Dcaas Diagrams PDF
This slide depicts a dashboard which can be used to monitor the key performing indicators related to data center as a service model. The key performing indicators are items by status, counts by model attributes, item count by customer type, physical vs virtual system Showcasing this set of slides titled Key Benefits Of Dcaas Diagrams PDF. The topics addressed in these templates are Scalability, Flexibility, Cost Effectiveness, Improved Security. All the content presented in this PPT design is completely editable. Download it and make adjustments in color, background, font etc. as per your unique business setting.
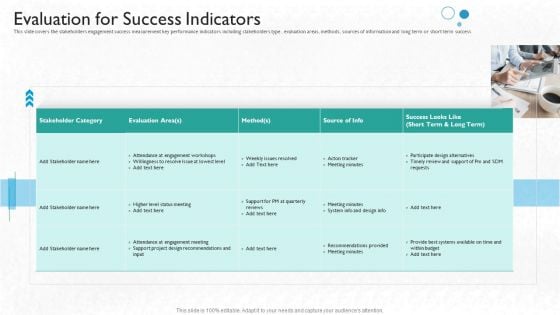
Partner Engagement Planning Procedure Evaluation For Success Indicators Mockup PDF
This slide covers the stakeholders engagement success measurement key performance indicators including stakeholders type, evaluation areas, methods, sources of information and long term or short term success. Deliver an awe-inspiring pitch with this creative partner engagement planning procedure evaluation for success indicators mockup pdf bundle. Topics like evaluation area, success, measurement, stakeholders, key performance can be discussed with this completely editable template. It is available for immediate download depending on the needs and requirements of the user.
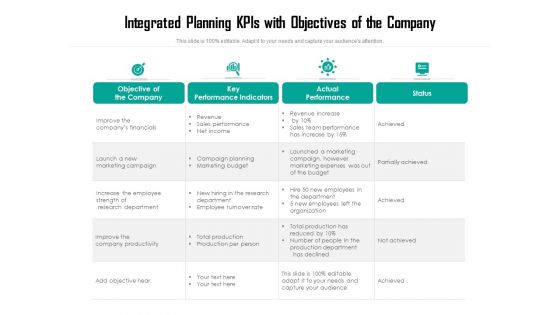
Integrated Planning Kpis With Objectives Of The Company Ppt PowerPoint Presentation Gallery Backgrounds PDF
Pitch your topic with ease and precision using this integrated planning kpis with objectives of the company ppt powerpoint presentation gallery backgrounds pdf. This layout presents information on actual performance, key performance indicators, objective of the company. It is also available for immediate download and adjustment. So, changes can be made in the color, design, graphics or any other component to create a unique layout.
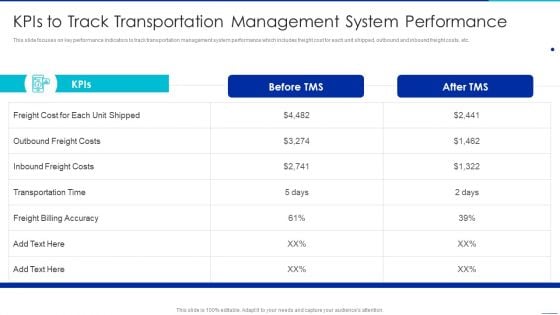
Optimizing Logistics Management Process Kpis To Track Transportation Management System Portrait PDF
This slide focuses on key performance indicators to track transportation management system performance which includes freight cost for each unit shipped, outbound and inbound freight costs, etc. Deliver an awe inspiring pitch with this creative optimizing logistics management process kpis to track transportation management system portrait pdf bundle. Topics like transportation time, billing accuracy, inbound freight costs can be discussed with this completely editable template. It is available for immediate download depending on the needs and requirements of the user.
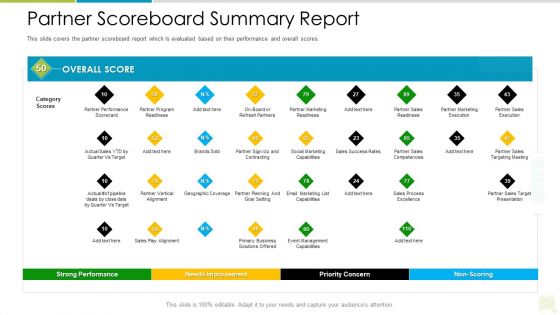
Distributor Entitlement Initiatives Partner Scoreboard Summary Report Infographics PDF
This slide covers the partner scoreboard report which Is evaluated based on their performance and overall scores. Deliver and pitch your topic in the best possible manner with this distributor entitlement initiatives partner scoreboard summary report infographics pdf. Use them to share invaluable insights on performance, marketing, sales, capabilities, target and impress your audience. This template can be altered and modified as per your expectations. So, grab it now.
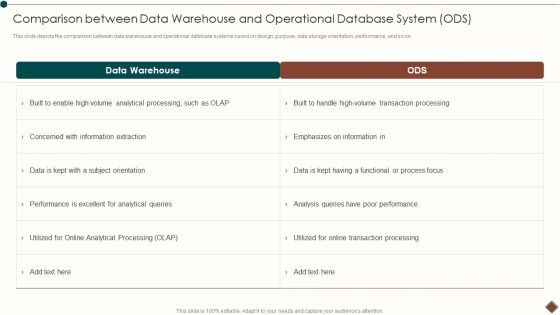
Comparison Between Data Warehouse And Operational Database System ODS Infographics PDF
This slide depicts the comparison between data warehouse and operational database systems based on design, purpose, data storage orientation, performance, and so on.Deliver and pitch your topic in the best possible manner with this Comparison Between Data Warehouse And Operational Database System ODS Infographics PDF. Use them to share invaluable insights on Concerned Information, Analytical Processing, Poor Performance and impress your audience. This template can be altered and modified as per your expectations. So, grab it now.
Indirect Channel Marketing Initiatives Partner Scoreboard Summary Report Icons PDF
This slide covers the partner scoreboard report which Is evaluated based on their performance and overall scores. Deliver and pitch your topic in the best possible manner with this indirect channel marketing initiatives partner scoreboard summary report icons pdf. Use them to share invaluable insights on performance, marketing, sales, capabilities, target and impress your audience. This template can be altered and modified as per your expectations. So, grab it now.
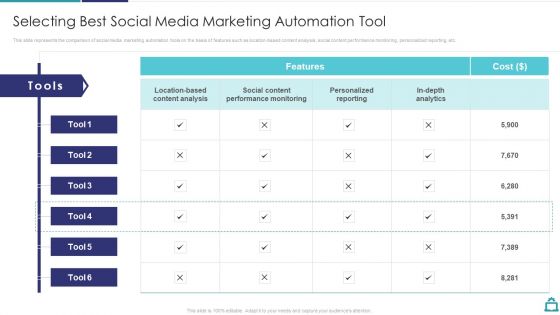
Deploying B2C Social Media Selecting Best Social Media Marketing Automation Tool Infographics PDF
This slide represents the comparison of social media marketing automation tools on the basis of features such as location-based content analysis, social content performance monitoring, personalized reporting, etc.Deliver an awe inspiring pitch with this creative Deploying B2C Social Media Selecting Best Social Media Marketing Automation Tool Infographics PDF bundle. Topics like Social Content, Performance Monitoring, Personalized Reporting can be discussed with this completely editable template. It is available for immediate download depending on the needs and requirements of the user.
Social Network Playbook Social Media Kpi Analytics Measurement Ppt Icon Demonstration PDF
This template covers key performance indicator KPI to determine the performance against the company objectives. These Social media KPIs would be focusing on social engagements, content reach, purchase leads and conversions. Deliver an awe inspiring pitch with this creative social network playbook social media kpi analytics measurement ppt icon demonstration pdf bundle. Topics like social media kpi analytics measurement can be discussed with this completely editable template. It is available for immediate download depending on the needs and requirements of the user.

Sales Facilitation Partner Management Partner Scoreboard Summary Report Clipart PDF
This slide covers the partner scoreboard report which Is evaluated based on their performance and overall scores. Deliver and pitch your topic in the best possible manner with this sales facilitation partner management partner scoreboard summary report clipart pdf. Use them to share invaluable insights on performance, marketing, sales, capabilities, target and impress your audience. This template can be altered and modified as per your expectations. So, grab it now.
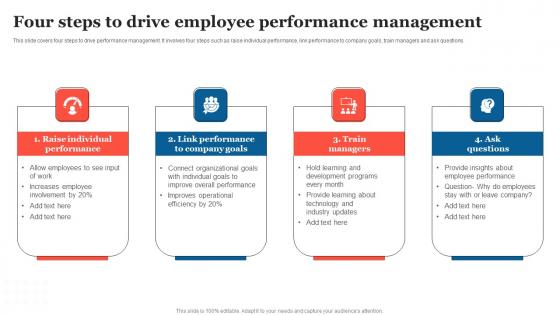
Four Steps To Drive Employee Strategic Measures To Boost Employee Efficienc Infographics Pdf
This slide covers four steps to drive performance management. It involves four steps such as raise individual performance, link performance to company goals, train managers and ask questions. Do you know about Slidesgeeks Four Steps To Drive Employee Strategic Measures To Boost Employee Efficienc Infographics Pdf These are perfect for delivering any kind od presentation. Using it, create PowerPoint presentations that communicate your ideas and engage audiences. Save time and effort by using our pre designed presentation templates that are perfect for a wide range of topic. Our vast selection of designs covers a range of styles, from creative to business, and are all highly customizable and easy to edit. Download as a PowerPoint template or use them as Google Slides themes. This slide covers four steps to drive performance management. It involves four steps such as raise individual performance, link performance to company goals, train managers and ask questions.
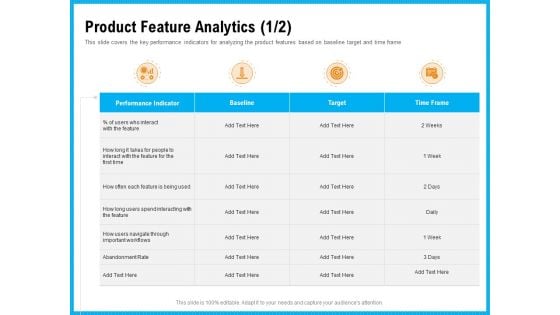
Requirement Gathering Techniques Product Feature Analytics Baseline Sample PDF
This slide covers the key performance indicators for analyzing the product features based on baseline target and time frame. Deliver and pitch your topic in the best possible manner with this requirement gathering techniques product feature analytics baseline sample pdf. Use them to share invaluable insights on performance indicator, baseline, target, time frame and impress your audience. This template can be altered and modified as per your expectations. So, grab it now.
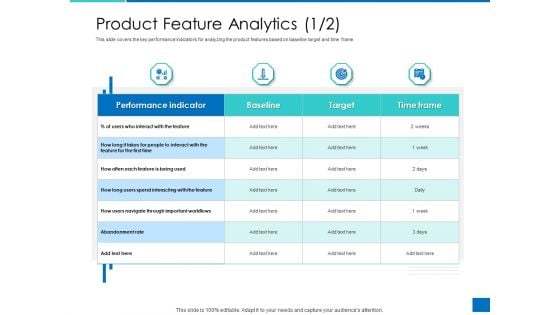
Analyzing Requirement Management Process Product Feature Analytics Baseline Clipart PDF
This slide covers the key performance indicators for analyzing the product features based on baseline target and time frame. Deliver and pitch your topic in the best possible manner with this analyzing requirement management process product feature analytics baseline clipart pdf. Use them to share invaluable insights on performance indicator, baseline, target, time frame and impress your audience. This template can be altered and modified as per your expectations. So, grab it now.
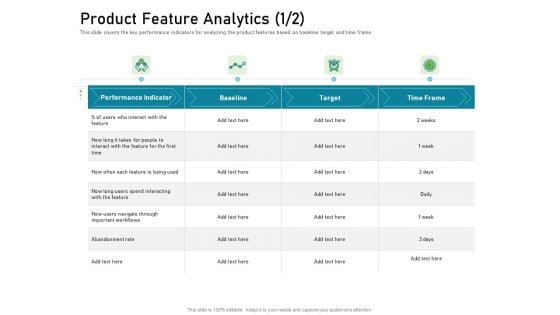
Requirements Governance Plan Product Feature Analytics Rate Microsoft PDF
This slide covers the key performance indicators for analyzing the product features based on baseline target and time frame. Deliver an awe-inspiring pitch with this creative requirements governance plan product feature analytics rate microsoft pdf bundle. Topics like performance indicator, target, time frame can be discussed with this completely editable template. It is available for immediate download depending on the needs and requirements of the user.
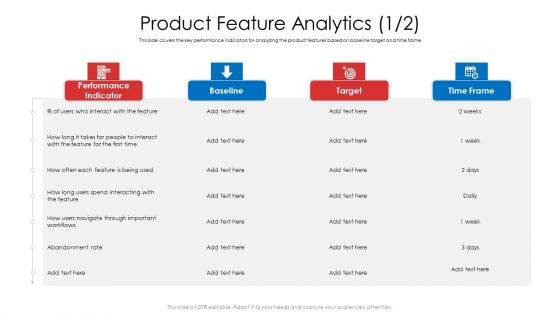
Product Demand Document Product Feature Analytics Rate Formats PDF
This slide covers the key performance indicators for analyzing the product features based on baseline target and time frame. Deliver an awe-inspiring pitch with this creative product demand document product feature analytics rate formats pdf bundle. Topics like performance indicator, baseline, target, time frame can be discussed with this completely editable template. It is available for immediate download depending on the needs and requirements of the user.
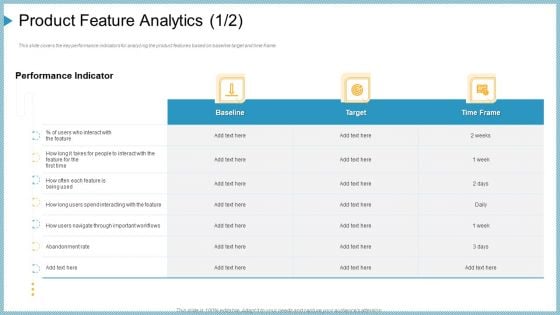
Company Need Administration Mechanisms Methods Product Feature Analytics First Clipart PDF
This slide covers the key performance indicators for analyzing the product features based on baseline target and time frame. Deliver and pitch your topic in the best possible manner with this company need administration mechanisms methods product feature analytics first clipart pdf. Use them to share invaluable insights on target, time frame, performance indicator and impress your audience. This template can be altered and modified as per your expectations. So, grab it now.
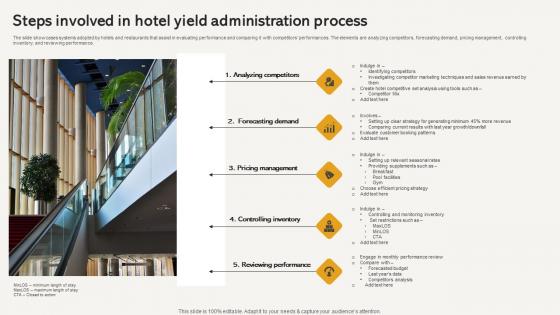
Steps Involved In Hotel Yield Administration Process Infographics Pdf
The slide showcases systems adopted by hotels and restaurants that assist in evaluating performance and comparing it with competitors performances. The elements are analyzing competitors, forecasting demand, pricing management, controlling inventory, and reviewing performance. Showcasing this set of slides titled Steps Involved In Hotel Yield Administration Process Infographics Pdf The topics addressed in these templates are Analyzing Competitors, Forecasting Demand, Pricing Management All the content presented in this PPT design is completely editable. Download it and make adjustments in color, background, font etc. as per your unique business setting. The slide showcases systems adopted by hotels and restaurants that assist in evaluating performance and comparing it with competitors performances. The elements are analyzing competitors, forecasting demand, pricing management, controlling inventory, and reviewing performance.
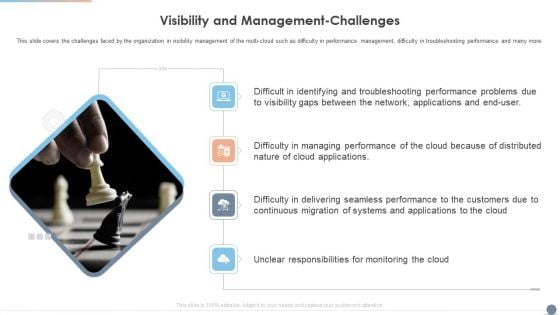
Multi Cloud Complexity Management Visibility And Management Challenges Infographics PDF
This slide covers the challenges faced by the organization in visibility management of the multi cloud such as difficulty in performance management, difficulty in troubleshooting performance and many more. Deliver an awe inspiring pitch with this creative Multi Cloud Complexity Management Visibility And Management Challenges Infographics PDF bundle. Topics like Cloud Applications, Customers can be discussed with this completely editable template. It is available for immediate download depending on the needs and requirements of the user.
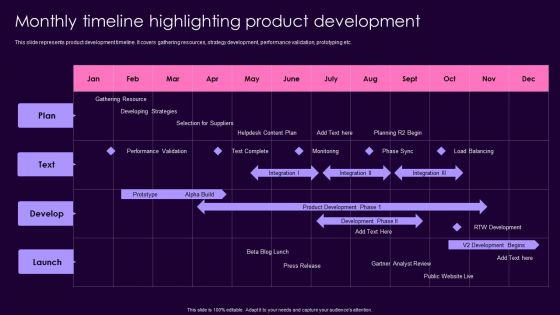
Product Management Techniques Monthly Timeline Highlighting Product Development Infographics PDF
This slide represents product development timeline. It covers gathering resources, strategy development, performance validation, prototyping etc. Deliver an awe inspiring pitch with this creative Product Management Techniques Monthly Timeline Highlighting Product Development Infographics PDF bundle. Topics like Gathering Resource, Developing Strategies, Performance Validation can be discussed with this completely editable template. It is available for immediate download depending on the needs and requirements of the user.
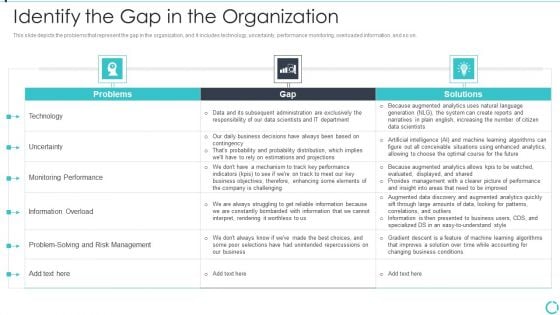
Augmented Analytics Implementation IT Identify The Gap In The Organization Infographics PDF
This slide depicts the problems that represent the gap in the organization, and it includes technology, uncertainty, performance monitoring, overloaded information, and so on. Deliver and pitch your topic in the best possible manner with this Augmented Analytics Implementation IT Identify The Gap In The Organization Infographics PDF. Use them to share invaluable insights on Technology, Uncertainty, Monitoring Performance, Information Overload and impress your audience. This template can be altered and modified as per your expectations. So, grab it now.

Risk Recognition Automation Siem Competitive Advantage Management Ppt Infographic Template Example 2015 PDF
This slide covers the SIEM competitive landscape based on various categories such as digital experience management, health check, application performance monitoring, event management, etc. Deliver an awe inspiring pitch with this creative risk recognition automation siem competitive advantage management ppt infographic template example 2015 pdf bundle. Topics like infrastructure monitoring, event management, application performance monitoring, middleware monitoring can be discussed with this completely editable template. It is available for immediate download depending on the needs and requirements of the user.
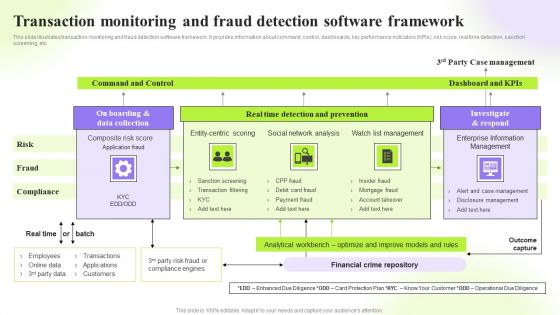
Techniques To Monitor Transactions Transaction Monitoring And Fraud Detection Sample PDF
This slide illustrates transaction monitoring and fraud detection software framework. It provides information about command, control, dashboards, key performance indicators KPIs, risk score, real time detection, sanction screening, etc. From laying roadmaps to briefing everything in detail, our templates are perfect for you. You can set the stage with your presentation slides. All you have to do is download these easy-to-edit and customizable templates. Techniques To Monitor Transactions Transaction Monitoring And Fraud Detection Sample PDF will help you deliver an outstanding performance that everyone would remember and praise you for. Do download this presentation today.

Succession Planning For Future Leadership Ppt PowerPoint Presentation Summary Designs Download
Presenting this set of slides with name succession planning for future leadership ppt powerpoint presentation summary designs download. The topics discussed in these slides are leadership transition, dashboard performance, planning. This is a completely editable PowerPoint presentation and is available for immediate download. Download now and impress your audience.
Energy Tracking Device Outline Ppt PowerPoint Presentation Layouts Designs Download PDF
Deliver an awe-inspiring pitch with this creative energy tracking device outline ppt powerpoint presentation layouts designs download pdf bundle. Topics like commit to continuous improvement, set goals, assess performance, create action plan, evaluate progress, recognize achievements, kpi metrics and dashboard can be discussed with this completely editable template. It is available for immediate download depending on the needs and requirements of the user.
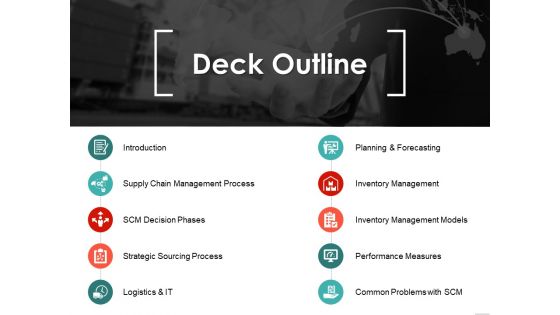
Deck Outline Ppt PowerPoint Presentation Infographic Template Pictures
This is a deck outline ppt powerpoint presentation infographic template pictures. This is a ten stage process. The stages in this process are introduction, supply chain management process, strategic sourcing process, inventory management, performance measures.
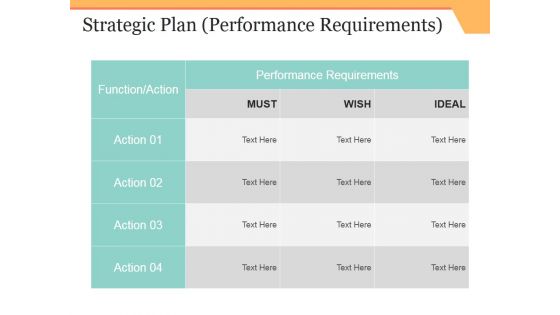
Strategic Plan Template 5 Ppt PowerPoint Presentation Infographic Template Background Image
This is a strategic plan template 5 ppt powerpoint presentation infographic template background image. This is a three stage process. The stages in this process are performance requirements, function, action.
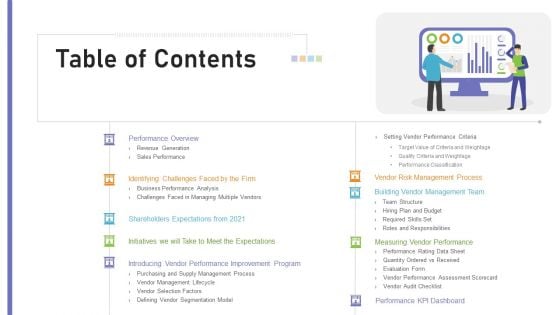
Benchmarking Supplier Operation Control Procedure Table Of Contents Graphics PDF
This is a benchmarking supplier operation control procedure table of contents graphics pdf template with various stages. Focus and dispense information on nine stages using this creative set, that comes with editable features. It contains large content boxes to add your information on topics like performance overview, management process, vendor performance, dashboard, program. You can also showcase facts, figures, and other relevant content using this PPT layout. Grab it now.

Insight Of Data Governance Framework Diagram Powerpoint Guide
This is a insight of data governance framework diagram powerpoint guide. This is a four stage process. The stages in this process are analytics applied, information management, analytic insights, performance optimization.

Data Analysis For Customer Relationship Management Consulting Ppt PowerPoint Presentation Ideas Templates
This is a data analysis for customer relationship management consulting ppt powerpoint presentation ideas templates. This is a one stage process. The stages in this process are employee performance review, job evaluation, customer 360.
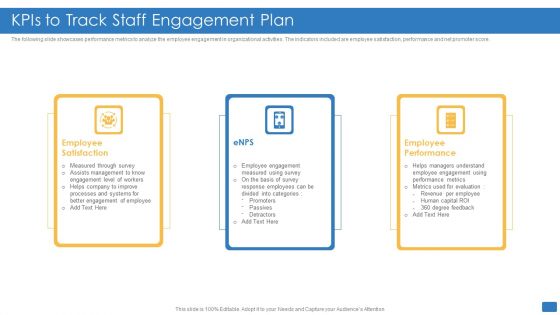
Kpis To Track Staff Engagement Plan Infographics PDF
The following slide showcases performance metrics to analyze the employee engagement in organizational activities. The indicators included are employee satisfaction, performance and net promoter score. Persuade your audience using this Kpis To Track Staff Engagement Plan Infographics PDF. This PPT design covers three stages, thus making it a great tool to use. It also caters to a variety of topics including Employee Satisfaction, Employee Performance, Metrics. Download this PPT design now to present a convincing pitch that not only emphasizes the topic but also showcases your presentation skills.
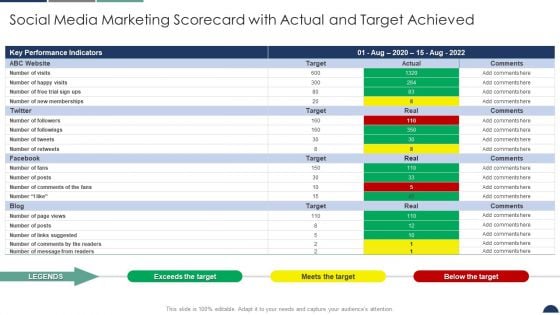
Social Media Marketing Scorecard With Actual And Target Achieved Sales And Marketing Scorecard Pictures PDF
Deliver an awe inspiring pitch with this creative Social Media Marketing Scorecard With Actual And Target Achieved Sales And Marketing Scorecard Pictures PDF bundle. Topics like Key Performance Indicators, Social Media, Marketing Scorecard can be discussed with this completely editable template. It is available for immediate download depending on the needs and requirements of the user.
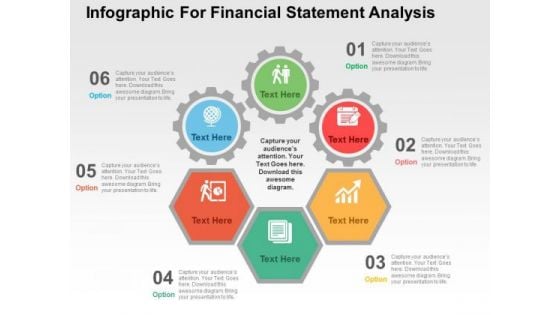
Infographic For Financial Statement Analysis PowerPoint Templates
This PowerPoint template contains infographic slide. This diagram has been designed with circular infographic to exhibit financial statement analysis. Use this diagram to set targets and to measure performance in your presentations.
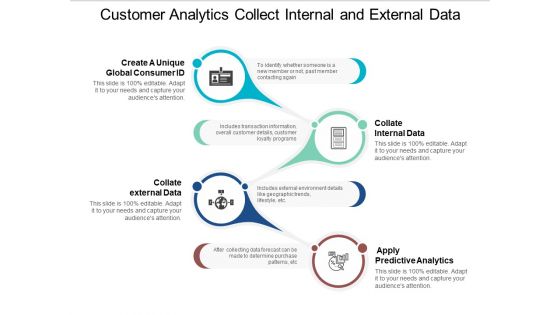
Customer Analytics Collect Internal And External Data Ppt PowerPoint Presentation Portfolio Skills
This is a customer analytics collect internal and external data ppt powerpoint presentation portfolio skills. This is a four stage process. The stages in this process are employee performance review, job evaluation, customer 360.
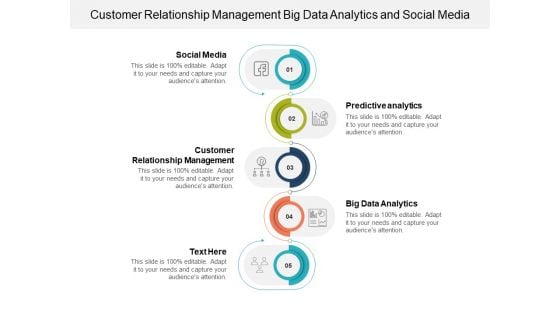
Customer Relationship Management Big Data Analytics And Social Media Ppt PowerPoint Presentation Show Ideas
This is a customer relationship management big data analytics and social media ppt powerpoint presentation show ideas. This is a five stage process. The stages in this process are employee performance review, job evaluation, customer 360.

Ways To Improve Crm Strategy Predictive And Big Data Analytics Ppt PowerPoint Presentation Portfolio Information
This is a ways to improve crm strategy predictive and big data analytics ppt powerpoint presentation portfolio information. This is a six stage process. The stages in this process are employee performance review, job evaluation, customer 360.
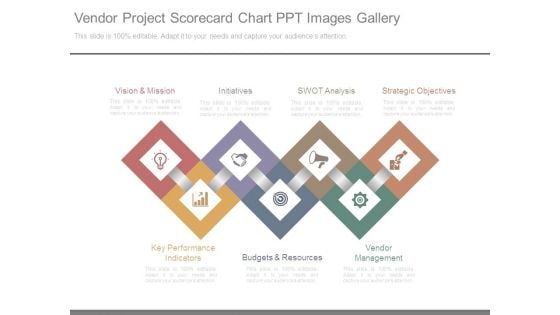
Vendor Project Scorecard Chart Ppt Images Gallery
This is a vendor project scorecard chart ppt images gallery. This is a seven stage process. The stages in this process are vision and mission, initiatives, swot analysis, strategic objectives, vendor management, budgets and resources, key performance indicators.
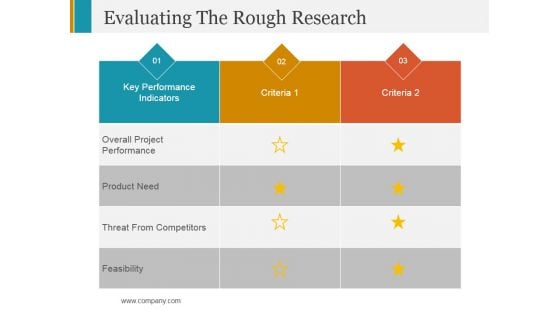
Evaluating The Rough Research Ppt PowerPoint Presentation Ideas Clipart Images
This is a evaluating the rough research ppt powerpoint presentation ideas clipart images. This is a two stage process. The stages in this process are key performance indicators, criteria, feasibility.
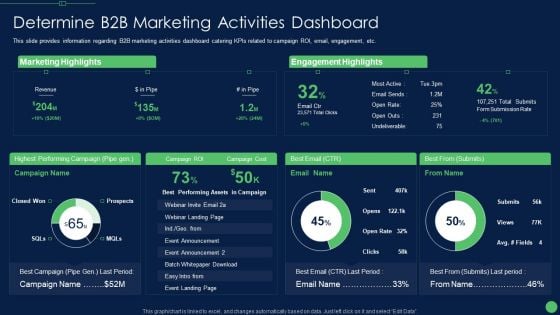
Most Effective Sales Enablement Strategies For B2B Marketers Determine B2B Marketing Information PDF
This slide provides information regarding B2B marketing activities dashboard catering KPIs related to campaign ROI, email, engagement, etc. Deliver and pitch your topic in the best possible manner with this most effective sales enablement strategies for b2b marketers determine b2b marketing information pdf Use them to share invaluable insights on marketing highlights, highest performing campaign, engagement highlights and impress your audience. This template can be altered and modified as per your expectations. So, grab it now.
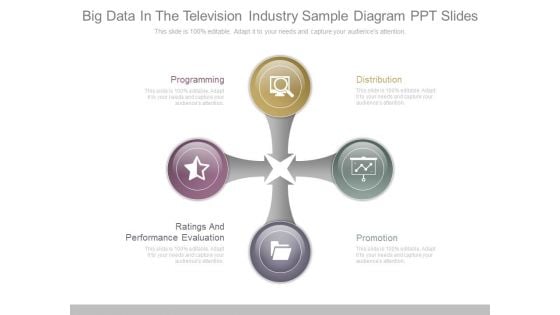
Big Data In The Television Industry Sample Diagram Ppt Slides
This is a big data in the television industry sample diagram ppt slides. This is a four stage process. The stages in this process are programming, distribution, promotion, ratings and performance evaluation.
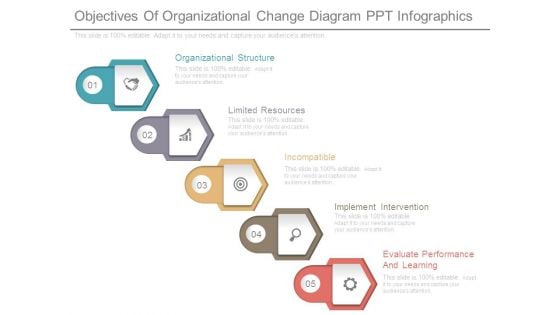
Objectives Of Organizational Change Diagram Ppt Infographics
This is a objectives of organizational change diagram ppt infographics. This is a five stage process. The stages in this process are organizational structure, limited resources, incompatible, implement intervention, evaluate performance and learning.


 Continue with Email

 Home
Home


