Business Results
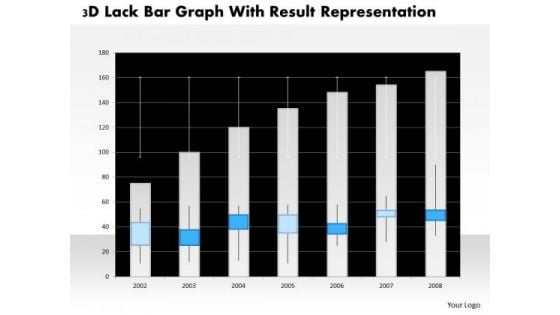
Business Diagram 3d Lack Bar Graph With Result Representation PowerPoint Slide
This business diagram has graphic of 3d lack bar graph. This diagram is a data visualization tool that gives you a simple way to present statistical information. This slide helps your audience examine and interpret the data you present.
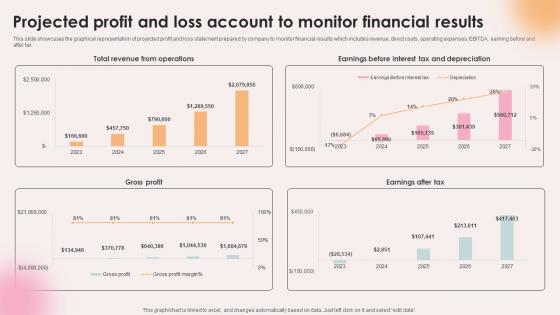
Spa Resort Business Plan Projected Profit And Loss Account To Monitor Financial Results BP SS V
This slide showcases the graphical representation of projected profit and loss statement prepared by company to monitor financial results which includes revenue, direct costs, operating expenses, EBITDA, earning before and after tax. Here you can discover an assortment of the finest PowerPoint and Google Slides templates. With these templates, you can create presentations for a variety of purposes while simultaneously providing your audience with an eye-catching visual experience. Download Spa Resort Business Plan Projected Profit And Loss Account To Monitor Financial Results BP SS V to deliver an impeccable presentation. These templates will make your job of preparing presentations much quicker, yet still, maintain a high level of quality. Slidegeeks has experienced researchers who prepare these templates and write high-quality content for you. Later on, you can personalize the content by editing the Spa Resort Business Plan Projected Profit And Loss Account To Monitor Financial Results BP SS V. This slide showcases the graphical representation of projected profit and loss statement prepared by company to monitor financial results which includes revenue, direct costs, operating expenses, EBITDA, earning before and after tax.
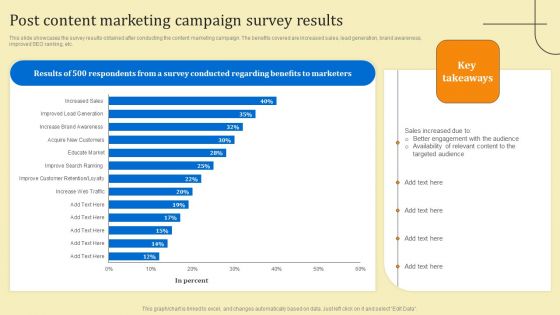
Business Sales Optimization Advertisement Campaign Post Content Marketing Campaign Survey Results Structure PDF
This slide showcases the survey results obtained after conducting the content marketing campaign. The benefits covered are increased sales, lead generation, brand awareness, improved SEO ranking, etc. Coming up with a presentation necessitates that the majority of the effort goes into the content and the message you intend to convey. The visuals of a PowerPoint presentation can only be effective if it supplements and supports the story that is being told. Keeping this in mind our experts created Business Sales Optimization Advertisement Campaign Post Content Marketing Campaign Survey Results Structure PDF to reduce the time that goes into designing the presentation. This way, you can concentrate on the message while our designers take care of providing you with the right template for the situation.
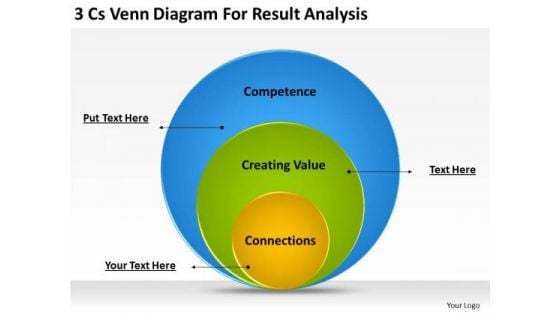
Business PowerPoint Template 3 Cs Venn Diagram For Result Analysis Ppt Templates
Document the process on our Business powerpoint template 3 cs venn diagram for result analysis ppt templates. Make a record of every detail. Satiate desires with our Finance PowerPoint Templates. Give them all they want and more. Be the doer with our Venn Diagrams PowerPoint Templates. Put your thoughts into practice. Entertain your audience with our Business PowerPoint Template 3 Cs Venn Diagram For Result Analysis Ppt Templates. You will come out on top.

Business Network Strategy By Team Leader For Best Result Ppt PowerPoint Presentation File Professional PDF
Presenting this set of slides with name business network strategy by team leader for best result ppt powerpoint presentation file professional pdf. This is a six stage process. The stages in this process are sensitivities, analyse, scenarios. This is a completely editable PowerPoint presentation and is available for immediate download. Download now and impress your audience.
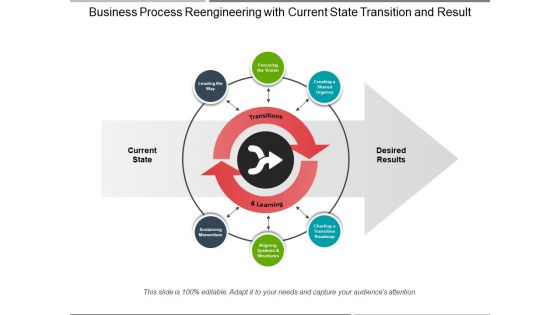
Business Process Reengineering With Current State Transition And Result Ppt PowerPoint Presentation Gallery Deck PDF
Presenting this set of slides with name business process reengineering with current state transition and result ppt powerpoint presentation gallery deck pdf. This is a six stage process. The stages in this process are sustaining, transition, roadmap. This is a completely editable PowerPoint presentation and is available for immediate download. Download now and impress your audience.
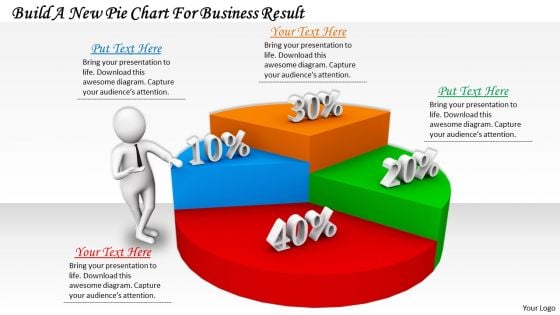
Business Expansion Strategy Build New Pie Chart For Result 3d Character Modeling
Get The Domestics Right With Our Business Expansion Strategy Build New Pie Chart For Result 3d Character Modeling Powerpoint Templates. Create The Base For Thoughts To Grow. Do Away With Dogmatic Approaches. Establish The Value Of Reason With Our Pie Charts Powerpoint Templates.
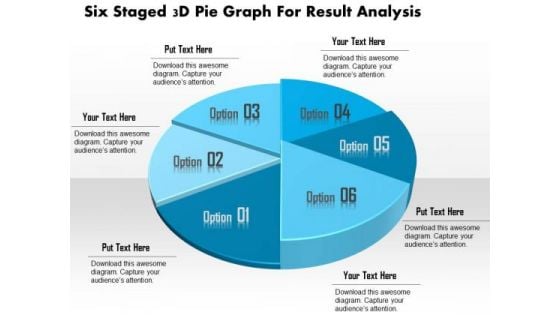
Business Diagram Six Staged 3d Pie Graph For Result Analysis Presentation Template
This business slide displays six staged pie chart. This diagram is a data visualization tool that gives you a simple way to present statistical information. This slide helps your audience examine and interpret the data you present.
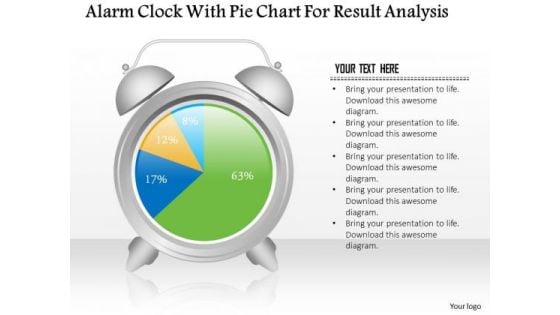
Business Diagram Alarm Clock With Pie Chart For Result Analysis PowerPoint Slide
This business slide displays alarm clock with pie chart. This diagram is a data visualization tool that gives you a simple way to present statistical information. This slide helps your audience examine and interpret the data you present.
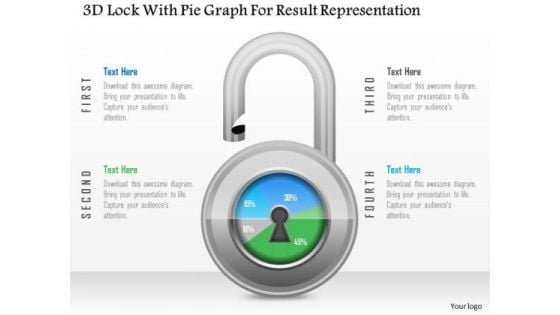
Business Diagram 3d Lock With Pie Graph For Result Representation PowerPoint Slide
This Power Point diagram has been crafted with pie chart in shape of lock. It contains diagram of lock pie chart to compare and present data in an effective manner. Use this diagram to build professional presentations for your viewers.
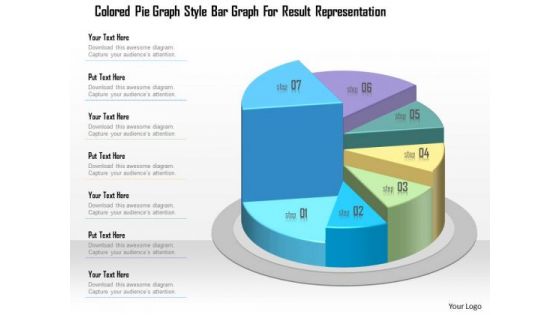
Business Diagram Colored Pie Graph Style Bar Graph For Result Representation Presentation Template
Concept of business result analysis has been displayed in this power point template. This PPT contains the colored pie graph with bar graph. Use this PPT for your business and marketing result analysis related presentations.
Strategic Business Plan Effective Tools Soar Strength Opportunities Aspiration And Result Model Icons PDF
This slide covers SOAR organization analysis model depicting strength opportunities, aspiration, results organization model including questions such as what can we build, what do we care about, what are stakeholders asking for and many more. This is a strategic business plan effective tools soar strength opportunities aspiration and result model icons pdf template with various stages. Focus and dispense information on four stages using this creative set, that comes with editable features. It contains large content boxes to add your information on topics like strengths, opportunities, aspiration, result. You can also showcase facts, figures, and other relevant content using this PPT layout. Grab it now.
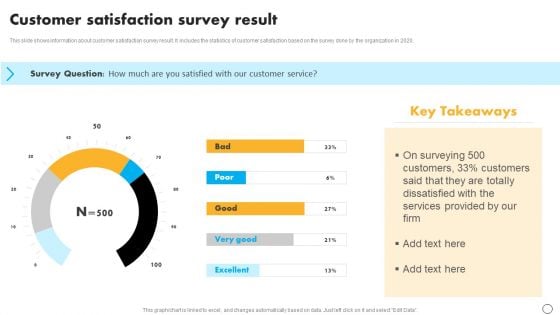
Retail Business Optimization Through Operational Excellence Strategy Customer Satisfaction Survey Result Ideas PDF
This slide shows information about customer satisfaction survey result. It includes the statistics of customer satisfaction based on the survey done by the organization in 2020. From laying roadmaps to briefing everything in detail, our templates are perfect for you. You can set the stage with your presentation slides. All you have to do is download these easy to edit and customizable templates. Retail Business Optimization Through Operational Excellence Strategy Customer Satisfaction Survey Result Ideas PDF will help you deliver an outstanding performance that everyone would remember and praise you for. Do download this presentation today.
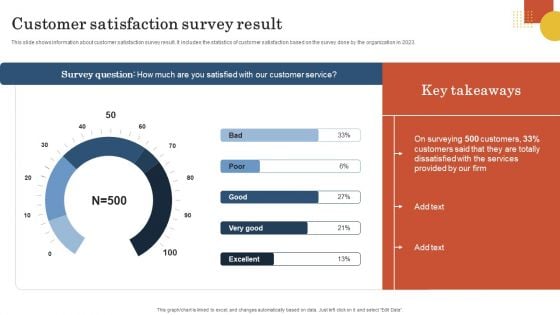
Retail Business Operation Management To Optimize Customer Experience Customer Satisfaction Survey Result Information PDF
This slide shows information about customer satisfaction survey result. It includes the statistics of customer satisfaction based on the survey done by the organization in 2023. From laying roadmaps to briefing everything in detail, our templates are perfect for you. You can set the stage with your presentation slides. All you have to do is download these easy to edit and customizable templates. Retail Business Operation Management To Optimize Customer Experience Customer Satisfaction Survey Result Information PDF will help you deliver an outstanding performance that everyone would remember and praise you for. Do download this presentation today.
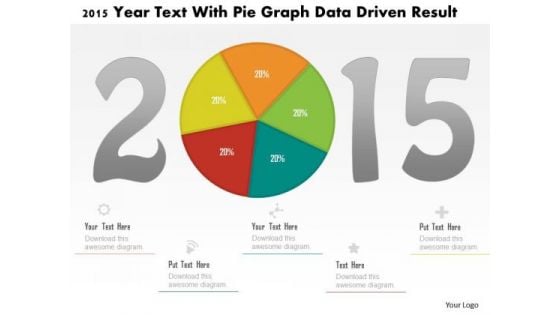
Business Diagram 2015 Year Text With Pie Graph Data Driven Result PowerPoint Slide
This business diagram displays 2015 year numbers with pie chart. This diagram is suitable to display business strategy for year 2015. Download this professional slide to present information in an attractive manner

Hike In Fuel Prices Resulting Increased Cargo Costs In Transportation Firm Business Case Competition Ppt PowerPoint Presentation Complete Deck
This complete deck acts as a great communication tool. It helps you in conveying your business message with personalized sets of graphics, icons etc. Comprising a set of fortyseven slides, this complete deck can help you persuade your audience. It also induces strategic thinking as it has been thoroughly researched and put together by our experts. Not only is it easily downloadable but also editable. The color, graphics, theme any component can be altered to fit your individual needs. So grab it now.
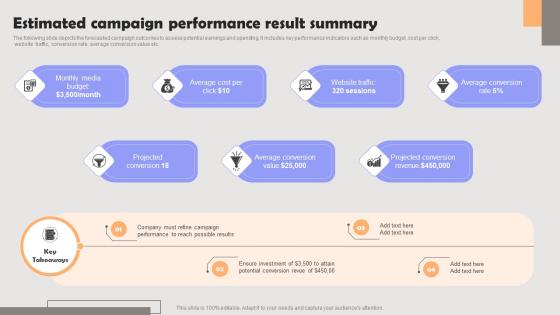
Improving PPC Campaign Results Estimated Campaign Performance Result Information Pdf
The following slide depicts the forecasted campaign outcomes to assess potential earnings and spending. It includes key performance indicators such as monthly budget, cost per click, website traffic, conversion rate, average conversion value etc. Crafting an eye-catching presentation has never been more straightforward. Let your presentation shine with this tasteful yet straightforward Improving PPC Campaign Results Estimated Campaign Performance Result Information Pdf template. It offers a minimalistic and classy look that is great for making a statement. The colors have been employed intelligently to add a bit of playfulness while still remaining professional. Construct the ideal Improving PPC Campaign Results Estimated Campaign Performance Result Information Pdf that effortlessly grabs the attention of your audience. Begin now and be certain to wow your customers. The following slide depicts the forecasted campaign outcomes to assess potential earnings and spending. It includes key performance indicators such as monthly budget, cost per click, website traffic, conversion rate, average conversion value etc.
Results Ppt PowerPoint Presentation Ideas Images
This is a results ppt powerpoint presentation ideas images. This is a three stage process. The stages in this process are business, result, icons, strategy, marketing.
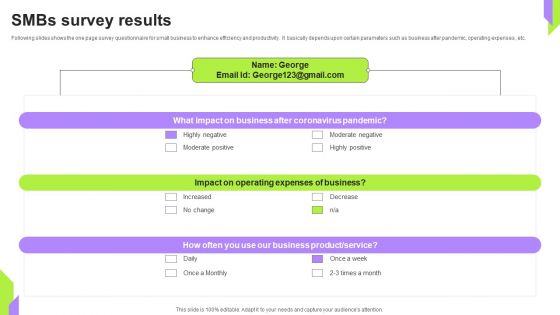
Smbs Survey Results Survey SS
Showcasing this set of slides titled Smbs Survey Results Survey SS. The topics addressed in these templates are Business, Increased, Moderate Negative . All the content presented in this PPT design is completely editable. Download it and make adjustments in color, background, font etc. as per your unique business setting.
Big Results PowerPoint Icon C
e-business concept illustration with papers and text Present like a genius. Our Big Results PowerPoint Icon C help you play the part.
Big Results PowerPoint Icon Cc
e-business concept illustration with papers and text Create a facilitative environment with our Big Results PowerPoint Icon Cc. Encourage definite action by your audience.
Big Results PowerPoint Icon S
e-business concept illustration with papers and text Our Big Results PowerPoint Icon S have an enabling aptitude. They ensure your thoughts continue to flow.
Results Ppt PowerPoint Presentation Slides Vector
This is a results ppt powerpoint presentation slides vector. This is a three stage process. The stages in this process are results, business, management, marketing.
Results Ppt PowerPoint Presentation Layouts Format
This is a results ppt powerpoint presentation layouts format. This is a five stage process. The stages in this process are results, business, marketing, management, planning.
Results Ppt PowerPoint Presentation Model Graphics Design
This is a results ppt powerpoint presentation model graphics design. This is a three stage process. The stages in this process are result, business, marketing, management.
Results Ppt PowerPoint Presentation Infographic Template
This is a results ppt powerpoint presentation infographic template. This is a three stage process. The stages in this process are result, business, planning, strategy, analysis.
Results Ppt PowerPoint Presentation Professional Deck
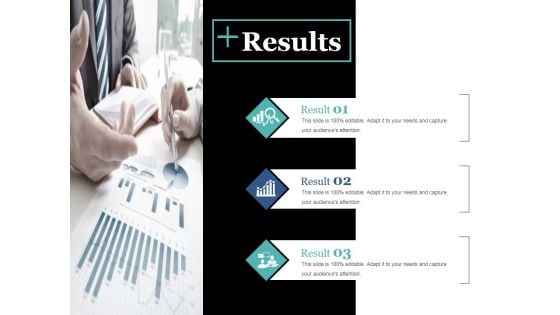
This is a results ppt powerpoint presentation professional deck. This is a three stage process. The stages in this process are result, business, marketing, icons, strategy.
Results Ppt PowerPoint Presentation Professional Elements
This is a results ppt powerpoint presentation professional elements. This is a three stage process. The stages in this process are result, management, business, strategy, analysis.
Results Ppt PowerPoint Presentation Icon Graphics Download
This is a results ppt powerpoint presentation icon graphics download. This is a three stage process. The stages in this process are result, finance, marketing, strategy, analysis, business.
Summary Of Smbs Survey Results Survey SS
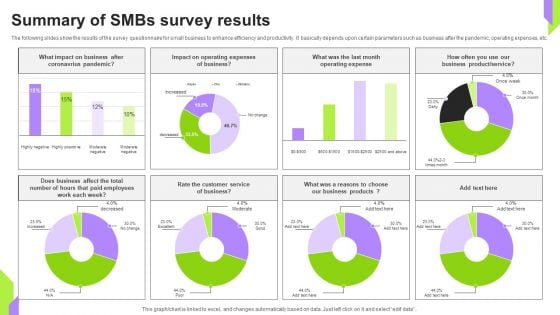
Pitch your topic with ease and precision using this Summary Of Smbs Survey Results Survey SS. This layout presents information on Results, Operating Expense, Business. It is also available for immediate download and adjustment. So, changes can be made in the color, design, graphics or any other component to create a unique layout.
Product Governance Strategy Survey Results Guidelines PDF
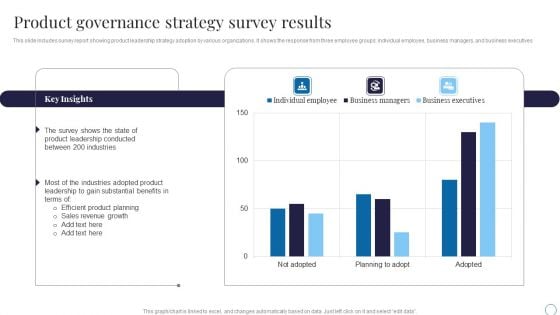
This slide includes survey report showing product leadership strategy adoption by various organizations. It shows the response from three employee groups individual employee, business managers, and business executives.Showcasing this set of slides titled Product Governance Strategy Survey Results Guidelines PDF. The topics addressed in these templates are Leadership Conducted, Industries Adopted, Revenue Growth. All the content presented in this PPT design is completely editable. Download it and make adjustments in color, background, font etc. as per your unique business setting.
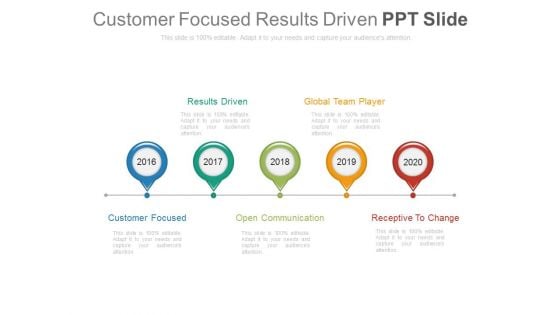
Customer Focused Results Driven Ppt Slide
This is a customer focused results driven ppt slide. This is a five stage process. The stages in this process are time planning, success, business and marketing.

Biotechnology Company Employee Monitoring Results Demonstration PDF
Showcasing this set of slides titled biotechnology company employee monitoring results demonstration pdf. The topics addressed in these templates are biotechnology company employee monitoring results. All the content presented in this PPT design is completely editable. Download it and make adjustments in color, background, font etc. as per your unique business setting.
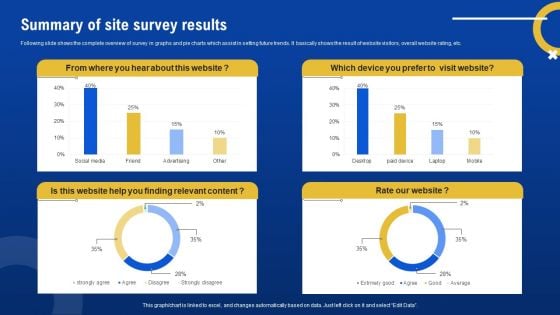
Summary Of Site Survey Results Survey SS
Following slide shows the complete overview of survey in graphs and pie charts which assist in setting future trends. It basically shows the result of website visitors, overall website rating, etc. Showcasing this set of slides titled Summary Of Site Survey Results Survey SS. The topics addressed in these templates are Summary, Site Survey Results. All the content presented in this PPT design is completely editable. Download it and make adjustments in color, background, font etc. as per your unique business setting.
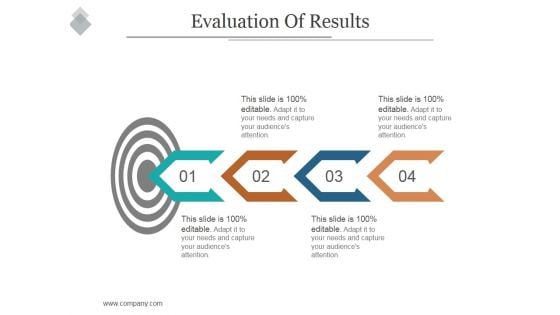
Evaluation Of Results Ppt PowerPoint Presentation Layouts
This is a evaluation of results ppt powerpoint presentation layouts. This is a four stage process. The stages in this process are plan, business, marketing, process, strategy.
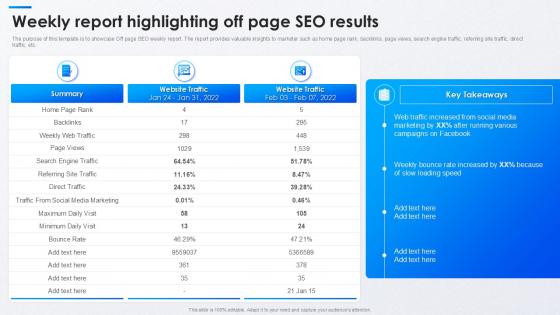
Weekly Report Highlighting Off Page Seo Results
From laying roadmaps to briefing everything in detail, our templates are perfect for you. You can set the stage with your presentation slides. All you have to do is download these easy-to-edit and customizable templates. Weekly Report Highlighting Off Page Seo Results will help you deliver an outstanding performance that everyone would remember and praise you for. Do download this presentation today. Measure your Off-page SEO results with our Weekly report presentation template. Highlight website traffic, backlinks, and referral traffic in a professional and easy-to-understand format. This PPT bundle is perfect for presenting SEO results to clients or internal teams.
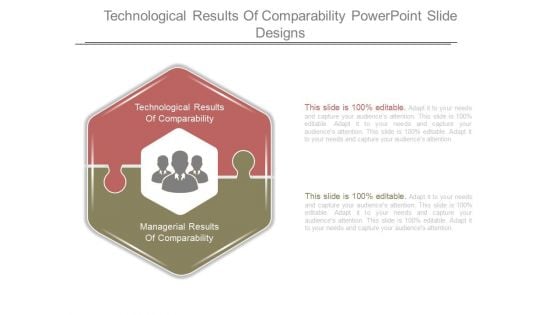
Technological Results Of Comparability Powerpoint Slide Designs
This is a technological results of comparability powerpoint slide designs. This is a two stage process. The stages in this process are technological results of comparability, managerial results of comparability.
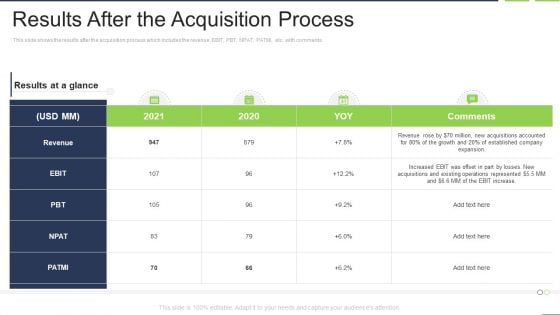
Results After The Acquisition Process Formats PDF
Deliver and pitch your topic in the best possible manner with this results after the acquisition process formats pdf. Use them to share invaluable insights on acquisitions and existing, operations represented, established company expansion. and impress your audience. This template can be altered and modified as per your expectations. So, grab it now.
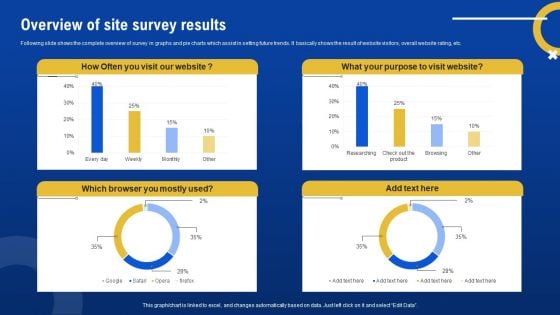
Overview Of Site Survey Results Survey SS
Following slide shows the complete overview of survey in graphs and pie charts which assist in setting future trends. It basically shows the result of website visitors, overall website rating, etc. Pitch your topic with ease and precision using this Overview Of Site Survey Results Survey SS. This layout presents information on Overview, Site Survey Results. It is also available for immediate download and adjustment. So, changes can be made in the color, design, graphics or any other component to create a unique layout.
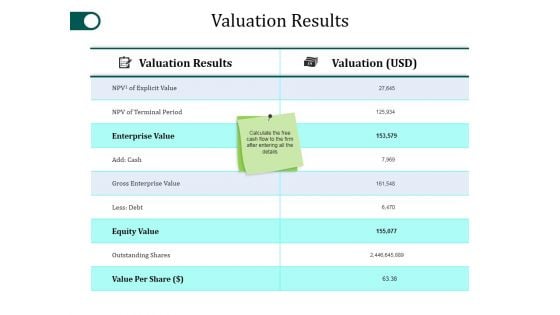
Valuation Results Ppt PowerPoint Presentation Model Guide
This is a valuation results ppt powerpoint presentation model guide. This is a two stage process. The stages in this process are valuation results, valuation, enterprise value, equity value, outstanding shares.

Vision Processes Strategy Results Ppt Powerpoint Show
This is a vision processes strategy results ppt powerpoint show. This is a eight stage process. The stages in this process are mission, vision, strategy, processes, systems, performance management, behavior and action, results, performance management system, starting with the ultimate goal and mission of the organization, eventually aligning all business units, teams and individuals with strategy.
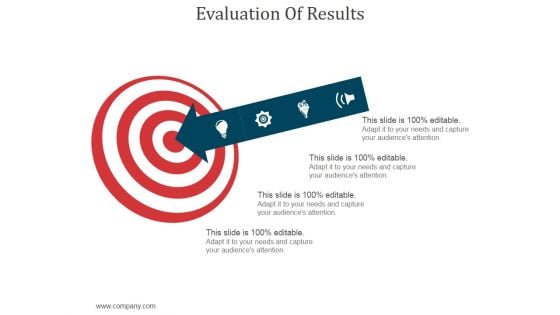
Evaluation Of Results Ppt PowerPoint Presentation Styles
This is a evaluation of results ppt powerpoint presentation styles. This is a one stage process. The stages in this process are arrow, icons, target, strategy, success, business.
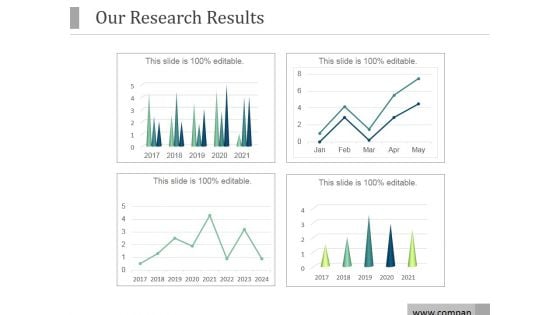
Our Research Results Ppt PowerPoint Presentation Model
This is a our research results ppt powerpoint presentation model. This is a four stage process. The stages in this process are research, financials, business, marketing, management, success.
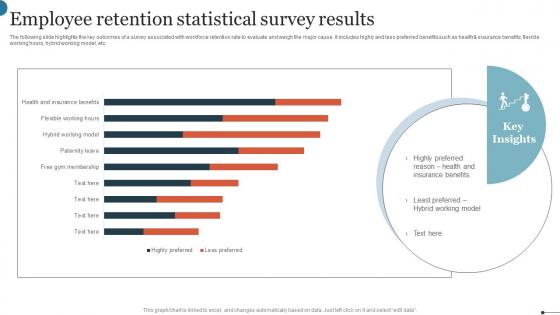
Employee Retention Statistical Survey Results Infographics Pdf
The following slide highlights the key outcomes of a survey associated with workforce retention rate to evaluate and weigh the major cause. It includes highly and less preferred benefits such as healthand insurance benefits, flexible working hours, hybrid working model, etc. Showcasing this set of slides titled Employee Retention Statistical Survey Results Infographics Pdf. The topics addressed in these templates are Highly Preferred Reason, Health Insurance Benefits, Hybrid Working Model. All the content presented in this PPT design is completely editable. Download it and make adjustments in color, background, font etc. as per your unique business setting. The following slide highlights the key outcomes of a survey associated with workforce retention rate to evaluate and weigh the major cause. It includes highly and less preferred benefits such as healthand insurance benefits, flexible working hours, hybrid working model, etc.
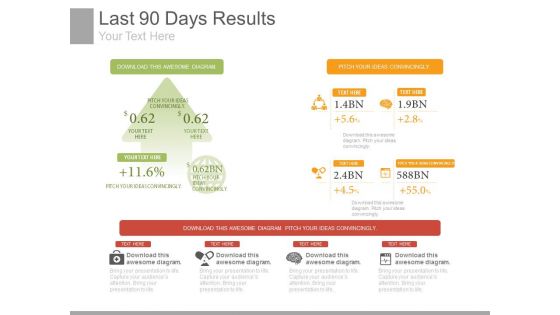
Last 90 Days Results Ppt Slides
This is a last 90 days results ppt slides. This is a four stage process. The stages in this process are business, marketing.
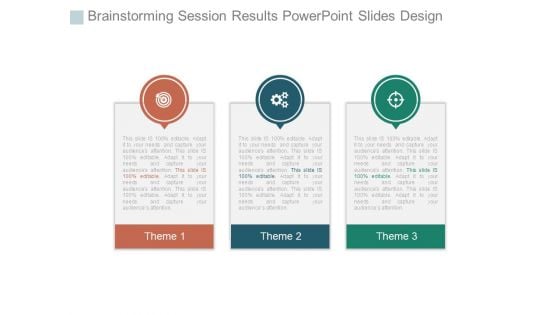
Brainstorming Session Results Powerpoint Slides Design
This is a brainstorming session results powerpoint slides design. This is a three stage process. The stages in this process are business, marketing, strategy, management, presentation.
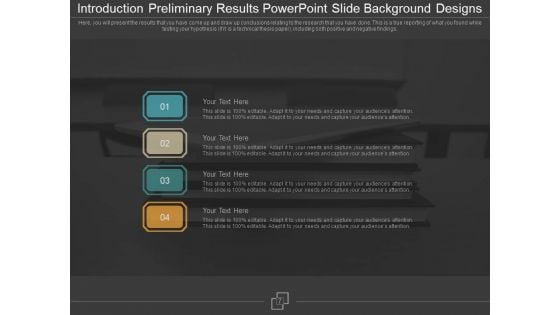
Introduction Preliminary Results Powerpoint Slide Background Designs
This is a introduction preliminary results powerpoint slide background designs. This is a four stage process. The stages in this process are business, marketing, preliminary, technology, management.
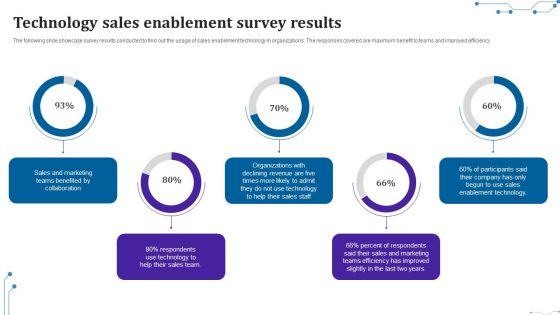
Technology Sales Enablement Survey Results Pictures PDF
The following slide showcase survey results conducted to find out the usage of sales enablement technology in organizations. The responses covered are maximum benefit to teams and improved efficiency.Pitch your topic with ease and precision using this Technology Sales Enablement Survey Results Pictures PDF. This layout presents information on Teams Benefited, Sales Marketing, Percent Respondents. It is also available for immediate download and adjustment. So, changes can be made in the color, design, graphics or any other component to create a unique layout.
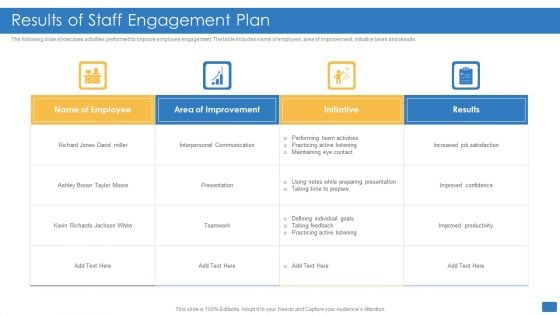
Results Of Staff Engagement Plan Elements PDF
The following slide showcases activities performed to improve employee engagement. The table includes name of employee, area of improvement, initiative taken and results. Pitch your topic with ease and precision using this Results Of Staff Engagement Plan Elements PDF. This layout presents information on Performing Team Activities, Improved Productivity, Employee. It is also available for immediate download and adjustment. So, changes can be made in the color, design, graphics or any other component to create a unique layout.
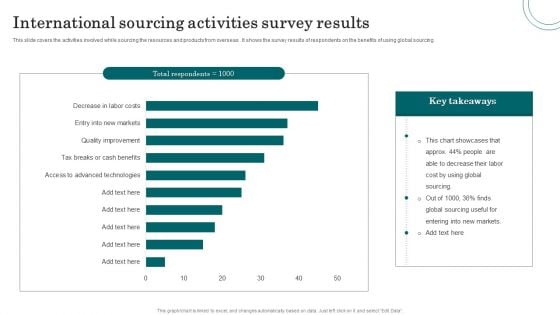
International Sourcing Activities Survey Results Microsoft PDF
This slide covers the activities involved while sourcing the resources and products from overseas . It shows the survey results of respondents on the benefits of using global sourcing. Pitch your topic with ease and precision using this International Sourcing Activities Survey Results Microsoft PDF. This layout presents information on Global Sourcing, Labor Cost, Markets. It is also available for immediate download and adjustment. So, changes can be made in the color, design, graphics or any other component to create a unique layout.
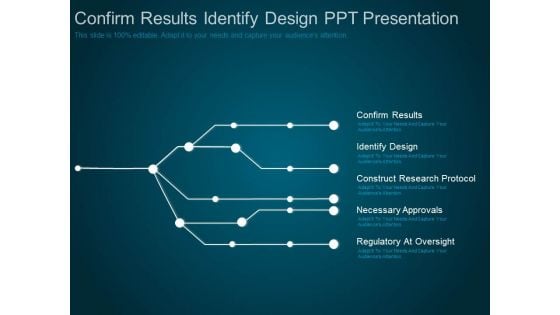
Confirm Results Identify Design Ppt Presentation
This is a confirm results identify design ppt presentation. This is a one stage process. The stages in this process are business, marketing.
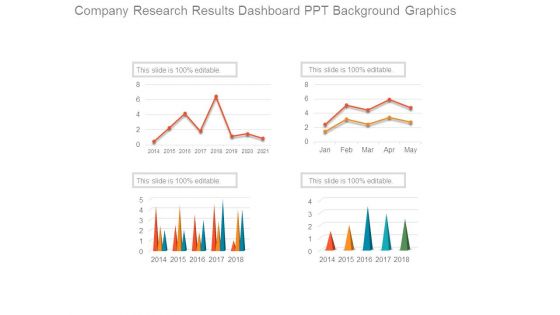
Company Research Results Dashboard Ppt Background Graphics
This is a company research results dashboard ppt background graphics. This is a four stage process. The stages in this process are growth, business, marketing, year.
Preliminary Results For Learning Powerpoint Presentation
This is a preliminary results for learning powerpoint presentation. This is a four stage process. The stages in this process are business, marketing, management, learning, strategy.
Results Ppt Powerpoint Presentation Infographics File Formats
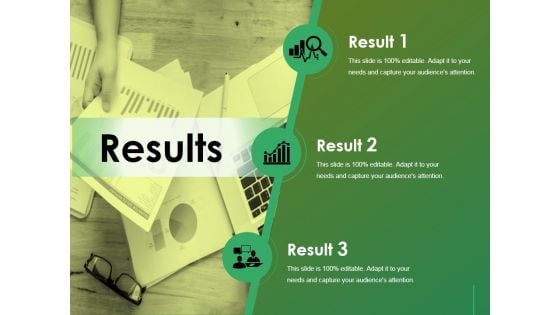
This is a results ppt powerpoint presentation infographics file formats. This is a three stage process. The stages in this process are analysis, icon, business, marketing, strategy, finance.
Results Ppt PowerPoint Presentation Model Graphics
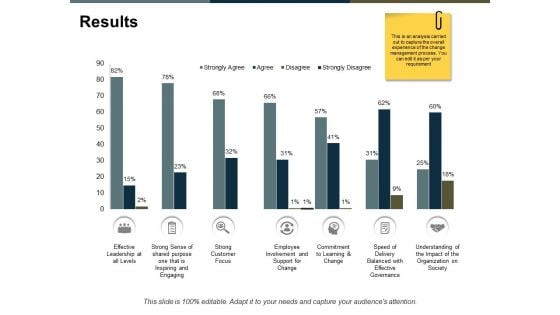
This is a results ppt powerpoint presentation model graphics. This is a seven stage process. The stages in this process are finance, marketing, analysis, business, investment.
Employee Staffing Data Survey Results Mockup PDF
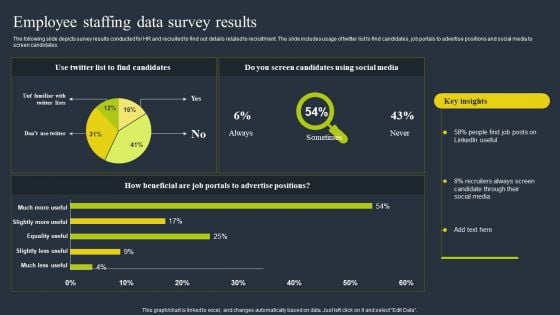
The following slide depicts survey results conducted for HR and recruited to find out details related to recruitment. The slide includes usage of twitter list to find candidates, job portals to advertise positions and social media to screen candidates. Showcasing this set of slides titled Employee Staffing Data Survey Results Mockup PDF. The topics addressed in these templates are Social Media, Recruiters, Advertise. All the content presented in this PPT design is completely editable. Download it and make adjustments in color, background, font etc. as per your unique business setting.
Analyze Results Ppt PowerPoint Presentation Professional Guide
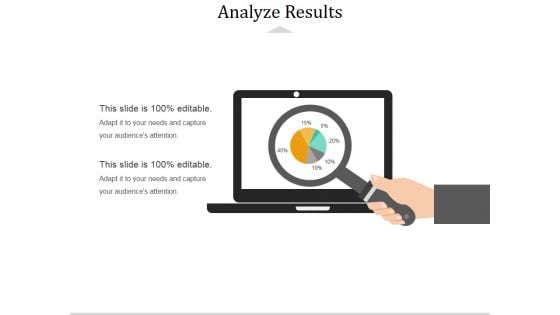
This is a analyze results ppt powerpoint presentation professional guide. This is a two stage process. The stages in this process are magnifier, search, marketing, strategy, analysis, business.
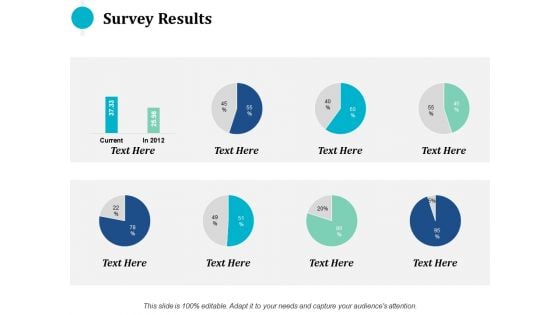
survey results ppt powerpoint presentation pictures guidelines
This is a survey results ppt powerpoint presentation pictures guidelines. This is a eight stage process. The stages in this process are finance, marketing, management, investment, analysis.
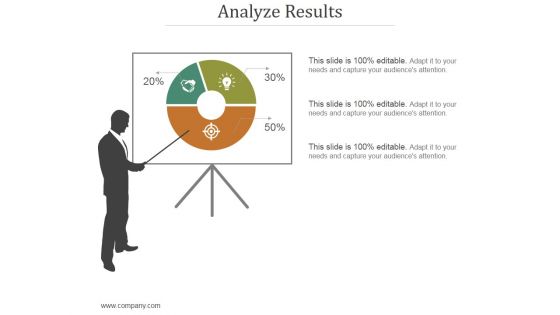
Analyze Results Ppt PowerPoint Presentation Guide
This is a analyze results ppt powerpoint presentation guide. This is a three stage process. The stages in this process are icon, percentage, finance, man, present.

Results In Higher Quality Powerpoint Presentation Examples
This is a results in higher quality powerpoint presentation examples. This is a three stage process. The stages in this process are helps prevent changes, results in higher quality, role identification.


 Continue with Email

 Home
Home


