Business Snapshot
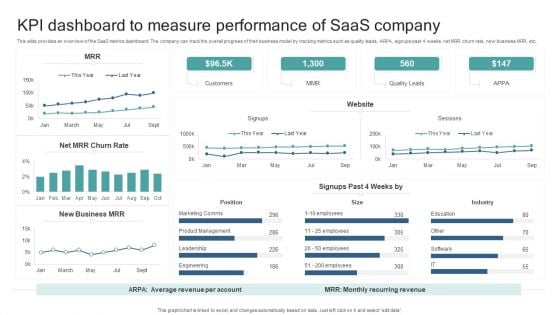
KPI Dashboard To Measure Performance Of Saas Company Introduction PDF
This slide provides an overview of the SaaS metrics dashboard. The company can track the overall progress of their business model by tracking metrics such as quality leads, ARPA, signups past 4 weeks, net MRR churn rate, new business MRR, etc. Pitch your topic with ease and precision using this KPI Dashboard To Measure Performance Of Saas Company Introduction PDF. This layout presents information on Industry, Position, Customers, Quality Leads. It is also available for immediate download and adjustment. So, changes can be made in the color, design, graphics or any other component to create a unique layout.
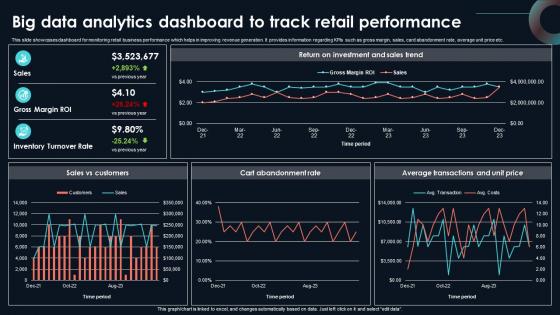
Big Data Analytics Dashboard To Track Developing Strategic Insights Using Big Data Analytics SS V
This slide showcases dashboard for monitoring retail business performance which helps in improving revenue generation. It provides information regarding KPIs such as gross margin, sales, card abandonment rate, average unit price etc. If your project calls for a presentation, then Slidegeeks is your go-to partner because we have professionally designed, easy-to-edit templates that are perfect for any presentation. After downloading, you can easily edit Big Data Analytics Dashboard To Track Developing Strategic Insights Using Big Data Analytics SS V and make the changes accordingly. You can rearrange slides or fill them with different images. Check out all the handy templates This slide showcases dashboard for monitoring retail business performance which helps in improving revenue generation. It provides information regarding KPIs such as gross margin, sales, card abandonment rate, average unit price etc.

Photos Of Past Events Ppt PowerPoint Presentation Infographics Outline
Presenting this set of slides with name photos of past events ppt powerpoint presentation infographics outline. The topics discussed in these slides are business, management, planning, strategy, marketing. This is a completely editable PowerPoint presentation and is available for immediate download. Download now and impress your audience.

Photos Of Past Events Ppt PowerPoint Presentation Summary Elements
Presenting this set of slides with name photos of past events ppt powerpoint presentation summary elements. The topics discussed in these slides are business, management, planning, strategy, marketing. This is a completely editable PowerPoint presentation and is available for immediate download. Download now and impress your audience.

Photos Of Past Events Ppt PowerPoint Presentation Ideas Portrait
Presenting this set of slides with name photos of past events ppt powerpoint presentation ideas portrait. The topics discussed in these slides are business, management, planning, strategy, marketing. This is a completely editable PowerPoint presentation and is available for immediate download. Download now and impress your audience.
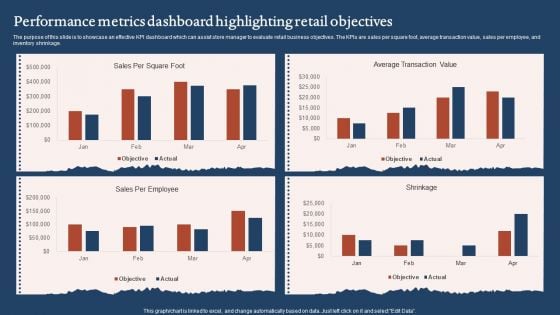
Performance Metrics Dashboard Highlighting Retail Objectives Sample PDF
The purpose of this slide is to showcase an effective KPI dashboard which can assist store manager to evaluate retail business objectives. The KPIs are sales per square foot, average transaction value, sales per employee, and inventory shrinkage. Pitch your topic with ease and precision using this Performance Metrics Dashboard Highlighting Retail Objectives Sample PDF. This layout presents information on Average Transaction Value, Sales Per Employee. It is also available for immediate download and adjustment. So, changes can be made in the color, design, graphics or any other component to create a unique layout.
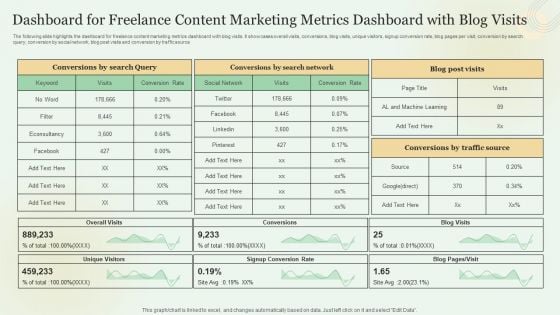
Dashboard For Freelance Content Marketing Metrics Dashboard With Blog Visits Guidelines PDF
Showcasing this set of slides titled Dashboard For Freelance Content Marketing Metrics Dashboard With Blog Visits Guidelines PDF. The topics addressed in these templates are Traffic Source, Signup Conversion Rate, Search Network. All the content presented in this PPT design is completely editable. Download it and make adjustments in color, background, font etc. as per your unique business setting. The following slide highlights the dashboard for freelance content marketing metrics dashboard with blog visits. It showcases overall visits, conversions, blog visits, unique visitors, signup conversion rate, blog pages per visit, conversion by search query, conversion by social network, blog post visits and conversion by traffic source
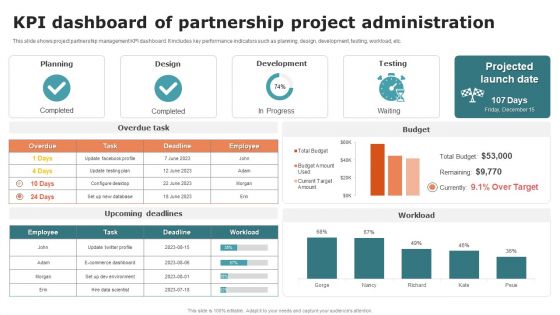
KPI Dashboard Of Partnership Project Administration Ideas PDF
This slide shows project partnership management KPI dashboard. It includes key performance indicators such as planning, design, development, testing, workload, etc. Showcasing this set of slides titled KPI Dashboard Of Partnership Project Administration Ideas PDF. The topics addressed in these templates are Planning, Design, Development. All the content presented in this PPT design is completely editable. Download it and make adjustments in color, background, font etc. as per your unique business setting.
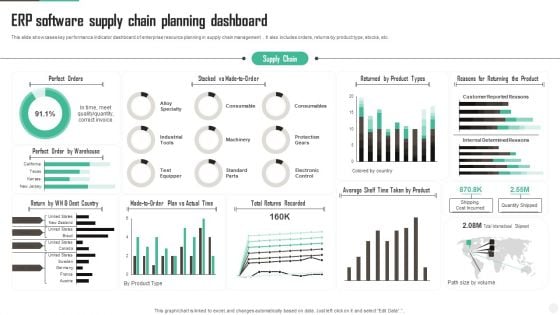
ERP Software Supply Chain Planning Dashboard Diagrams PDF
This slide showcases key performance indicator dashboard of enterprise resource planning in supply chain management . It also includes orders, returns by product type, stocks, etc. Showcasing this set of slides titled ERP Software Supply Chain Planning Dashboard Diagrams PDF Sample. The topics addressed in these templates are Perfect Orders, Dest Country, Actual Time. All the content presented in this PPT design is completely editable. Download it and make adjustments in color, background, font etc. as per your unique business setting.
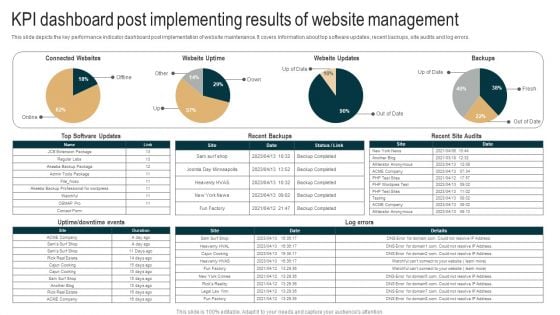
KPI Dashboard Post Implementing Results Of Website Management Themes PDF
This slide depicts the key performance indicator dashboard post implementation of website maintenance. It covers information about top software updates, recent backups, site audits and log errors. Showcasing this set of slides titled KPI Dashboard Post Implementing Results Of Website Management Themes PDF. The topics addressed in these templates are Website Updates, Website Uptime, Connected Websites. All the content presented in this PPT design is completely editable. Download it and make adjustments in color, background, font etc. as per your unique business setting.

Financial Evaluation Report For Construction Project Ppt PowerPoint Presentation Complete Deck With Slides
This Financial Evaluation Report For Construction Project Ppt PowerPoint Presentation Complete Deck With Slides is designed to help you retain your audiences attention. This content-ready PowerPoint Template enables you to take your audience on a journey and share information in a way that is easier to recall. It helps you highlight the crucial parts of your work so that the audience does not get saddled with information download. This fourty three slide PPT Deck comes prepared with the graphs and charts you could need to showcase your information through visuals. You only need to enter your own data in them. Download this editable PowerPoint Theme and walk into that meeting with confidence.

Introduction To Mobile SEM KPI Metrics Dashboard To Monitor Mobile SEO Performance Diagrams PDF
The purpose of this slide is to outline key performance indicator KPI dashboard which will assist the marketer to analyze mobile search engine optimization SEO performance. The key metrics mentioned in the slide are total sessions, search engine rankings etc. Take your projects to the next level with our ultimate collection of Introduction To Mobile SEM KPI Metrics Dashboard To Monitor Mobile SEO Performance Diagrams PDF. Slidegeeks has designed a range of layouts that are perfect for representing task or activity duration, keeping track of all your deadlines at a glance. Tailor these designs to your exact needs and give them a truly corporate look with your own brand colors they will make your projects stand out from the rest.

KPI Analytics Dashboard With Sourcing Raw Material Cycle Time Inspiration PDF
Following slide shows the key performance indicator KPI dashboard which will assist corporates to effectively monitor procurement process. The metrics are number of suppliers, contract compliance, average procurement cycle time, etc. Showcasing this set of slides titled KPI Analytics Dashboard With Sourcing Raw Material Cycle Time Inspiration PDF. The topics addressed in these templates are Kpi Analytics Dashboard, Sourcing Raw Material, Cycle Time. All the content presented in this PPT design is completely editable. Download it and make adjustments in color, background, font etc. as per your unique business setting.
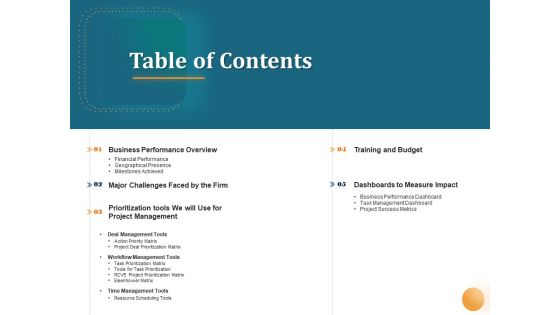
Project Portfolio Management PPM Table Of Contents Ppt Outline Information PDF
Presenting this set of slides with name project portfolio management ppm table of contents ppt outline information pdf. The topics discussed in these slides are business, performance, training, budget, dashboards. This is a completely editable PowerPoint presentation and is available for immediate download. Download now and impress your audience.

CRM For Realty Properties Ppt PowerPoint Presentation Complete Deck With Slides
Presenting this set of slides with name crm for realty properties ppt powerpoint presentation complete deck with slides. The topics discussed in these slides are dashboard, agenda, customer, business, communication. This is a completely editable PowerPoint presentation and is available for immediate download. Download now and impress your audience.

Advantage And Disadvantages Of Using Developing Strategic Insights Using Big Data Analytics SS V
This slide showcases benefits and drawbacks of implementing descriptive analytics in business. It includes elements such as complex datasets, inaccurate data, data correlations, performance assessment, data driven decision making etc. Create an editable Advantage And Disadvantages Of Using Developing Strategic Insights Using Big Data Analytics SS V that communicates your idea and engages your audience. Whether you are presenting a business or an educational presentation, pre-designed presentation templates help save time. Advantage And Disadvantages Of Using Developing Strategic Insights Using Big Data Analytics SS V is highly customizable and very easy to edit, covering many different styles from creative to business presentations. Slidegeeks has creative team members who have crafted amazing templates. So, go and get them without any delay. This slide showcases benefits and drawbacks of implementing descriptive analytics in business. It includes elements such as complex datasets, inaccurate data, data correlations, performance assessment, data driven decision making etc.

Data Analytics Management Ppt PowerPoint Presentation Complete Deck With Slides
Induce strategic thinking by presenting this complete deck. Enthrall your audience by deploying this thought provoking PPT deck. It can be downloaded in both standard and widescreen aspect ratios, thus making it a complete package to use and deploy. Convey your thoughts and actions using the sixty eight slides presented in this complete deck. Additionally, feel free to alter its components like color, graphics, design, etc, to create a great first impression. Grab it now by clicking on the download button below.
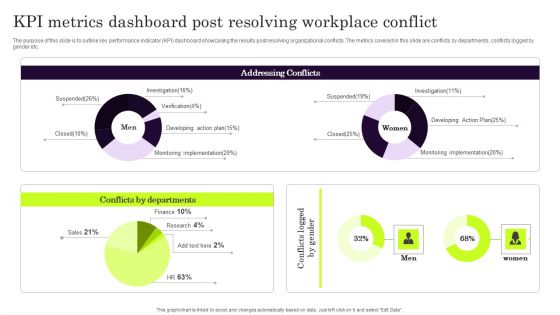
Kpi Metrics Dashboard Post Resolving Workplace Conflict Microsoft PDF
The purpose of this slide is to outline key performance indicator KPI dashboard showcasing the results post resolving organizational conflicts. The metrics covered in this slide are conflicts by departments, conflicts logged by gender etc. Do you know about Slidesgeeks Kpi Metrics Dashboard Post Resolving Workplace Conflict Microsoft PDF These are perfect for delivering any kind od presentation. Using it, create PowerPoint presentations that communicate your ideas and engage audiences. Save time and effort by using our pre designed presentation templates that are perfect for a wide range of topic. Our vast selection of designs covers a range of styles, from creative to business, and are all highly customizable and easy to edit. Download as a PowerPoint template or use them as Google Slides themes.
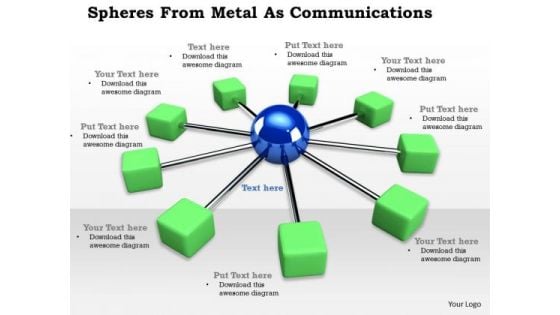
Stock Photo Blue Glossy Sphere With Cubes Communication PowerPoint Slide
Graphic of blue glossy sphere with green color cubes has been used in this image slide. This image slide depicts network and communication. Use this image slide in business, technology and social presentations. This image slide may also be used to display management. Create wonderful presentations using this image slide.
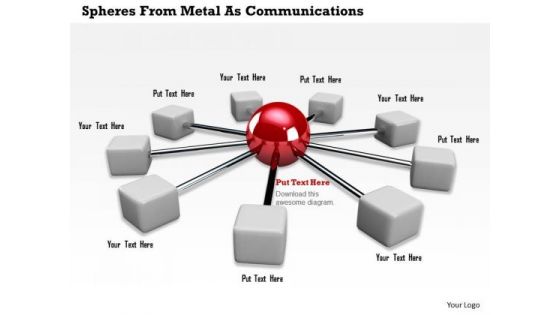
Stock Photo Sphere With Metal Cubes For Communication PowerPoint Slide
Graphic of blue glossy red sphere with green color cubes has been used in this image slide. This image slide depicts network and communication. Use this image slide in business, technology and social presentations. This image slide may also be used to display leadership, teamwork and management. Create wonderful presentations using this image slide.
Finance Metrics Dashboard Illustrating Gross And Operating Profit Margin Icons PDF
This graph or chart is linked to excel, and changes automatically based on data. Just left click on it and select edit data. Showcasing this set of slides titled Finance Metrics Dashboard Illustrating Gross And Operating Profit Margin Icons PDF. The topics addressed in these templates are Gross Profit Margin, Operating Profit Margin, Net Profit Margin. All the content presented in this PPT design is completely editable. Download it and make adjustments in color, background, font etc. as per your unique business setting.
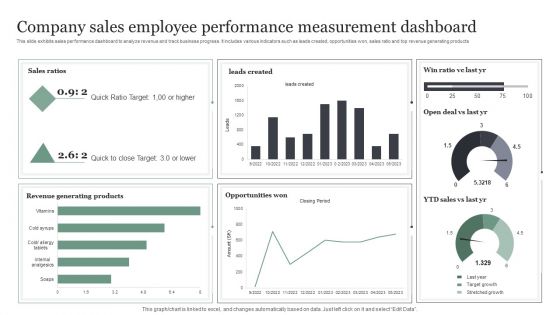
Company Sales Employee Performance Measurement Dashboard Information PDF
This slide exhibits sales performance dashboard to analyze revenue and track business progress. It includes various indicators such as leads created, opportunities won, sales ratio and top revenue generating products. Showcasing this set of slides titled Company Sales Employee Performance Measurement Dashboard Information PDF. The topics addressed in these templates are Quick Ratio Target, Opportunities Won, Revenue Generating Products. All the content presented in this PPT design is completely editable. Download it and make adjustments in color, background, font etc. as per your unique business setting.
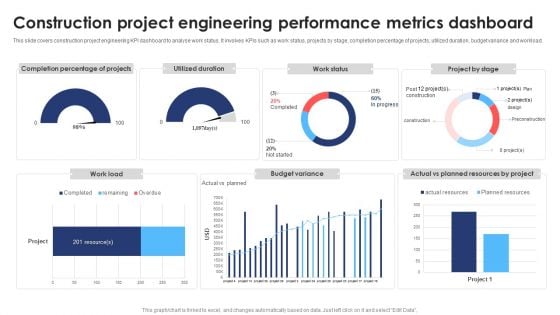
Construction Project Engineering Performance Metrics Dashboard Ideas PDF
This slide covers construction project engineering KPI dashboard to analyse work status. It involves KPIs such as work status, projects by stage, completion percentage of projects, utilized duration, budget variance and workload. Showcasing this set of slides titled Construction Project Engineering Performance Metrics Dashboard Ideas PDF. The topics addressed in these templates are Budget Variance, Resource, Project. All the content presented in this PPT design is completely editable. Download it and make adjustments in color, background, font etc. as per your unique business setting.
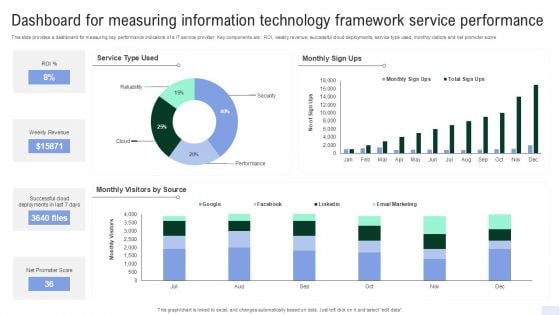
Dashboard For Measuring Information Technology Framework Service Performance Ideas PDF
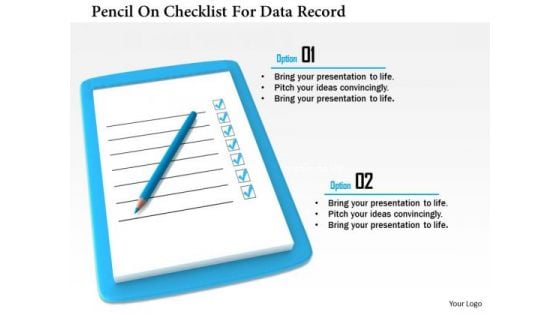
Stock Photo Pencil On Checklist For Data Record PowerPoint Slide
This Power Point image template has been designed with graphic of pencil and checklist. This image template contains the concept of data record. Show any kind of scheduling based on data with this unique image template and build quality presentation for your viewers.

Progress Assessment Outline Content Ppt PowerPoint Presentation Pictures Design Ideas PDF
Presenting this set of slides with name progress assessment outline content ppt powerpoint presentation pictures design ideas pdf. The topics discussed in these slides are bsc perspectives, bsc perspectives measurement, balanced scorecard implementation, bsc strategy map, scorecard departmental level, bsc execution framework, performance dashboard. This is a completely editable PowerPoint presentation and is available for immediate download. Download now and impress your audience.

KPI Dashboard For Network Asset Monitoring Clipart PDF
This slide covers KPI dashboard of network asset tracking report. It involves details such as audit summary, computers data, software summary, warranty summary and software compliance summary.Showcasing this set of slides titled KPI Dashboard For Network Asset Monitoring Clipart PDF The topics addressed in these templates are Commercial Software, Software Compliance, Warranty Summary All the content presented in this PPT design is completely editable. Download it and make adjustments in color, background, font etc. as per your unique business setting.
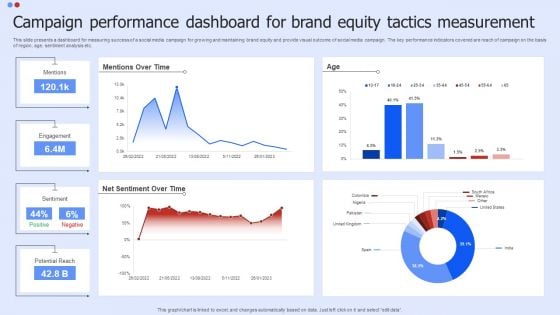
Campaign Performance Dashboard For Brand Equity Tactics Measurement Slides PDF
This slide presents a dashboard for measuring success of a social media campaign for growing and maintaining brand equity and provide visual outcome of social media campaign. The key performance indicators covered are reach of campaign on the basis of region, age, sentiment analysis etc. Showcasing this set of slides titled Campaign Performance Dashboard For Brand Equity Tactics Measurement Slides PDF. The topics addressed in these templates are Campaign Performance Dashboard For Brand Equity Tactics Measurement Slides PDF. All the content presented in this PPT design is completely editable. Download it and make adjustments in color, background, font etc. as per your unique business setting.

Data Interpretation And Analysis Playbook The Escalating Value Of Data And Analytics Template PDF
This template covers the facts about bigdata, business intelligence and data analytics. It also depicts that enterprise data and analytics solutions will drive growth and revenue, when optimized for different businesses. Presenting data interpretation and analysis playbook the escalating value of data and analytics template pdf to provide visual cues and insights. Share and navigate important information on seven stages that need your due attention. This template can be used to pitch topics like telecommunications, manufacturing, business, analytics, service. In addtion, this PPT design contains high resolution images, graphics, etc, that are easily editable and available for immediate download.
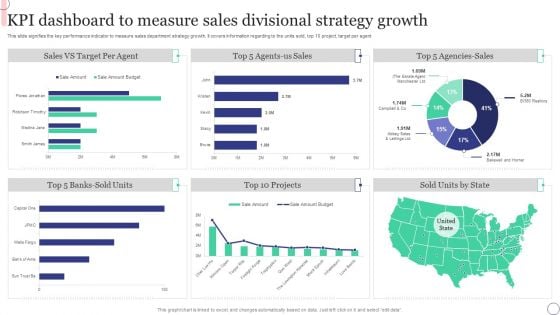
KPI Dashboard To Measure Sales Divisional Strategy Growth Formats PDF
This slide signifies the key performance indicator to measure sales department strategy growth. It covers information regarding to the units sold, top 10 project, target per agent. Showcasing this set of slides titled KPI Dashboard To Measure Sales Divisional Strategy Growth Formats PDF. The topics addressed in these templates are Sales, Target. All the content presented in this PPT design is completely editable. Download it and make adjustments in color, background, font etc. as per your unique business setting.
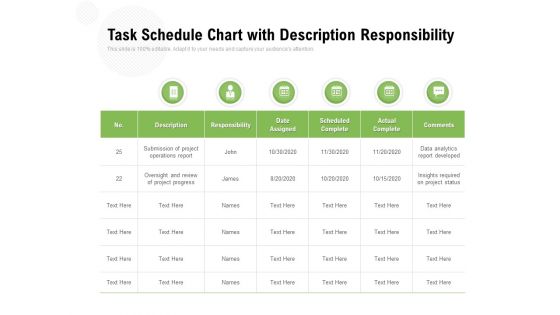
Task Schedule Chart With Description Responsibility Ppt PowerPoint Presentation Summary Professional
Presenting this set of slides with name task schedule chart with description responsibility ppt powerpoint presentation summary professional. The topics discussed in these slides are project operations report, data analytics report developed, project status, insights required, project progress. This is a completely editable PowerPoint presentation and is available for immediate download. Download now and impress your audience.
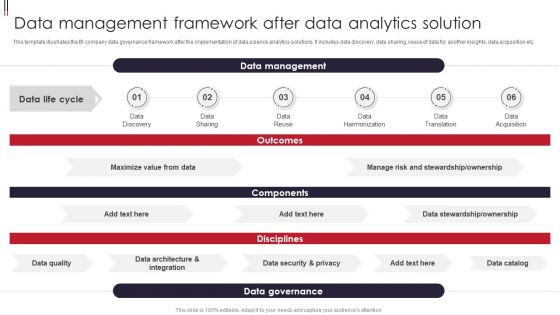
Information Visualizations Playbook Data Management Framework After Data Analytics Solution Formats PDF
Deliver an awe inspiring pitch with this creative Information Visualizations Playbook Data Management Framework After Data Analytics Solution Formats PDF bundle. Topics like Data Discovery, Data Sharing, Data Harmonization can be discussed with this completely editable template. It is available for immediate download depending on the needs and requirements of the user.
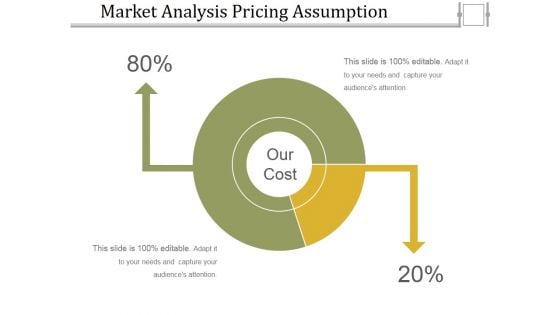
Market Analysis Pricing Assumption Ppt PowerPoint Presentation Professional Pictures
This is a market analysis pricing assumption ppt powerpoint presentation professional pictures. This is a two stage process. The stages in this process are business, marketing, analysis, our cost, process.
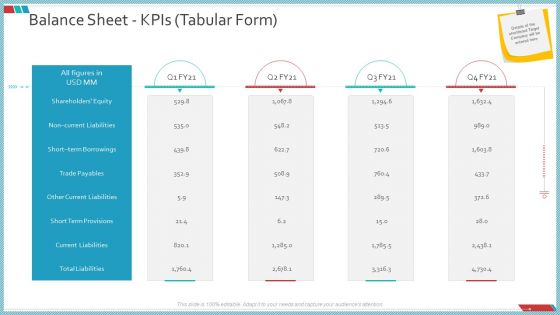
Enterprise Action Plan For Growth Balance Sheet Kpis Tabular Form Pictures PDF
Deliver and pitch your topic in the best possible manner with this enterprise action plan for growth balance sheet kpis tabular form pictures pdf. Use them to share invaluable insights on shareholders equity, other current liabilities, short term provisions and impress your audience. This template can be altered and modified as per your expectations. So, grab it now.

Utilizing Agile Methodology In Data Transformation Project IT What Will Be The Project Themes PDF
This slide displays organizations data conversion project structure which is categorized into three stages namely data, documents and coding. Deliver an awe inspiring pitch with this creative utilizing agile methodology in data transformation project it what will be the project themes pdf bundle. Topics like data quality, optimization, data report, project documents can be discussed with this completely editable template. It is available for immediate download depending on the needs and requirements of the user.
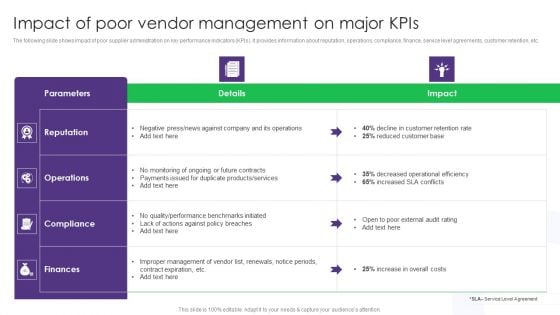
Impact Of Poor Vendor Management On Major Kpis Vendor Management System Deployment Elements PDF
The following slide shows impact of poor supplier administration on key performance indicators KPIs. It provides information about reputation, operations, compliance, finance, service level agreements, customer retention, etc. Present like a pro with Impact Of Poor Vendor Management On Major Kpis Vendor Management System Deployment Elements PDF Create beautiful presentations together with your team, using our easy-to-use presentation slides. Share your ideas in real-time and make changes on the fly by downloading our templates. So whether you are in the office, on the go, or in a remote location, you can stay in sync with your team and present your ideas with confidence. With Slidegeeks presentation got a whole lot easier. Grab these presentations today.
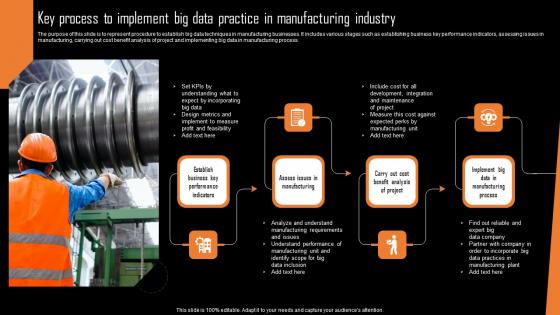
Key Process To Implement Big Data Practice In Manufacturing Industry Diagrams Pdf
The purpose of this slide is to represent procedure to establish big data techniques in manufacturing businesses. It includes various stages such as establishing business key performance indicators, assessing issues in manufacturing, carrying out cost benefit analysis of project and implementing big data in manufacturing process.Showcasing this set of slides titled Key Process To Implement Big Data Practice In Manufacturing Industry Diagrams Pdf The topics addressed in these templates are Expect Incorporating, Understand Performance, Manufacturing Plant All the content presented in this PPT design is completely editable. Download it and make adjustments in color, background, font etc. as per your unique business setting. The purpose of this slide is to represent procedure to establish big data techniques in manufacturing businesses. It includes various stages such as establishing business key performance indicators, assessing issues in manufacturing, carrying out cost benefit analysis of project and implementing big data in manufacturing process.
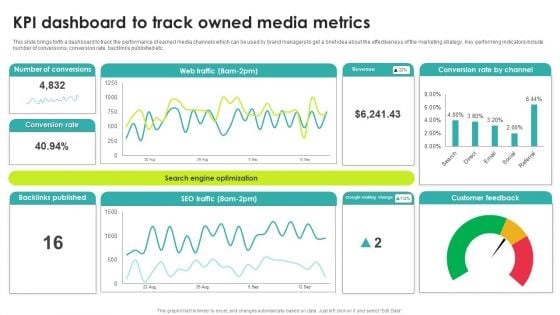
Kpi Dashboard To Track Owned Media Metrics Rules PDF
This slide brings forth a dashboard to track the performance of earned media channels which can be used by brand managers to get a brief idea about the effectiveness of the marketing strategy. Key performing indicators include number of conversions, conversion rate, backlinks published etc. Pitch your topic with ease and precision using this Kpi Dashboard To Track Owned Media Metrics Rules PDF. This layout presents information on Conversions, Backlinks Published, Metrics. It is also available for immediate download and adjustment. So, changes can be made in the color, design, graphics or any other component to create a unique layout.
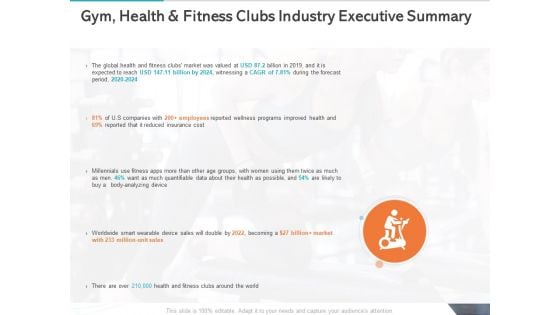
Gym Health And Fitness Market Industry Report Gym Health And Fitness Clubs Industry Executive Summary Ppt Layouts Microsoft PDF
Presenting this set of slides with name gym health and fitness market industry report gym health and fitness clubs industry executive summary ppt layouts microsoft pdf. The topics discussed in these slides are quantifiable data, market, insurance cost, health possible. This is a completely editable PowerPoint presentation and is available for immediate download. Download now and impress your audience.
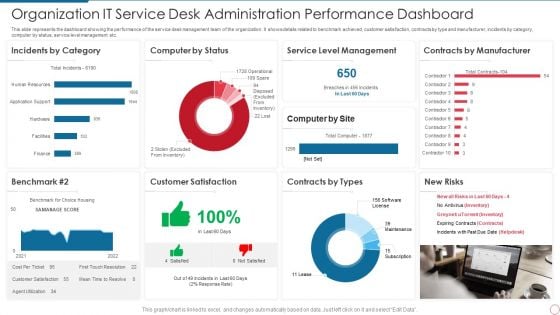
Organization IT Service Desk Administration Performance Dashboard Infographics PDF
This slide represents the dashboard showing the performance of the service desk management team of the organization. It shows details related to benchmark achieved, customer satisfaction, contracts by type and manufacturer, incidents by category, computer by status, service level management etc. Showcasing this set of slides titled Organization IT Service Desk Administration Performance Dashboard Infographics PDF. The topics addressed in these templates are Service, Management, Manufacturer. All the content presented in this PPT design is completely editable. Download it and make adjustments in color, background, font etc. as per your unique business setting.
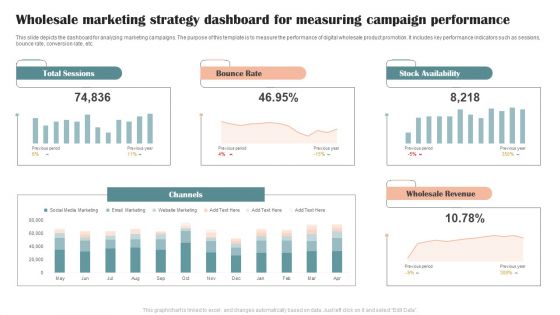
Wholesale Marketing Strategy Dashboard For Measuring Campaign Performance Graphics PDF
This slide depicts the dashboard for analyzing marketing campaigns. The purpose of this template is to measure the performance of digital wholesale product promotion. It includes key performance indicators such as sessions, bounce rate, conversion rate, etc. Showcasing this set of slides titled Wholesale Marketing Strategy Dashboard For Measuring Campaign Performance Graphics PDF. The topics addressed in these templates are Total Sessions, Bounce Rate, Stock Availability. All the content presented in this PPT design is completely editable. Download it and make adjustments in color, background, font etc. as per your unique business setting.
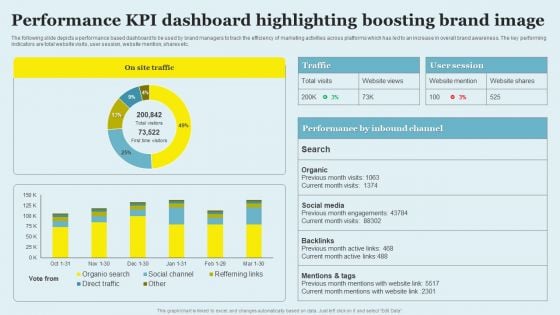
Performance KPI Dashboard Highlighting Boosting Brand Image Sample PDF
The following slide depicts a performance based dashboard to be used by brand managers to track the efficiency of marketing activities across platforms which has led to an increase in overall brand awareness. The key performing indicators are total website visits, user session, website mention, shares etc. Showcasing this set of slides titled Performance KPI Dashboard Highlighting Boosting Brand Image Sample PDF. The topics addressed in these templates are Social Media, Backlinks, Mentions Tags. All the content presented in this PPT design is completely editable. Download it and make adjustments in color, background, font etc. as per your unique business setting.
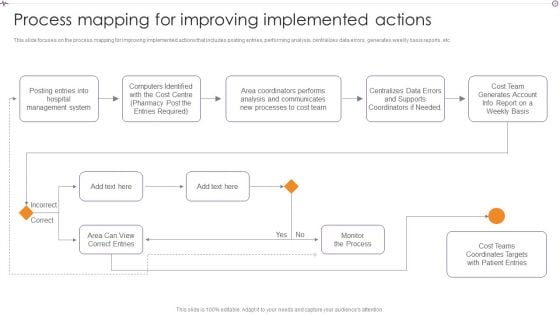
Advances In Healthcare Management System Process Mapping For Improving Implemented Actions Pictures PDF
This slide focuses on the process mapping for improving implemented actions that includes posting entries, performing analysis, centralizes data errors, generates weekly basis reports, etc. Deliver an awe inspiring pitch with this creative Advances In Healthcare Management System Process Mapping For Improving Implemented Actions Pictures PDF bundle. Topics like Management System, Analysis And Communicates, Cost Team can be discussed with this completely editable template. It is available for immediate download depending on the needs and requirements of the user.
Project Deliverables Administration Outline Content Ppt Icon Styles PDF
Deliver and pitch your topic in the best possible manner with this project deliverables administration outline content ppt icon styles pdf. Use them to share invaluable insights on introduction, plan, scope management, project charter, work breakdown structure, control and validate scope, kpis and dashboards and impress your audience. This template can be altered and modified as per your expectations. So, grab it now.
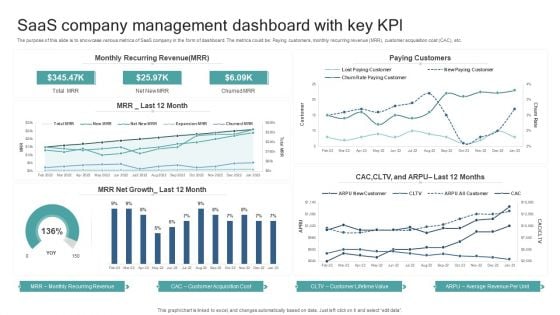
Saas Company Management Dashboard With Key Kpl Template PDF
The purpose of this slide is to showcase various metrics of SaaS company in the form of dashboard. The metrics could be, Paying customers, monthly recurring revenue MRR, customer acquisition cost CAC, etc. Showcasing this set of slides titled Saas Company Management Dashboard With Key Kpl Template PDF. The topics addressed in these templates are Monthly Recurring Revenue, Customer Acquisition Cost, Customer Lifetime Value, Average Revenue Per Unit. All the content presented in this PPT design is completely editable. Download it and make adjustments in color, background, font etc. as per your unique business setting.
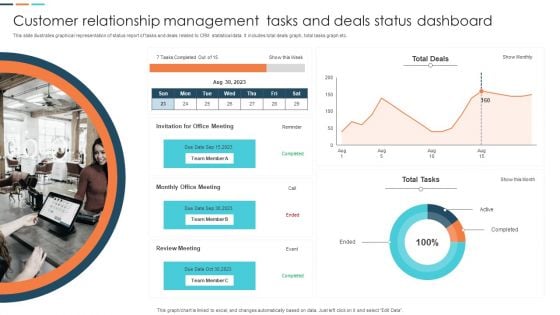
Customer Relationship Management Tasks And Deals Status Dashboard Background PDF
This slide illustrates graphical representation of status report of tasks and deals related to CRM statistical data. It includes total deals graph, total tasks graph etc. Showcasing this set of slides titled Customer Relationship Management Tasks And Deals Status Dashboard Background PDF. The topics addressed in these templates are Invitation, Team Member, Customer Relationship Management. All the content presented in this PPT design is completely editable. Download it and make adjustments in color, background, font etc. as per your unique business setting.
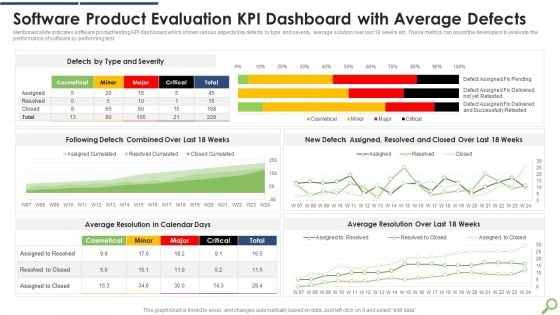
Software Product Evaluation KPI Dashboard With Average Defects Infographics PDF
Mentioned slide indicates software product testing KPI dashboard which shows various aspects like defects by type and severity, average solution over last 18 weeks etc. These metrics can assist the developers to evaluate the performance of software by performing test.Showcasing this set of slides titled Software Product Evaluation KPI Dashboard With Average Defects Infographics PDF The topics addressed in these templates are Software Product, Evaluation Dashboard, Average Defects All the content presented in this PPT design is completely editable. Download it and make adjustments in color, background, font etc. as per your unique business setting.
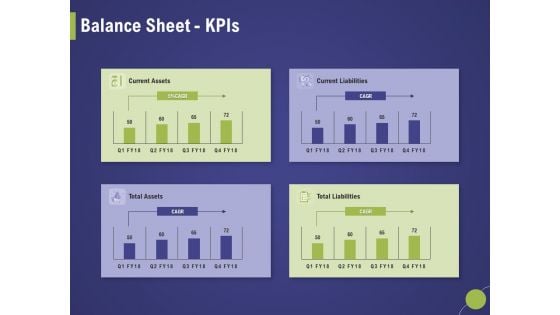
Firm Capability Assessment Balance Sheet Kpis Ppt Gallery Display PDF
Presenting this set of slides with name firm capability assessment balance sheet kpis ppt gallery display pdf. The topics discussed in these slides are current liabilities, trade payables, shareholders equity, short term provisions, other current liabilities, short term borrowings. This is a completely editable PowerPoint presentation and is available for immediate download. Download now and impress your audience.
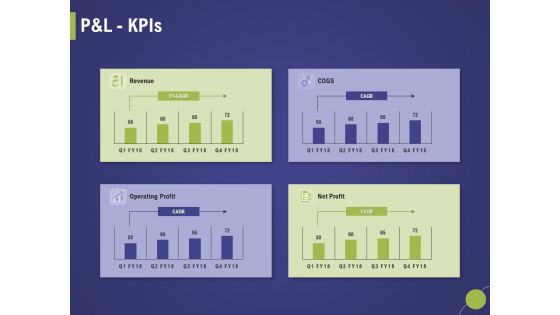
Firm Capability Assessment Pandl Kpis Ppt Inspiration Model PDF
Presenting this set of slides with name firm capability assessment pandl kpis ppt inspiration model pdf. The topics discussed in these slides are expenses, net sales, other income, financing cost, depreciation expense, profit before tax. This is a completely editable PowerPoint presentation and is available for immediate download. Download now and impress your audience.
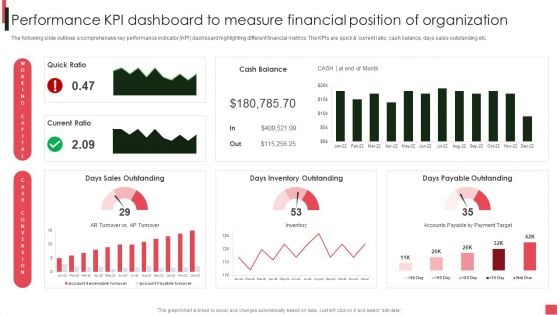
Overview Of Organizational Performance Kpi Dashboard To Measure Financial Position Sample PDF
The following slide outlines a comprehensive key performance indicator KPI dashboard highlighting different financial metrics. The KPIs are quick and current ratio, cash balance, days sales outstanding etc. Welcome to our selection of the Overview Of Organizational Performance Kpi Dashboard To Measure Financial Position Sample PDF. These are designed to help you showcase your creativity and bring your sphere to life. Planning and Innovation are essential for any business that is just starting out. This collection contains the designs that you need for your everyday presentations. All of our PowerPoints are 100 percent editable, so you can customize them to suit your needs. This multi-purpose template can be used in various situations. Grab these presentation templates today.
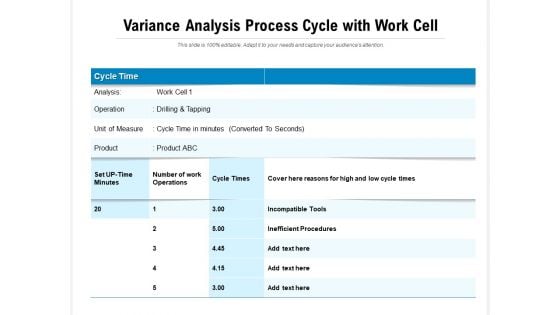
Variance Analysis Process Cycle With Work Cell Ppt PowerPoint Presentation Pictures Objects PDF
Pitch your topic with ease and precision using this variance analysis process cycle with work cell ppt powerpoint presentation pictures objects pdf. This layout presents information on cycle time, analysis, operation, unit of measure, product. It is also available for immediate download and adjustment. So, changes can be made in the color, design, graphics or any other component to create a unique layout.
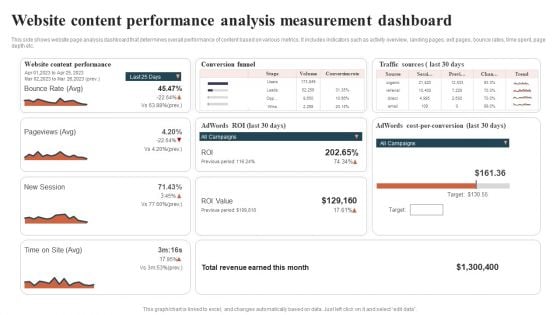
Website Content Performance Analysis Measurement Dashboard Guidelines PDF
This side shows website page analysis dashboard that determines overall performance of content based on various metrics. It includes indicators such as activity overview, landing pages, exit pages, bounce rates, time spent, page depth etc. Showcasing this set of slides titled Website Content Performance Analysis Measurement Dashboard Guidelines PDF. The topics addressed in these templates are Conversion Funnel, Traffic Sources, Total Revenue. All the content presented in this PPT design is completely editable. Download it and make adjustments in color, background, font etc. as per your unique business setting.
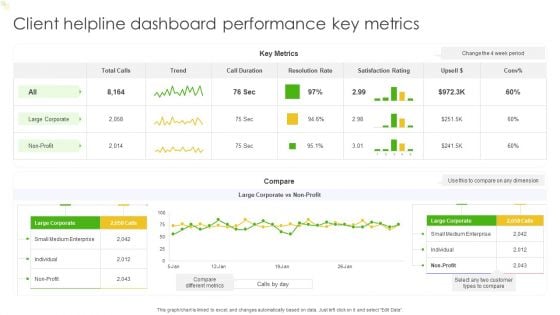
Client Helpline Dashboard Performance Key Metrics Ppt Outline Deck PDF
This graph or chart is linked to excel, and changes automatically based on data. Just left click on it and select Edit Data. Pitch your topic with ease and precision using this Client Helpline Dashboard Performance Key Metrics Ppt Outline Deck PDF. This layout presents information on Key Metrics, Trend, Compare. It is also available for immediate download and adjustment. So, changes can be made in the color, design, graphics or any other component to create a unique layout.

Internal Audit Metrics Analysis Dashboard Ppt Ideas Clipart Images PDF
This slide depicts the key performance indicator dashboard and status for internal audit. It includes information related to the audit observations and plan status. Pitch your topic with ease and precision using this Internal Audit Metrics Analysis Dashboard Ppt Ideas Clipart Images PDF. This layout presents information on Quarterly Audit Observations, Financial Year Internal, Audit Plan Status. It is also available for immediate download and adjustment. So, changes can be made in the color, design, graphics or any other component to create a unique layout.
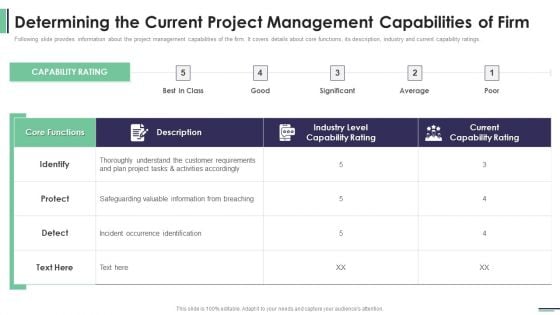
Machine Learning Development And Operations Cycle IT Determining The Current Project Diagrams PDF
Following slide provides information about the project management capabilities of the firm. It covers details about core functions, its description, industry and current capability ratings.Deliver an awe inspiring pitch with this creative machine learning development and operations cycle it determining the current project diagrams pdf bundle. Topics like industry level capability rating, current capability rating, safeguarding valuable information can be discussed with this completely editable template. It is available for immediate download depending on the needs and requirements of the user.
HR Recruitment Dashboard Kpis With Active Pipeline Ppt Icon Slide Portrait PDF
This slide showcases the recruitment dashboard metrics to know monthly hiring rate. It include KPIs like sources, decline reasons, active pipeline, recruitment funnel. Showcasing this set of slides titled HR Recruitment Dashboard Kpis With Active Pipeline Ppt Icon Slide Portrait PDF. The topics addressed in these templates are Recruitment Funnel, Monthly Metrics, Application Sources. All the content presented in this PPT design is completely editable. Download it and make adjustments in color, background, font etc. as per your unique business setting.
SMS Marketing Automated Campaigns Performance Tracking Dashboard Formats PDF
This slide represents the key metrics dashboard to track, monitor and analyze the performance of SMS marketing automated campaign. It includes details related to KPIs such as new subscribers, responses received, total earned and top live automations etc. Are you searching for a SMS Marketing Automated Campaigns Performance Tracking Dashboard Formats PDF that is uncluttered, straightforward, and original. Its easy to edit, and you can change the colors to suit your personal or business branding. For a presentation that expresses how much effort youve put in, this template is ideal. With all of its features, including tables, diagrams, statistics, and lists, its perfect for a business plan presentation. Make your ideas more appealing with these professional slides. Download SMS Marketing Automated Campaigns Performance Tracking Dashboard Formats PDF from Slidegeeks today.
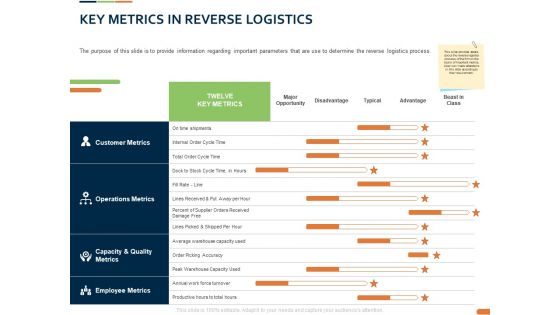
Closed Loop Supply Chain Management Key Metrics In Reverse Logistics Ppt Outline Design Templates PDF
Presenting this set of slides with name closed loop supply chain management key metrics in reverse logistics ppt outline design templates pdf. The topics discussed in these slides are customer metrics, operations metrics, capacity and quality metrics, employee metrics. This is a completely editable PowerPoint presentation and is available for immediate download. Download now and impress your audience.
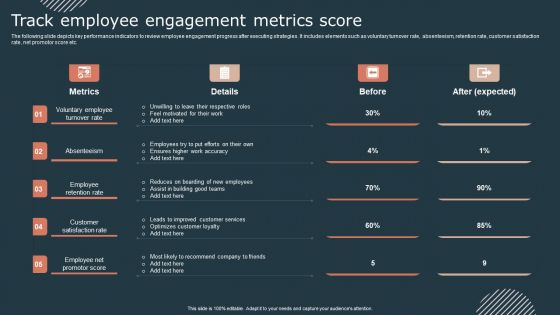
Effective Workforce Participation Action Planning Track Employee Engagement Metrics Score Background PDF
The following slide depicts key performance indicators to review employee engagement progress after executing strategies. It includes elements such as voluntary turnover rate, absenteeism, retention rate, customer satisfaction rate, net promotor score etc. Find highly impressive Effective Workforce Participation Action Planning Track Employee Engagement Metrics Score Background PDF on Slidegeeks to deliver a meaningful presentation. You can save an ample amount of time using these presentation templates. No need to worry to prepare everything from scratch because Slidegeeks experts have already done a huge research and work for you. You need to download Effective Workforce Participation Action Planning Track Employee Engagement Metrics Score Background PDF for your upcoming presentation. All the presentation templates are 100 percent editable and you can change the color and personalize the content accordingly. Download now.
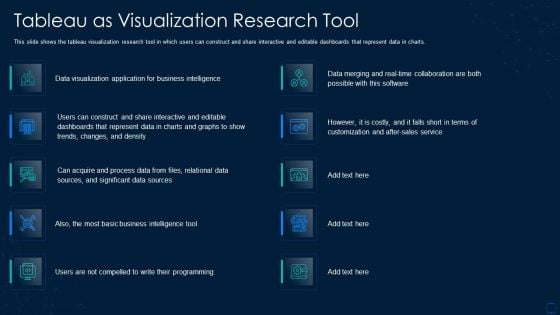
Graphical Representation Of Research IT Tableau As Visualization Research Tool Graphics PDF
This slide shows the tableau visualization research tool in which users can construct and share interactive and editable dashboards that represent data in charts. Deliver and pitch your topic in the best possible manner with this graphical representation of research it tableau as visualization research tool graphics pdf. Use them to share invaluable insights on process data, sources, sales, application and impress your audience. This template can be altered and modified as per your expectations. So, grab it now.


 Continue with Email

 Home
Home


