Business Snapshot

Outline For Devops Benefits Culture Performance Indicators And Implementation Roadmap Ppt PowerPoint Presentation Complete With Slides
Pitch yourself both in house and outside by utilizing this complete deck. This outline for devops benefits culture performance indicators and implementation roadmap ppt powerpoint presentation complete with slides focuses on key fundamentals of the topic, displayed using different slides. With a total of fifty three slides, this template is the best tool you can use to persuade your audience. It will not only help you create great presentations but also induce strategic thinking because of its well researched content and graphics. You can easily personalize any of the elements to suit your unique business setting. Additionally, it can be saved in PNG, JPG, and PDF formats to save your time and resources.
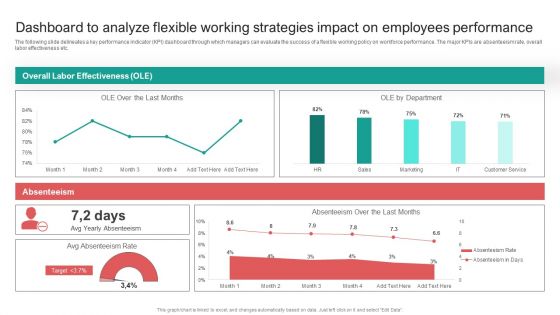
Dashboard To Analyze Flexible Working Strategies Impact On Employees Performance Infographics PDF
The following slide delineates a key performance indicator KPI dashboard through which managers can evaluate the success of a flexible working policy on workforce performance. The major KPIs are absenteeism rate, overall labor effectiveness etc. Presenting this PowerPoint presentation, titled Dashboard To Analyze Flexible Working Strategies Impact On Employees Performance Infographics PDF, with topics curated by our researchers after extensive research. This editable presentation is available for immediate download and provides attractive features when used. Download now and captivate your audience. Presenting this Dashboard To Analyze Flexible Working Strategies Impact On Employees Performance Infographics PDF. Our researchers have carefully researched and created these slides with all aspects taken into consideration. This is a completely customizable Dashboard To Analyze Flexible Working Strategies Impact On Employees Performance Infographics PDF that is available for immediate downloading. Download now and make an impact on your audience. Highlight the attractive features available with our PPTs.
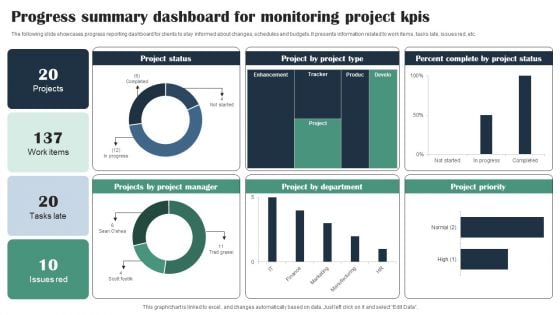
Progress Summary Dashboard For Monitoring Project Kpis Infographics PDF
The following slide showcases progress reporting dashboard for clients to stay informed about changes, schedules and budgets. It presents information related to work items, tasks late, issues red, etc. Pitch your topic with ease and precision using this Progress Summary Dashboard For Monitoring Project Kpis Infographics PDF. This layout presents information on Project Status, Project Manager, Project Type, Percent Complete. It is also available for immediate download and adjustment. So, changes can be made in the color, design, graphics or any other component to create a unique layout.
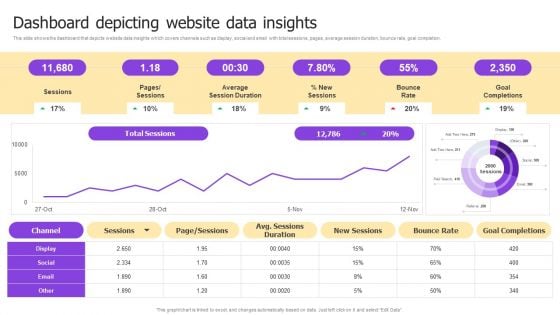
Implementing Brand Development Dashboard Depicting Website Data Insights Guidelines PDF
This slide shows the dashboard that depicts website data insights which covers channels such as display, social and email with total sessions, pages, average session duration, bounce rate, goal completion. Get a simple yet stunning designed Implementing Brand Development Dashboard Depicting Website Data Insights Guidelines PDF. It is the best one to establish the tone in your meetings. It is an excellent way to make your presentations highly effective. So, download this PPT today from Slidegeeks and see the positive impacts. Our easy-to-edit Implementing Brand Development Dashboard Depicting Website Data Insights Guidelines PDF can be your go-to option for all upcoming conferences and meetings. So, what are you waiting for Grab this template today.
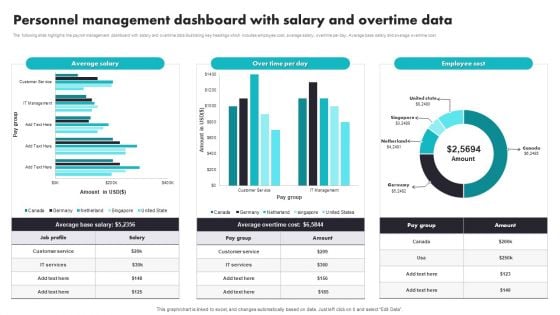
Personnel Management Dashboard With Salary And Overtime Data Ideas PDF
The following slide highlights the payroll management dashboard with salary and overtime data illustrating key headings which includes employee cost, average salary, overtime per day, Average base salary and average overtime cost. Pitch your topic with ease and precision using this Personnel Management Dashboard With Salary And Overtime Data Ideas PDF. This layout presents information on Average, Customer Service, Cost. It is also available for immediate download and adjustment. So, changes can be made in the color, design, graphics or any other component to create a unique layout.
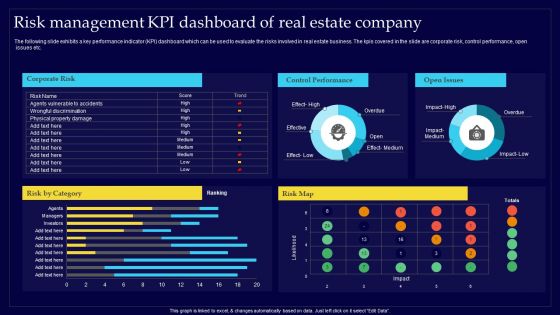
Executing Risk Mitigation Risk Management KPI Dashboard Of Real Estate Company Portrait PDF
The following slide exhibits a key performance indicator KPI dashboard which can be used to evaluate the risks involved in real estate business. The kpis covered in the slide are corporate risk, control performance, open issues etc. This modern and well-arranged Executing Risk Mitigation Risk Management KPI Dashboard Of Real Estate Company Portrait PDF provides lots of creative possibilities. It is very simple to customize and edit with the Powerpoint Software. Just drag and drop your pictures into the shapes. All facets of this template can be edited with Powerpoint, no extra software is necessary. Add your own material, put your images in the places assigned for them, adjust the colors, and then you can show your slides to the world, with an animated slide included.
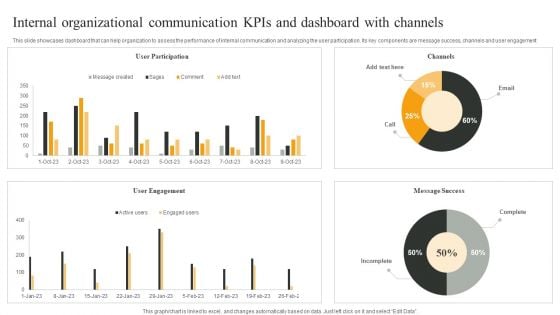
Internal Organizational Communication Kpis And Dashboard With Channels Infographics PDF
This slide showcases dashboard that can help organization to assess the performance of internal communication and analyzing the user participation. Its key components are message success, channels and user engagement. Pitch your topic with ease and precision using this Internal Organizational Communication Kpis And Dashboard With Channels Infographics PDF. This layout presents information on User Participation, User Engagement, Message Success. It is also available for immediate download and adjustment. So, changes can be made in the color, design, graphics or any other component to create a unique layout.
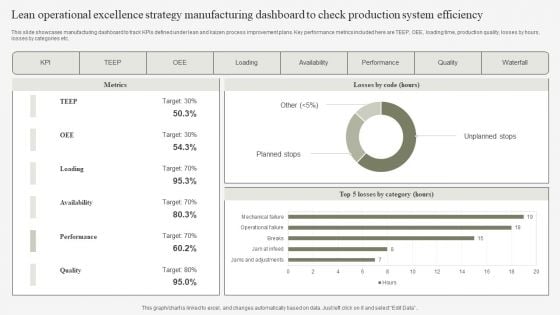
Lean Operational Excellence Strategy Manufacturing Dashboard To Check Production System Efficiency Pictures PDF
This slide showcases manufacturing dashboard to track KPIs defined under lean and kaizen process improvement plans. Key performance metrics included here are TEEP, OEE, loading time, production quality, losses by hours, losses by categories etc. Pitch your topic with ease and precision using this Lean Operational Excellence Strategy Manufacturing Dashboard To Check Production System Efficiency Pictures PDF. This layout presents information on Loading, Availability, Performance. It is also available for immediate download and adjustment. So, changes can be made in the color, design, graphics or any other component to create a unique layout.
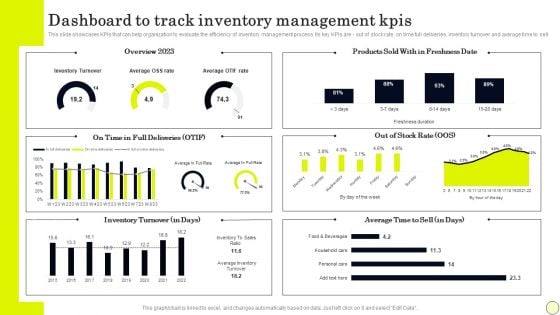
Dashboard To Track Inventory Management Kpis Portrait PDF
This slide showcases KPIs that can help organization to evaluate the efficiency of inventory management process. Its key KPIs are out of stock rate, on time full deliveries, inventory turnover and average time to sell. Here you can discover an assortment of the finest PowerPoint and Google Slides templates. With these templates, you can create presentations for a variety of purposes while simultaneously providing your audience with an eye catching visual experience. Download Dashboard To Track Inventory Management Kpis Portrait PDF to deliver an impeccable presentation. These templates will make your job of preparing presentations much quicker, yet still, maintain a high level of quality. Slidegeeks has experienced researchers who prepare these templates and write high quality content for you. Later on, you can personalize the content by editing the Dashboard To Track Inventory Management Kpis Portrait PDF.
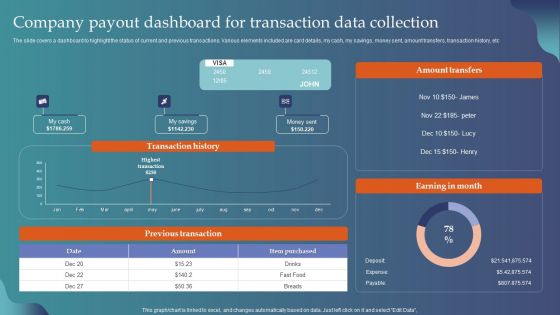
Company Payout Dashboard For Transaction Data Collection Themes PDF
The slide covers a dashboard to highlight the status of current and previous transactions. Various elements included are card details, my cash, my savings, money sent, amount transfers, transaction history, etc. Pitch your topic with ease and precision using this Company Payout Dashboard For Transaction Data Collection Themes PDF. This layout presents information on Amount Transfers, Earning Month, Previous Transaction. It is also available for immediate download and adjustment. So, changes can be made in the color, design, graphics or any other component to create a unique layout.
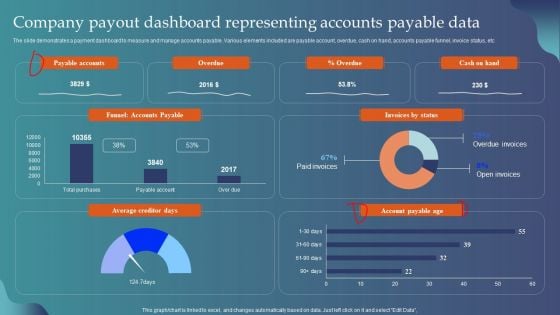
Company Payout Dashboard Representing Accounts Payable Data Introduction PDF
The slide demonstrates a payment dashboard to measure and manage accounts payable. Various elements included are payable account, overdue, cash on hand, accounts payable funnel, invoice status, etc. Pitch your topic with ease and precision using this Company Payout Dashboard Representing Accounts Payable Data Introduction PDF. This layout presents information on Payable Accounts, Overdue, Invoices By Status, Account Payable Age. It is also available for immediate download and adjustment. So, changes can be made in the color, design, graphics or any other component to create a unique layout.
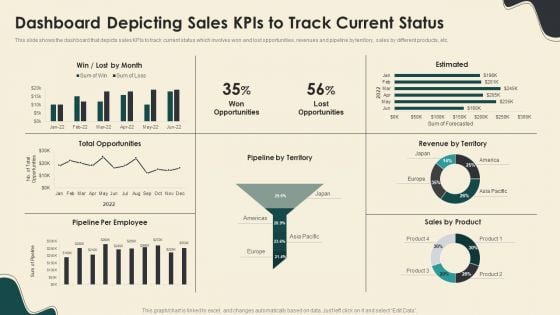
Dashboard Depicting Sales Kpis To Track Current Status Structure PDF
This slide shows the dashboard that depicts sales KPIs to track current status which involves won and lost opportunities, revenues and pipeline by territory, sales by different products, etc. Deliver and pitch your topic in the best possible manner with this Dashboard Depicting Sales Kpis To Track Current Status Structure PDF. Use them to share invaluable insights on Total Opportunities, Revenue By Territory, Sales By Product and impress your audience. This template can be altered and modified as per your expectations. So, grab it now.
Dashboard Tracking Essential Kpis For Ecommerce Performance Slides PDF
This slide provides information regarding essential KPIs for ecommerce performance dashboard tracking average bounce rate, new vs. old customers, channel revenue vs. channel acquisitions costs, channel revenue vs. sales, average conversion rate, etc. Deliver an awe inspiring pitch with this creative Dashboard Tracking Essential Kpis For Ecommerce Performance Slides PDF bundle. Topics like Average Bounce Rate, Channel Acquisition Costs, Channel Revenue can be discussed with this completely editable template. It is available for immediate download depending on the needs and requirements of the user.
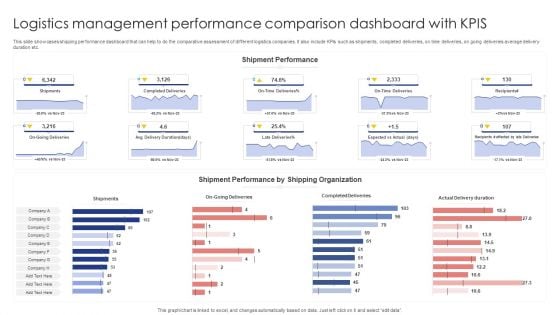
Logistics Management Performance Comparison Dashboard With Kpis Sample PDF
This slide showcases shipping performance dashboard that can help to do the comparative assessment of different logistics companies. It also include KPIs such as shipments, completed deliveries, on time deliveries, on going deliveries average delivery duration etc. Pitch your topic with ease and precision using this Logistics Management Performance Comparison Dashboard With Kpis Sample PDF. This layout presents information on Shipments, Completed Deliveries, Actual Delivery Duration. It is also available for immediate download and adjustment. So, changes can be made in the color, design, graphics or any other component to create a unique layout.

HR Recruitment Dashboard Kpis With Open Positions Ppt Model Good PDF
Following slide showcases the recruitment dashboard metrics for measuring placement per department. It include KPIs like applications received by departments, applicant details, sources, time to hire. Pitch your topic with ease and precision using this HR Recruitment Dashboard Kpis With Open Positions Ppt Model Good PDF. This layout presents information on Offer Acceptance Ratio, Recruitment Funnel, Applicant Details. It is also available for immediate download and adjustment. So, changes can be made in the color, design, graphics or any other component to create a unique layout.
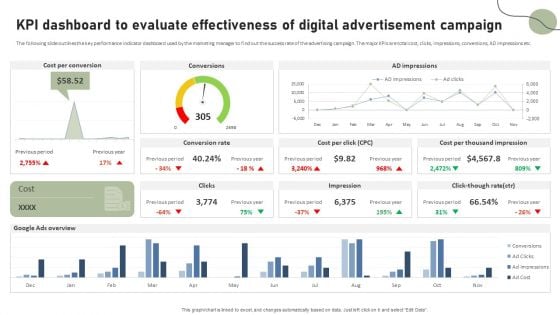
KPI Dashboard To Evaluate Effectiveness Of Digital Advertisement Campaign Pictures PDF
The following slide outlines the key performance indicator dashboard used by the marketing manager to find out the success rate of the advertising campaign. The major KPIs are total cost, clicks, impressions, conversions, AD impressions etc. Do you have to make sure that everyone on your team knows about any specific topic I yes, then you should give KPI Dashboard To Evaluate Effectiveness Of Digital Advertisement Campaign Pictures PDF a try. Our experts have put a lot of knowledge and effort into creating this impeccable KPI Dashboard To Evaluate Effectiveness Of Digital Advertisement Campaign Pictures PDF. You can use this template for your upcoming presentations, as the slides are perfect to represent even the tiniest detail. You can download these templates from the Slidegeeks website and these are easy to edit. So grab these today.

Dashboard Showing Emarketing Performance Digital Marketing Strategy Deployment Demonstration PDF
This slide focuses on the dashboard that shows the e-marketing performance such ad lead funnel, traffic sources, monthly leads and key metrics.Want to ace your presentation in front of a live audience Our Dashboard Showing Emarketing Performance Digital Marketing Strategy Deployment Demonstration PDF can help you do that by engaging all the users towards you.. Slidegeeks experts have put their efforts and expertise into creating these impeccable powerpoint presentations so that you can communicate your ideas clearly. Moreover, all the templates are customizable, and easy-to-edit and downloadable. Use these for both personal and commercial use.
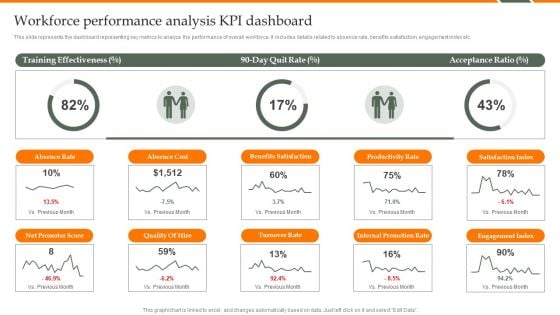
Human Resource Analytics Workforce Performance Analysis KPI Dashboard Structure PDF
This slide represents the dashboard representing key metrics to analyze the performance of overall workforce. It includes details related to absence rate, benefits satisfaction, engagement index etc. Find a pre-designed and impeccable Human Resource Analytics Workforce Performance Analysis KPI Dashboard Structure PDF. The templates can ace your presentation without additional effort. You can download these easy-to-edit presentation templates to make your presentation stand out from others. So, what are you waiting for Download the template from Slidegeeks today and give a unique touch to your presentation.
Website Leads Tracking Dashboard With Traffic Sources Infographics PDF
This slide showcases dashboard for lead generation that can help organziation to identify the traffic sources plus visitors and make changes in SEO of website. It also showcases key metrics that are bounce rate by week, visitors by user type, top channels by conversion, top campaign by conversion and top pages by conversion. Pitch your topic with ease and precision using this Website Leads Tracking Dashboard With Traffic Sources Infographics PDF. This layout presents information on Visitors User Type, Traffic Sources, Bounce Rate Week. It is also available for immediate download and adjustment. So, changes can be made in the color, design, graphics or any other component to create a unique layout.
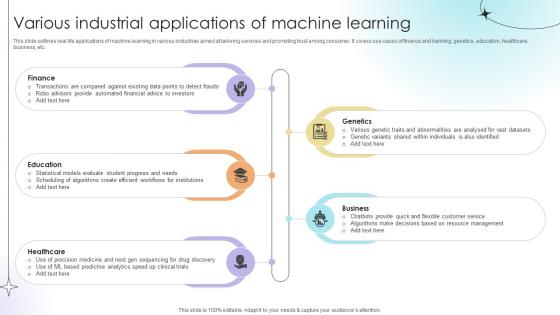
Various Industrial Applications Of Machine Learning Data Analytics SS V
This slide outlines real life applications of machine learning in various industries aimed at tailoring services and promoting trust among consumer. It covers use cases of finance and banking, genetics, education, healthcare, business, etc.Retrieve professionally designed Various Industrial Applications Of Machine Learning Data Analytics SS V to effectively convey your message and captivate your listeners. Save time by selecting pre-made slideshows that are appropriate for various topics, from business to educational purposes. These themes come in many different styles, from creative to corporate, and all of them are easily adjustable and can be edited quickly. Access them as PowerPoint templates or as Google Slides themes. You do not have to go on a hunt for the perfect presentation because Slidegeeks got you covered from everywhere. This slide outlines real life applications of machine learning in various industries aimed at tailoring services and promoting trust among consumer. It covers use cases of finance and banking, genetics, education, healthcare, business, etc.
KPI Dashboard Showing Warehouse Data And Fleet Status Icons PDF
Pitch your topic with ease and precision using this KPI Dashboard Showing Warehouse Data And Fleet Status Icons PDF This layout presents information on Deliveries By Country, Delivery Status, Profit By Country It is also available for immediate download and adjustment. So, changes can be made in the color, design, graphics or any other component to create a unique layout.
Warehouse Data KPI With Order Performance Dashboard Icons PDF
Pitch your topic with ease and precision using this Warehouse Data KPI With Order Performance Dashboard Icons PDF This layout presents information on Inventory Accuracy, Order Accuracy Europe, Total Accuracy It is also available for immediate download and adjustment. So, changes can be made in the color, design, graphics or any other component to create a unique layout.
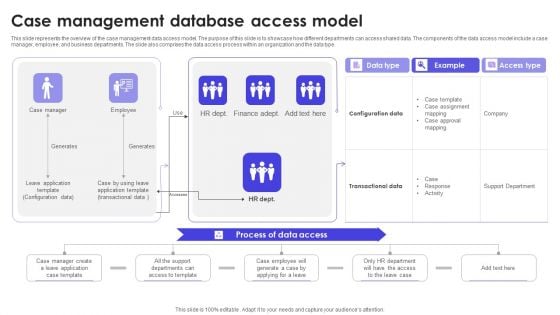
Case Management Database Access Model Download PDF
This slide represents the overview of the case management data access model. The purpose of this slide is to showcase how different departments can access shared data. The components of the data access model include a case manager, employee, and business departments. The slide also comprises the data access process within an organization and the data type. Showcasing this set of slides titled Case Management Database Access Model Download PDF. The topics addressed in these templates are Data Access, Example, Data Type. All the content presented in this PPT design is completely editable. Download it and make adjustments in color, background, font etc. as per your unique business setting.
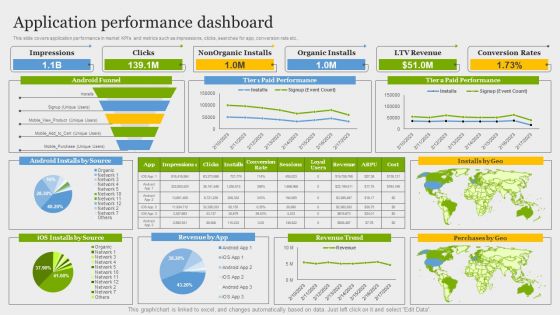
Online Application Development Application Performance Dashboard Information PDF
This slide covers application performance in market KPIs and metrics such as impressions, clicks, searches for app, conversion rate etc. Get a simple yet stunning designed Online Application Development Application Performance Dashboard Information PDF. It is the best one to establish the tone in your meetings. It is an excellent way to make your presentations highly effective. So, download this PPT today from Slidegeeks and see the positive impacts. Our easy to edit Online Application Development Application Performance Dashboard Information PDF can be your go to option for all upcoming conferences and meetings. So, what are you waiting for Grab this template today.

Predictive Analytics In The Age Of Big Data Ppt PowerPoint Presentation Complete Deck With Slides
Deploy this comprehensive Predictive Analytics In The Age Of Big Data Ppt PowerPoint Presentation Complete Deck With Slides to analyze how to innovatively carry forward your business with this seventy seven slide complete deck. There are also options galore if you want to key in your own data in this wonderful presentation, which as always is 100 percent editable and customizable. This template showcases visual elements of the business process to help you understand the many advantages of using presentation templates to spruce up your offerings and be on the top of the game. With the use of this presentation template, you prove yourself to be a champion of the new world of winning clients and the master of pitches that matter. Download now.

Checklist To Monitor IT Infrastructure Functional Areas Rules PDF
This slide provides information regarding the checklist to monitor IT infrastructure focus areas. The assessment checklist defines key activities for effective infrastructure management in terms of data and cloud storage, hardware and software capabilities, etc. Create an editable Checklist To Monitor IT Infrastructure Functional Areas Rules PDF that communicates your idea and engages your audience. Whether you are presenting a business or an educational presentation, pre-designed presentation templates help save time. Checklist To Monitor IT Infrastructure Functional Areas Rules PDF is highly customizable and very easy to edit, covering many different styles from creative to business presentations. Slidegeeks has creative team members who have crafted amazing templates. So, go and get them without any delay.
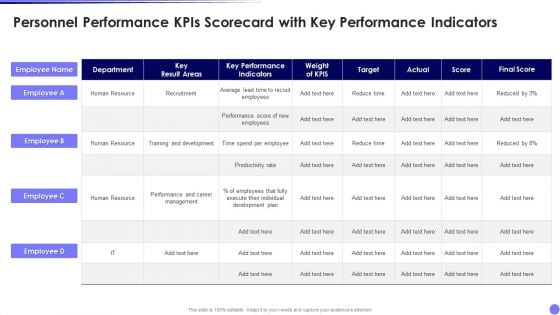
Personnel Performance Kpis Scorecard With Key Performance Indicators Designs PDF
Pitch your topic with ease and precision using this Personnel Performance Kpis Scorecard With Key Performance Indicators Designs PDF. This layout presents information on Key Performance Indicators, Target, Final Score, Employee. It is also available for immediate download and adjustment. So, changes can be made in the color, design, graphics or any other component to create a unique layout.

BI Technique For Data Informed Decisions Major Users Of Sap Analytics Cloud Suite Summary PDF
The following slide illustrates the major user of SAP Analytics Cloud suite which are business users and business intelligence seekers. It also contains details regarding the usage statistics of both the users. Crafting an eye catching presentation has never been more straightforward. Let your presentation shine with this tasteful yet straightforward BI Technique For Data Informed Decisions Major Users Of Sap Analytics Cloud Suite Summary PDF template. It offers a minimalistic and classy look that is great for making a statement. The colors have been employed intelligently to add a bit of playfulness while still remaining professional. Construct the ideal BI Technique For Data Informed Decisions Major Users Of Sap Analytics Cloud Suite Summary PDF that effortlessly grabs the attention of your audience Begin now and be certain to wow your customers.
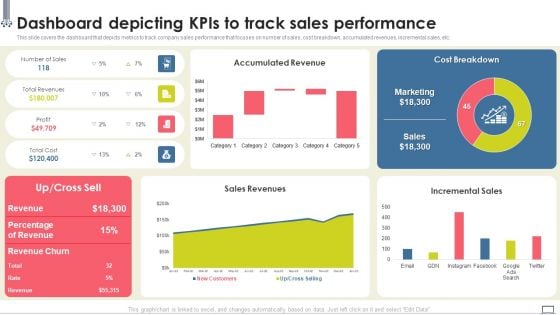
Change Management Strategy Dashboard Depicting Kpis To Track Sales Performance Ideas PDF
This slide covers the dashboard that depicts metrics to track company sales performance that focuses on number of sales, cost breakdown, accumulated revenues, incremental sales, etc. From laying roadmaps to briefing everything in detail, our templates are perfect for you. You can set the stage with your presentation slides. All you have to do is download these easy-to-edit and customizable templates. Change Management Strategy Dashboard Depicting Kpis To Track Sales Performance Ideas PDF will help you deliver an outstanding performance that everyone would remember and praise you for. Do download this presentation today.
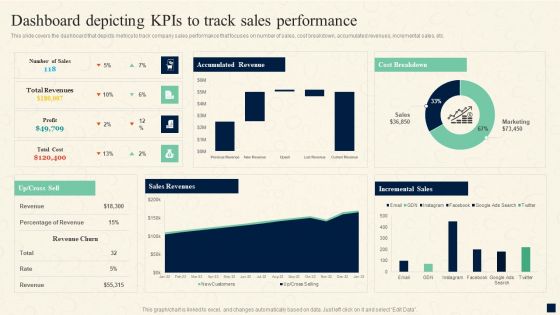
Change Management Process Dashboard Depicting Kpis To Track Sales Performance Introduction PDF
This slide covers the dashboard that depicts metrics to track company sales performance that focuses on number of sales, cost breakdown, accumulated revenues, incremental sales, etc. From laying roadmaps to briefing everything in detail, our templates are perfect for you. You can set the stage with your presentation slides. All you have to do is download these easy-to-edit and customizable templates. Change Management Process Dashboard Depicting Kpis To Track Sales Performance Introduction PDF will help you deliver an outstanding performance that everyone would remember and praise you for. Do download this presentation today.
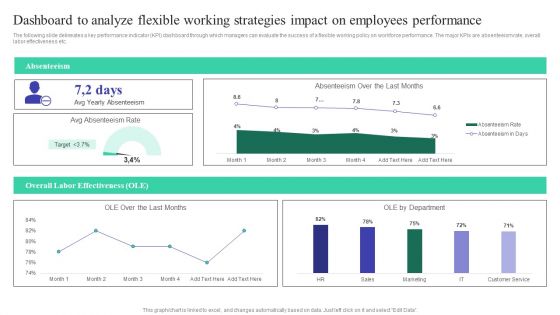
Dashboard To Analyze Flexible Working Strategies Impact On Employees Performance Professional PDF
The following slide delineates a key performance indicator KPI dashboard through which managers can evaluate the success of a flexible working policy on workforce performance. The major KPIs are absenteeism rate, overall labor effectiveness etc. If you are looking for a format to display your unique thoughts, then the professionally designed Dashboard To Analyze Flexible Working Strategies Impact On Employees Performance Professional PDF is the one for you. You can use it as a Google Slides template or a PowerPoint template. Incorporate impressive visuals, symbols, images, and other charts. Modify or reorganize the text boxes as you desire. Experiment with shade schemes and font pairings. Alter, share or cooperate with other people on your work. Download Dashboard To Analyze Flexible Working Strategies Impact On Employees Performance Professional PDF and find out how to give a successful presentation. Present a perfect display to your team and make your presentation unforgettable.
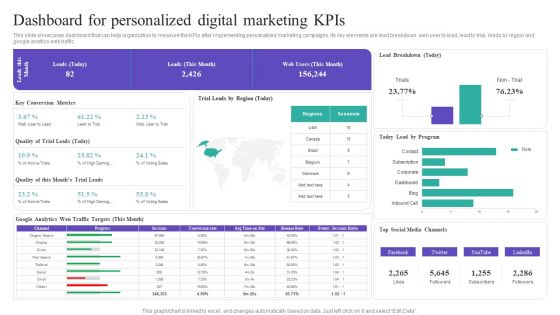
Dashboard For Personalized Digital Marketing Kpis Rules PDF
This slide showcases dashboard that can help organization to measure the KPIs after implementing personalized marketing campaigns. Its key elements are lead breakdown, web user to lead, lead to trial, leads by region and google analtics web traffic. This Dashboard For Personalized Digital Marketing Kpis Rules PDF from Slidegeeks makes it easy to present information on your topic with precision. It provides customization options, so you can make changes to the colors, design, graphics, or any other component to create a unique layout. It is also available for immediate download, so you can begin using it right away. Slidegeeks has done good research to ensure that you have everything you need to make your presentation stand out. Make a name out there for a brilliant performance.
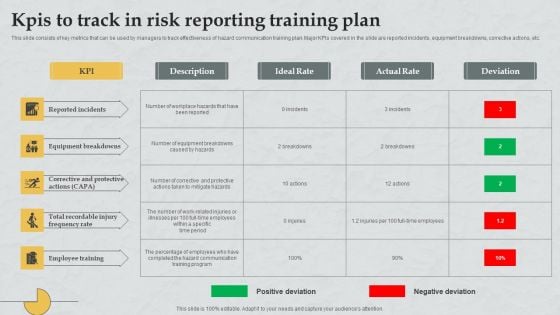
Kpis To Track In Risk Reporting Training Plan Introduction PDF
This slide consists of key metrics that can be used by managers to track effectiveness of hazard communication training plan. Major KPIs covered in the slide are reported incidents, equipment breakdowns, corrective actions, etc. Showcasing this set of slides titled Kpis To Track In Risk Reporting Training Plan Introduction PDF. The topics addressed in these templates are Reported Incidents, Equipment Breakdowns, Corrective Protective Actions. All the content presented in this PPT design is completely editable. Download it and make adjustments in color, background, font etc. as per your unique business setting.
Support Center Report On Agents Monthly Performance Icons PDF
This slide signifies the matrix on call center report based on monthly performance evaluation of all agents. It includes name of customer support executive, total calls done, average duration and conversions. Showcasing this set of slides titled Support Center Report On Agents Monthly Performance Icons PDF. The topics addressed in these templates are Support Center Report, On Agents, Monthly Performance. All the content presented in this PPT design is completely editable. Download it and make adjustments in color, background, font etc. as per your unique business setting.
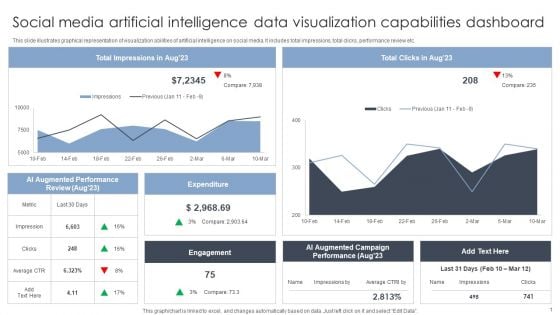
Social Media Artificial Intelligence Data Visualization Capabilities Dashboard Inspiration PDF
This slide illustrates graphical representation of visualization abilities of artificial intelligence on social media. It includes total impressions, total clicks, performance review etc. Pitch your topic with ease and precision using this Social Media Artificial Intelligence Data Visualization Capabilities Dashboard Inspiration PDF. This layout presents information on Artificial Intelligence, Data Visualization Capabilities. It is also available for immediate download and adjustment. So, changes can be made in the color, design, graphics or any other component to create a unique layout.

Information Transformation Process Toolkit Data Analysis Project Plan Diagrams PDF
The slide outline the key steps for data analytics methodology. It initiates with defining business objectives to data understanding, modelling and ends at data visualization and presentation. Presenting Information Transformation Process Toolkit Data Analysis Project Plan Diagrams PDF to provide visual cues and insights. Share and navigate important information on six stages that need your due attention. This template can be used to pitch topics like Business Issue Understanding, Data Understanding, Data Preparation. In addtion, this PPT design contains high resolution images, graphics, etc, that are easily editable and available for immediate download.
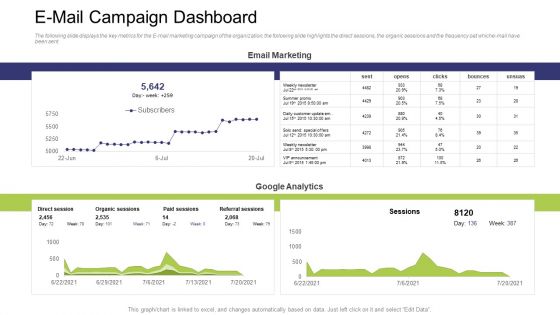
E Mail Campaign Dashboard Ppt Infographic Template Clipart Images PDF
The following slide displays the key metrics for the E-mail marketing campaign of the organization, the following slide highlights the direct sessions, the organic sessions and the frequency oat whiche-mail have been sent Deliver and pitch your topic in the best possible manner with this e mail campaign dashboard ppt infographic template clipart images pdf. Use them to share invaluable insights on direct session, paid sessions, organic sessions, referral sessions and impress your audience. This template can be altered and modified as per your expectations. So, grab it now.
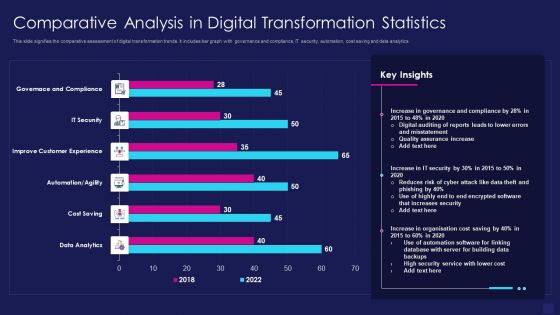
Comparative Analysis In Digital Transformation Statistics Graphics PDF
This slide signifies the comparative assessment of digital transformation trends. It includes bar graph with governance and compliance, IT security, automation, cost saving and data analytics. Showcasing this set of slides titled comparative analysis in digital transformation statistics graphics pdf. The topics addressed in these templates are data analytics, cost saving, improve customer experience. All the content presented in this PPT design is completely editable. Download it and make adjustments in color, background, font etc. as per your unique business setting.

Stock Photo Blue Arrow Moving Across Above The Wall PowerPoint Slide
This power point image slide has been crafted with graphics of blue colored arrow and wall. In this image arrow is moving upward from the wall which shows the concept of growth and success. Use this image in your business and sales presentations to display growth in graphical manner.

Stock Photo Grey Cube Wall With Blue Cube In Center PowerPoint Slide
This power point image slide has been crafted with graphic of grey cube wall and one blue cube in centre of the wall. In this image blue cube shows the concept of solution or leadership both. Use this image slide and display teamwork with leadership in any business presentations.
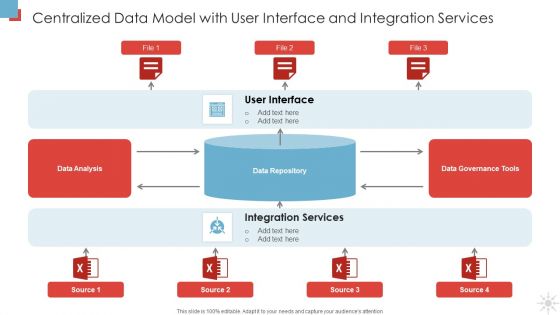
Centralized Data Model With User Interface And Integration Services Template PDF
Showcasing this set of slides titled centralized data model with user interface and integration services template pdf. The topics addressed in these templates are data analysis, data repository, data governance tools, user interface, integration services. All the content presented in this PPT design is completely editable. Download it and make adjustments in color, background, font etc. as per your unique business setting.
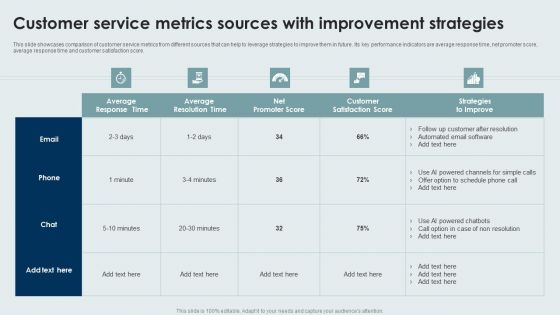
Customer Service Metrics Sources With Improvement Strategies Rules PDF
This slide showcases comparison of customer service metrics from different sources that can help to leverage strategies to improve them in future. Its key performance indicators are average response time, net promoter score, average response time and customer satisfaction score. Showcasing this set of slides titled Customer Service Metrics Sources With Improvement Strategies Rules PDF. The topics addressed in these templates are Average, Strategies, Customer Satisfaction Score. All the content presented in this PPT design is completely editable. Download it and make adjustments in color, background, font etc. as per your unique business setting.
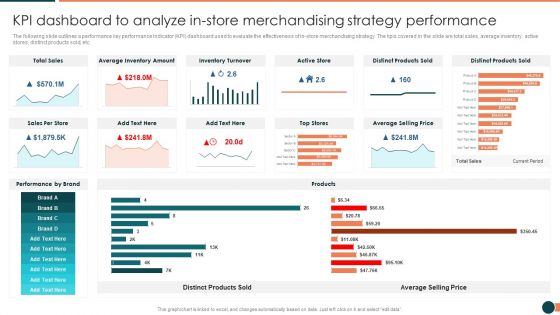
Developing Retail Marketing Strategies To Increase Revenue KPI Dashboard To Analyze Instore Information PDF
The following slide outlines a performance key performance indicator KPI dashboard used to evaluate the effectiveness of in store merchandising strategy. The kpis covered in the slide are total sales, average inventory, active stores, distinct products sold, etc.Deliver an awe inspiring pitch with this creative Developing Retail Marketing Strategies To Increase Revenue KPI Dashboard To Analyze Instore Information PDF bundle. Topics like Inventory Turnover, Distinct Products, Average Inventory can be discussed with this completely editable template. It is available for immediate download depending on the needs and requirements of the user.
Fixed Asset Management Framework Implementation Metric Dashboard For Tracking Assets And Equipments Pictures PDF
This slide represents fixed asset dashboard for asset tracking. It highlights active assets, processors, operating system, devices etc.Deliver and pitch your topic in the best possible manner with this Fixed Asset Management Framework Implementation Metric Dashboard For Tracking Assets And Equipments Pictures PDF Use them to share invaluable insights on Active Assets, Operating System, Manufacture Model and impress your audience. This template can be altered and modified as per your expectations. So, grab it now.
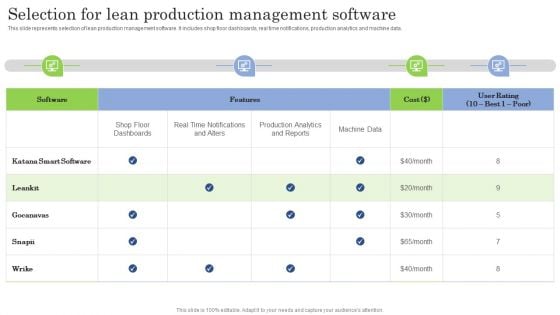
Selection For Lean Production Management Software Ppt PowerPoint Presentation Diagram PDF
This slide represents selection of lean production management software. It includes shop floor dashboards, real time notifications, production analytics and machine data. Are you searching for a Selection For Lean Production Management Software Ppt PowerPoint Presentation Diagram PDF that is uncluttered, straightforward, and original Its easy to edit, and you can change the colors to suit your personal or business branding. For a presentation that expresses how much effort you have put in, this template is ideal. With all of its features, including tables, diagrams, statistics, and lists, its perfect for a business plan presentation. Make your ideas more appealing with these professional slides. Download Selection For Lean Production Management Software Ppt PowerPoint Presentation Diagram PDF from Slidegeeks today.
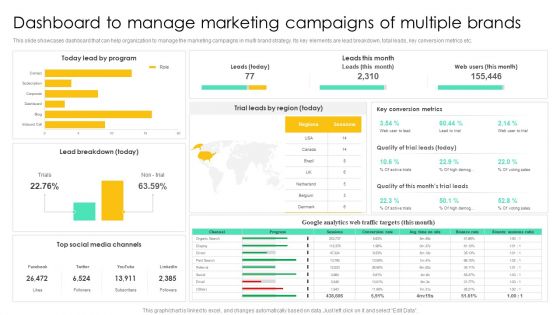
Dashboard To Manage Marketing Campaigns Of Multiple Brands Summary PDF
This slide showcases dashboard that can help organization to manage the marketing campaigns in multi brand strategy. Its key elements are lead breakdown, total leads, key conversion metrics etc. Presenting this PowerPoint presentation, titled Dashboard To Manage Marketing Campaigns Of Multiple Brands Summary PDF, with topics curated by our researchers after extensive research. This editable presentation is available for immediate download and provides attractive features when used. Download now and captivate your audience. Presenting this Dashboard To Manage Marketing Campaigns Of Multiple Brands Summary PDF. Our researchers have carefully researched and created these slides with all aspects taken into consideration. This is a completely customizable Dashboard To Manage Marketing Campaigns Of Multiple Brands Summary PDF that is available for immediate downloading. Download now and make an impact on your audience. Highlight the attractive features available with our PPTs.
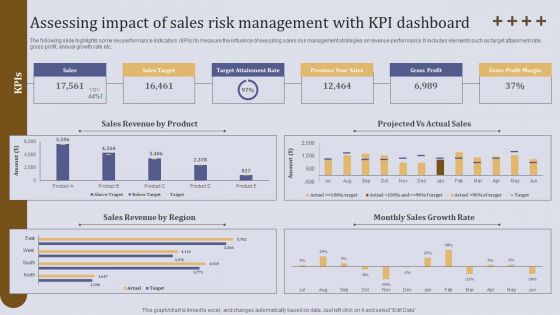
Assessing Impact Of Sales Risk Management With KPI Dashboard Ppt Professional Graphics Pictures PDF
The following slide highlights some key performance indicators KPIs to measure the influence of executing sales risk management strategies on revenue performance. It includes elements such as target attainment rate, gross profit, annual growth rate etc. Are you in need of a template that can accommodate all of your creative concepts This one is crafted professionally and can be altered to fit any style. Use it with Google Slides or PowerPoint. Include striking photographs, symbols, depictions, and other visuals. Fill, move around, or remove text boxes as desired. Test out color palettes and font mixtures. Edit and save your work, or work with colleagues. Download Assessing Impact Of Sales Risk Management With KPI Dashboard Ppt Professional Graphics Pictures PDF and observe how to make your presentation outstanding. Give an impeccable presentation to your group and make your presentation unforgettable.
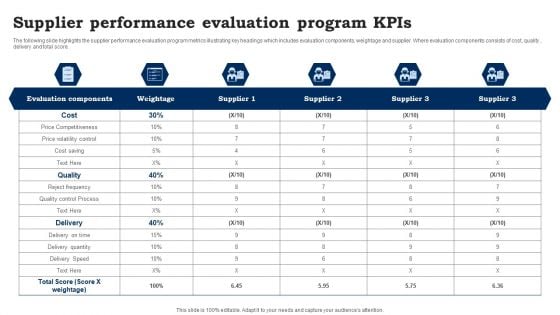
Supplier Performance Evaluation Program Kpis Ppt Infographics Slide PDF
The following slide highlights the supplier performance evaluation program metrics illustrating key headings which includes evaluation components, weightage and supplier. Where evaluation components consists of cost, quality , delivery and total score. Showcasing this set of slides titled Supplier Performance Evaluation Program Kpis Ppt Infographics Slide PDF. The topics addressed in these templates are Evaluation Components, Cost, Price Competitiveness. All the content presented in this PPT design is completely editable. Download it and make adjustments in color, background, font etc. as per your unique business setting.
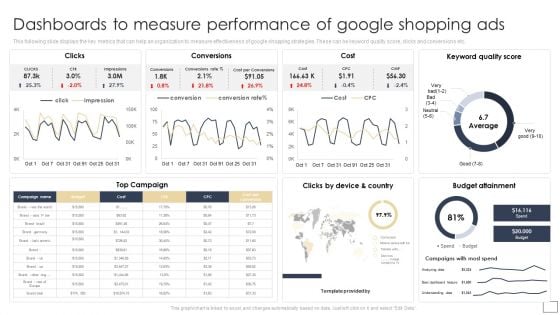
Dashboards To Measure Performance Of Google Shopping Ads Summary PDF
This following slide displays the key metrics that can help an organization to measure effectiveness of google shopping strategies. These can be keyword quality score, clicks and conversions etc.Want to ace your presentation in front of a live audience Our Dashboards To Measure Performance Of Google Shopping Ads Summary PDF can help you do that by engaging all the users towards you. Slidegeeks experts have put their efforts and expertise into creating these impeccable powerpoint presentations so that you can communicate your ideas clearly. Moreover, all the templates are customizable, and easy-to-edit and downloadable. Use these for both personal and commercial use.
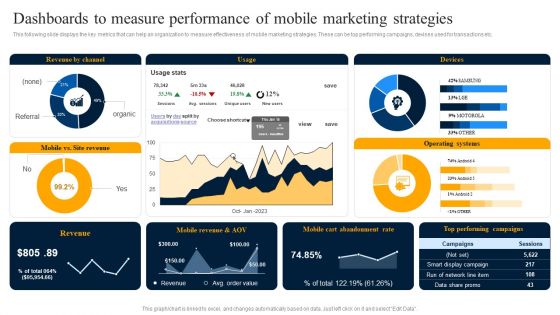
Dashboards To Measure Performance Of Mobile Marketing Strategies Rules PDF
This following slide displays the key metrics that can help an organization to measure effectiveness of mobile marketing strategies. These can be top performing campaigns, devises used for transactions etc. If your project calls for a presentation, then Slidegeeks is your go to partner because we have professionally designed, easy to edit templates that are perfect for any presentation. After downloading, you can easily edit Dashboards To Measure Performance Of Mobile Marketing Strategies Rules PDF and make the changes accordingly. You can rearrange slides or fill them with different images. Check out all the handy templates.
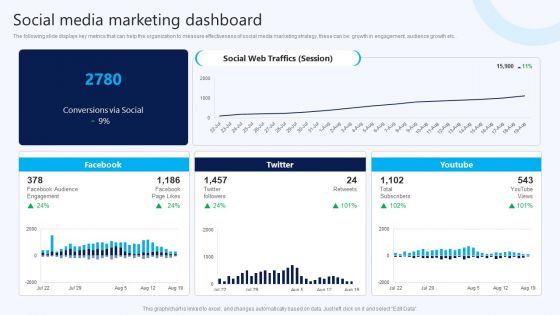
Social Media Marketing Dashboard B2B Electronic Commerce Startup Microsoft PDF
The following slide displays key metrics that can help the organization to measure effectiveness of social media marketing strategy, these can be growth in engagement, audience growth etc. Present like a pro with Social Media Marketing Dashboard B2B Electronic Commerce Startup Microsoft PDF Create beautiful presentations together with your team, using our easy-to-use presentation slides. Share your ideas in real-time and make changes on the fly by downloading our templates. So whether you are in the office, on the go, or in a remote location, you can stay in sync with your team and present your ideas with confidence. With Slidegeeks presentation got a whole lot easier. Grab these presentations today.
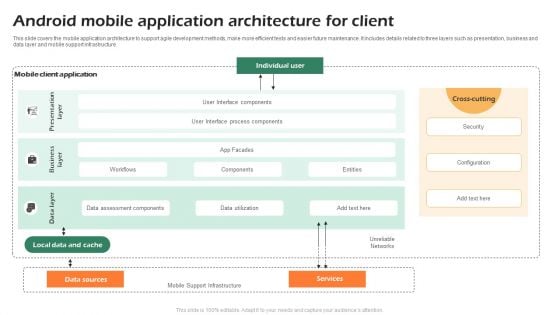
Android Mobile Application Architecture For Client Structure PDF
This slide covers the mobile application architecture to support agile development methods, make more efficient tests and easier future maintenance. It includes details related to three layers such as presentation, business and data layer and mobile support infrastructure. Showcasing this set of slides titled Android Mobile Application Architecture For Client Structure PDF. The topics addressed in these templates are Data Utilization, Data Assessment Components, Unreliable Networks. All the content presented in this PPT design is completely editable. Download it and make adjustments in color, background, font etc. as per your unique business setting.
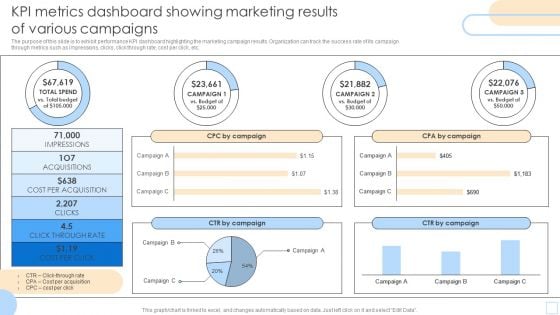
KPI Metrics Dashboard Showing Marketing Results Of Various Campaigns Pictures PDF
The purpose of this slide is to exhibit performance KPI dashboard highlighting the marketing campaign results. Organization can track the success rate of its campaign through metrics such as impressions, clicks, click through rate, cost per click, etc. Pitch your topic with ease and precision using this KPI Metrics Dashboard Showing Marketing Results Of Various Campaigns Pictures PDF. This layout presents information on Impressions, Acquisitions, CPA By Campaign. It is also available for immediate download and adjustment. So, changes can be made in the color, design, graphics or any other component to create a unique layout.
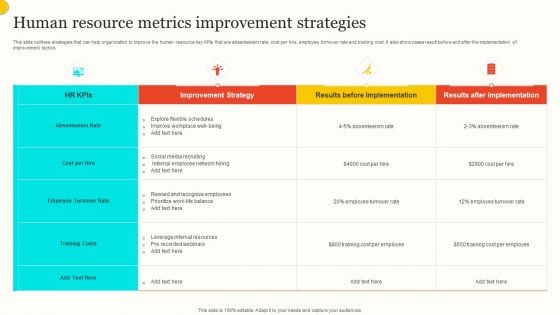
Human Resource Metrics Improvement Strategies Themes PDF
This slide outlines strategies that can help organization to improve the human resource key KPIs that are absenteeism rate, cost per hire, employee turnover rate and training cost. It also showcases result before and after the implementation of improvement tactics. Showcasing this set of slides titled Human Resource Metrics Improvement Strategies Themes PDF. The topics addressed in these templates are Absenteeism Rate, Employee Turnover Rate, Cost Per Hire. All the content presented in this PPT design is completely editable. Download it and make adjustments in color, background, font etc. as per your unique business setting.
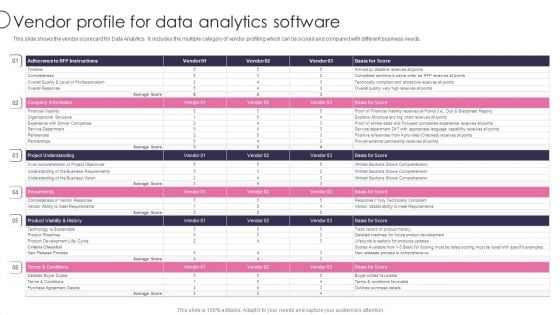
Information Transformation Process Toolkit Vendor Profile For Data Analytics Software Slides PDF
This slide shows the vendor scorecard for Data Analytics. It includes the multiple category of vendor profiling which can be scored and compared with different business needs. Deliver and pitch your topic in the best possible manner with this Information Transformation Process Toolkit Vendor Profile For Data Analytics Software Slides PDF. Use them to share invaluable insights on Company Information, Product Viability, Service Department and impress your audience. This template can be altered and modified as per your expectations. So, grab it now.
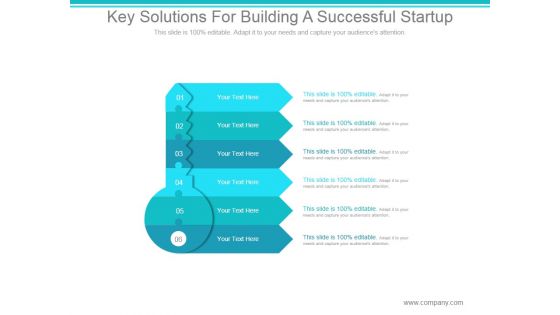
Key Solutions For Building A Successful Startup Ppt PowerPoint Presentation Infographics
This is a key solutions for building a successful startup ppt powerpoint presentation infographics. This is a six stage process. The stages in this process are key, arrows, security, business, marketing.
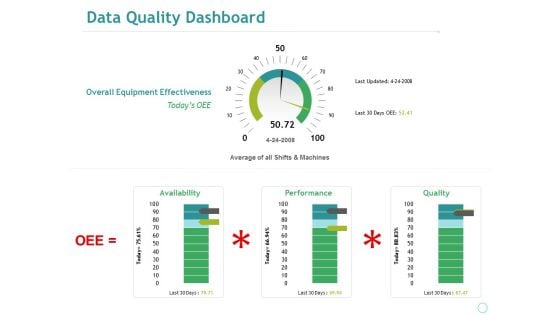
Data Quality Dashboard Ppt PowerPoint Presentation Styles Slides
This is a data quality dashboard ppt powerpoint presentation styles slides. This is a one stage process. The stages in this process are business, overall equipment effectiveness, availability, performance, quality, dashboard.
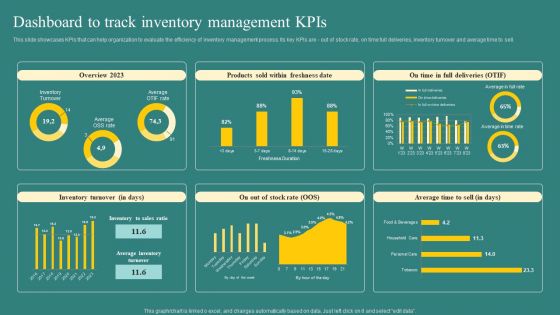
Dashboard To Track Inventory Management Kpis Professional PDF
This slide showcases KPIs that can help organization to evaluate the efficiency of inventory management process. Its key KPIs are out of stock rate, on time full deliveries, inventory turnover and average time to sell. This Dashboard To Track Inventory Management Kpis Professional PDF from Slidegeeks makes it easy to present information on your topic with precision. It provides customization options, so you can make changes to the colors, design, graphics, or any other component to create a unique layout. It is also available for immediate download, so you can begin using it right away. Slidegeeks has done good research to ensure that you have everything you need to make your presentation stand out. Make a name out there for a brilliant performance.
Data Structure IT Retail Specific Data Model Structure Icons PDF
This slide contains structure of data structure which is specific to manufacturing industry. It shows how the data is stored and connected with various entities of the model such as payments, warehouses, retail purchases, etc. Are you searching for a Data Structure IT Retail Specific Data Model Structure Icons PDF that is uncluttered, straightforward, and original. Its easy to edit, and you can change the colors to suit your personal or business branding. For a presentation that expresses how much effort you have put in, this template is ideal. With all of its features, including tables, diagrams, statistics, and lists, its perfect for a business plan presentation. Make your ideas more appealing with these professional slides. Download Data Structure IT Retail Specific Data Model Structure Icons PDF from Slidegeeks today.
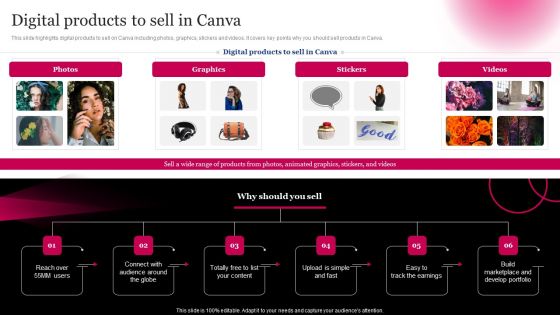
Picture Editing Company Outline Digital Products To Sell In Canva Topics PDF
This slide highlights digital products to sell on Canva including photos, graphics, stickers and videos. It covers key points why you should sell products in Canva. Create an editable Picture Editing Company Outline Digital Products To Sell In Canva Topics PDF that communicates your idea and engages your audience. Whether youre presenting a business or an educational presentation, pre designed presentation templates help save time. Picture Editing Company Outline Digital Products To Sell In Canva Topics PDF is highly customizable and very easy to edit, covering many different styles from creative to business presentations. Slidegeeks has creative team members who have crafted amazing templates. So, go and get them without any delay.


 Continue with Email

 Home
Home


