Business Snapshot
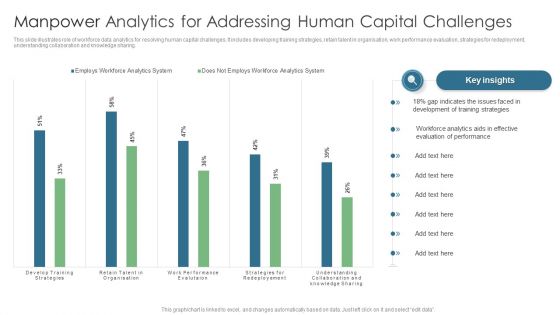
Manpower Analytics For Addressing Human Capital Challenges Diagrams PDF
This slide illustrates role of workforce data analytics for resolving human capital challenges. It includes developing training strategies, retain talent in organisation, work performance evaluation, strategies for redeployment, understanding collaboration and knowledge sharing. Showcasing this set of slides titled Manpower Analytics For Addressing Human Capital Challenges Diagrams PDF. The topics addressed in these templates are Gap Indicates, Training Strategies, Evaluation Performance. All the content presented in this PPT design is completely editable. Download it and make adjustments in color, background, font etc. as per your unique business setting.

Kpis To Track The Performance Of Email Marketing Techniques Ppt PowerPoint Presentation Gallery Ideas PDF
Mentioned slide outlines various KPIs which can be used by the marketing department to analyze the performance of email marketing strategy. It covers information about KPIs such as click-through rate, conversion rate, bounce rate and list growth rate. Showcasing this set of slides titled kpis to track the performance of email marketing techniques ppt powerpoint presentation gallery ideas pdf. The topics addressed in these templates are conversion rate, bounce rate, list growth rate. All the content presented in this PPT design is completely editable. Download it and make adjustments in color, background, font etc. as per your unique business setting.
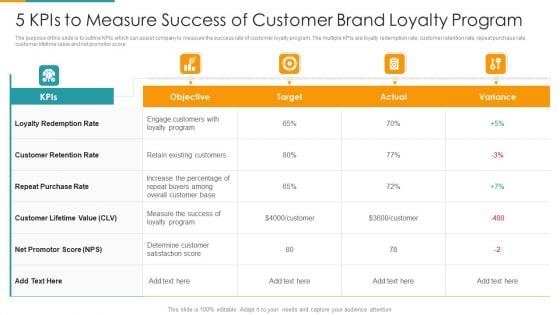
5 KPIs To Measure Success Of Customer Brand Loyalty Program Ppt PowerPoint Presentation File Deck PDF
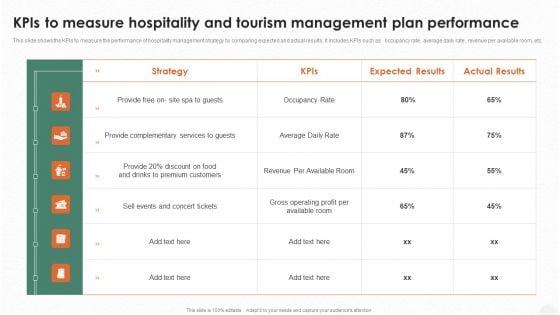
Kpis To Measure Hospitality And Tourism Management Plan Performance Brochure PDF
This slide shows the KPIs to measure the performance of hospitality management strategy by comparing expected and actual results. It includes KPIs such as occupancy rate, average daily rate, revenue per available room, etc.Showcasing this set of slides titled Kpis To Measure Hospitality And Tourism Management Plan Performance Brochure PDF. The topics addressed in these templates are Provide Complementary, Premium Customers, Gross Operating. All the content presented in this PPT design is completely editable. Download it and make adjustments in color, background, font etc. as per your unique business setting.

Project Service Delivery Timeline Showcasing Gap Analysis Topics PDF
This slide represents project delivery timeline showcasing original and anticipated timeframe for project competition. It provides information regarding project establishment, stakeholder commitments, community engagement, data collection etc. Showcasing this set of slides titled Project Service Delivery Timeline Showcasing Gap Analysis Topics PDF. The topics addressed in these templates are Project Establishment, Stakeholder Commitment, Community Engagement. All the content presented in this PPT design is completely editable. Download it and make adjustments in color, background, font etc. as per your unique business setting.

Fitness Product Promotion Campaigns Sports Marketing Strategies Impact On Major Kpis Introduction PDF
This slide showcases major impact of sports marketing strategies on key performance indicators KPIs. It provides details about sponsored brand sales, return on investment ROI, customer base, merchandise, social media followers, etc. Retrieve professionally designed Fitness Product Promotion Campaigns Sports Marketing Strategies Impact On Major Kpis Introduction PDF to effectively convey your message and captivate your listeners. Save time by selecting pre-made slideshows that are appropriate for various topics, from business to educational purposes. These themes come in many different styles, from creative to corporate, and all of them are easily adjustable and can be edited quickly. Access them as PowerPoint templates or as Google Slides themes. You do not have to go on a hunt for the perfect presentation because Slidegeeks got you covered from everywhere.
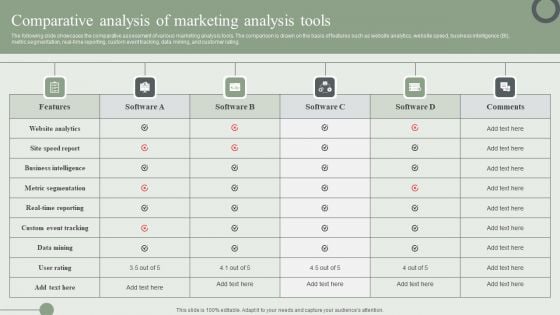
Comparative Analysis Of Marketing Analysis Tools Ppt PowerPoint Presentation File Gallery PDF
The following slide showcases the comparative assessment of various marketing analysis tools. The comparison is drawn on the basis of features such as website analytics, website speed, business intelligence BI, metric segmentation, real-time reporting, custom event tracking, data mining, and customer rating. This Comparative Analysis Of Marketing Analysis Tools Ppt PowerPoint Presentation File Gallery PDF from Slidegeeks makes it easy to present information on your topic with precision. It provides customization options, so you can make changes to the colors, design, graphics, or any other component to create a unique layout. It is also available for immediate download, so you can begin using it right away. Slidegeeks has done good research to ensure that you have everything you need to make your presentation stand out. Make a name out there for a brilliant performance.
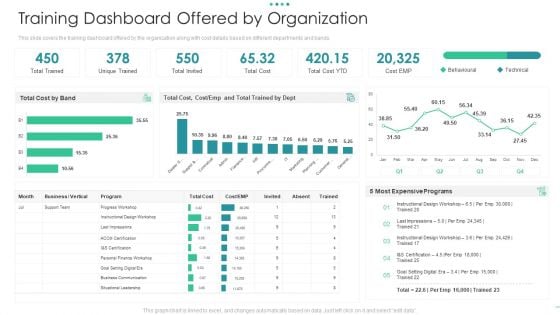
Training Dashboard Offered By Organization Slides PDF
This slide covers the training dashboard offered by the organization along with cost details based on different departments and bands. Deliver and pitch your topic in the best possible manner with this training dashboard offered by organization slides pdf. Use them to share invaluable insights on cost, technical, program and impress your audience. This template can be altered and modified as per your expectations. So, grab it now.
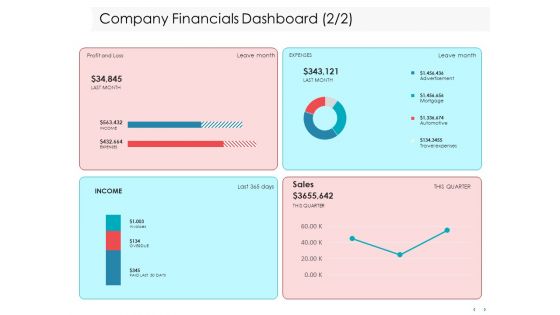
Managing CFO Services Company Financials Dashboard Profit Ppt Infographics Example File PDF
Presenting this set of slides with name managing cfo services company financials dashboard profit ppt infographics example file pdf. The topics discussed in these slides are revenue, customers, vendors, profit, expense, performance. This is a completely editable PowerPoint presentation and is available for immediate download. Download now and impress your audience.
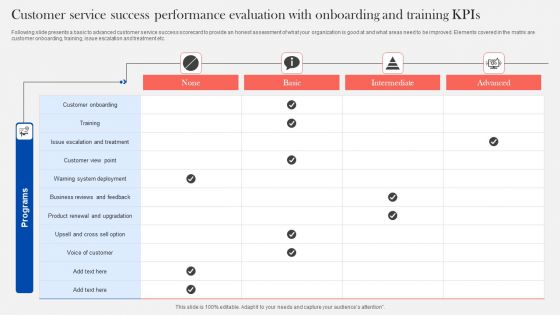
Customer Service Success Performance Evaluation With Onboarding And Training Kpis Information PDF
Following slide presents a basic to advanced customer service success scorecard to provide an honest assessment of what your organization is good at and what areas need to be improved. Elements covered in the matrix are customer onboarding, training, issue escalation and treatment etc. Showcasing this set of slides titled Customer Service Success Performance Evaluation With Onboarding And Training Kpis Information PDF. The topics addressed in these templates are Customer Onboarding, Training, Customer View Point. All the content presented in this PPT design is completely editable. Download it and make adjustments in color, background, font etc. as per your unique business setting.
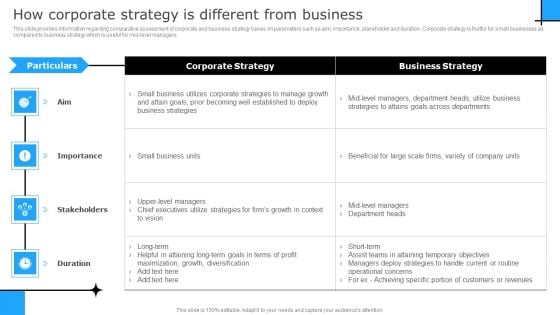
Successful Corporate Technique Enhancing Firms Performance How Corporate Strategy Ideas PDF
This slide provides information regarding comparative assessment of corporate and business strategy bases on parameters such as aim, importance, stakeholder and duration. Corporate strategy is fruitful for small businesses as compared to business strategy which is useful for mid-level managers. Slidegeeks is here to make your presentations a breeze with Successful Corporate Technique Enhancing Firms Performance How Corporate Strategy Ideas PDF With our easy to use and customizable templates, you can focus on delivering your ideas rather than worrying about formatting. With a variety of designs to choose from, you are sure to find one that suits your needs. And with animations and unique photos, illustrations, and fonts, you can make your presentation pop. So whether you are giving a sales pitch or presenting to the board, make sure to check out Slidegeeks first.
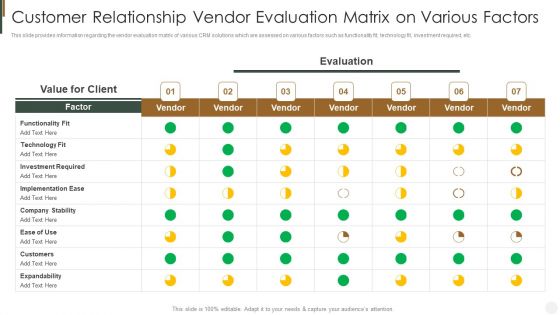
Customer Relationship Vendor Evaluation Matrix On Various Factors Strategies To Improve Customer Pictures PDF
This slide provides information regarding the vendor evaluation matrix of various CRM solutions which are assessed on various factors such as functionality fit, technology fit, investment required, etc. Create an editable Customer Relationship Vendor Evaluation Matrix On Various Factors Strategies To Improve Customer Pictures PDF that communicates your idea and engages your audience. Whether you are presenting a business or an educational presentation, pre-designed presentation templates help save time. Customer Relationship Vendor Evaluation Matrix On Various Factors Strategies To Improve Customer Pictures PDF is highly customizable and very easy to edit, covering many different styles from creative to business presentations. Slidegeeks has creative team members who have crafted amazing templates. So, go and get them without any delay.
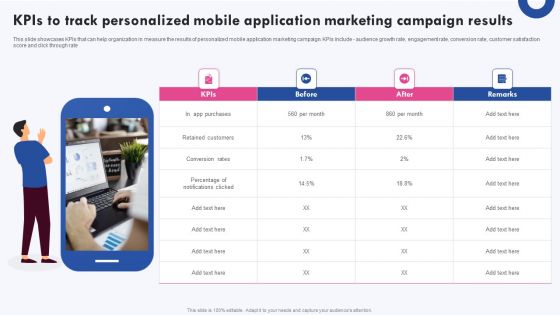
Targeted Marketing Campaigns To Improve Buyers Experience Kpis To Track Personalized Mobile Application Pictures PDF
This slide showcases KPIs that can help organization in measure the results of personalized mobile application marketing campaign. KPIs include audience growth rate, engagement rate, conversion rate, customer satisfaction score and click through rate Welcome to our selection of the Targeted Marketing Campaigns To Improve Buyers Experience Kpis To Track Personalized Mobile Application Pictures PDF. These are designed to help you showcase your creativity and bring your sphere to life. Planning and Innovation are essential for any business that is just starting out. This collection contains the designs that you need for your everyday presentations. All of our PowerPoints are 100 percent editable, so you can customize them to suit your needs. This multi purpose template can be used in various situations. Grab these presentation templates today.
Buzz Marketing Strategies For Brand Promotion Dashboard For Tracking Marketing Activities At Designs PDF
This slide covers information regarding the dashboard for tracking essential marketing activities at social media platform in terms of social traffic and conversion, referral traffic by site, key social media metrics. Deliver an awe inspiring pitch with this creative buzz marketing strategies for brand promotion dashboard for tracking marketing activities at designs pdf bundle. Topics like dashboard for tracking marketing activities at social media platform can be discussed with this completely editable template. It is available for immediate download depending on the needs and requirements of the user.
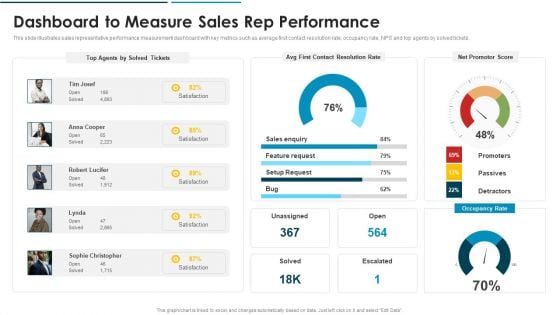
Go To Market Approach For New Product Dashboard To Measure Sales Rep Performance Formats PDF
This slide illustrates sales representative performance measurement dashboard with key metrics such as average first contact resolution rate, occupancy rate, NPS and top agents by solved tickets.Deliver and pitch your topic in the best possible manner with this Go To Market Approach For New Product Dashboard To Measure Sales Rep Performance Formats PDF Use them to share invaluable insights on Dashboard To Measure Sales Rep Performance and impress your audience. This template can be altered and modified as per your expectations. So, grab it now.

Dashboard To Track Impact Of Extensive Diversity Training On Workplace Management Portrait PDF
This slide showcases dashboard to track impact of diversity training on workplace management. Key metrics included here are gender distribution level, hire by gender, ethinicity distribution, promotion rate, termination rate etc. Pitch your topic with ease and precision using this Dashboard To Track Impact Of Extensive Diversity Training On Workplace Management Portrait PDF. This layout presents information on Dashboard To Track Impact, Extensive Diversity Training, Workplace Management. It is also available for immediate download and adjustment. So, changes can be made in the color, design, graphics or any other component to create a unique layout.
Client Management Dashboard Ppt Show Icon PDF
Deliver and pitch your topic in the best possible manner with this client management dashboard ppt show icon pdf. Use them to share invaluable insights on devices by ownership, devices by os version, devices by model, account details, devices enrolled, devices and impress your audience. This template can be altered and modified as per your expectations. So, grab it now.
CRM System Deployment Plan CRM Dashboard For Tracking Sales Pipeline Pictures PDF
This slide covers the CRM KPI dashboard for monitoring lead status in the sales funnel. It includes metrics such as open pipeline value, open pipeline by product package, pipeline value forecast, etc. Deliver an awe inspiring pitch with this creative CRM System Deployment Plan CRM Dashboard For Tracking Sales Pipeline Pictures PDF bundle. Topics like Pipeline Value Forecast, Open Pipeline Value, Branding can be discussed with this completely editable template. It is available for immediate download depending on the needs and requirements of the user.
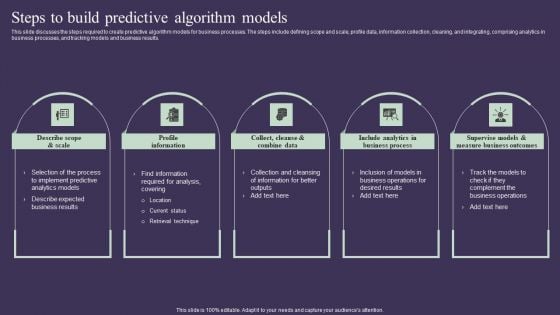
Projection Model Steps To Build Predictive Algorithm Models Graphics PDF
This slide discusses the steps required to create predictive algorithm models for business processes. The steps include defining scope and scale, profile data, information collection, cleaning, and integrating, comprising analytics in business processes, and tracking models and business results. Do you have an important presentation coming up Are you looking for something that will make your presentation stand out from the rest Look no further than Projection Model Steps To Build Predictive Algorithm Models Graphics PDF. With our professional designs, you can trust that your presentation will pop and make delivering it a smooth process. And with Slidegeeks, you can trust that your presentation will be unique and memorable. So why wait Grab Projection Model Steps To Build Predictive Algorithm Models Graphics PDF today and make your presentation stand out from the rest
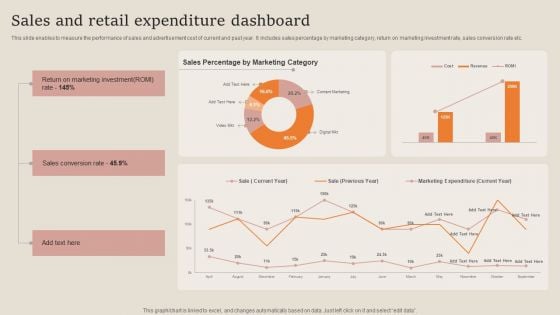
Sales And Retail Expenditure Dashboard Guidelines PDF
This slide enables to measure the performance of sales and advertisement cost of current and past year. It includes sales percentage by marketing category, return on marketing investment rate, sales conversion rate etc. Pitch your topic with ease and precision using this Sales And Retail Expenditure Dashboard Guidelines PDF. This layout presents information on Sales Conversion Rate, Marketing Investment. It is also available for immediate download and adjustment. So, changes can be made in the color, design, graphics or any other component to create a unique layout.
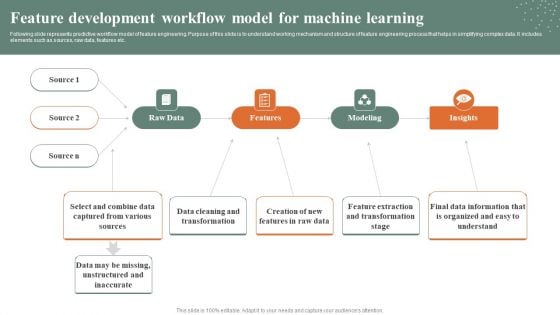
Feature Development Workflow Model For Machine Learning Pictures PDF
Following slide represents predictive workflow model of feature engineering. Purpose of this slide is to understand working mechanism and structure of feature engineering process that helps in simplifying complex data. It includes elements such as sources, raw data, features etc. Showcasing this set of slides titled Feature Development Workflow Model For Machine Learning Pictures PDF. The topics addressed in these templates are Raw Data, Features, Modeling. All the content presented in this PPT design is completely editable. Download it and make adjustments in color, background, font etc. as per your unique business setting.
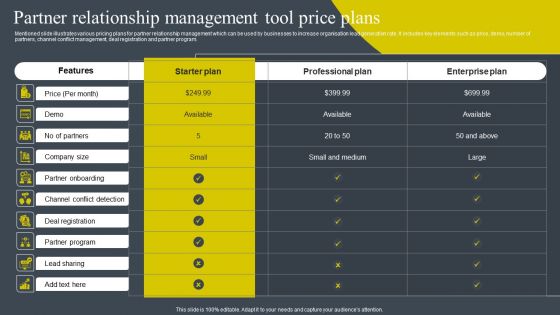
Partner Relationship Management Tool Price Plans Infographics PDF
Mentioned slide demonstrates various partner relationship management software solutions which can be used by business to track sales partners. It includes key attributes such as price, features, rating, free trial, operating system, deployment and company size. Mentioned slide demonstrates impact of customer management solutions on business key performance indicators. It includes key performance indicators such as customer retention, loyal customer base, customer abandonment rate, customer satisfaction, etc. Slidegeeks is one of the best resources for PowerPoint templates. You can download easily and regulate Partner Relationship Management Tool Price Plans Infographics PDF for your personal presentations from our wonderful collection. A few clicks is all it takes to discover and get the most relevant and appropriate templates. Use our Templates to add a unique zing and appeal to your presentation and meetings. All the slides are easy to edit and you can use them even for advertisement purposes.
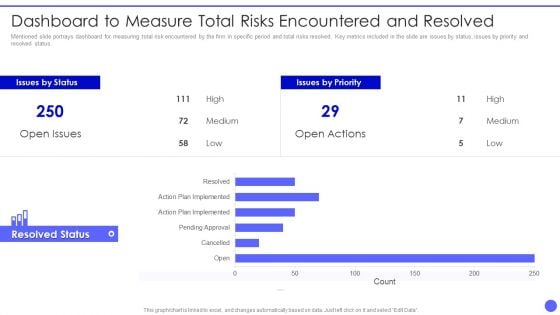
Info Safety And ISO 27001 Dashboard To Measure Total Risks Encountered Slides PDF
Mentioned slide portrays dashboard for measuring total risk encountered by the firm in specific period and total risks resolved. Key metrics included in the slide are issues by status, issues by priority and resolved status. Deliver an awe inspiring pitch with this creative Info Safety And ISO 27001 Dashboard To Measure Total Risks Encountered Slides PDF bundle. Topics like Issues by Status, Resolved Status, High, Medium, Low can be discussed with this completely editable template. It is available for immediate download depending on the needs and requirements of the user.
Ways To Accomplish ISO 27001 Accreditation Dashboard To Measure Total Risks Encountered Download PDF
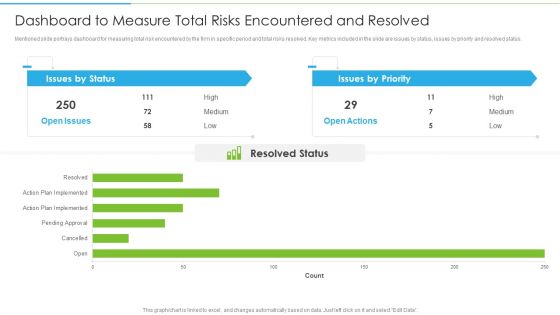
Mentioned slide portrays dashboard for measuring total risk encountered by the firm in specific period and total risks resolved. Key metrics included in the slide are issues by status, issues by priority and resolved status. Deliver an awe inspiring pitch with this creative Ways To Accomplish ISO 27001 Accreditation Dashboard To Measure Total Risks Encountered Download PDF bundle. Topics like Pending Approval, Action Plan, Resolved Status can be discussed with this completely editable template. It is available for immediate download depending on the needs and requirements of the user.
ISO 27001 Certification Procedure Dashboard To Measure Total Risks Encountered And Resolved Topics PDF
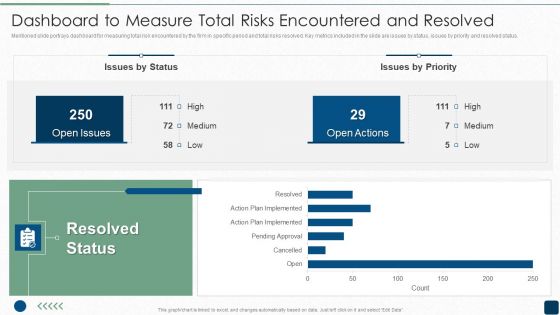
Mentioned slide portrays dashboard for measuring total risk encountered by the firm in specific period and total risks resolved. Key metrics included in the slide are issues by status, issues by priority and resolved status.Deliver and pitch your topic in the best possible manner with this ISO 27001 Certification Procedure Dashboard To Measure Total Risks Encountered And Resolved Topics PDF. Use them to share invaluable insights on Resolved Status, Open Issues, Open Actions and impress your audience. This template can be altered and modified as per your expectations. So, grab it now.
Dual Branding Campaign To Boost Sales Of Product Or Services Dashboard For Measuring Product Sales Elements PDF
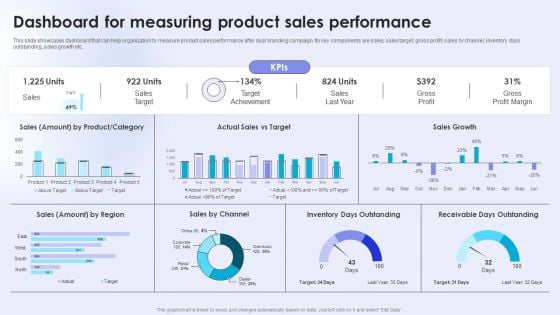
This slide showcases dashboard that can help organization to measure product sales performance after dual branding campaign. Its key components are sales, sales target, gross profit, sales by channel, inventory days outstanding, sales growth etc. The Dual Branding Campaign To Boost Sales Of Product Or Services Dashboard For Measuring Product Sales Elements PDF is a compilation of the most recent design trends as a series of slides. It is suitable for any subject or industry presentation, containing attractive visuals and photo spots for businesses to clearly express their messages. This template contains a variety of slides for the user to input data, such as structures to contrast two elements, bullet points, and slides for written information. Slidegeeks is prepared to create an impression.
Parties Involved In M And A Due Diligence Process Clipart PDF
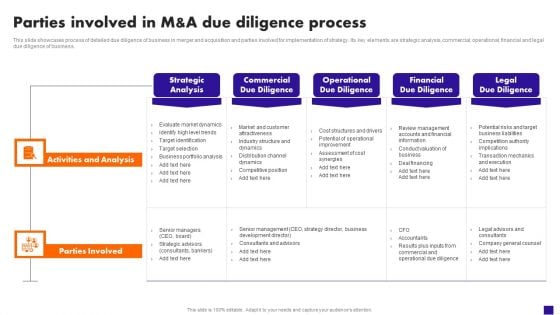
This slide showcases process of detailed due diligence of business in merger and acquisition and parties involved for implementation of strategy. Its key elements are strategic analysis, commercial, operational, financial and legal due diligence of business. The Parties Involved In M And A Due Diligence Process Clipart PDF is a compilation of the most recent design trends as a series of slides. It is suitable for any subject or industry presentation, containing attractive visuals and photo spots for businesses to clearly express their messages. This template contains a variety of slides for the user to input data, such as structures to contrast two elements, bullet points, and slides for written information. Slidegeeks is prepared to create an impression.
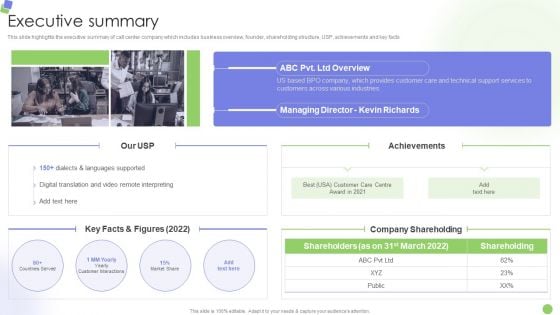
Knowledge Process Outsourcing Company Profile Executive Summary Clipart PDF
This slide highlights the executive summary of call center company which includes business overview, founder, shareholding structure, USP, achievements and key facts.Deliver an awe inspiring pitch with this creative Knowledge Process Outsourcing Company Profile Executive Summary Clipart PDF bundle. Topics like Languages Supported, Digital Translation, Remote Interpreting can be discussed with this completely editable template. It is available for immediate download depending on the needs and requirements of the user.
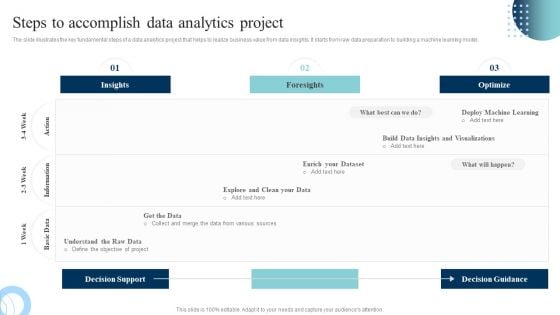
Data Evaluation And Processing Toolkit Steps To Accomplish Data Analytics Project Structure PDF
The slide illustrates the key fundamental steps of a data analytics project that helps to realize business value from data insights. It starts from raw data preparation to building a machine learning model. If you are looking for a format to display your unique thoughts, then the professionally designed Data Evaluation And Processing Toolkit Steps To Accomplish Data Analytics Project Structure PDF is the one for you. You can use it as a Google Slides template or a PowerPoint template. Incorporate impressive visuals, symbols, images, and other charts. Modify or reorganize the text boxes as you desire. Experiment with shade schemes and font pairings. Alter, share or cooperate with other people on your work. Download Data Evaluation And Processing Toolkit Steps To Accomplish Data Analytics Project Structure PDF and find out how to give a successful presentation. Present a perfect display to your team and make your presentation unforgettable.
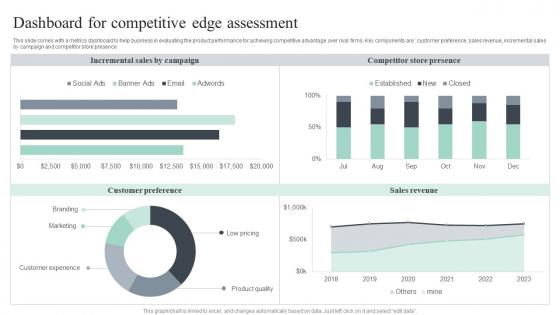
Dashboard For Competitive Edge Assessment Themes Pdf
This slide comes with a metrics dashboard to help business in evaluating the product performance for achieving competitive advantage over rival firms. Key components are customer preference, sales revenue, incremental sales by campaign and competitor store presence Pitch your topic with ease and precision using this Dashboard For Competitive Edge Assessment Themes Pdf. This layout presents information on Incremental Sales, Competitor Store Presence, Sales Revenue. It is also available for immediate download and adjustment. So, changes can be made in the color, design, graphics or any other component to create a unique layout. This slide comes with a metrics dashboard to help business in evaluating the product performance for achieving competitive advantage over rival firms. Key components are customer preference, sales revenue, incremental sales by campaign and competitor store presence
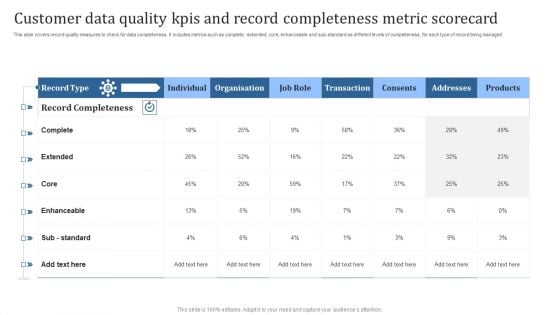
Customer Data Quality Kpis And Record Completeness Metric Scorecard Brochure PDF
This slide covers record quality measures to check for data completeness. It includes metrics such as complete, extended, core, enhanceable and sub-standard as different levels of completeness, for each type of record being managed. Showcasing this set of slides titled Customer Data Quality Kpis And Record Completeness Metric Scorecard Brochure PDF. The topics addressed in these templates are Complete, Enhanceable, Core. All the content presented in this PPT design is completely editable. Download it and make adjustments in color, background, font etc. as per your unique business setting.
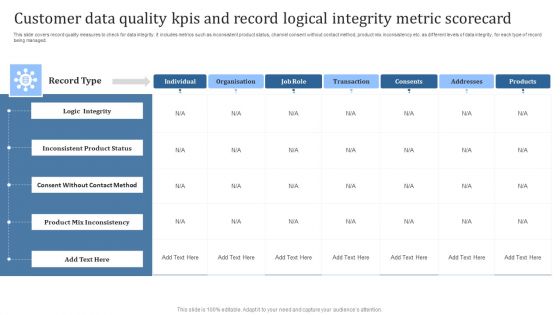
Customer Data Quality Kpis And Record Logical Integrity Metric Scorecard Introduction PDF
This slide covers record quality measures to check for data integrity. It includes metrics such as inconsistent product status, channel consent without contact method, product mix inconsistency etc. as different levels of data integrity, for each type of record being managed. Showcasing this set of slides titled Customer Data Quality Kpis And Record Logical Integrity Metric Scorecard Introduction PDF. The topics addressed in these templates are Logic Integrity, Inconsistent Product Status. All the content presented in this PPT design is completely editable. Download it and make adjustments in color, background, font etc. as per your unique business setting.
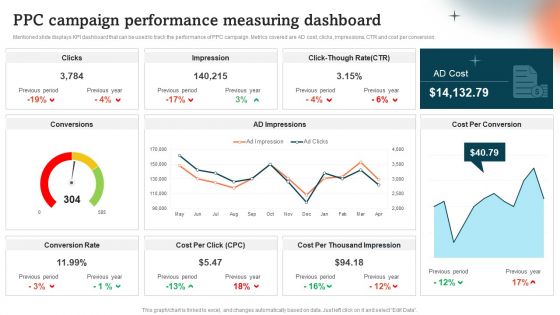
Ppc Campaign Performance Measuring Dashboard Guide To Personal Branding Pictures PDF
Mentioned slide displays KPI dashboard that can be used to track the performance of PPC campaign. Metrics covered are AD cost, clicks, impressions, CTR and cost per conversion.Presenting this PowerPoint presentation, titled Ppc Campaign Performance Measuring Dashboard Guide To Personal Branding Pictures PDF, with topics curated by our researchers after extensive research. This editable presentation is available for immediate download and provides attractive features when used. Download now and captivate your audience. Presenting this Ppc Campaign Performance Measuring Dashboard Guide To Personal Branding Pictures PDF. Our researchers have carefully researched and created these slides with all aspects taken into consideration. This is a completely customizable Ppc Campaign Performance Measuring Dashboard Guide To Personal Branding Pictures PDF that is available for immediate downloading. Download now and make an impact on your audience. Highlight the attractive features available with our PPTs.
B2B And B2C Startups Marketing Mix Strategies Content Marketing Dashboard For Effective Tracking Template PDF
Purpose of the following slide is to show key metrics that can help the organization to track their content marketing efforts, these metrics are ad cost, visits, cost per click etc. Boost your pitch with our creative B2B And B2C Startups Marketing Mix Strategies Content Marketing Dashboard For Effective Tracking Template PDF. Deliver an awe inspiring pitch that will mesmerize everyone. Using these presentation templates you will surely catch everyones attention. You can browse the ppts collection on our website. We have researchers who are experts at creating the right content for the templates. So you do not have to invest time in any additional work. Just grab the template now and use them.
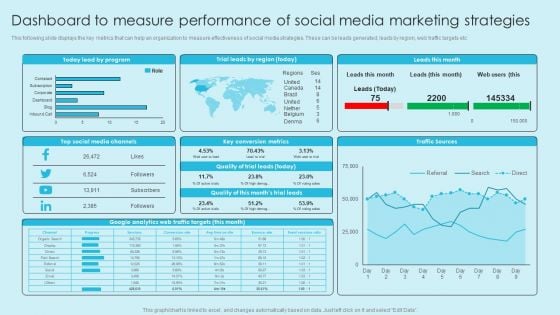
Online Marketing Techniques For Acquiring Clients Dashboard To Measure Performance Of Social Media Guidelines PDF
This following slide displays the key metrics that can help an organization to measure effectiveness of e commerce strategies. These can be revenue generated using e-commerce platform, conversion rates etc. This Online Marketing Techniques For Acquiring Clients Dashboard To Measure Performance Of Social Media Guidelines PDF from Slidegeeks makes it easy to present information on your topic with precision. It provides customization options, so you can make changes to the colors, design, graphics, or any other component to create a unique layout. It is also available for immediate download, so you can begin using it right away. Slidegeeks has done good research to ensure that you have everything you need to make your presentation stand out. Make a name out there for a brilliant performance.
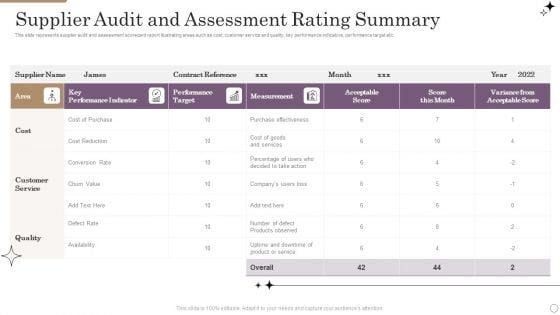
Supplier Audit And Assessment Rating Summary Background PDF
This slide represents supplier audit and assessment scorecard report illustrating areas such as cost, customer service and quality, key performance indicators, performance target etc. Showcasing this set of slides titled Supplier Audit And Assessment Rating Summary Background PDF. The topics addressed in these templates are Customer Service, Quality, Cost. All the content presented in this PPT design is completely editable. Download it and make adjustments in color, background, font etc. as per your unique business setting.
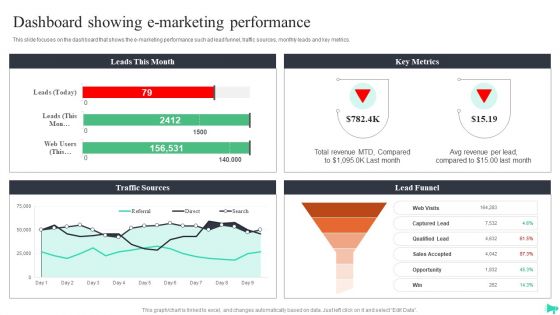
Implementing Ecommerce Marketing Services Plan Dashboard Showing E Marketing Performance Summary PDF
This slide focuses on the dashboard that shows the e marketing performance such ad lead funnel, traffic sources, monthly leads and key metrics. Take your projects to the next level with our ultimate collection of Implementing Ecommerce Marketing Services Plan Dashboard Showing E Marketing Performance Summary PDF. Slidegeeks has designed a range of layouts that are perfect for representing task or activity duration, keeping track of all your deadlines at a glance. Tailor these designs to your exact needs and give them a truly corporate look with your own brand colors they will make your projects stand out from the rest.

Infrastructure Supervision Infrastructure Monitoring Dashboard Ppt PowerPoint Presentation File Professional PDF
This slide covers the dashboard which can be used to monitor the server count, geo activity, processor, memory space, network security, etc. Deliver an awe inspiring pitch with this creative Infrastructure Supervision Infrastructure Monitoring Dashboard Ppt PowerPoint Presentation File Professional PDF bundle. Topics like Calendar, Clock, Geo Activity, OS Assessment, Host Pending Reboot, Change Tracking can be discussed with this completely editable template. It is available for immediate download depending on the needs and requirements of the user.
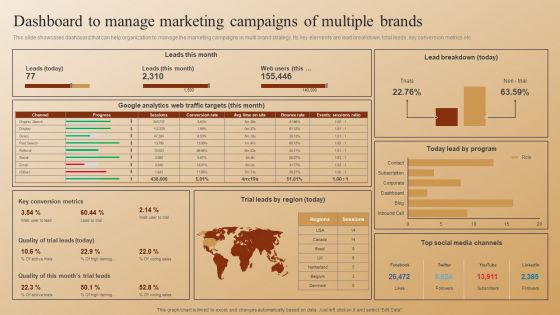
Establishing A Brand Identity For Organizations With Several Brands Dashboard To Manage Marketing Campaigns Sample PDF
This slide showcases dashboard that can help organization to manage the marketing campaigns in multi brand strategy. Its key elements are lead breakdown, total leads, key conversion metrics etc. Its key elements are forecast purchasers, customer acquisition cost and visitors count by landing pages. Want to ace your presentation in front of a live audience Our Establishing A Brand Identity For Organizations With Several Brands Dashboard To Manage Marketing Campaigns Sample PDFcan help you do that by engaging all the users towards you. Slidegeeks experts have put their efforts and expertise into creating these impeccable powerpoint presentations so that you can communicate your ideas clearly. Moreover, all the templates are customizable, and easy-to-edit and downloadable. Use these for both personal and commercial use.
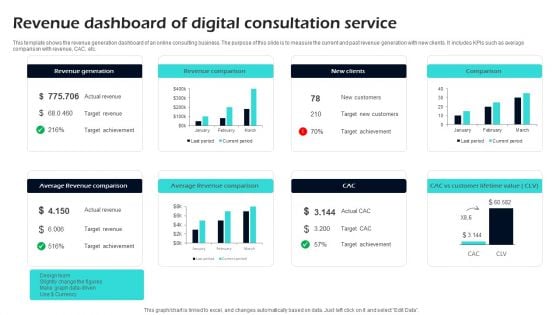
Revenue Dashboard Of Digital Consultation Service Ppt Designs
This template shows the revenue generation dashboard of an online consulting business. The purpose of this slide is to measure the current and past revenue generation with new clients. It includes KPIs such as average comparison with revenue, CAC, etc. Pitch your topic with ease and precision using this Revenue Dashboard Of Digital Consultation Service Ppt Designs. This layout presents information on Revenue, Digital, Consultation. It is also available for immediate download and adjustment. So, changes can be made in the color, design, graphics or any other component to create a unique layout.
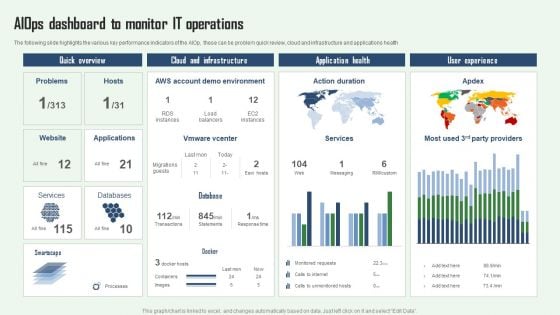
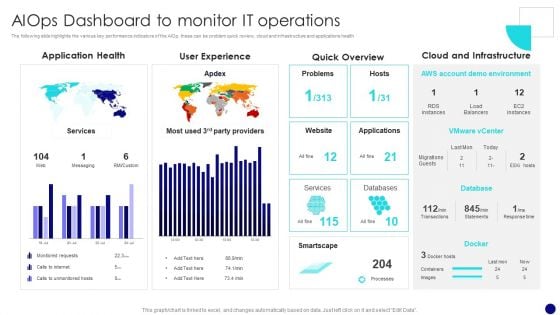
Aiops Dashboard To Monitor IT Operations Aiops Integration Summary Report Clipart PDF
The following slide highlights the various key performance indicators of the AIOp, these can be problem quick review, cloud and infrastructure and applications health. If you are looking for a format to display your unique thoughts, then the professionally designed Aiops Dashboard To Monitor IT Operations Aiops Integration Summary Report Clipart PDF is the one for you. You can use it as a Google Slides template or a PowerPoint template. Incorporate impressive visuals, symbols, images, and other charts. Modify or reorganize the text boxes as you desire. Experiment with shade schemes and font pairings. Alter, share or cooperate with other people on your work. Download Aiops Dashboard To Monitor IT Operations Aiops Integration Summary Report Clipart PDF and find out how to give a successful presentation. Present a perfect display to your team and make your presentation unforgettable.
Information Technology Operations Administration With ML Aiops Dashboard To Monitor Diagrams PDF
The following slide highlights the various key performance indicators of the AIOp, these can be problem quick review, cloud and infrastructure and applications health. If you are looking for a format to display your unique thoughts, then the professionally designed Information Technology Operations Administration With ML Aiops Dashboard To Monitor Diagrams PDF is the one for you. You can use it as a Google Slides template or a PowerPoint template. Incorporate impressive visuals, symbols, images, and other charts. Modify or reorganize the text boxes as you desire. Experiment with shade schemes and font pairings. Alter, share or cooperate with other people on your work. Download Information Technology Operations Administration With ML Aiops Dashboard To Monitor Diagrams PDF and find out how to give a successful presentation. Present a perfect display to your team and make your presentation unforgettable.

Operational Strategy For ML In IT Sector Aiops Dashboard To Monitor IT Operations Diagrams PDF
The following slide highlights the various key performance indicators of the AIOps, these can be problem quick review, cloud and infrastructure and applications health If you are looking for a format to display your unique thoughts, then the professionally designed Operational Strategy For ML In IT Sector Aiops Dashboard To Monitor IT Operations Diagrams PDF is the one for you. You can use it as a Google Slides template or a PowerPoint template. Incorporate impressive visuals, symbols, images, and other charts. Modify or reorganize the text boxes as you desire. Experiment with shade schemes and font pairings. Alter, share or cooperate with other people on your work. Download Operational Strategy For ML In IT Sector Aiops Dashboard To Monitor IT Operations Diagrams PDF and find out how to give a successful presentation. Present a perfect display to your team and make your presentation unforgettable.
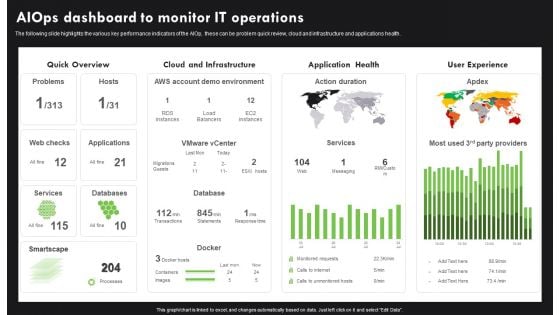
AI Deployment In IT Process Aiops Dashboard To Monitor IT Operations Infographics PDF
The following slide highlights the various key performance indicators of the AIOp, these can be problem quick review, cloud and infrastructure and applications health. If you are looking for a format to display your unique thoughts, then the professionally designed AI Deployment In IT Process Aiops Dashboard To Monitor IT Operations Infographics PDF is the one for you. You can use it as a Google Slides template or a PowerPoint template. Incorporate impressive visuals, symbols, images, and other charts. Modify or reorganize the text boxes as you desire. Experiment with shade schemes and font pairings. Alter, share or cooperate with other people on your work. Download AI Deployment In IT Process Aiops Dashboard To Monitor IT Operations Infographics PDF and find out how to give a successful presentation. Present a perfect display to your team and make your presentation unforgettable.
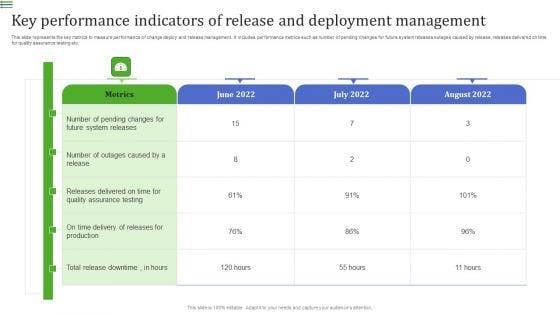
Key Performance Indicators Of Release And Deployment Management Demonstration PDF
This slide represents the key metrics to measure performance of change deploy and release management. It includes performance metrics such as number of pending changes for future system releases outages caused by release, releases delivered on time for quality assurance testing etc.Pitch your topic with ease and precision using this Key Performance Indicators Of Release And Deployment Management Demonstration PDF. This layout presents information on System Releases, Assurance Testing, Outages Caused. It is also available for immediate download and adjustment. So, changes can be made in the color, design, graphics or any other component to create a unique layout.
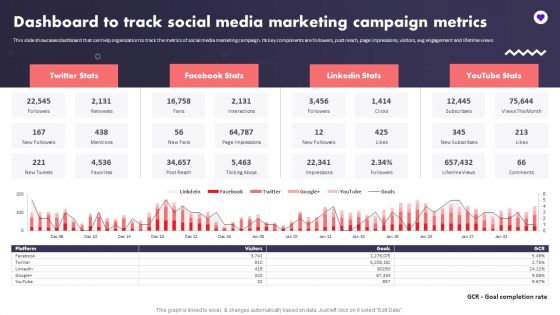
Social Media Promotional Technique Dashboard To Track Social Media Marketing Inspiration PDF
This slide showcases dashboard that can help organization to track the metrics of social media marketing campaign. Its key components are followers, post reach, page impressions, visitors, avg engagement and lifetime views. Want to ace your presentation in front of a live audience Our Social Media Promotional Technique Dashboard To Track Social Media Marketing Inspiration PDF can help you do that by engaging all the users towards you.. Slidegeeks experts have put their efforts and expertise into creating these impeccable powerpoint presentations so that you can communicate your ideas clearly. Moreover, all the templates are customizable, and easy-to-edit and downloadable. Use these for both personal and commercial use.
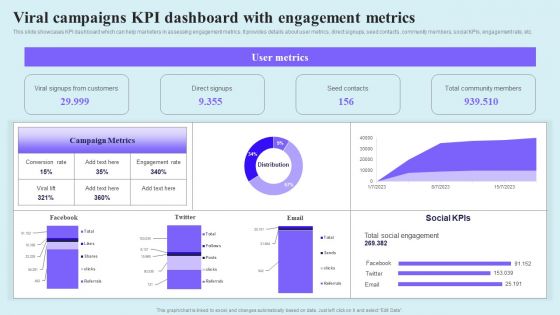
Go Viral Campaign Strategies To Increase Engagement Viral Campaigns KPI Dashboard With Engagement Demonstration PDF
This slide showcases KPI dashboard which can help marketers in assessing engagement metrics. It provides details about user metrics, direct signups, seed contacts, community members, social KPIs, engagement rate, etc. Take your projects to the next level with our ultimate collection of Go Viral Campaign Strategies To Increase Engagement Viral Campaigns KPI Dashboard With Engagement Demonstration PDF. Slidegeeks has designed a range of layouts that are perfect for representing task or activity duration, keeping track of all your deadlines at a glance. Tailor these designs to your exact needs and give them a truly corporate look with your own brand colors they will make your projects stand out from the rest.
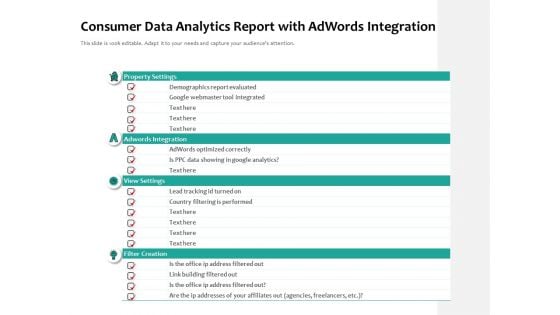
Consumer Data Analytics Report With Adwords Integration Ppt PowerPoint Presentation Gallery Sample PDF
Pitch your topic with ease and precision using this consumer data analytics report with adwords integration ppt powerpoint presentation gallery sample pdf. This layout presents information on property settings, adwords integration, view settings, filter creation. It is also available for immediate download and adjustment. So, changes can be made in the color, design, graphics or any other component to create a unique layout.
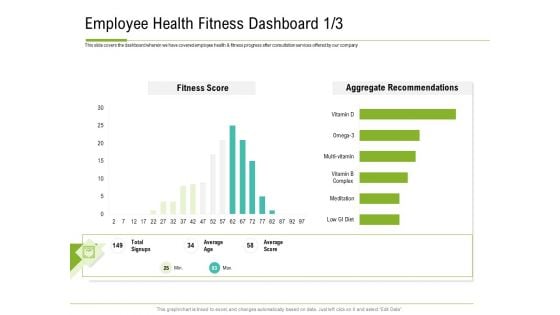
Corporate Wellness Consultant Employee Health Fitness Dashboard Age Pictures PDF
Presenting this set of slides with name corporate wellness consultant employee health fitness dashboard age pictures pdf. The topics discussed in these slide is employee health fitness dashboard. This is a completely editable PowerPoint presentation and is available for immediate download. Download now and impress your audience.
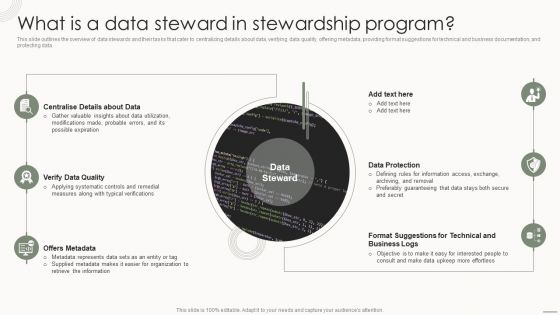
Data Governance IT What Is A Data Steward In Stewardship Program Elements PDF
This slide outlines the overview of data stewards and their tasks that cater to centralizing details about data, verifying data quality, offering metadata, providing format suggestions for technical and business documentation, and protecting data. If your project calls for a presentation, then Slidegeeks is your go to partner because we have professionally designed, easy to edit templates that are perfect for any presentation. After downloading, you can easily edit Data Governance IT What Is A Data Steward In Stewardship Program Elements PDF and make the changes accordingly. You can rearrange slides or fill them with different images. Check out all the handy templates.
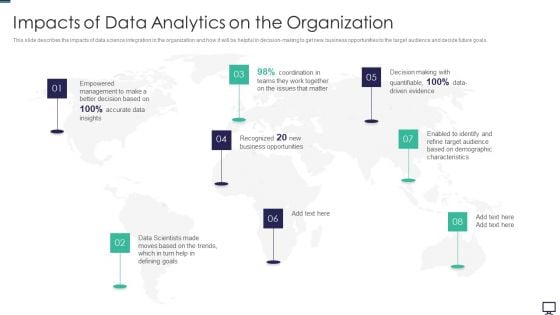
Impacts Of Data Analytics On The Organization Ppt Styles Designs Download PDF
This slide describes the impacts of data science integration in the organization and how it will be helpful in decision-making to get new business opportunities to the target audience and decide future goals. This is a impacts of data analytics on the organization ppt styles designs download pdf template with various stages. Focus and dispense information on eight stages using this creative set, that comes with editable features. It contains large content boxes to add your information on topics like business opportunities, data, goals, demographic, management. You can also showcase facts, figures, and other relevant content using this PPT layout. Grab it now.
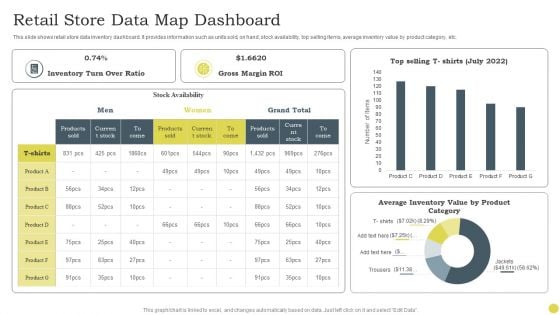
Retail Store Data Map Dashboard Ppt PowerPoint Presentation Gallery Display PDF
This slide shows retail store data inventory dashboard. It provides information such as units sold, on hand, stock availability, top selling items, average inventory value by product category, etc. Pitch your topic with ease and precision using this Retail Store Data Map Dashboard Ppt PowerPoint Presentation Gallery Display PDF. This layout presents information on Inventory Turn, Over Ratio, Gross Margin ROI. It is also available for immediate download and adjustment. So, changes can be made in the color, design, graphics or any other component to create a unique layout.
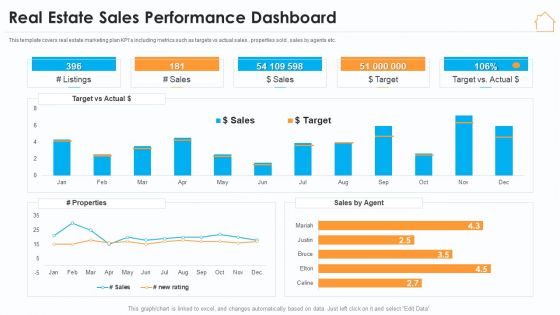
Real Estate Marketing Strategy Vendors Real Estate Sales Performance Dashboard Graphics PDF
This template covers real estate marketing plan KPIs including metrics such as targets vs actual sales , properties sold , sales by agents etc. Deliver an awe inspiring pitch with this creative real estate marketing strategy vendors real estate sales performance dashboard graphics pdf bundle. Topics like target, sales, performance dashboard can be discussed with this completely editable template. It is available for immediate download depending on the needs and requirements of the user.
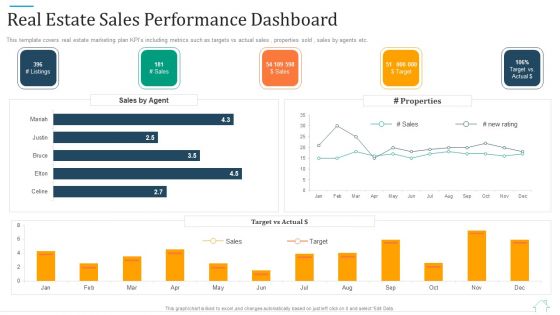
Promotional Strategy For Real Estate Project Real Estate Sales Performance Dashboard Information PDF
This template covers real estate marketing plan KPIs including metrics such as targets vs actual sales , properties sold , sales by agents etc. Deliver an awe inspiring pitch with this creative promotional strategy for real estate project real estate sales performance dashboard information pdf bundle. Topics like real estate sales performance dashboard can be discussed with this completely editable template. It is available for immediate download depending on the needs and requirements of the user.
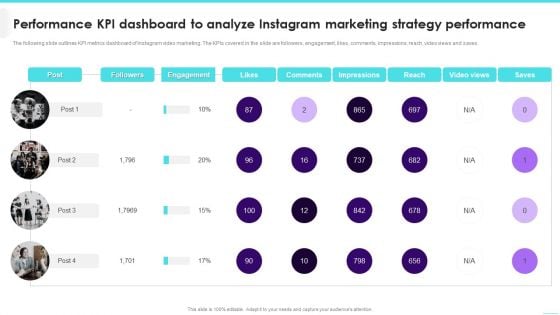
Performance KPI Dashboard To Analyze Instagram Marketing Strategy Performance Infographics PDF
The following slide outlines KPI metrics dashboard of Instagram video marketing. The KPIs covered in the slide are followers, engagement, likes, comments, impressions, reach, video views and saves.Deliver an awe inspiring pitch with this creative Performance KPI Dashboard To Analyze Instagram Marketing Strategy Performance Infographics PDF bundle. Topics like Engagement, Impressions, Comments can be discussed with this completely editable template. It is available for immediate download depending on the needs and requirements of the user.
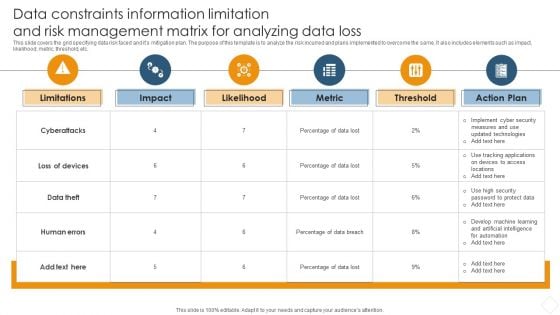
Data Constraints Information Limitation And Risk Management Matrix For Analyzing Data Loss Brochure PDF
This slide covers the grid specifying data risk faced and its mitigation plan. The purpose of this template is to analyze the risk incurred and plans implemented to overcome the same. It also includes elements such as impact, likelihood, metric, threshold, etc.Showcasing this set of slides titled Data Constraints Information Limitation And Risk Management Matrix For Analyzing Data Loss Brochure PDF. The topics addressed in these templates are Data Distribution, Secure Computation, Verifiable Computation. All the content presented in this PPT design is completely editable. Download it and make adjustments in color, background, font etc. as per your unique business setting.
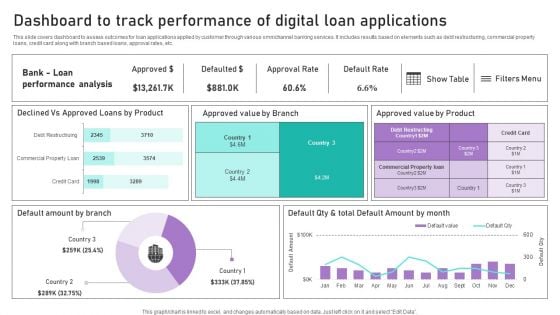
Dashboard To Track Performance Of Digital Loan Applications Ppt Infographics PDF
This slide covers dashboard to assess outcomes for loan applications applied by customer through various omnichannel banking services. It includes results based on elements such as debt restructuring, commercial property loans, credit card along with branch based loans, approval rates, etc. Are you in need of a template that can accommodate all of your creative concepts This one is crafted professionally and can be altered to fit any style. Use it with Google Slides or PowerPoint. Include striking photographs, symbols, depictions, and other visuals. Fill, move around, or remove text boxes as desired. Test out color palettes and font mixtures. Edit and save your work, or work with colleagues. Download Dashboard To Track Performance Of Digital Loan Applications Ppt Infographics PDF and observe how to make your presentation outstanding. Give an impeccable presentation to your group and make your presentation unforgettable.
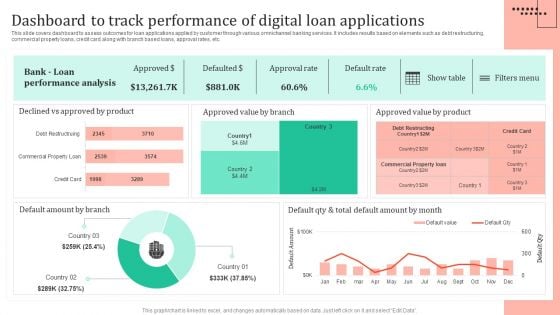
Omnichannel Strategy Implementation For Banking Solutions Dashboard To Track Performance Of Digital Summary PDF
This slide covers dashboard to assess outcomes for loan applications applied by customer through various omnichannel banking services. It includes results based on elements such as debt restructuring, commercial property loans, credit card along with branch based loans, approval rates, etc. Boost your pitch with our creative Omnichannel Strategy Implementation For Banking Solutions Dashboard To Track Performance Of Digital Summary PDF. Deliver an awe-inspiring pitch that will mesmerize everyone. Using these presentation templates you will surely catch everyones attention. You can browse the ppts collection on our website. We have researchers who are experts at creating the right content for the templates. So you do not have to invest time in any additional work. Just grab the template now and use them.
New Website Launch Strategy Key Performance Indicators To Track SEO Performance Pictures PDF
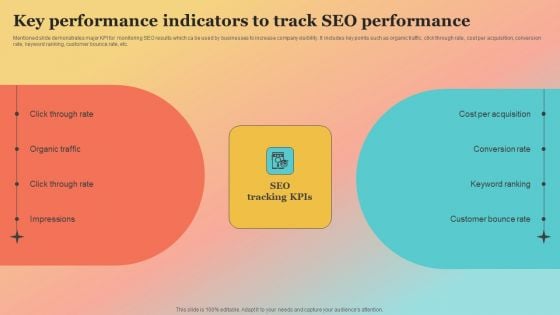
Mentioned slide demonstrates major KPI for monitoring SEO results which ca be used by businesses to increase company visibility. It includes key points such as organic traffic, click through rate, cost per acquisition, conversion rate, keyword ranking, customer bounce rate, etc. From laying roadmaps to briefing everything in detail, our templates are perfect for you. You can set the stage with your presentation slides. All you have to do is download these easy to edit and customizable templates. New Website Launch Strategy Key Performance Indicators To Track SEO Performance Pictures PDF will help you deliver an outstanding performance that everyone would remember and praise you for. Do download this presentation today.
Project Feasibility Analysis Matrix Feasibility Analysis Report For Construction Project Designs PDF
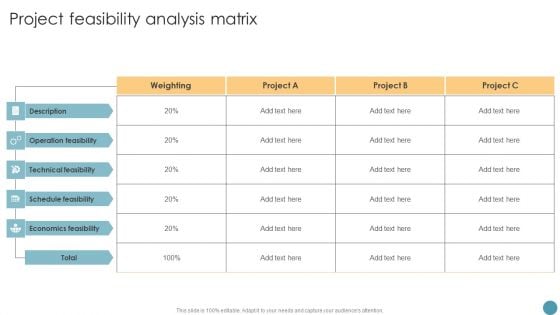
The Project Feasibility Analysis Matrix Feasibility Analysis Report For Construction Project Designs PDF is a compilation of the most recent design trends as a series of slides. It is suitable for any subject or industry presentation, containing attractive visuals and photo spots for businesses to clearly express their messages. This template contains a variety of slides for the user to input data, such as structures to contrast two elements, bullet points, and slides for written information. Slidegeeks is prepared to create an impression.


 Continue with Email

 Home
Home


