Business Snapshot

Corporate Occasion Videography Proposal Cover Letter For Business Event Photography Ppt Infographic Template Design Templates PDF
Deliver an awe inspiring pitch with this creative corporate occasion videography proposal cover letter for business event photography ppt infographic template design templates pdf bundle. Topics like cover letter can be discussed with this completely editable template. It is available for immediate download depending on the needs and requirements of the user.
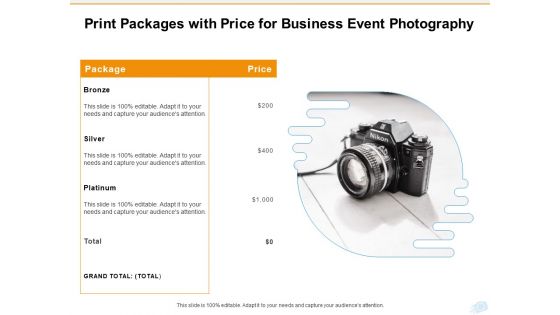
Corporate Occasion Videography Proposal Print Packages With Price For Business Event Photography Microsoft PDF
Deliver an awe inspiring pitch with this creative corporate occasion videography proposal print packages with price for business event photography microsoft pdf bundle. Topics like bronze, silver, platinum can be discussed with this completely editable template. It is available for immediate download depending on the needs and requirements of the user.
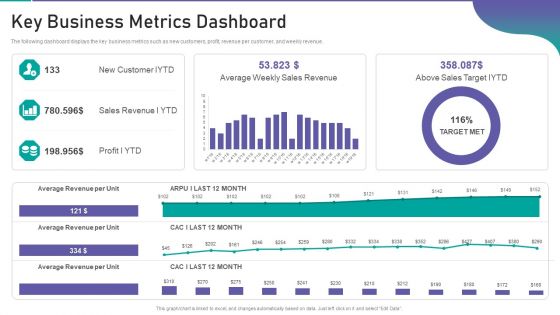
Corporate Organization Playbook Key Business Metrics Dashboard Ppt Show Rules PDF
The following dashboard displays the key business metrics such as new customers, profit, revenue per customer, and weekly revenue. Deliver an awe inspiring pitch with this creative corporate organization playbook key business metrics dashboard ppt show rules pdf bundle. Topics like new customer iytd, sales revenue i ytd, profit i ytd can be discussed with this completely editable template. It is available for immediate download depending on the needs and requirements of the user.
Performance Indicators Of Business Icons Ppt Powerpoint Presentation Infographics Graphics Template
This is a performance indicators of business icons ppt powerpoint presentation infographics graphics template. This is a four stage process. The stages in this process are dashboard, kpi, metrics.
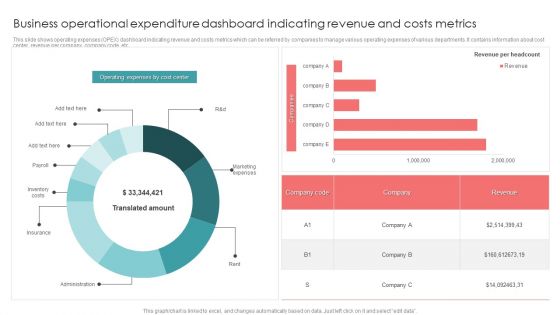
Business Operational Expenditure Dashboard Indicating Revenue And Costs Metrics Pictures PDF
This slide shows operating expenses OPEX dashboard indicating revenue and costs metrics which can be referred by companies to manage various operating expenses of various departments. It contains information about cost center, revenue per company, company code, etc. Pitch your topic with ease and precision using this Business Operational Expenditure Dashboard Indicating Revenue And Costs Metrics Pictures PDF. This layout presents information on Business Operational, Costs Metrics, Revenue. It is also available for immediate download and adjustment. So, changes can be made in the color, design, graphics or any other component to create a unique layout.
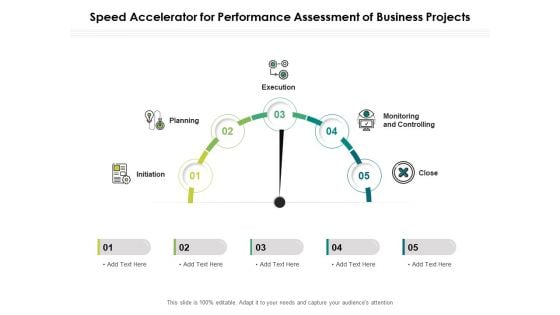
Speed Accelerator For Performance Assessment Of Business Projects Ppt PowerPoint Presentation Show Example Introduction PDF
Presenting this set of slides with name speed accelerator for performance assessment of business projects ppt powerpoint presentation show example introduction pdf. This is a five stage process. The stages in this process are initiation, planning, execution, monitoring and controlling, close. This is a completely editable PowerPoint presentation and is available for immediate download. Download now and impress your audience.
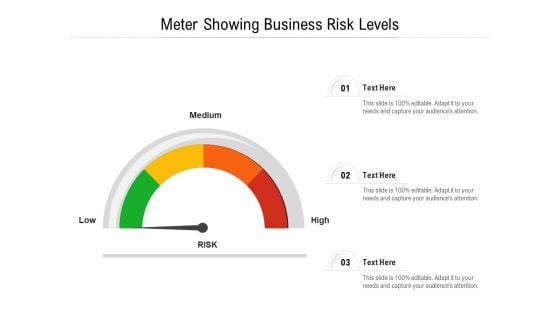
Meter Showing Business Risk Levels Ppt PowerPoint Presentation Show Slide PDF
Persuade your audience using this meter showing business risk levels ppt powerpoint presentation show slide pdf. This PPT design covers three stages, thus making it a great tool to use. It also caters to a variety of topics including low, medium, high. Download this PPT design now to present a convincing pitch that not only emphasizes the topic but also showcases your presentation skills.
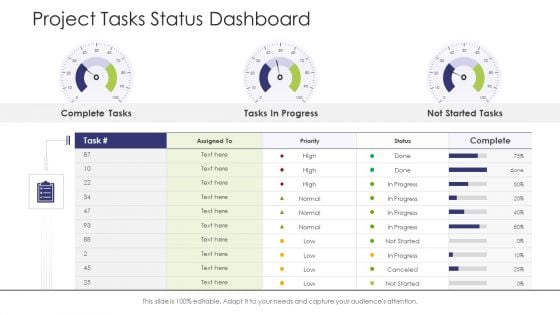
Business Venture Tactical Planning Complete PPT Deck Project Tasks Status Dashboard Infographics PDF
This is a business venture tactical planning complete ppt deck project tasks status dashboard infographics pdf template with various stages. Focus and dispense information on three stages using this creative set, that comes with editable features. It contains large content boxes to add your information on topics like project tasks status dashboard. You can also showcase facts, figures, and other relevant content using this PPT layout. Grab it now.
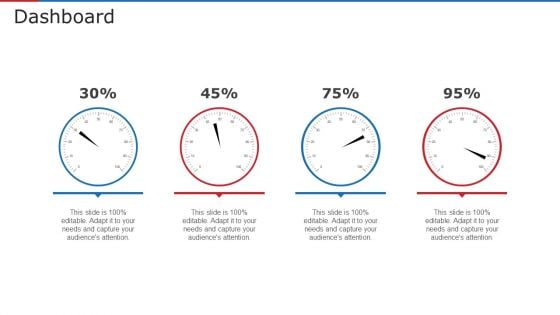
Subscription Based Business Model For New Ventures Dashboard Ppt Ideas Show PDF
This is a subscription based business model for new ventures dashboard ppt ideas show pdf template with various stages. Focus and dispense information on four stages using this creative set, that comes with editable features. It contains large content boxes to add your information on topics like dashboard. You can also showcase facts, figures, and other relevant content using this PPT layout. Grab it now.
Business Data Report Dashboard Vector Icon Ppt PowerPoint Presentation File Maker PDF
Presenting business data report dashboard vector icon ppt powerpoint presentation file maker pdf to dispense important information. This template comprises three stages. It also presents valuable insights into the topics including business data report dashboard vector icon. This is a completely customizable PowerPoint theme that can be put to use immediately. So, download it and address the topic impactfully.
Increasing Business Awareness Tracking Dashboard For Social Media Engagement Strategy SS V
This slide represents a dashboard tracking multiple social media campaigns performance KPIs. It includes metrics such as average impressions per post, average reach, engagement rate, click through rate, reactions and CTR. This Increasing Business Awareness Tracking Dashboard For Social Media Engagement Strategy SS V is perfect for any presentation, be it in front of clients or colleagues. It is a versatile and stylish solution for organizing your meetings. The Increasing Business Awareness Tracking Dashboard For Social Media Engagement Strategy SS V features a modern design for your presentation meetings. The adjustable and customizable slides provide unlimited possibilities for acing up your presentation. Slidegeeks has done all the homework before launching the product for you. So, do not wait, grab the presentation templates today This slide represents a dashboard tracking multiple social media campaigns performance KPIs. It includes metrics such as average impressions per post, average reach, engagement rate, click through rate, reactions and CTR.
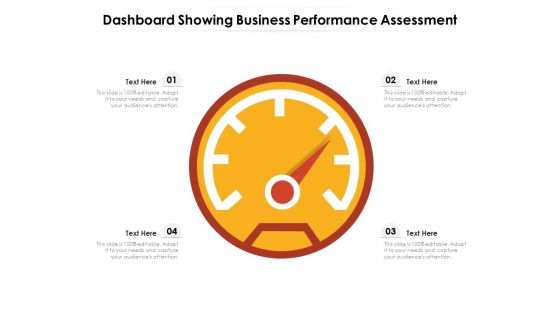
Dashboard Showing Business Performance Assessment Ppt PowerPoint Presentation Portfolio Design Templates PDF
Presenting dashboard showing business performance assessment ppt powerpoint presentation portfolio design templates pdf to dispense important information. This template comprises four stages. It also presents valuable insights into the topics including dashboard showing business performance assessment. This is a completely customizable PowerPoint theme that can be put to use immediately. So, download it and address the topic impactfully.

Estimating Business Overall Kpi Metrics Dashboard Highlighting Organization Revenue Clipart PDF
The following slide outlines key performance indicator KPI dashboard showcasing various financial metrics of the organization. The key metrics are gross revenue, product revenue, service revenue, gross profit, net profit etc. Formulating a presentation can take up a lot of effort and time, so the content and message should always be the primary focus. The visuals of the PowerPoint can enhance the presenters message, so our Estimating Business Overall Kpi Metrics Dashboard Highlighting Organization Revenue Clipart PDF was created to help save time. Instead of worrying about the design, the presenter can concentrate on the message while our designers work on creating the ideal templates for whatever situation is needed. Slidegeeks has experts for everything from amazing designs to valuable content, we have put everything into Estimating Business Overall Kpi Metrics Dashboard Highlighting Organization Revenue Clipart PDF.
Bulb For Business Innovation Vector Icon Ppt Powerpoint Presentation Infographic Template Picture
This is a bulb for business innovation vector icon ppt powerpoint presentation infographic template picture. This is a three stage process. The stages in this process are business plan, business strategy, business idea.
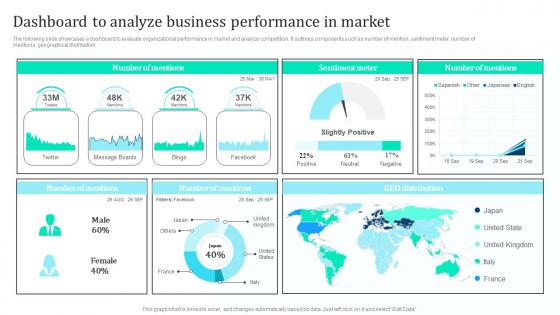
Dashboard Analyze Business Performance Marketing Intelligence Guide Data Gathering Microsoft Pdf
The following slide showcases a dashboard to evaluate organizational performance in market and analyze competition. It outlines components such as number of mention, sentiment meter, number of mentions, geographical distribution. Do you have to make sure that everyone on your team knows about any specific topic I yes, then you should give Dashboard Analyze Business Performance Marketing Intelligence Guide Data Gathering Microsoft Pdf a try. Our experts have put a lot of knowledge and effort into creating this impeccable Dashboard Analyze Business Performance Marketing Intelligence Guide Data Gathering Microsoft Pdf. You can use this template for your upcoming presentations, as the slides are perfect to represent even the tiniest detail. You can download these templates from the Slidegeeks website and these are easy to edit. So grab these today The following slide showcases a dashboard to evaluate organizational performance in market and analyze competition. It outlines components such as number of mention, sentiment meter, number of mentions, geographical distribution.
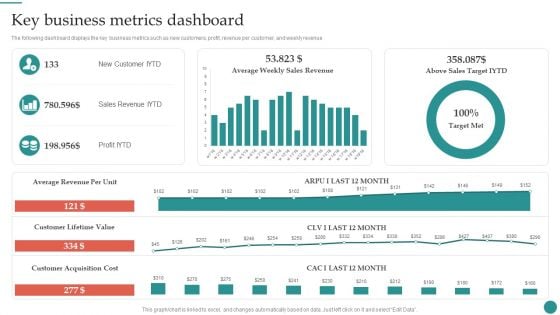
Key Business Metrics Dashboard Company Process Administration And Optimization Playbook Infographics PDF
The following dashboard displays the key business metrics such as new customers, profit, revenue per customer, and weekly revenue. Slidegeeks is here to make your presentations a breeze with Key Business Metrics Dashboard Company Process Administration And Optimization Playbook Infographics PDF With our easy-to-use and customizable templates, you can focus on delivering your ideas rather than worrying about formatting. With a variety of designs to choose from, you are sure to find one that suits your needs. And with animations and unique photos, illustrations, and fonts, you can make your presentation pop. So whether you are giving a sales pitch or presenting to the board, make sure to check out Slidegeeks first.
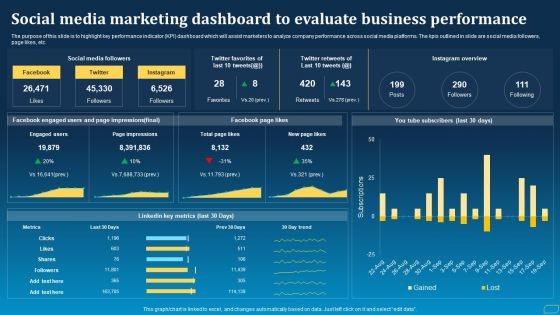
Direct Marketing Techniques To Enhance Business Presence Social Media Marketing Dashboard To Evaluate Rules PDF
The purpose of this slide is to highlight key performance indicator KPI dashboard which will assist marketers to analyze company performance across social media platforms. The kpis outlined in slide are social media followers, page likes, etc. Make sure to capture your audiences attention in your business displays with our gratis customizable Direct Marketing Techniques To Enhance Business Presence Social Media Marketing Dashboard To Evaluate Rules PDF. These are great for business strategies, office conferences, capital raising or task suggestions. If you desire to acquire more customers for your tech business and ensure they stay satisfied, create your own sales presentation with these plain slides.
Business Performance Analysis Report Vector Icon Ppt PowerPoint Presentation File Visuals PDF
Presenting business performance analysis report vector icon ppt powerpoint presentation file visuals pdf to dispense important information. This template comprises three stages. It also presents valuable insights into the topics including business performance analysis report vector icon. This is a completely customizable PowerPoint theme that can be put to use immediately. So, download it and address the topic impactfully.
Business Analytics Dashboard Vector Icon Ppt PowerPoint Presentation File Templates PDF
Presenting this set of slides with name business analytics dashboard vector icon ppt powerpoint presentation file templates pdf. This is a one stage process. The stages in this process is business analytics dashboard vector icon. This is a completely editable PowerPoint presentation and is available for immediate download. Download now and impress your audience.
Business Report Analysis Vector Icon Ppt PowerPoint Presentation Gallery Visual Aids PDF
Presenting business report analysis vector icon ppt powerpoint presentation gallery visual aids pdf to dispense important information. This template comprises three stages. It also presents valuable insights into the topics including business report analysis vector icon. This is a completely customizable PowerPoint theme that can be put to use immediately. So, download it and address the topic impactfully.
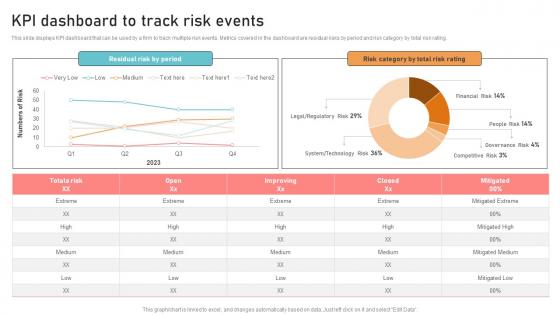
Optimizing Business Integration KPI Dashboard To Track Risk Events Designs Pdf
This slide displays KPI dashboard that can be used by a firm to track multiple risk events. Metrics covered in the dashboard are residual risks by period and risk category by total risk rating. Crafting an eye catching presentation has never been more straightforward. Let your presentation shine with this tasteful yet straightforward Optimizing Business Integration KPI Dashboard To Track Risk Events Designs Pdf template. It offers a minimalistic and classy look that is great for making a statement. The colors have been employed intelligently to add a bit of playfulness while still remaining professional. Construct the ideal Optimizing Business Integration KPI Dashboard To Track Risk Events Designs Pdf that effortlessly grabs the attention of your audience. Begin now and be certain to wow your customers. This slide displays KPI dashboard that can be used by a firm to track multiple risk events. Metrics covered in the dashboard are residual risks by period and risk category by total risk rating.
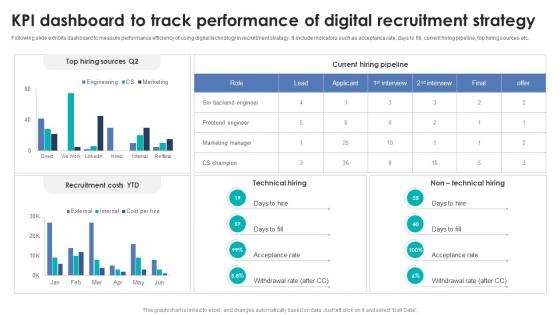
Integrating Automation For Effective Business Kpi Dashboard To Track Performance Of Digital
Following slide exhibits dashboard to measure performance efficiency of using digital technology in recruitment strategy. It include indicators such as acceptance rate, days to fill, current hiring pipeline, top hiring sources etc. Crafting an eye-catching presentation has never been more straightforward. Let your presentation shine with this tasteful yet straightforward Integrating Automation For Effective Business Kpi Dashboard To Track Performance Of Digital template. It offers a minimalistic and classy look that is great for making a statement. The colors have been employed intelligently to add a bit of playfulness while still remaining professional. Construct the ideal Integrating Automation For Effective Business Kpi Dashboard To Track Performance Of Digital that effortlessly grabs the attention of your audience Begin now and be certain to wow your customers Following slide exhibits dashboard to measure performance efficiency of using digital technology in recruitment strategy. It include indicators such as acceptance rate, days to fill, current hiring pipeline, top hiring sources etc.
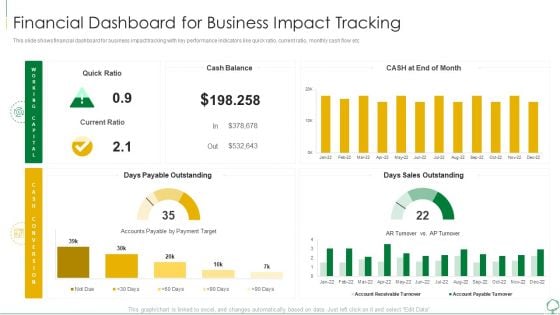
Environmental Examination Tools And Approaches Financial Dashboard For Business Professional PDF
This slide shows financial dashboard for business impact tracking with key performance indicators like quick ratio, current ratio, monthly cash flow etc. Deliver an awe inspiring pitch with this creative environmental examination tools and approaches financial dashboard for business professional pdf bundle. Topics like financial dashboard for business impact tracking can be discussed with this completely editable template. It is available for immediate download depending on the needs and requirements of the user.
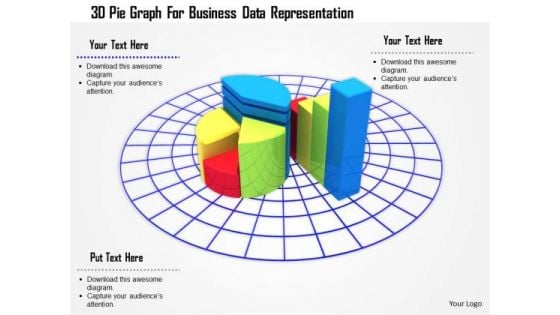
Stock Photo 3d Pie Graph For Business Data Representation PowerPoint Slide
3D business graph has been used to design this PowerPoint template. This Image slide is suitable to make business reports and charts. This slide can be used for business and marketing presentations.
Business Deal Performance Meter Vector Icon Ppt PowerPoint Presentation Infographic Template Graphic Images PDF
Presenting business deal performance meter vector icon ppt powerpoint presentation infographic template graphic images pdf to dispense important information. This template comprises three stages. It also presents valuable insights into the topics including business deal performance meter vector icon. This is a completely customizable PowerPoint theme that can be put to use immediately. So, download it and address the topic impactfully.
Business Vendors Trust Meter Vector Icon Ppt PowerPoint Presentation Layouts Example PDF
Presenting business vendors trust meter vector icon ppt powerpoint presentation layouts example pdf to dispense important information. This template comprises three stages. It also presents valuable insights into the topics including business vendors trust meter vector icon. This is a completely customizable PowerPoint theme that can be put to use immediately. So, download it and address the topic impactfully.
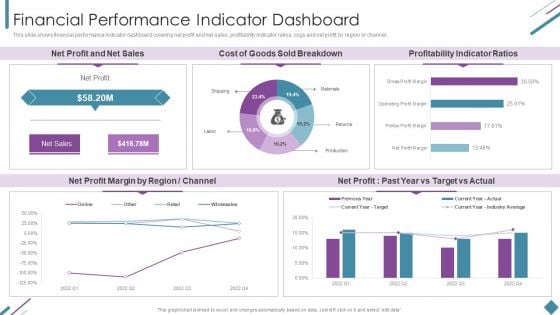
Metrics To Measure Business Performance Financial Performance Indicator Dashboard Pictures PDF
This slide shows financial performance indicator dashboard covering net profit and net sales, profitability indicator ratios, cogs and net profit by region or channel. Deliver an awe inspiring pitch with this creative Metrics To Measure Business Performance Financial Performance Indicator Dashboard Pictures PDF bundle. Topics like Net Profit, Net Sales, Cost Goods, Sold Breakdown can be discussed with this completely editable template. It is available for immediate download depending on the needs and requirements of the user.
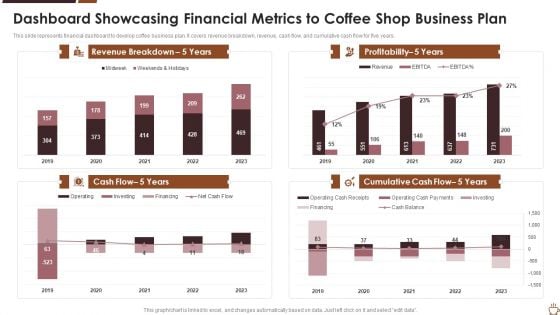
Dashboard Showcasing Financial Metrics To Coffee Shop Business Plan Background PDF
This slide represents financial dashboard to develop coffee business plan. It covers revenue breakdown, revenue, cash flow, and cumulative cash flow for five years. Showcasing this set of slides titled dashboard showcasing financial metrics to coffee shop business plan background pdf. The topics addressed in these templates are dashboard showcasing financial metrics to coffee shop business plan. All the content presented in this PPT design is completely editable. Download it and make adjustments in color, background, font etc. as per your unique business setting.
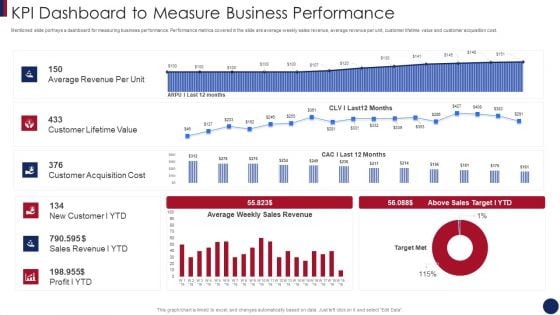
Post Merger Information Technology Service Delivery Amalgamation KPI Dashboard To Measure Business Template PDF
Mentioned slide portrays a dashboard for measuring business performance. Performance metrics covered in the slide are average weekly sales revenue, average revenue per unit, customer lifetime value and customer acquisition cost. Deliver an awe inspiring pitch with this creative post merger information technology service delivery amalgamation kpi dashboard to measure business template pdf bundle. Topics like kpi dashboard to measure business performance can be discussed with this completely editable template. It is available for immediate download depending on the needs and requirements of the user.
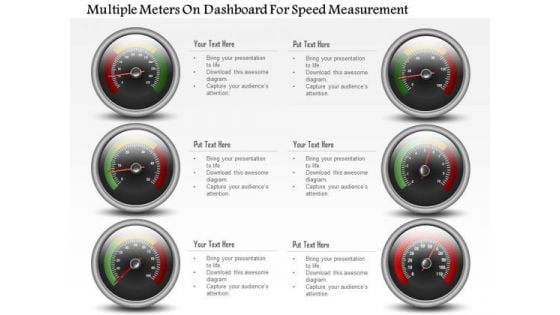
Business Diagram Multiple Meters On Dashboard For Speed Measurement PowerPoint Slide
This business diagram has been designed with multiple meters on dashboard. This slide can be used for business planning and progress. Use this diagram for your business and success milestones related presentations.
Business Reports Dashboard Vector Icon Ppt PowerPoint Presentation Model Maker PDF
Showcasing this set of slides titled business reports dashboard vector icon ppt powerpoint presentation model maker pdf. The topics addressed in these templates are business reports dashboard vector icon. All the content presented in this PPT design is completely editable. Download it and make adjustments in color, background, font etc. as per your unique business setting.
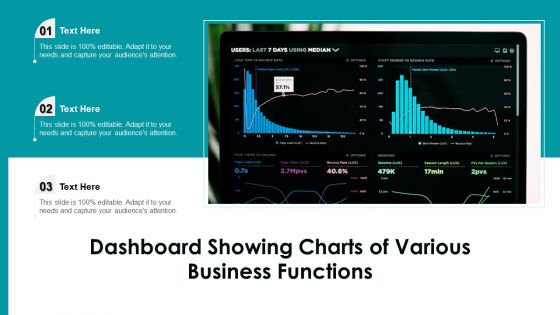
Dashboard Showing Charts Of Various Business Functions Ppt PowerPoint Presentation Gallery Inspiration PDF
Showcasing this set of slides titled dashboard showing charts of various business functions ppt powerpoint presentation gallery inspiration pdf. The topics addressed in these templates are dashboard showing charts of various business functions. All the content presented in this PPT design is completely editable. Download it and make adjustments in color, background, font etc. as per your unique business setting.
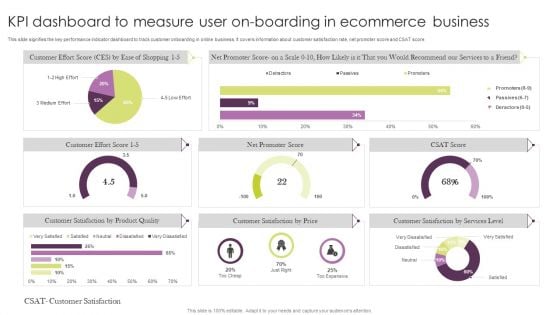
KPI Dashboard To Measure User On Boarding In Ecommerce Business Microsoft PDF
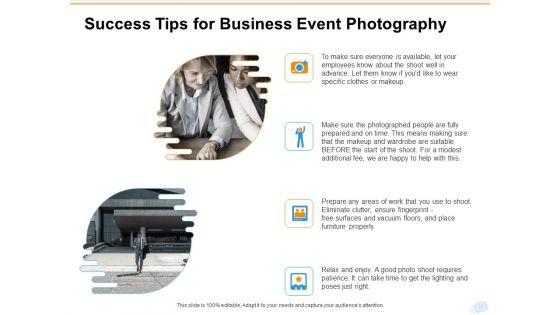
Corporate Occasion Videography Proposal Success Tips For Business Event Photography Structure PDF
This is a corporate occasion videography proposal success tips for business event photography structure pdf template with various stages. Focus and dispense information on four stages using this creative set, that comes with editable features. It contains large content boxes to add your information on topics like success tips for business event photography. You can also showcase facts, figures, and other relevant content using this PPT layout. Grab it now.
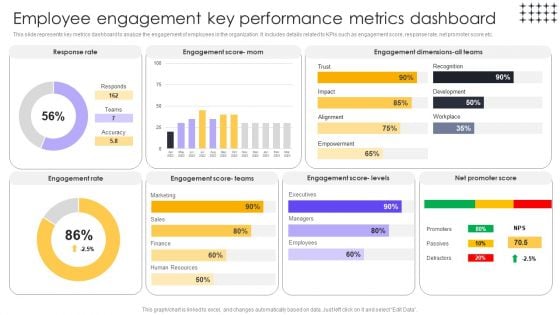
Tools For HR Business Analytics Employee Engagement Key Performance Metrics Brochure PDF
This slide represents key metrics dashboard to analyze the engagement of employees in the organization. It includes details related to KPIs such as engagement score, response rate, net promoter score etc. Make sure to capture your audiences attention in your business displays with our gratis customizable Tools For HR Business Analytics Employee Engagement Key Performance Metrics Brochure PDF. These are great for business strategies, office conferences, capital raising or task suggestions. If you desire to acquire more customers for your tech business and ensure they stay satisfied, create your own sales presentation with these plain slides.
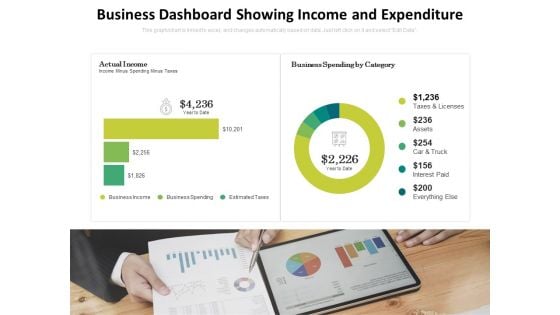
Business Dashboard Showing Income And Expenditure Ppt PowerPoint Presentation Pictures Good PDF
Presenting this set of slides with name business dashboard showing income and expenditure ppt powerpoint presentation pictures good pdf. The topics discussed in these slides are actual income, business spending by category, estimated taxes, business income, taxes and licenses, assets, car and truck. This is a completely editable PowerPoint presentation and is available for immediate download. Download now and impress your audience.
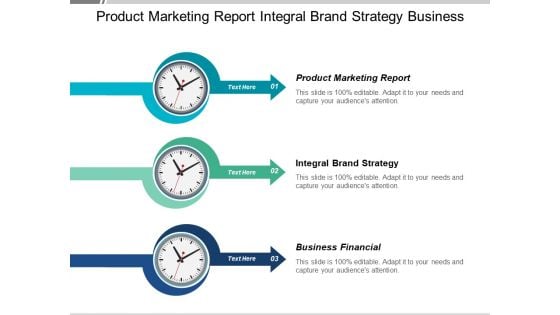
Product Marketing Report Integral Brand Strategy Business Financial Ppt PowerPoint Presentation Inspiration Backgrounds
This is a product marketing report integral brand strategy business financial ppt powerpoint presentation inspiration backgrounds. This is a three stage process. The stages in this process are product marketing report, integral brand strategy, business financial.
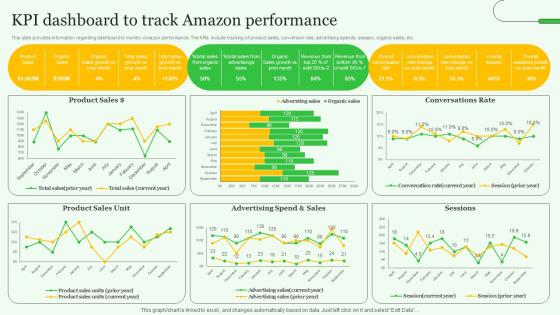
KPI Dashboard To Track Amazon Exploring Amazons Global Business Model Growth Themes Pdf
This slide provides information regarding dashboard to monitor Amazon performance. The KPIs include tracking of product sales, conversion rate, advertising spends, session, organic sales, etc. Are you searching for a KPI Dashboard To Track Amazon Exploring Amazons Global Business Model Growth Themes Pdf that is uncluttered, straightforward, and original Its easy to edit, and you can change the colors to suit your personal or business branding. For a presentation that expresses how much effort you have put in, this template is ideal With all of its features, including tables, diagrams, statistics, and lists, its perfect for a business plan presentation. Make your ideas more appealing with these professional slides. Download KPI Dashboard To Track Amazon Exploring Amazons Global Business Model Growth Themes Pdf from Slidegeeks today. This slide provides information regarding dashboard to monitor Amazon performance. The KPIs include tracking of product sales, conversion rate, advertising spends, session, organic sales, etc.
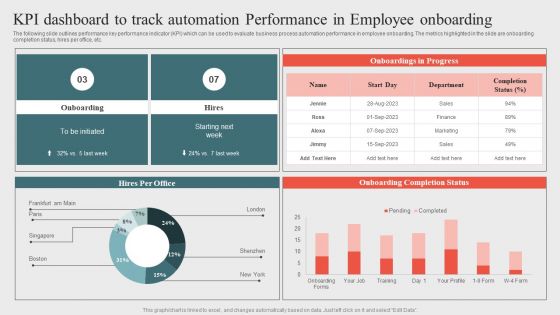
Kpi Dashboard To Track Automation Performanceoptimizing Business Processes Through Automation Summary PDF
The following slide outlines performance key performance indicator KPI which can be used to evaluate business process automation performance in employee onboarding. The metrics highlighted in the slide are onboarding completion status, hires per office, etc. Do you have to make sure that everyone on your team knows about any specific topic I yes, then you should give Kpi Dashboard To Track Automation Performanceoptimizing Business Processes Through Automation Summary PDF a try. Our experts have put a lot of knowledge and effort into creating this impeccable Kpi Dashboard To Track Automation Performanceoptimizing Business Processes Through Automation Summary PDF. You can use this template for your upcoming presentations, as the slides are perfect to represent even the tiniest detail. You can download these templates from the Slidegeeks website and these are easy to edit. So grab these today.
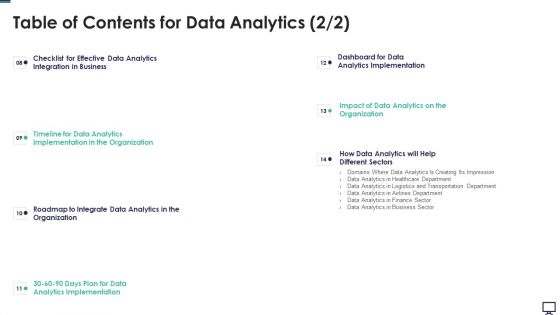
Table Of Contents For Data Analytics Business Ppt Show Demonstration PDF
Deliver an awe inspiring pitch with this creative table of contents for data analytics business ppt show demonstration pdf bundle. Topics like business, data analytics, organization, implementation, dashboard can be discussed with this completely editable template. It is available for immediate download depending on the needs and requirements of the user.
Business Reports Analysis Vector Icon Ppt PowerPoint Presentation Model Structure PDF
Persuade your audience using this business reports analysis vector icon ppt powerpoint presentation model structure pdf. This PPT design covers three stages, thus making it a great tool to use. It also caters to a variety of topics including business reports analysis vector icon. Download this PPT design now to present a convincing pitch that not only emphasizes the topic but also showcases your presentation skills.
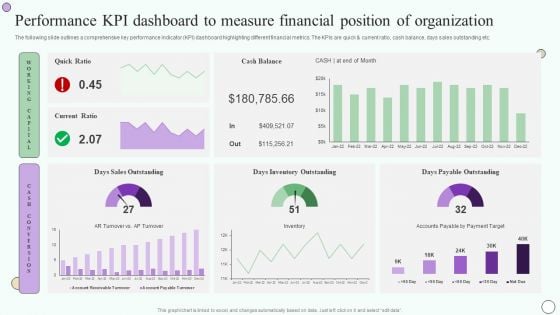
Estimating Business Overall Performance Kpi Dashboard To Measure Financial Position Inspiration PDF
The following slide outlines a comprehensive key performance indicator KPI dashboard highlighting different financial metrics. The KPIs are quick and current ratio, cash balance, days sales outstanding etc. Welcome to our selection of the Estimating Business Overall Performance Kpi Dashboard To Measure Financial Position Inspiration PDF. These are designed to help you showcase your creativity and bring your sphere to life. Planning and Innovation are essential for any business that is just starting out. This collection contains the designs that you need for your everyday presentations. All of our PowerPoints are 100 percent editable, so you can customize them to suit your needs. This multi-purpose template can be used in various situations. Grab these presentation templates today.
Business Sales Key Performance Indicators Report Ppt PowerPoint Presentation Icon Slideshow PDF
Showcasing this set of slides titled business sales key performance indicators report ppt powerpoint presentation icon slideshow pdf. The topics addressed in these templates are business sales key performance indicators report. All the content presented in this PPT design is completely editable. Download it and make adjustments in color, background, font etc. as per your unique business setting.
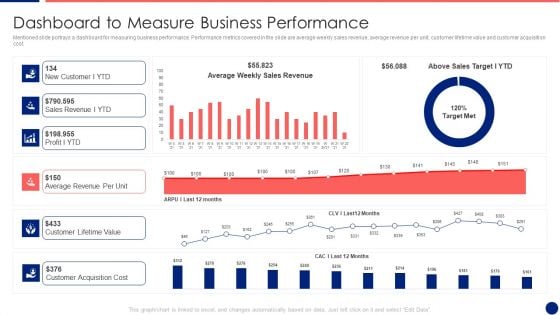
Information Technology Service Integration Post Acquisition Merger Dashboard To Measure Business Pictures PDF
Mentioned slide portrays a dashboard for measuring business performance. Performance metrics covered in the slide are average weekly sales revenue, average revenue per unit, customer lifetime value and customer acquisition cost. Deliver and pitch your topic in the best possible manner with this information technology service integration post acquisition merger dashboard to measure business pictures pdf. Use them to share invaluable insights on sales revenue, average, cost and impress your audience. This template can be altered and modified as per your expectations. So, grab it now.
Business Trends Bar Chart Vector Icon Ppt PowerPoint Presentation Inspiration Graphic Images PDF
Persuade your audience using this business trends bar chart vector icon ppt powerpoint presentation inspiration graphic images pdf. This PPT design covers three stages, thus making it a great tool to use. It also caters to a variety of topics including business trends bar chart vector icon. Download this PPT design now to present a convincing pitch that not only emphasizes the topic but also showcases your presentation skills.
Business Partnership Trust Vector Icon Ppt PowerPoint Presentation Inspiration Slides PDF
Persuade your audience using this business partnership trust vector icon ppt powerpoint presentation inspiration slides pdf. This PPT design covers three stages, thus making it a great tool to use. It also caters to a variety of topics including business partnership trust vector icon. Download this PPT design now to present a convincing pitch that not only emphasizes the topic but also showcases your presentation skills.
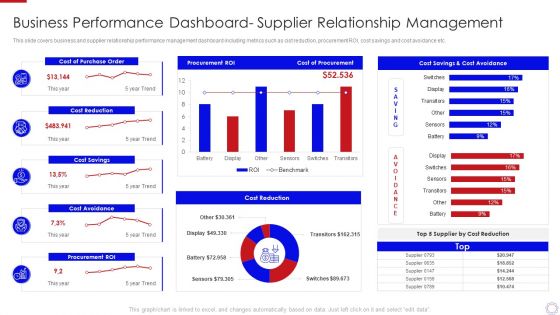
Major Strategies To Nurture Effective Vendor Association Business Performance Dashboard Guidelines PDF
This slide covers business and supplier relationship performance management dashboard including metrics such as cist reduction, procurement ROI, cost savings and cost avoidance etc. Deliver an awe inspiring pitch with this creative major strategies to nurture effective vendor association business performance dashboard guidelines pdf bundle. Topics like business performance dashboard supplier relationship management can be discussed with this completely editable template. It is available for immediate download depending on the needs and requirements of the user.
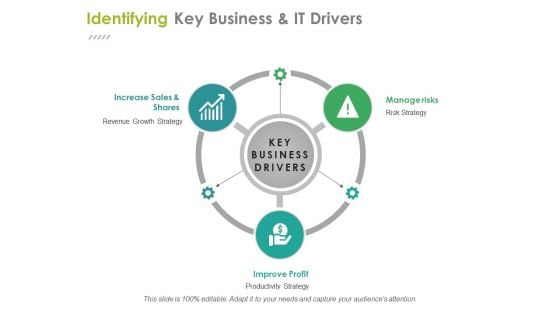
Identifying Key Business And It Drivers Ppt PowerPoint Presentation Ideas Files
This is a identifying key business and it drivers ppt powerpoint presentation ideas files. This is a three stage process. The stages in this process are increase sales and shares, improve profit, manage risks, business, management.
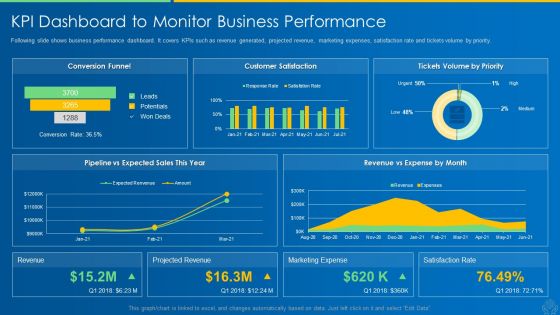
AI And ML Driving Monetary Value For Organization KPI Dashboard To Monitor Business Performance Graphics PDF
Following slide shows business performance dashboard. It covers KPIs such as revenue generated, projected revenue, marketing expenses, satisfaction rate and tickets volume by priority. Deliver and pitch your topic in the best possible manner with this ai and ml driving monetary value for organization kpi dashboard to monitor business performance graphics pdf. Use them to share invaluable insights on business offerings, current impact, product innovations, customer service and impress your audience. This template can be altered and modified as per your expectations. So, grab it now.
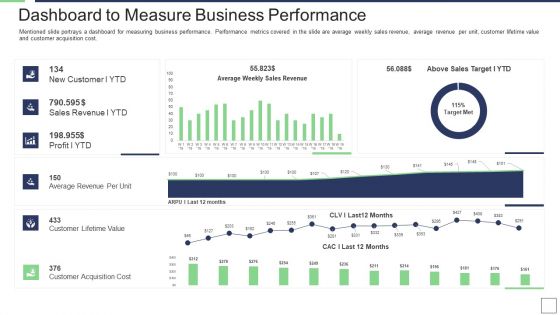
IT Service Incorporation And Administration Dashboard To Measure Business Performance Portrait PDF
Mentioned slide portrays a dashboard for measuring business performance. Performance metrics covered in the slide are average weekly sales revenue, average revenue per unit, customer lifetime value and customer acquisition cost. Deliver and pitch your topic in the best possible manner with this it service incorporation and administration dashboard to measure business performance portrait pdf. Use them to share invaluable insights on sales, revenue, target, acquisition cost and impress your audience. This template can be altered and modified as per your expectations. So, grab it now.
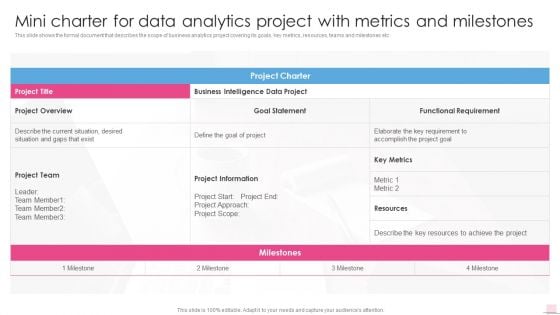
Mini Charter For Data Analytics Project With Metrics Business Analysis Modification Toolkit Infographics PDF
This slide shows the formal document that describes the scope of business analytics project covering its goals, key metrics, resources, teams and milestones etc.Deliver and pitch your topic in the best possible manner with this Mini Charter For Data Analytics Project With Metrics Business Analysis Modification Toolkit Infographics PDF. Use them to share invaluable insights on Business Intelligence, Functional Requirement, Project Information and impress your audience. This template can be altered and modified as per your expectations. So, grab it now.
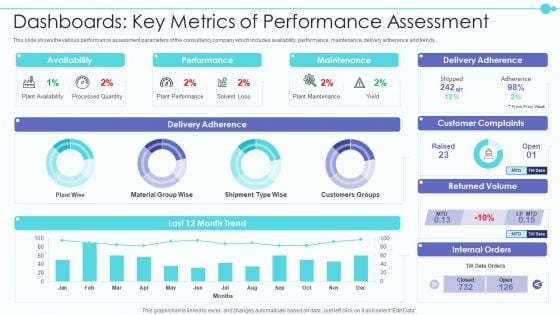
Business Model Of New Consultancy Firm Dashboards Key Metrics Of Performance Assessment Designs PDF
This slide shows the various performance assessment parameters of the consultancy company which includes availability, performance, maintenance, delivery adherence and trends. Deliver an awe inspiring pitch with this creative business model of new consultancy firm dashboards key metrics of performance assessment designs pdf bundle. Topics like availability, performance, maintenance, delivery adherence can be discussed with this completely editable template. It is available for immediate download depending on the needs and requirements of the user.
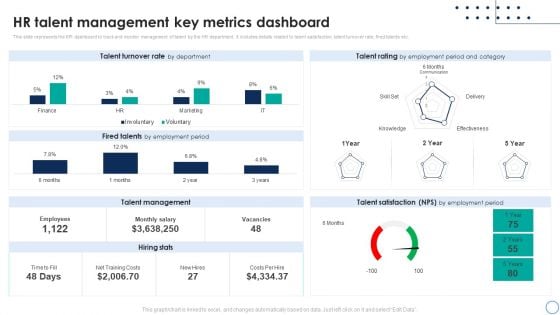
Business Analytics Application HR Talent Management Key Metrics Dashboard Rules PDF
This slide represents the KPI dashboard to track and monitor management of talent by the HR department. It includes details related to talent satisfaction, talent turnover rate, fired talents etc. This Business Analytics Application HR Talent Management Key Metrics Dashboard Rules PDF is perfect for any presentation, be it in front of clients or colleagues. It is a versatile and stylish solution for organizing your meetings. The Business Analytics Application HR Talent Management Key Metrics Dashboard Rules PDF features a modern design for your presentation meetings. The adjustable and customizable slides provide unlimited possibilities for acing up your presentation. Slidegeeks has done all the homework before launching the product for you. So, dont wait, grab the presentation templates today.
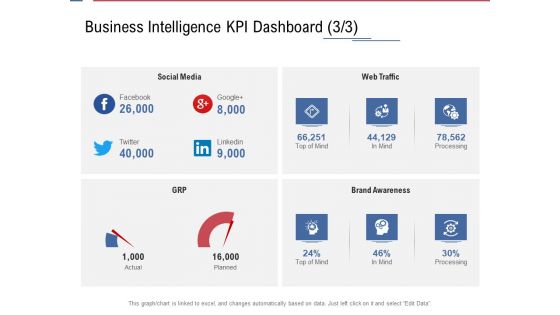
Data Assimilation Business Intelligence KPI Dashboard Media Ppt Layouts Show PDF
Deliver an awe inspiring pitch with this creative data assimilation business intelligence kpi dashboard media ppt layouts show pdf bundle. Topics like business intelligence kpi dashboard can be discussed with this completely editable template. It is available for immediate download depending on the needs and requirements of the user.
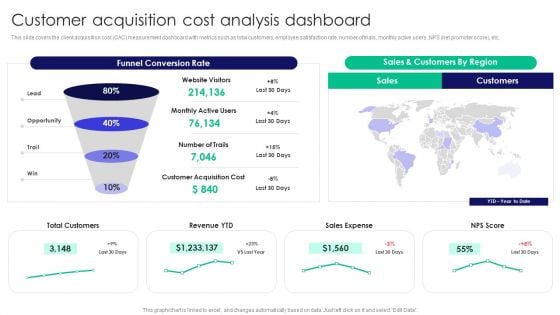
Guide To Business Customer Acquisition Customer Acquisition Cost Analysis Dashboard Download PDF
This slide covers the client acquisition cost CAC measurement dashboard with metrics such as total customers, employee satisfaction rate, number of trials, monthly active users, NPS net promoter score, etc. Make sure to capture your audiences attention in your business displays with our gratis customizable Guide To Business Customer Acquisition Customer Acquisition Cost Analysis Dashboard Download PDF. These are great for business strategies, office conferences, capital raising or task suggestions. If you desire to acquire more customers for your tech business and ensure they stay satisfied, create your own sales presentation with these plain slides.

Financial Kpis For Business Growth Liquidity Efficiency And Solvency Ppt Powerpoint Presentation Summary Gridlines
This is a financial kpis for business growth liquidity efficiency and solvency ppt powerpoint presentation summary gridlines. This is a seven stage process. The stages in this process are dashboard, kpi, metrics.

Business Photography Proposal Template Ppt PowerPoint Presentation Complete Deck With Slides
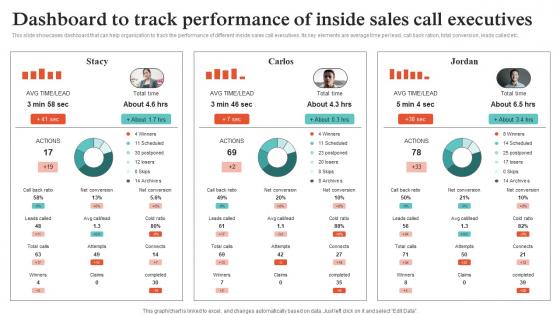
Virtual Sales Strategies For Business Dashboard To Track Performance Of Inside Strategy SS V
This slide showcases dashboard that can help organization to track the performance of different inside sales call executives. Its key elements are average time per lead, call back ration, total conversion, leads called etc. Make sure to capture your audiences attention in your business displays with our gratis customizable Virtual Sales Strategies For Business Dashboard To Track Performance Of Inside Strategy SS V. These are great for business strategies, office conferences, capital raising or task suggestions. If you desire to acquire more customers for your tech business and ensure they stay satisfied, create your own sales presentation with these plain slides. This slide showcases dashboard that can help organization to track the performance of different inside sales call executives. Its key elements are average time per lead, call back ration, total conversion, leads called etc.
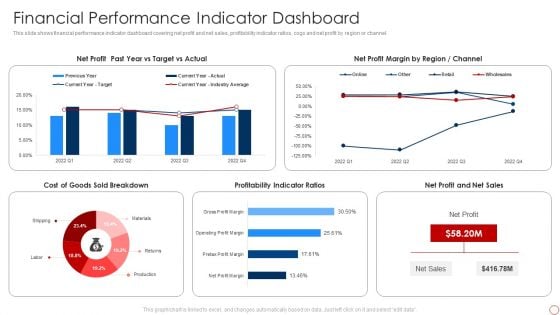
Kpis For Evaluating Business Sustainability Financial Performance Indicator Dashboard Demonstration PDF
This slide shows financial performance indicator dashboard covering net profit and net sales, profitability indicator ratios, cogs and net profit by region or channel. Deliver and pitch your topic in the best possible manner with this Kpis For Evaluating Business Sustainability Financial Performance Indicator Dashboard Demonstration PDF. Use them to share invaluable insights on Net Profit, Net Profit Margin, Profitability Indicator Ratios and impress your audience. This template can be altered and modified as per your expectations. So, grab it now.
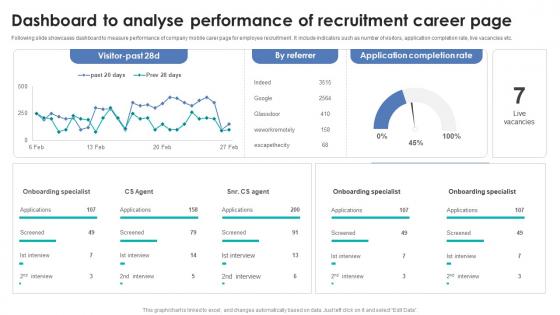
Integrating Automation For Effective Business Dashboard To Analyse Performance Of Recruitment
Following slide showcases dashboard to measure performance of company mobile carer page for employee recruitment . It include indicators such as number of visitors, application completion rate, live vacancies etc. Present like a pro with Integrating Automation For Effective Business Dashboard To Analyse Performance Of Recruitment. Create beautiful presentations together with your team, using our easy-to-use presentation slides. Share your ideas in real-time and make changes on the fly by downloading our templates. So whether you are in the office, on the go, or in a remote location, you can stay in sync with your team and present your ideas with confidence. With Slidegeeks presentation got a whole lot easier. Grab these presentations today. Following slide showcases dashboard to measure performance of company mobile carer page for employee recruitment . It include indicators such as number of visitors, application completion rate, live vacancies etc.


 Continue with Email

 Home
Home


