Business Snapshot
Magnifying Glass Medical Research And Analysis Vector Icon Ppt PowerPoint Presentation Gallery Graphics Pictures PDF
Presenting magnifying glass medical research and analysis vector icon ppt powerpoint presentation gallery graphics pictures pdf to dispense important information. This template comprises three stages. It also presents valuable insights into the topics including magnifying glass medical research and analysis vector icon. This is a completely customizable PowerPoint theme that can be put to use immediately. So, download it and address the topic impactfully.
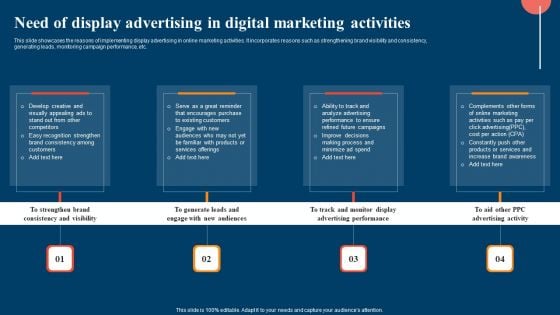
Need Of Display Advertising In Digital Marketing Activities Ppt Portfolio
This slide showcases the reasons of implementing display advertising in online marketing activities. It incorporates reasons such as strengthening brand visibility and consistency, generating leads, monitoring campaign performance, etc. Welcome to our selection of the Need Of Display Advertising In Digital Marketing Activities Ppt Portfolio. These are designed to help you showcase your creativity and bring your sphere to life. Planning and Innovation are essential for any business that is just starting out. This collection contains the designs that you need for your everyday presentations. All of our PowerPoints are 100 percent editable, so you can customize them to suit your needs. This multi purpose template can be used in various situations. Grab these presentation templates today.
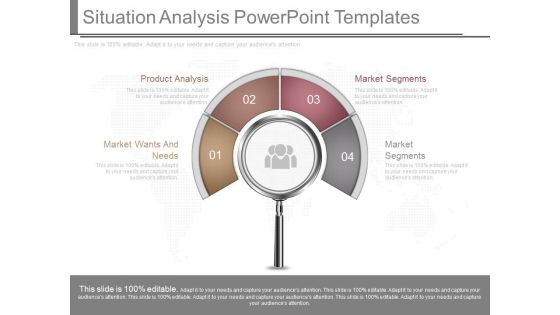
Situation Analysis Powerpoint Templates
This is a situation analysis powerpoint templates. This is a four stage process. The stages in this process are market wants and needs, product analysis, market segments.
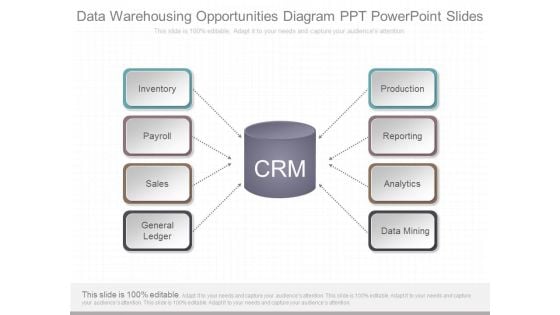
Data Warehousing Opportunities Diagram Ppt Powerpoint Slides
This is a data warehousing opportunities diagram ppt powerpoint slides. This is a eight stage process. The stages in this process are inventory, payroll, sales, ledger general, production, reporting, analytics, data mining.
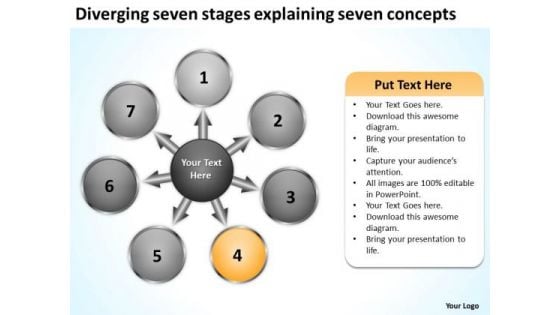
Diverging Seven Stages Explaining Concepts Cycle Layout Network PowerPoint Templates
We present our diverging seven stages explaining concepts Cycle Layout Network PowerPoint templates.Use our Business PowerPoint Templates because spell out your advertising plans to increase market share. The feedback has been positive and productive. Download and present our Circle Charts PowerPoint Templates because this Layout can explain the relevance of the different layers and stages in getting down to your core competence, ability and desired result. Download and present our Arrows PowerPoint Templates because this can explain the various related aspects of these varied tracks and how they will, on hitting their own targets, cumulatively contribute to hitting GOLD. Present our Shapes PowerPoint Templates because you can Trigger audience minds with your interesting ideas. Present our Flow charts PowerPoint Templates because this slide helps you to give your team an overview of your capability and insight into the minute details of the overall picture highlighting the interdependence at every operational level.Use these PowerPoint slides for presentations relating to Arrows, blank, business, central, centralized, chart, circle, circular, circulation concept, conceptual, converging, design, diagram, empty, executive, icon, idea illustration, management, map, mapping, moa, model, numbers, organization outwards, pointing, procedure, process, radial, radiating, relationship, resource sequence, sequential, seven, square, strategy, template. The prominent colors used in the PowerPoint template are Yellow, Gray, White. Presenters tell us our diverging seven stages explaining concepts Cycle Layout Network PowerPoint templates are Clever. Presenters tell us our circle PowerPoint templates and PPT Slides are Enchanting. PowerPoint presentation experts tell us our diverging seven stages explaining concepts Cycle Layout Network PowerPoint templates are Adorable. We assure you our circular PowerPoint templates and PPT Slides are Zippy. Customers tell us our diverging seven stages explaining concepts Cycle Layout Network PowerPoint templates will get their audience's attention. People tell us our centralized PowerPoint templates and PPT Slides are Graceful. Deploy goals with our Diverging Seven Stages Explaining Concepts Cycle Layout Network PowerPoint Templates. Download without worries with our money back guaranteee.
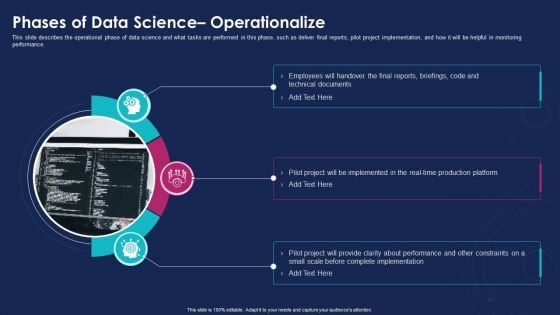
Data Analytics IT Phases Of Data Science Operationalize Ppt Summary Clipart PDF
This slide describes the operational phase of data science and what tasks are performed in this phase, such as deliver final reports, pilot project implementation, and how it will be helpful in monitoring performance. This is a data analytics it phases of data science operationalize ppt summary clipart pdf template with various stages. Focus and dispense information on three stages using this creative set, that comes with editable features. It contains large content boxes to add your information on topics like technical, implemented, performance. You can also showcase facts, figures, and other relevant content using this PPT layout. Grab it now.
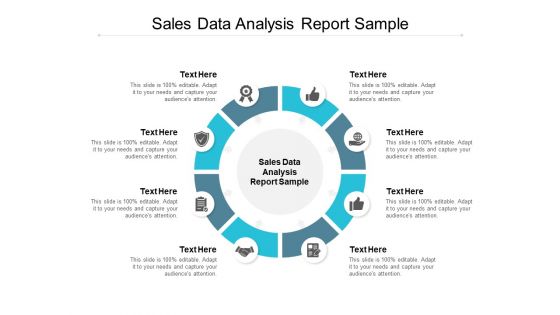
Sales Data Analysis Report Sample Ppt PowerPoint Presentation Summary Example Cpb
Presenting this set of slides with name sales data analysis report sample ppt powerpoint presentation summary example cpb. This is an editable Powerpoint eight stages graphic that deals with topics like sales data analysis report sample to help convey your message better graphically. This product is a premium product available for immediate download and is 100 percent editable in Powerpoint. Download this now and use it in your presentations to impress your audience.
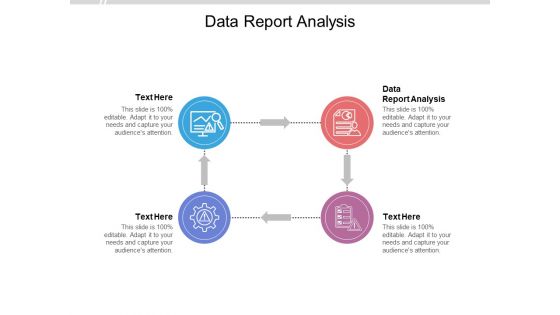
Data Report Analysis Ppt PowerPoint Presentation Inspiration Graphics Download Cpb Pdf
Presenting this set of slides with name data report analysis ppt powerpoint presentation inspiration graphics download cpb pdf. This is an editable Powerpoint four stages graphic that deals with topics like data report analysis to help convey your message better graphically. This product is a premium product available for immediate download and is 100 percent editable in Powerpoint. Download this now and use it in your presentations to impress your audience.
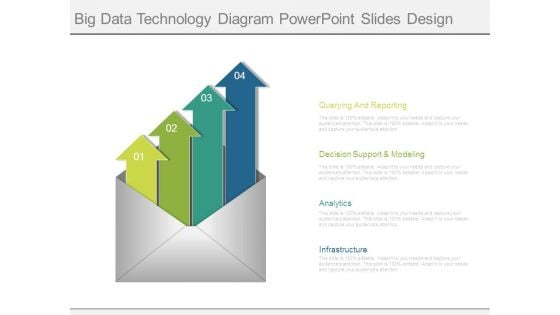
Big Data Technology Diagram Powerpoint Slides Design
This is a big data technology diagram powerpoint slides design. This is a four stage process. The stages in this process are querying and reporting, decision support and modeling, analytics, infrastructure.
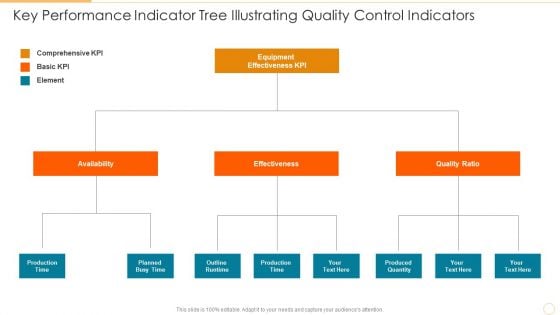
Key Performance Indicator Tree Illustrating Quality Control Indicators Information PDF
Presenting key performance indicator tree illustrating quality control indicators information pdf to dispense important information. This template comprises three stages. It also presents valuable insights into the topics including availability, effectiveness, quality ratio. This is a completely customizable PowerPoint theme that can be put to use immediately. So, download it and address the topic impactfully.
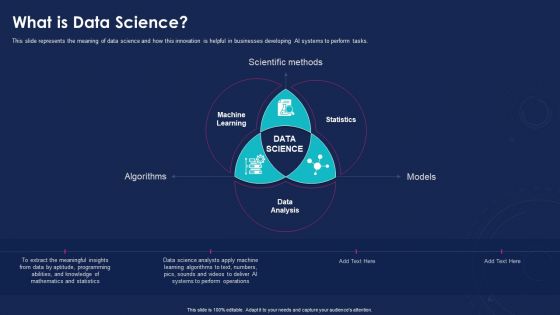
Data Analytics IT What Is Data Science Ppt Infographics Design Templates PDF
This slide represents the meaning of data science and how this innovation is helpful in businesses developing AI systems to perform tasks. This is a data analytics it what is data science ppt infographics design templates pdf template with various stages. Focus and dispense information on three stages using this creative set, that comes with editable features. It contains large content boxes to add your information on topics like algorithms, models, scientific methods. You can also showcase facts, figures, and other relevant content using this PPT layout. Grab it now.
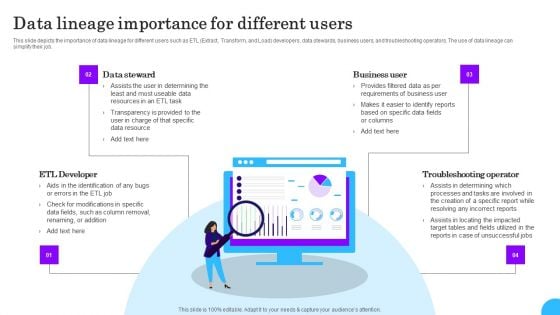
Comprehensive Analysis Of Different Data Lineage Classification Data Lineage Importance For Different Users Template PDF
This slide depicts the importance of data lineage for different users such as ETL Extract, Transform, and Load developers, data stewards, business users, and troubleshooting operators. The use of data lineage can simplify their job. Formulating a presentation can take up a lot of effort and time, so the content and message should always be the primary focus. The visuals of the PowerPoint can enhance the presenters message, so our Comprehensive Analysis Of Different Data Lineage Classification Data Lineage Importance For Different Users Template PDF was created to help save time. Instead of worrying about the design, the presenter can concentrate on the message while our designers work on creating the ideal templates for whatever situation is needed. Slidegeeks has experts for everything from amazing designs to valuable content, we have put everything into Comprehensive Analysis Of Different Data Lineage Classification Data Lineage Importance For Different Users Template PDF
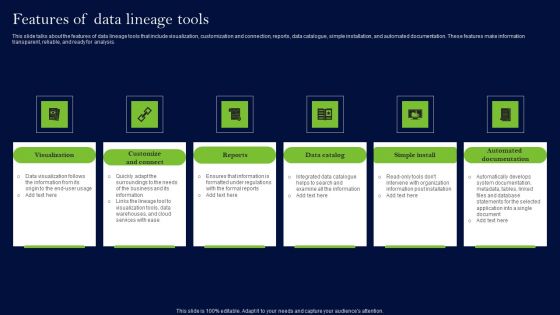
Data Lineage Methods Features Of Data Lineage Tools Sample PDF
This slide talks about the features of data lineage tools that include visualization, customization and connection, reports, data catalogue, simple installation, and automated documentation. These features make information transparent, reliable, and ready for analysis. Slidegeeks is here to make your presentations a breeze with Data Lineage Methods Features Of Data Lineage Tools Sample PDF With our easy-to-use and customizable templates, you can focus on delivering your ideas rather than worrying about formatting. With a variety of designs to choose from, you are sure to find one that suits your needs. And with animations and unique photos, illustrations, and fonts, you can make your presentation pop. So whether you are giving a sales pitch or presenting to the board, make sure to check out Slidegeeks first
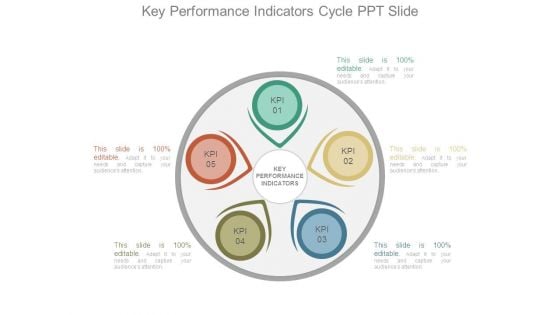
Key Performance Indicators Cycle Ppt Slide
This is a key performance indicators cycle ppt slide. This is a five stage process. The stages in this process are key performance indicators, kpi.
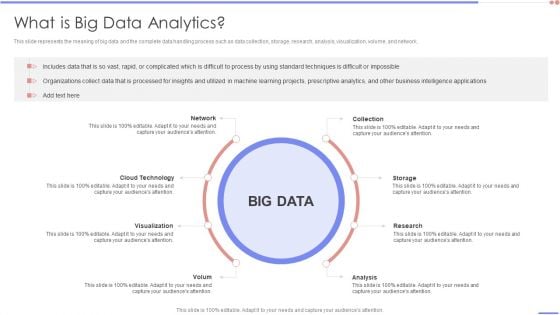
Data Analytics Management What Is Big Data Analytics Slides PDF
This slide represents the meaning of big data and the complete data handling process such as data collection, storage, research, analysis, visualization, volume, and network.This is a Data Analytics Management What Is Big Data Analytics Slides PDF template with various stages. Focus and dispense information on one stage using this creative set, that comes with editable features. It contains large content boxes to add your information on topics like Standard Techniques, Difficult Impossible, Intelligence. You can also showcase facts, figures, and other relevant content using this PPT layout. Grab it now.
Data Analysis Reporting Tools Ppt PowerPoint Presentation Professional Layout Cpb Pdf
Presenting this set of slides with name data analysis reporting tools ppt powerpoint presentation professional layout cpb pdf. This is an editable Powerpoint four stages graphic that deals with topics like cyber security detection response to help convey your message better graphically. This product is a premium product available for immediate download and is 100 percent editable in Powerpoint. Download this now and use it in your presentations to impress your audience.
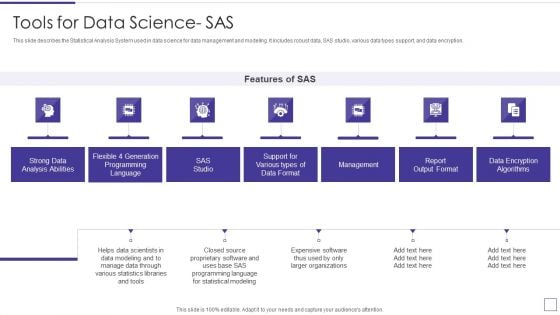
Data Mining Implementation Tools For Data Science SAS Template PDF
This slide describes the Statistical Analysis System used in data science for data management and modeling. It includes robust data, SAS studio, various data types support, and data encryption.This is a data mining implementation tools for data science sas template pdf template with various stages. Focus and dispense information on seven stages using this creative set, that comes with editable features. It contains large content boxes to add your information on topics like strong data analysis abilities, report output format, data encryption algorithms You can also showcase facts, figures, and other relevant content using this PPT layout. Grab it now.
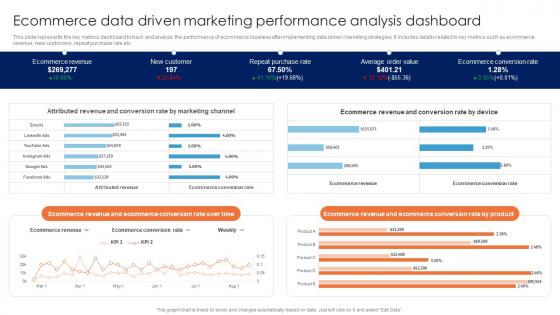
Ecommerce Data Driven Marketing Performance Guide For Data Driven Advertising Brochure Pdf
This slide represents the key metrics dashboard to track and analyze the performance of ecommerce business after implementing data driven marketing strategies. It includes details related to key metrics such as ecommerce revenue, new customers, repeat purchase rate etc.Here you can discover an assortment of the finest PowerPoint and Google Slides templates. With these templates, you can create presentations for a variety of purposes while simultaneously providing your audience with an eye-catching visual experience. Download Ecommerce Data Driven Marketing Performance Guide For Data Driven Advertising Brochure Pdf to deliver an impeccable presentation. These templates will make your job of preparing presentations much quicker, yet still, maintain a high level of quality. Slidegeeks has experienced researchers who prepare these templates and write high-quality content for you. Later on, you can personalize the content by editing the Ecommerce Data Driven Marketing Performance Guide For Data Driven Advertising Brochure Pdf. This slide represents the key metrics dashboard to track and analyze the performance of ecommerce business after implementing data driven marketing strategies. It includes details related to key metrics such as ecommerce revenue, new customers, repeat purchase rate etc.
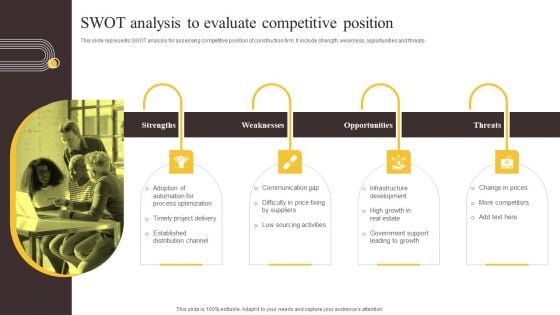
Global Construction Sector Industry Report SWOT Analysis To Evaluate Competitive Position Designs PDF
This slide represents SWOT analysis for assessing competitive position of construction firm. It include strength, weakness, opportunities and threats. The Global Construction Sector Industry Report SWOT Analysis To Evaluate Competitive Position Designs PDF is a compilation of the most recent design trends as a series of slides. It is suitable for any subject or industry presentation, containing attractive visuals and photo spots for businesses to clearly express their messages. This template contains a variety of slides for the user to input data, such as structures to contrast two elements, bullet points, and slides for written information. Slidegeeks is prepared to create an impression.
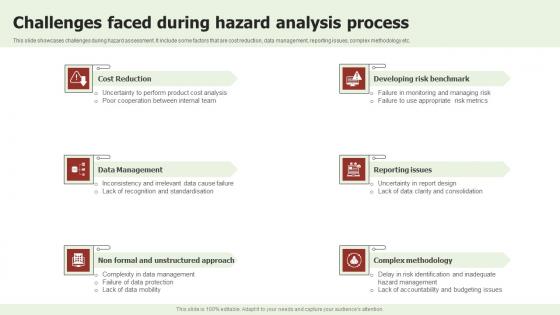
Challenges Faced During Hazard Analysis Process Structure Pdf
This slide showcases challenges during hazard assessment. It include some factors that are cost reduction, data management, reporting issues, complex methodology etc. Showcasing this set of slides titled Challenges Faced During Hazard Analysis Process Structure Pdf. The topics addressed in these templates are Cost Reduction, Data Management, Reporting Issues. All the content presented in this PPT design is completely editable. Download it and make adjustments in color, background, font etc. as per your unique business setting. This slide showcases challenges during hazard assessment. It include some factors that are cost reduction, data management, reporting issues, complex methodology etc.
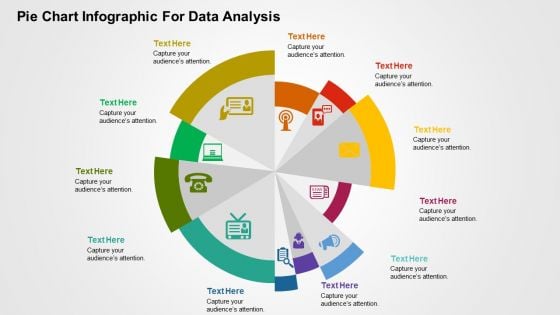
Pie Chart Infographic For Data Analysis PowerPoint Templates
This is one of the most downloaded PowerPoint template. This slide can be used for various purposes and to explain a number of processes. This can be included in your presentation to explain each step of a process and even include its relevance and importance in a single diagram. Using the uneven circular structure of the pie chart, the presenter can also explain random steps or highlight particular steps of process or parts of an organization or business that need special attention of any kind to the audience. Additionally, you can use this slide to show a transformation process or highlight key features of a product.
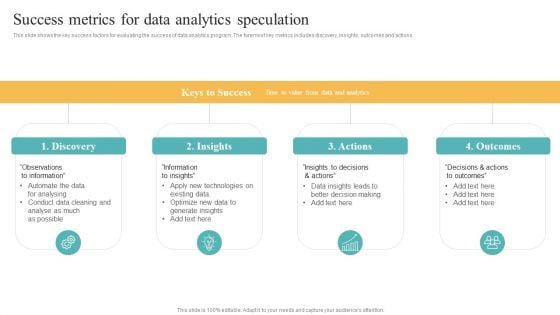
Transformation Toolkit Competitive Intelligence Information Analysis Success Metrics For Data Analytics Speculation Diagrams PDF
This slide shows the key success factors for evaluating the success of data analytics program. The foremost key metrics includes discovery, insights, outcomes and actions. Do you have to make sure that everyone on your team knows about any specific topic I yes, then you should give Transformation Toolkit Competitive Intelligence Information Analysis Success Metrics For Data Analytics Speculation Diagrams PDF a try. Our experts have put a lot of knowledge and effort into creating this impeccable Transformation Toolkit Competitive Intelligence Information Analysis Success Metrics For Data Analytics Speculation Diagrams PDF. You can use this template for your upcoming presentations, as the slides are perfect to represent even the tiniest detail. You can download these templates from the Slidegeeks website and these are easy to edit. So grab these today.
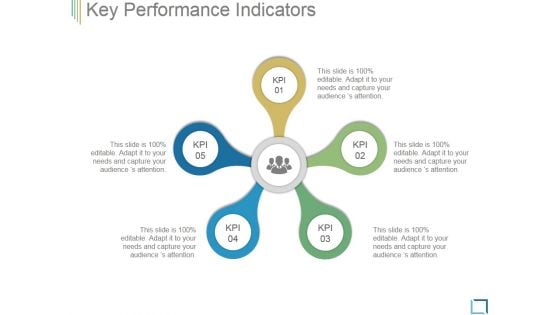
Key Performance Indicators Template 1 Ppt PowerPoint Presentation Background Designs
This is a key performance indicators template 1 ppt powerpoint presentation background designs. This is a five stage process. The stages in this process are business, management, process, strategy, success.
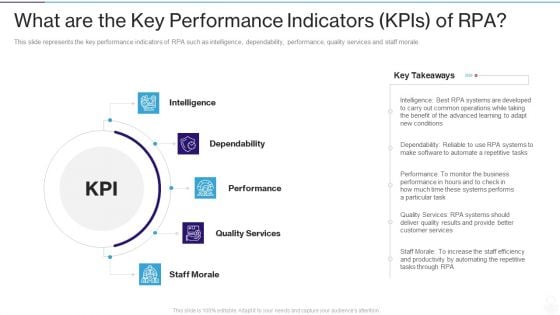
RPA IT What Are The Key Performance Indicators Kpis Of RPA Ppt Professional Design Templates PDF
This slide represents the key performance indicators of RPA such as intelligence, dependability, performance, quality services and staff morale. This is a rpa it what are the key performance indicators kpis of rpa ppt professional design templates pdf template with various stages. Focus and dispense information on five stages using this creative set, that comes with editable features. It contains large content boxes to add your information on topics like staff morale, quality services, performance, dependability, intelligence. You can also showcase facts, figures, and other relevant content using this PPT layout. Grab it now.
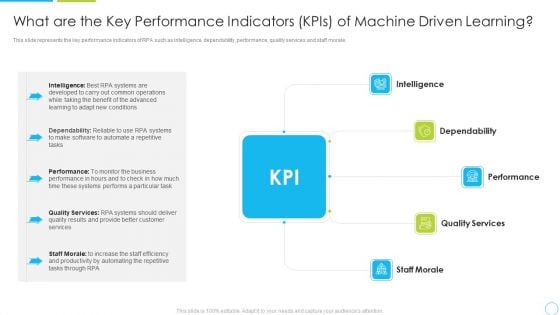
What Are The Key Performance Indicators Kpis Of Machine Driven Learning Ppt Styles Slideshow PDF
This slide represents the key performance indicators of RPA such as intelligence, dependability, performance, quality services and staff morale. This is a what are the key performance indicators kpis of machine driven learning ppt styles slideshow pdf template with various stages. Focus and dispense information on five stages using this creative set, that comes with editable features. It contains large content boxes to add your information on topics like dependability, intelligence, performance, quality services, staff morale. You can also showcase facts, figures, and other relevant content using this PPT layout. Grab it now.
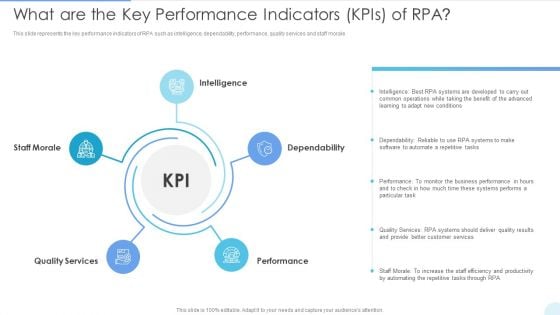
What Are The Key Performance Indicators Kpis Of RPA Structure PDF
This slide represents the key performance indicators of RPA such as intelligence, dependability, performance, quality services and staff morale. This is a What Are The Key Performance Indicators Kpis Of RPA Structure PDF template with various stages. Focus and dispense information on five stages using this creative set, that comes with editable features. It contains large content boxes to add your information on topics like Dependability, Performance, Quality Services. You can also showcase facts, figures, and other relevant content using this PPT layout. Grab it now.
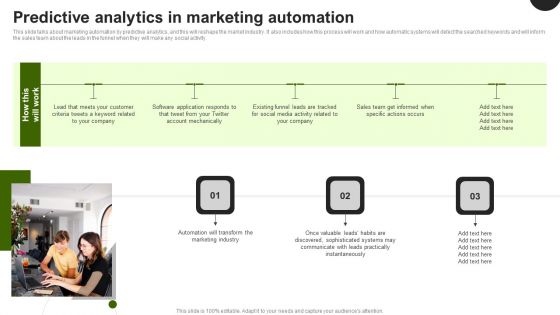
Predictive Analytics In The Age Of Big Data Predictive Analytics In Marketing Automation Ideas PDF
This slide talks about marketing automation by predictive analytics, and this will reshape the market industry. It also includes how this process will work and how automatic systems will detect the searched keywords and will inform the sales team about the leads in the funnel when they will make any social activity. The Predictive Analytics In The Age Of Big Data Predictive Analytics In Marketing Automation Ideas PDF is a compilation of the most recent design trends as a series of slides. It is suitable for any subject or industry presentation, containing attractive visuals and photo spots for businesses to clearly express their messages. This template contains a variety of slides for the user to input data, such as structures to contrast two elements, bullet points, and slides for written information. Slidegeeks is prepared to create an impression.
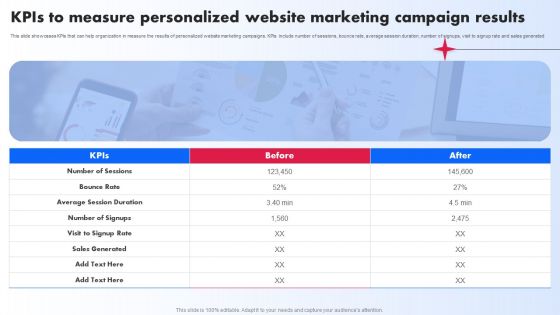
Kpis To Measure Personalized Website Marketing Campaign Results Ppt PowerPoint Presentation File Show PDF
This slide showcases KPIs that can help organization in measure the results of personalized website marketing campaigns. KPIs include number of sessions, bounce rate, average session duration, number of signups, visit to signup rate and sales generated. Welcome to our selection of the Kpis To Measure Personalized Website Marketing Campaign Results Ppt PowerPoint Presentation File Show PDF. These are designed to help you showcase your creativity and bring your sphere to life. Planning and Innovation are essential for any business that is just starting out. This collection contains the designs that you need for your everyday presentations. All of our PowerPoints are 100 percent editable, so you can customize them to suit your needs. This multi purpose template can be used in various situations. Grab these presentation templates today.
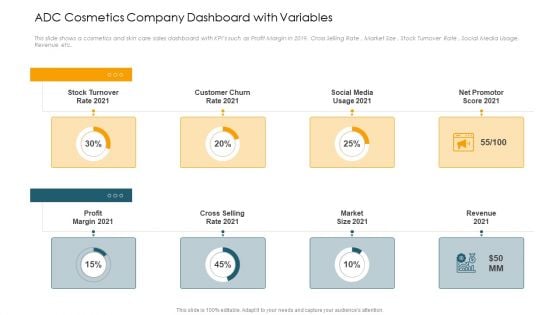
ADC Cosmetics Company Dashboard With Variables Ppt Backgrounds PDF
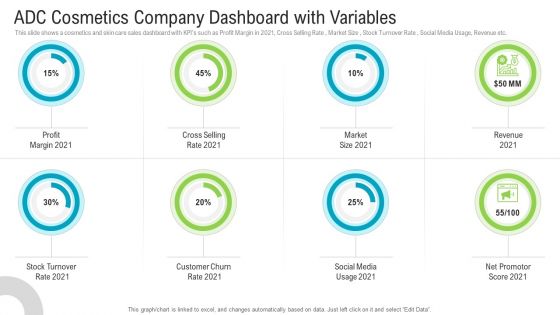
This slide shows a cosmetics and skin care sales dashboard with KPIs such as Profit Margin in 2019, Cross Selling Rate , Market Size , Stock Turnover Rate , Social Media Usage, Revenue etc.Presenting adc cosmetics company dashboard with variables ppt backgrounds pdf. to provide visual cues and insights. Share and navigate important information on eight stages that need your due attention. This template can be used to pitch topics like stock turnover rate 2021, social media usage 2021, net promotor score 2021. In addtion, this PPT design contains high resolution images, graphics, etc, that are easily editable and available for immediate download.
ADC Cosmetics Company Dashboard With Variables Summary PDF
This slide shows a cosmetics and skin care sales dashboard with KPIs such as Profit Margin in 2021, Cross Selling Rate , Market Size , Stock Turnover Rate , Social Media Usage, Revenue etc. Presenting adc cosmetics company dashboard with variables summary pdf to provide visual cues and insights. Share and navigate important information on eight stages that need your due attention. This template can be used to pitch topics like profit margin, cross selling rate, market size, revenue, stock turnover rate. In addtion, this PPT design contains high resolution images, graphics, etc, that are easily editable and available for immediate download.
Responsible Technology Playbook Agile Threat Modeling Overview About Duration Process Elements PDF
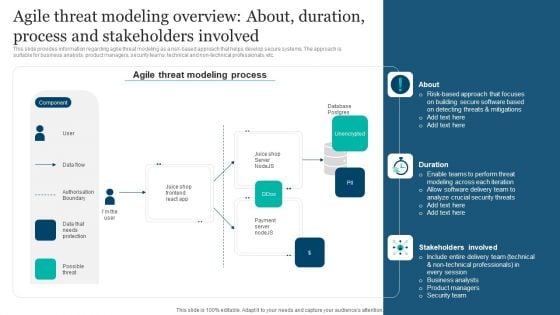
This slide provides information regarding agile threat modeling as a risk-based approach that helps develop secure systems. The approach is suitable for business analysts, product managers, security teams, technical and non-technical professionals, etc. This modern and well-arranged Responsible Technology Playbook Agile Threat Modeling Overview About Duration Process Elements PDF provides lots of creative possibilities. It is very simple to customize and edit with the Powerpoint Software. Just drag and drop your pictures into the shapes. All facets of this template can be edited with Powerpoint, no extra software is necessary. Add your own material, put your images in the places assigned for them, adjust the colors, and then you can show your slides to the world, with an animated slide included.
How To Track And Analyze Market Using Metrics Efficient Nonprofit Marketing Ideas Pdf
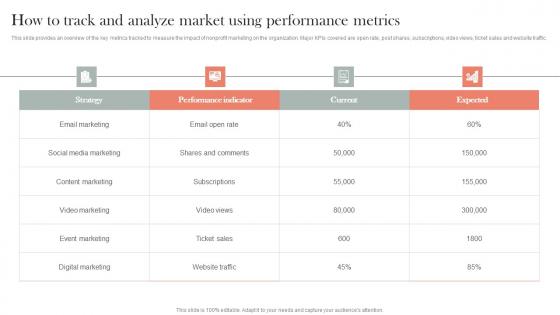
This slide provides an overview of the key metrics tracked to measure the impact of nonprofit marketing on the organization. Major KPIs covered are open rate, post shares, subscriptions, video views, ticket sales and website traffic.Are you searching for a How To Track And Analyze Market Using Metrics Efficient Nonprofit Marketing Ideas Pdf that is uncluttered, straightforward, and original Its easy to edit, and you can change the colors to suit your personal or business branding. For a presentation that expresses how much effort you have put in, this template is ideal. With all of its features, including tables, diagrams, statistics, and lists, its perfect for a business plan presentation. Make your ideas more appealing with these professional slides. Download How To Track And Analyze Market Using Metrics Efficient Nonprofit Marketing Ideas Pdf from Slidegeeks today. This slide provides an overview of the key metrics tracked to measure the impact of nonprofit marketing on the organization. Major KPIs covered are open rate, post shares, subscriptions, video views, ticket sales and website traffic.
Key Performance Indicators Examples Ppt Presentation
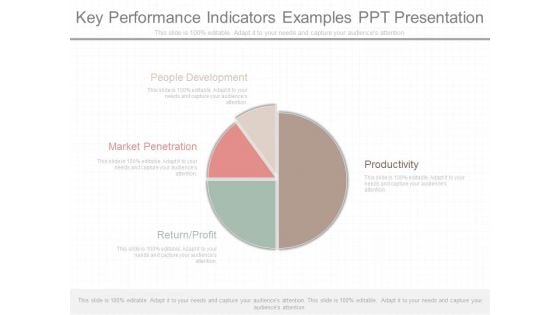
This is a key performance indicators examples ppt presentation. This is a four stage process. The stages in this process are people development, productivity, market penetration, return profit.
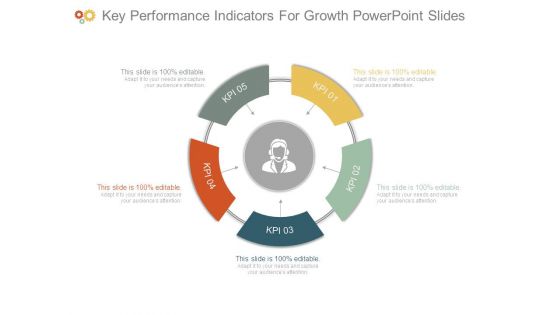
Key Performance Indicators For Growth Powerpoint Slides
This is a key performance indicators for growth powerpoint slides. This is a five stage process. The stages in this process are kpi.
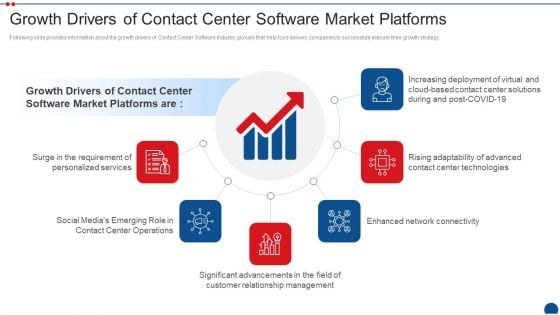
Call Center Application Market Industry Growth Drivers Of Contact Center Software Market Platforms Pictures PDF
Following slide provides information about the growth drivers of Contact Center Software Industry globally that help food delivery companies to successfully execute their growth strategy. This is a call center application market industry growth drivers of contact center software market platforms pictures pdf template with various stages. Focus and dispense information on five stages using this creative set, that comes with editable features. It contains large content boxes to add your information on topics like social media, customer relationship management, enhanced network connectivity, cloud based contact. You can also showcase facts, figures, and other relevant content using this PPT layout. Grab it now.
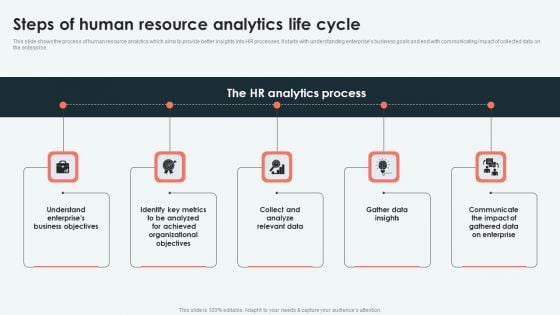
Analyzing And Deploying Steps Of Human Resource Analytics Life Cycle Clipart PDF
This slide shows the process of human resource analytics which aims to provide better insights into HR processes. It starts with understanding enterprises business goals and end with communicating impact of collected data on the enterprise. Slidegeeks is here to make your presentations a breeze with Analyzing And Deploying Steps Of Human Resource Analytics Life Cycle Clipart PDF With our easy-to-use and customizable templates, you can focus on delivering your ideas rather than worrying about formatting. With a variety of designs to choose from, youre sure to find one that suits your needs. And with animations and unique photos, illustrations, and fonts, you can make your presentation pop. So whether youre giving a sales pitch or presenting to the board, make sure to check out Slidegeeks first.
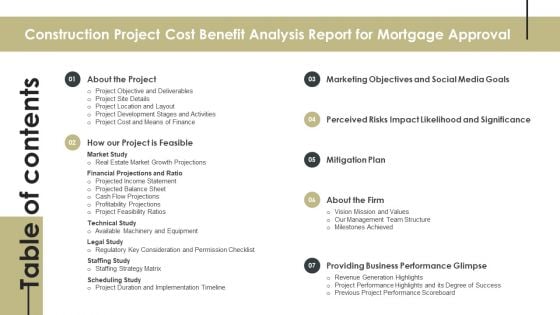
Table Of Contents For Construction Project Cost Benefit Analysis Report For Mortgage Approval Download PDF
The Table Of Contents For Construction Project Cost Benefit Analysis Report For Mortgage Approval Download PDF is a compilation of the most recent design trends as a series of slides. It is suitable for any subject or industry presentation, containing attractive visuals and photo spots for businesses to clearly express their messages. This template contains a variety of slides for the user to input data, such as structures to contrast two elements, bullet points, and slides for written information. Slidegeeks is prepared to create an impression.
Infrastructure As A Service Big Data Analysis Icon To Predict Current Trends Clipart Pdf
Showcasing this set of slides titled Infrastructure As A Service Big Data Analysis Icon To Predict Current Trends Clipart Pdf. The topics addressed in these templates are Infrastructure As Service, Big Data Analysis, Icon To Predict, Current Trends. All the content presented in this PPT design is completely editable. Download it and make adjustments in color, background, font etc. as per your unique business setting. Our Infrastructure As A Service Big Data Analysis Icon To Predict Current Trends Clipart Pdf are topically designed to provide an attractive backdrop to any subject. Use them to look like a presentation pro.
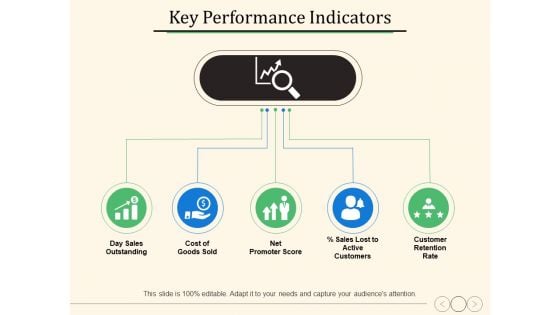
Key Performance Indicators Ppt PowerPoint Presentation Pictures Design Templates
This is a key performance indicators ppt powerpoint presentation pictures design templates. This is a five stage process. The stages in this process are day sales outstanding, cost of goods sold, customer retention rate.
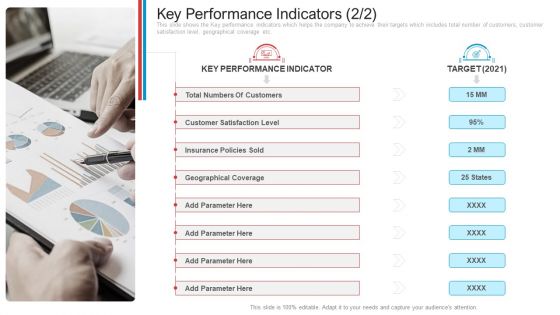
Key Performance Indicators Customers Introduction PDF
This slide shows the Key performance indicators which helps the company to achieve their targets which includes total number of customers, customer satisfaction level, geographical coverage etc. Presenting key performance indicators customers introduction pdf. to provide visual cues and insights. Share and navigate important information on seven stages that need your due attention. This template can be used to pitch topics like total numbers of customers, customer satisfaction level, insurance policies sold, geographical coverage, key performance indicator. In addtion, this PPT design contains high resolution images, graphics, etc, that are easily editable and available for immediate download.
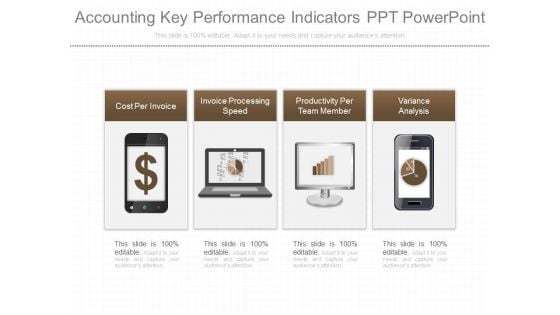
Accounting Key Performance Indicators Ppt Powerpoint
This is a accounting key performance indicators ppt powerpoint. This is a four stage process. The stages in this process are cost per invoice, invoice processing speed, productivity per team member, variance analysis.
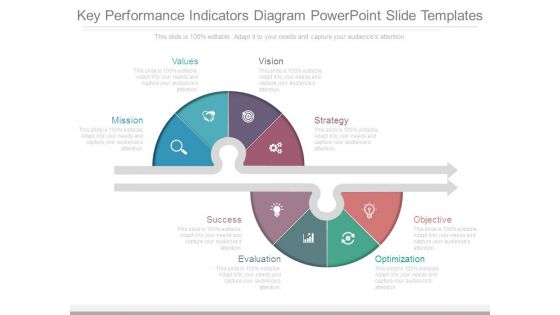
Key Performance Indicators Diagram Powerpoint Slide Templates
This is a key performance indicators diagram powerpoint slide templates. This is a eight stage process. The stages in this process are mission, values, vision, strategy, success, evaluation, optimization, objective.
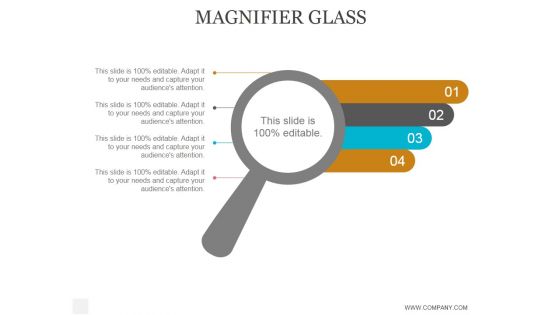
Magnifier Glass Ppt PowerPoint Presentation Visual Aids
This is a magnifier glass ppt powerpoint presentation visual aids. This is a four stage process. The stages in this process are business, strategy, marketing, analysis, success, magnifier glass.

Magnifying Glass Ppt PowerPoint Presentation Gallery Example Introduction
This is a magnifying glass ppt powerpoint presentation gallery example introduction. This is a one stage process. The stages in this process are business, strategy, marketing, analysis, magnifying glass.
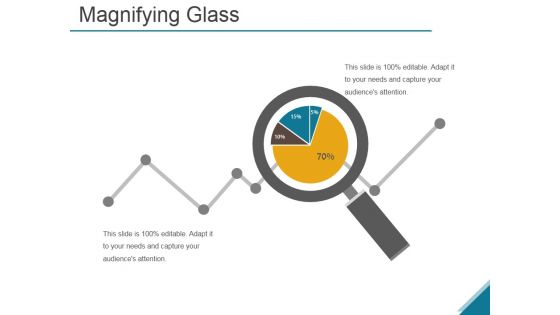
Magnifying Ppt PowerPoint Presentation Outline Maker
This is a magnifying ppt powerpoint presentation outline maker. This is a four stage process. The stages in this process are business, strategy, analysis, success, chart and graph, finance.
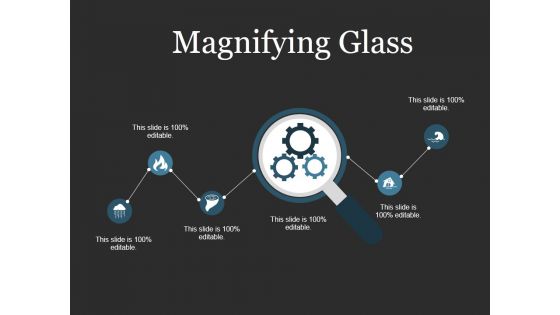
Magnifying Glass Ppt PowerPoint Presentation File Introduction
This is a magnifying glass ppt powerpoint presentation file introduction. This is a five stage process. The stages in this process are magnifier glass, search, marketing, analysis, process, business.
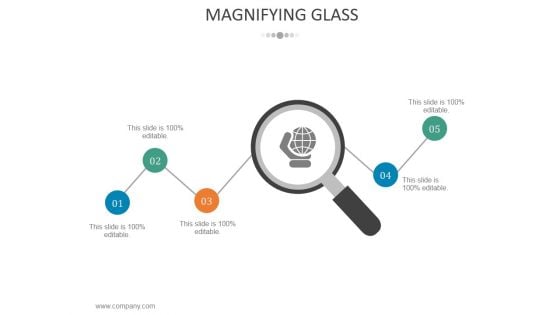
Magnifying Glass Ppt PowerPoint Presentation Infographic Template Portfolio
This is a magnifying glass ppt powerpoint presentation infographic template portfolio. This is a five stage process. The stages in this process are business, strategy, marketing, analysis, magnifying glass.

Mutually Beneficial Supplier Relations Ppt PowerPoint Presentation File Templates
This is a mutually beneficial supplier relations ppt powerpoint presentation file templates. This is a one stage process. The stages in this process are magnifier, search, marketing, strategy, analysis, business.
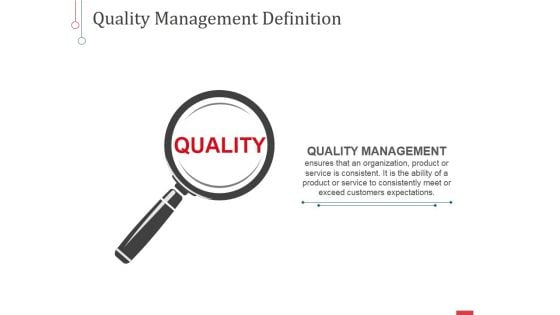
Quality Ppt PowerPoint Presentation Infographic Template Sample
This is a quality ppt powerpoint presentation infographic template sample. This is a one stage process. The stages in this process are quality management, magnifier, search, marketing, strategy, analysis, business.

Magnifying Glass Ppt PowerPoint Presentation Infographic Template Graphics Tutorials
This is a magnifying glass ppt powerpoint presentation infographic template graphics tutorials. This is a one stage process. The stages in this process are business, strategy, marketing, analysis, magnifying glass.
Key Financial Ratios Template 2 Ppt PowerPoint Presentation Icon Professional
This is a key financial ratios template 2 ppt powerpoint presentation icon professional. This is a four stage process. The stages in this process are business, marketing, analysis, finance, search.
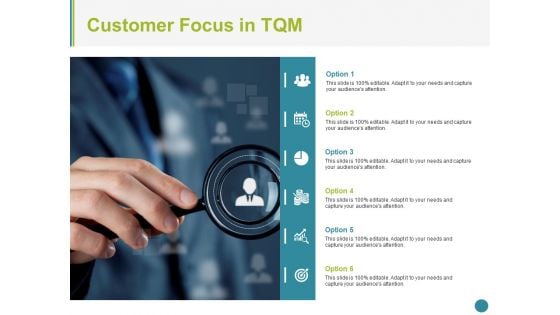
Customer Focus In Tqm Ppt PowerPoint Presentation Portfolio Graphic Images
This is a Customer Focus In Tqm Ppt PowerPoint Presentation Portfolio Graphic Images. This is a six stage process. The stages in this process are business, icons, marketing, strategy, analysis.
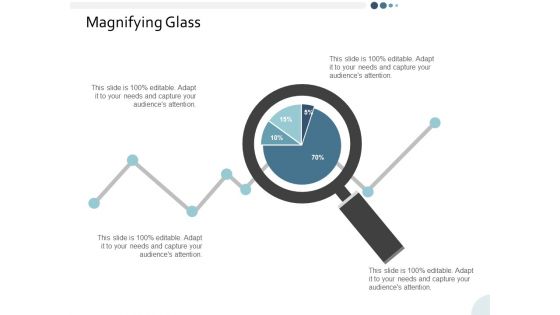
Magnifying Glass Yearly Operating Plan Ppt PowerPoint Presentation Summary Guidelines
This is a magnifying glass yearly operating plan ppt powerpoint presentation summary guidelines. This is a four stage process. The stages in this process are business, management, strategy, analysis, marketing.
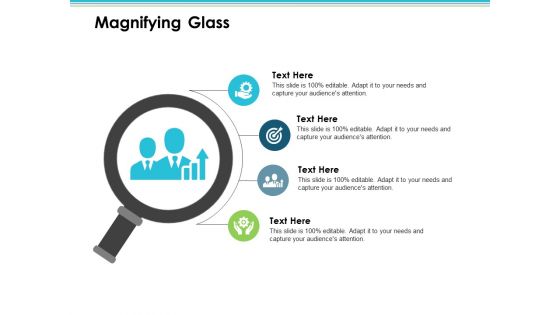
Magnifying Glass Employee Value Proposition Ppt PowerPoint Presentation Layouts Graphics Template
This is a magnifying glass employee value proposition ppt powerpoint presentation layouts graphics template. This is a four stage process. The stages in this process are business, management, strategy, analysis, icons.

Implementing Strategies To Enhance Kpis Affected Post Implementing Strategies To Enhance Retail
This slide covers KPIs to analyze impact of implementing effective marketing and customer service strategies to improve retail sales performance. It involves KPIs such as average transaction value, customer retention rate, food traffic and net sales. Are you searching for a Implementing Strategies To Enhance Kpis Affected Post Implementing Strategies To Enhance Retail that is uncluttered, straightforward, and original Its easy to edit, and you can change the colors to suit your personal or business branding. For a presentation that expresses how much effort you have put in, this template is ideal With all of its features, including tables, diagrams, statistics, and lists, its perfect for a business plan presentation. Make your ideas more appealing with these professional slides. Download Implementing Strategies To Enhance Kpis Affected Post Implementing Strategies To Enhance Retail from Slidegeeks today. This slide covers KPIs to analyze impact of implementing effective marketing and customer service strategies to improve retail sales performance. It involves KPIs such as average transaction value, customer retention rate, food traffic and net sales.
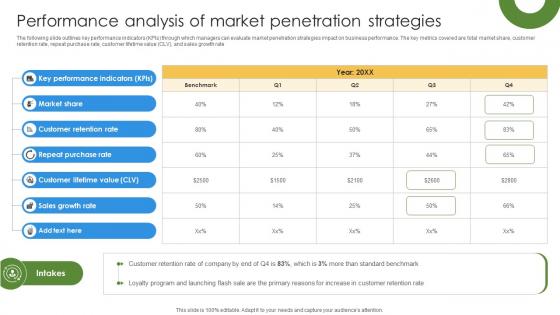
Marketing Growth Strategy To Performance Analysis Of Market Penetration Strategies Strategy SS V
The following slide outlines key performance indicators KPIs through which managers can evaluate market penetration strategies impact on business performance. The key metrics covered are total market share, customer retention rate, repeat purchase rate, customer lifetime value CLV, and sales growth rate. Slidegeeks is here to make your presentations a breeze with Marketing Growth Strategy To Performance Analysis Of Market Penetration Strategies Strategy SS V With our easy-to-use and customizable templates, you can focus on delivering your ideas rather than worrying about formatting. With a variety of designs to choose from, you are sure to find one that suits your needs. And with animations and unique photos, illustrations, and fonts, you can make your presentation pop. So whether you are giving a sales pitch or presenting to the board, make sure to check out Slidegeeks first The following slide outlines key performance indicators KPIs through which managers can evaluate market penetration strategies impact on business performance. The key metrics covered are total market share, customer retention rate, repeat purchase rate, customer lifetime value CLV, and sales growth rate.

Table Of Contents For Implementing Brand Leadership Strategy To Improve Operationals Graphics PDF
Overview Brand Leadership, Brand Building, Dashboard
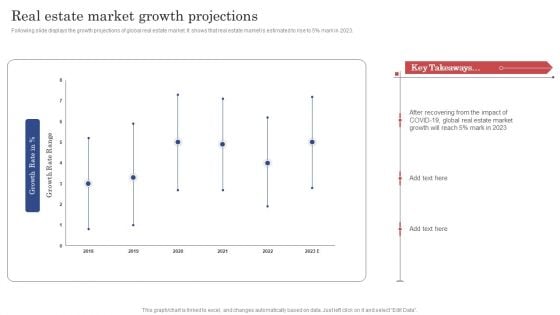
Construction Project Cost Benefit Analysis Report Real Estate Market Growth Projections Rules PDF
Following slide displays the growth projections of global real estate market. It shows that real estate market is estimated to rise to 5 percent mark in 2023. The Construction Project Cost Benefit Analysis Report Real Estate Market Growth Projections Rules PDF is a compilation of the most recent design trends as a series of slides. It is suitable for any subject or industry presentation, containing attractive visuals and photo spots for businesses to clearly express their messages. This template contains a variety of slides for the user to input data, such as structures to contrast two elements, bullet points, and slides for written information. Slidegeeks is prepared to create an impression.

Actual Time Transaction Monitoring Software And Strategies Numerous Types Of Transaction Monitoring Ideas PDF
This slide illustrates various types of transaction monitoring technologies. It provides information about suspicious activity reports SARs, adverse media monitoring solution, customer due diligence solution, transaction monitoring screening solution, etc. The Actual Time Transaction Monitoring Software And Strategies Numerous Types Of Transaction Monitoring Ideas PDF is a compilation of the most recent design trends as a series of slides. It is suitable for any subject or industry presentation, containing attractive visuals and photo spots for businesses to clearly express their messages. This template contains a variety of slides for the user to input data, such as structures to contrast two elements, bullet points, and slides for written information. Slidegeeks is prepared to create an impression.

Marketers Guide To Data Analysis Optimization Introduction To SEO Analytics For Improving Websites Organic Structure PDF
This slide covers an overview of search engine optimization analytics. It also includes steps to perform website SEO analytics, such as checking the speed of your website, identifying your key competitors, analyzing best-performing pages, performing a competition backlink profile analysis, etc. The Marketers Guide To Data Analysis Optimization Introduction To SEO Analytics For Improving Websites Organic Structure PDF is a compilation of the most recent design trends as a series of slides. It is suitable for any subject or industry presentation, containing attractive visuals and photo spots for businesses to clearly express their messages. This template contains a variety of slides for the user to input data, such as structures to contrast two elements, bullet points, and slides for written information. Slidegeeks is prepared to create an impression.


 Continue with Email

 Home
Home


