Business Snapshot
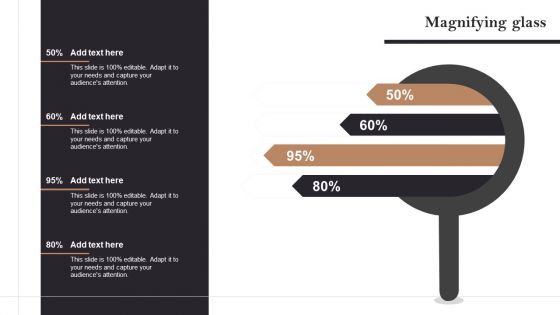
Magnifying Glass Opening Retail Store In Untapped Industry For Sales Growth Sample PDF
Do you have to make sure that everyone on your team knows about any specific topic I yes, then you should give Magnifying Glass Opening Retail Store In Untapped Industry For Sales Growth Sample PDF a try. Our experts have put a lot of knowledge and effort into creating this impeccable Magnifying Glass Opening Retail Store In Untapped Industry For Sales Growth Sample PDF. You can use this template for your upcoming presentations, as the slides are perfect to represent even the tiniest detail. You can download these templates from the Slidegeeks website and these are easy to edit. So grab these today.
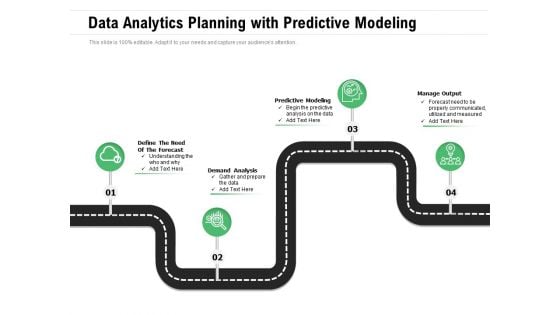
Data Analytics Planning With Predictive Modeling Ppt PowerPoint Presentation File Example Topics PDF
Presenting data analytics planning with predictive modeling ppt powerpoint presentation file example topics pdf to dispense important information. This template comprises four stages. It also presents valuable insights into the topics including analysis, communicated, predictive. This is a completely customizable PowerPoint theme that can be put to use immediately. So, download it and address the topic impactfully.
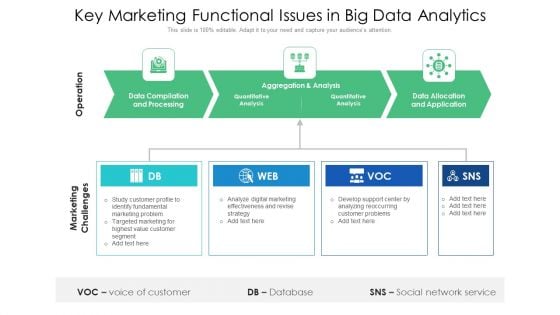
Key Marketing Functional Issues In Big Data Analytics Ppt PowerPoint Presentation Show Aids PDF
Presenting key marketing functional issues in big data analytics ppt powerpoint presentation show aids pdf to dispense important information. This template comprises three stages. It also presents valuable insights into the topics including data compilation and processing, aggregation and analysis, data allocation and application. This is a completely customizable PowerPoint theme that can be put to use immediately. So, download it and address the topic impactfully.
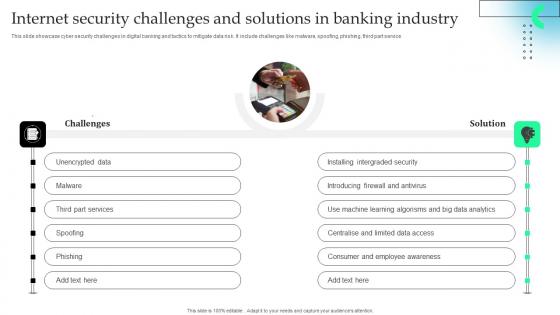
Internet Security Challenges And Solutions In Banking Industry Download Pdf
This slide showcase cyber security challenges in digital banking and tactics to mitigate data risk. It include challenges like malware, spoofing, phishing, third part service.Showcasing this set of slides titled Internet Security Challenges And Solutions In Banking Industry Download Pdf The topics addressed in these templates are Installing Intergraded, Introducing Firewall, Learning Algorisms All the content presented in this PPT design is completely editable. Download it and make adjustments in color, background, font etc. as per your unique business setting. This slide showcase cyber security challenges in digital banking and tactics to mitigate data risk. It include challenges like malware, spoofing, phishing, third part service.
Building Data Analytics And Cyber Security Strategy Framework Icons PDF
This slide covers various practices to be employed to expand healthcare business. It includes data culture, internal integration, predictive analytics, shareholders involvement and data security. Persuade your audience using this Building Data Analytics And Cyber Security Strategy Framework Icons PDF. This PPT design covers six stages, thus making it a great tool to use. It also caters to a variety of topics including Data Collection, Expansion, Standardize And Automate. Download this PPT design now to present a convincing pitch that not only emphasizes the topic but also showcases your presentation skills.
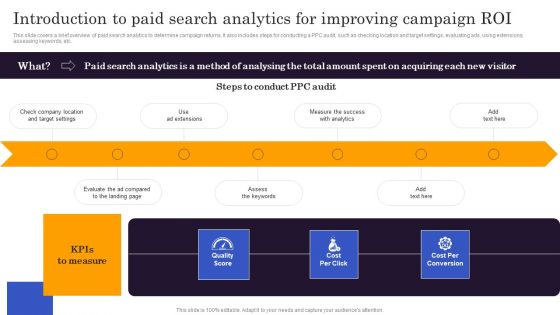
Marketers Guide To Data Analysis Optimization Introduction To Paid Search Analytics For Improving Campaign Roi Demonstration PDF
This slide covers a brief overview of paid search analytics to determine campaign returns. It also includes steps for conducting a PPC audit, such as checking location and target settings, evaluating ads, using extensions, assessing keywords, etc. The best PPT templates are a great way to save time, energy, and resources. Slidegeeks have 100 percent editable powerpoint slides making them incredibly versatile. With these quality presentation templates, you can create a captivating and memorable presentation by combining visually appealing slides and effectively communicating your message. Download Marketers Guide To Data Analysis Optimization Introduction To Paid Search Analytics For Improving Campaign Roi Demonstration PDF from Slidegeeks and deliver a wonderful presentation.
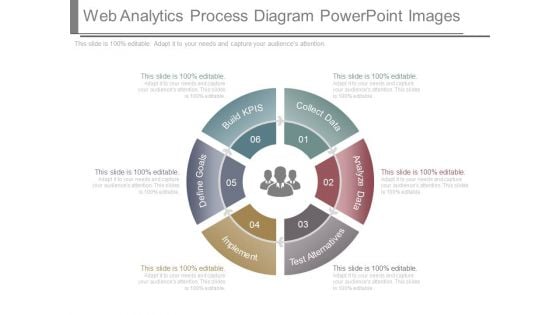
Web Analytics Process Diagram Powerpoint Images
This is a web analytics process diagram powerpoint images. This is a six stage process. The stages in this process are build kpis, define goals, implement, test alternatives, analyze data, collect data.
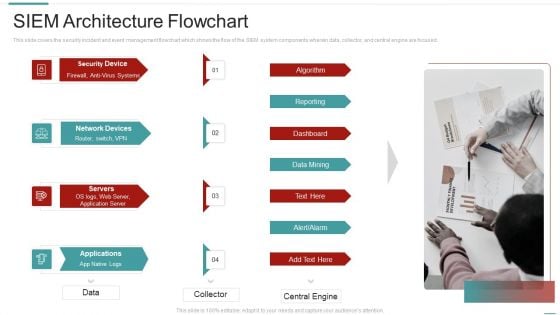
Risk Recognition Automation Siem Architecture Flowchart Ppt Summary Example File PDF
This slide covers the security incident and event management flowchart which shows the flow of the SIEM system components wherein data, collector, and central engine are focused. Presenting risk recognition automation siem architecture flowchart ppt summary example file pdf to provide visual cues and insights. Share and navigate important information on four stages that need your due attention. This template can be used to pitch topics like reporting, dashboard, data mining, algorithm. In addtion, this PPT design contains high resolution images, graphics, etc, that are easily editable and available for immediate download.
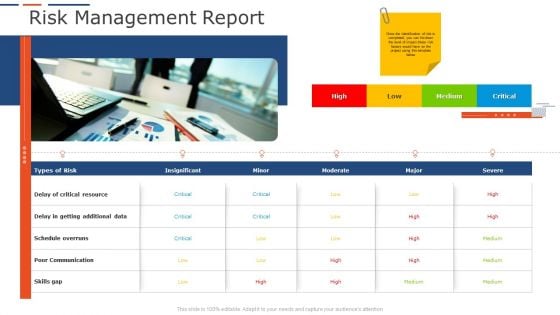
Company Project Planning Risk Management Report Ppt Slides Gallery PDF
This is a company project planning risk management report ppt slides gallery pdf template with various stages. Focus and dispense information on four stages using this creative set, that comes with editable features. It contains large content boxes to add your information on topics like communication, resource, data, risk. You can also showcase facts, figures, and other relevant content using this PPT layout. Grab it now.
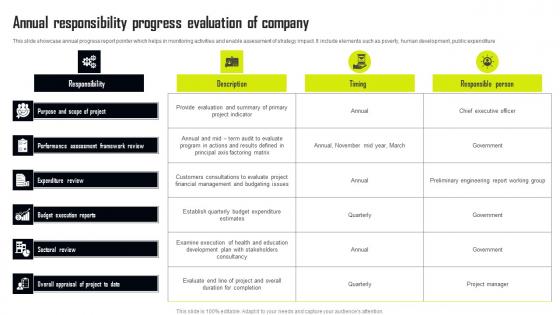
Annual Responsibility Progress Evaluation Of Company Information Pdf
This slide showcase annual progress report pointer which helps in monitoring activities and enable assessment of strategy impact. It include elements such as poverty, human development, public expenditure Showcasing this set of slides titled Annual Responsibility Progress Evaluation Of Company Information Pdf The topics addressed in these templates are Responsibility, Performance Assessment, Framework Review All the content presented in this PPT design is completely editable. Download it and make adjustments in color, background, font etc. as per your unique business setting. This slide showcase annual progress report pointer which helps in monitoring activities and enable assessment of strategy impact. It include elements such as poverty, human development, public expenditure
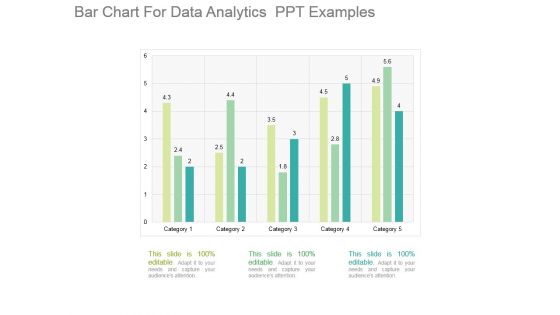
Bar Chart For Data Analytics Ppt Examples
This is a bar chart for data analytics ppt examples. This is a five stage process. The stages in this process are category.
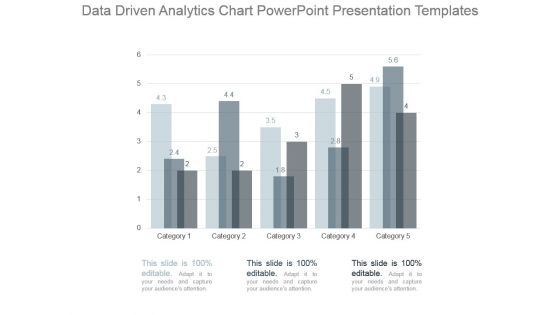
Data Driven Analytics Chart Powerpoint Presentation Templates
This is a data driven analytics chart powerpoint presentation templates. This is a five stage process. The stages in this process are category.
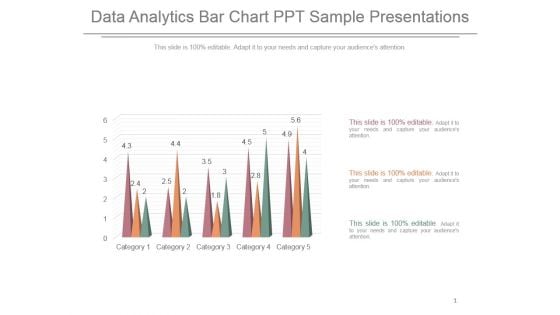
Data Analytics Bar Chart Ppt Sample Presentations
This is a data analytics bar chart ppt sample presentations. This is a five stage process. The stages in this process are category.
Table Of Contents For Administered Data And Analytic Quality Playbook Themes PDF
Presenting Table Of Contents For Administered Data And Analytic Quality Playbook Themes PDF to provide visual cues and insights. Share and navigate important information on one stags that need your due attention. This template can be used to pitch topics like Automated Data, Analysis Powered, Solutions Barriers In addtion, this PPT design contains high resolution images, graphics, etc, that are easily editable and available for immediate download.
Table Of Contents Information Analytics And Ml Strategy Playbook Data Graphics PDF
This is a Table Of Contents Information Analytics And Ml Strategy Playbook Data Graphics PDF template with various stages. Focus and dispense information on one stages using this creative set, that comes with editable features. It contains large content boxes to add your information on topics like Automated Data Analysis, Strategy Playbook, Information. You can also showcase facts, figures, and other relevant content using this PPT layout. Grab it now.
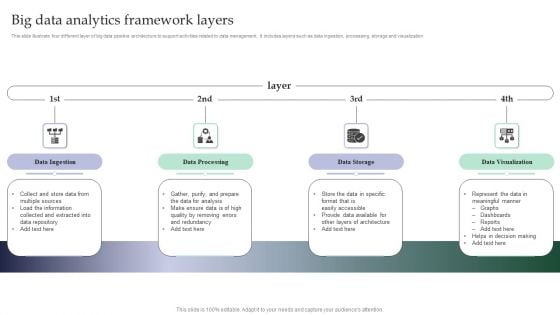
Big Data Analytics Framework Layers Formats PDF
This slide illustrate four different layer of big data pipeline architecture to support activities related to data management. It includes layers such as data ingestion, processing, storage and visualization Persuade your audience using this Benefits Of Big Data And Analytics Framework For Organization Development Guidelines PDF. This PPT design covers four stages, thus making it a great tool to use. It also caters to a variety of topics including Data Ingestion, Data Processing, Data Storage. Download this PPT design now to present a convincing pitch that not only emphasizes the topic but also showcases your presentation skills.
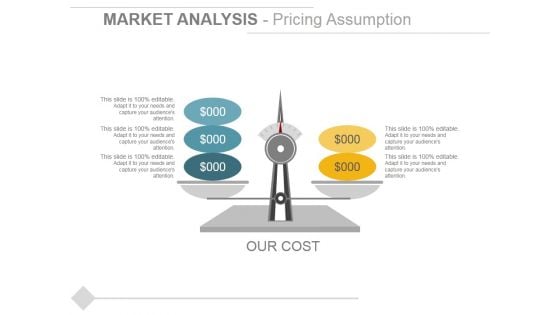
Market Analysis Pricing Assumption Ppt PowerPoint Presentation Visual Aids Gallery
This is a market analysis pricing assumption ppt powerpoint presentation visual aids gallery. This is a two stage process. The stages in this process are market analysis, dashboard, business, marketing.
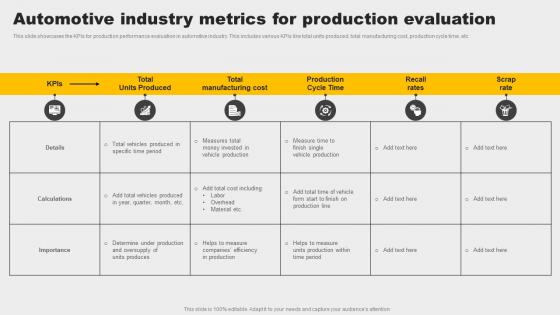
Automotive Industry Metrics For Production Evaluation Information Pdf
This slide showcases the KPIs for production performance evaluation in automotive industry. This includes various KPIs like total units produced, total manufacturing cost, production cycle time, etc. Showcasing this set of slides titled Automotive Industry Metrics For Production Evaluation Information Pdf. The topics addressed in these templates are Measures, Vehicle Production, Determine. All the content presented in this PPT design is completely editable. Download it and make adjustments in color, background, font etc. as per your unique business setting. This slide showcases the KPIs for production performance evaluation in automotive industry. This includes various KPIs like total units produced, total manufacturing cost, production cycle time, etc.
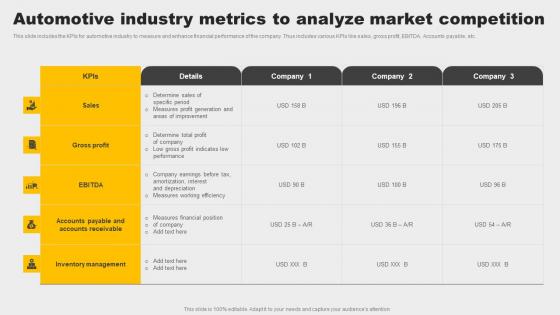
Automotive Industry Metrics To Analyze Market Competition Summary Pdf
This slide includes the KPIs for automotive industry to measure and enhance financial performance of the company. Thus includes various KPIs like sales, gross profit, EBITDA, Accounts payable, etc. Showcasing this set of slides titled Automotive Industry Metrics To Analyze Market Competition Summary Pdf. The topics addressed in these templates are Gross Profit, Inventory Management, Sales. All the content presented in this PPT design is completely editable. Download it and make adjustments in color, background, font etc. as per your unique business setting. This slide includes the KPIs for automotive industry to measure and enhance financial performance of the company. Thus includes various KPIs like sales, gross profit, EBITDA, Accounts payable, etc.
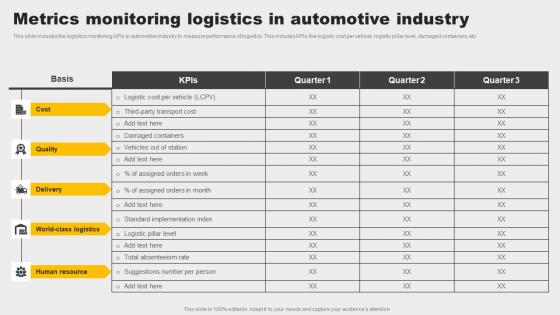
Metrics Monitoring Logistics In Automotive Industry Designs Pdf
This slide includes the logistics monitoring KPIs in automotive industry to measure performance of logistics. This includes KPIs like logistic cost per vehicle, logistic pillar level, damaged containers, etc. Showcasing this set of slides titled Metrics Monitoring Logistics In Automotive Industry Designs Pdf. The topics addressed in these templates are Quality, Cost, Human Resource. All the content presented in this PPT design is completely editable. Download it and make adjustments in color, background, font etc. as per your unique business setting. This slide includes the logistics monitoring KPIs in automotive industry to measure performance of logistics. This includes KPIs like logistic cost per vehicle, logistic pillar level, damaged containers, etc.
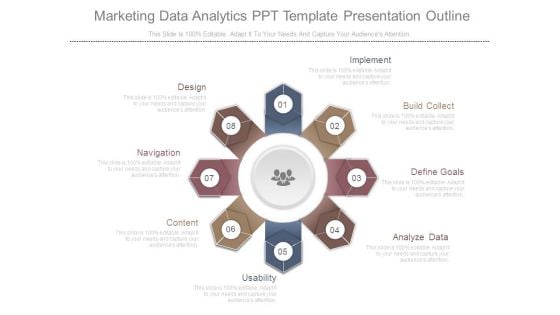
Marketing Data Analytics Ppt Template Presentation Outline
This is a marketing data analytics ppt template presentation outline. This is a eight stage process. The stages in this process are design, navigation, content, usability, analyze data, define goals, build collect, implement.
Predictive Healthcare Data Analytics Icon Summary PDF
Presenting Predictive Healthcare Data Analytics Icon Summary PDF to dispense important information. This template comprises Three stages. It also presents valuable insights into the topics including Predictive Healthcare, Data Analytics Icon. This is a completely customizable PowerPoint theme that can be put to use immediately. So, download it and address the topic impactfully
Statistical Data Icon Of Data Analytics Using Bar Graph Background PDF
Presenting statistical data icon of data analytics using bar graph background pdf to dispense important information. This template comprises four stages. It also presents valuable insights into the topics including statistical data icon of data analytics using bar graph. This is a completely customizable PowerPoint theme that can be put to use immediately. So, download it and address the topic impactfully.
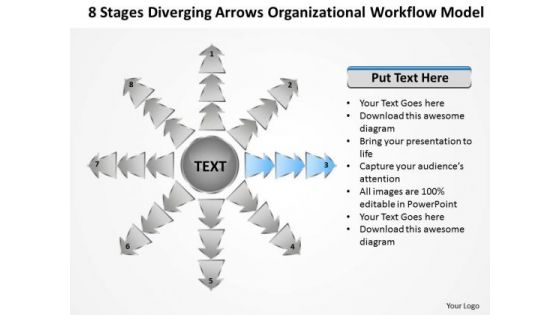
Diverging Arrows Organizational Workflow Model Cycle Process Diagram PowerPoint Slide
We present our diverging arrows organizational workflow model Cycle Process Diagram PowerPoint Slide.Download our Process and Flows PowerPoint Templates because you have the entire picture in mind. Download and present our Arrows PowerPoint Templates because this is the unerring accuracy in reaching the target. the effortless ability to launch into flight. Download and present our Flow Charts PowerPoint Templates because this diagram helps to reaffirm to your team your faith in maintaining the highest ethical standards. Download our Marketing PowerPoint Templates because networking is an imperative in todays world. You need to access the views of others. Similarly you need to give access to them of your abilities. Download our Business PowerPoint Templates because your product has established a foothold in the market. Customers are happy with the value it brings to their lives.Use these PowerPoint slides for presentations relating to Arrow, art, artistic,background, caricature, chart, childish,circular, creative, design, diagram,doodle, draw, flow, graffiti, graphic,grunge, hand, handwritten, icon,illustration, image, isolated, object, pie, pieces, process, raster,report, retro, rough, scribble, segmented, simple, sketch, sketchy, slices,statistic, styling, succeed, success,symbol. The prominent colors used in the PowerPoint template are Yellow, Black, Gray. Professionals tell us our diverging arrows organizational workflow model Cycle Process Diagram PowerPoint Slide are Fun. People tell us our circular PowerPoint templates and PPT Slides are Efficacious. The feedback we get is that our diverging arrows organizational workflow model Cycle Process Diagram PowerPoint Slide will get their audience's attention. Presenters tell us our background PowerPoint templates and PPT Slides are Luxuriant. You can be sure our diverging arrows organizational workflow model Cycle Process Diagram PowerPoint Slide are Breathtaking. PowerPoint presentation experts tell us our circular PowerPoint templates and PPT Slides are Charming. Add brilliance with our Diverging Arrows Organizational Workflow Model Cycle Process Diagram PowerPoint Slide. You will come out on top.
Virtual WAN Architecture Overview Of Software Defined Wan Architecture Layers Icons PDF
This slide describes the overview of SD-WAN architectural layers, including orchestration and analytics, virtual service delivery, and secure cloud network. The purpose of this slide is to highlight the main features and functions of SD-WAN layers. Get a simple yet stunning designed Virtual WAN Architecture Overview Of Software Defined Wan Architecture Layers Icons PDF. It is the best one to establish the tone in your meetings. It is an excellent way to make your presentations highly effective. So, download this PPT today from Slidegeeks and see the positive impacts. Our easy-to-edit Virtual WAN Architecture Overview Of Software Defined Wan Architecture Layers Icons PDF can be your go-to option for all upcoming conferences and meetings. So, what are you waiting for Grab this template today.
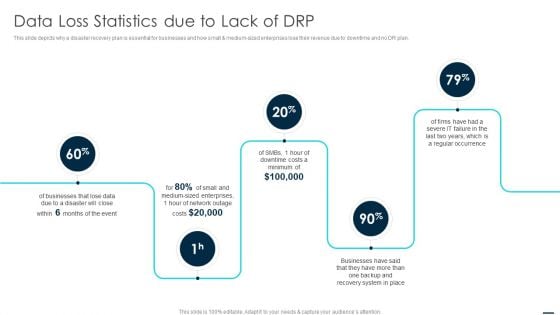
Technology Disaster Recovery Plan Data Loss Statistics Due To Lack Of DRP Guidelines PDF
This slide depicts why a disaster recovery plan is essential for businesses and how small and medium sized enterprises lose their revenue due to downtime and no DR plan. Presenting Technology Disaster Recovery Plan Data Loss Statistics Due To Lack Of DRP Guidelines PDF to provide visual cues and insights. Share and navigate important information on five stages that need your due attention. This template can be used to pitch topics like Recovery System, Businesses, Enterprises. In addtion, this PPT design contains high resolution images, graphics, etc, that are easily editable and available for immediate download.
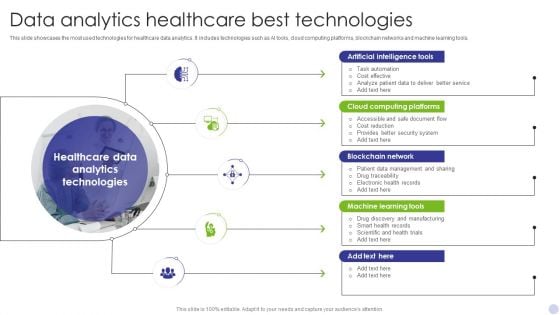
Data Analytics Healthcare Best Technologies Template PDF
This slide showcases the most used technologies for healthcare data analytics. It includes technologies such as AI tools, cloud computing platforms, blockchain networks and machine learning tools. Presenting Data Analytics Healthcare Best Technologies Template PDF to dispense important information. This template comprises Five stages. It also presents valuable insights into the topics including Artificial Intelligence Tools, Cloud Computing Platforms, Blockchain Network. This is a completely customizable PowerPoint theme that can be put to use immediately. So, download it and address the topic impactfully.
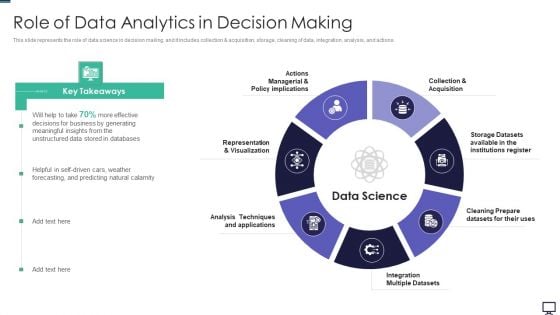
Role Of Data Analytics In Decision Making Ppt Portfolio Skills PDF
This is a role of data analytics in decision making ppt portfolio skills pdf template with various stages. Focus and dispense information on seven stages using this creative set, that comes with editable features. It contains large content boxes to add your information on topics like applications, analysis techniques, datasets, managerial. You can also showcase facts, figures, and other relevant content using this PPT layout. Grab it now.
Data Requirements For Analytics Icon With Solution Slides PDF
Persuade your audience using this data requirements for analytics icon with solution slides pdf. This PPT design covers four stages, thus making it a great tool to use. It also caters to a variety of topics including data requirements for analytics icon with solution. Download this PPT design now to present a convincing pitch that not only emphasizes the topic but also showcases your presentation skills.
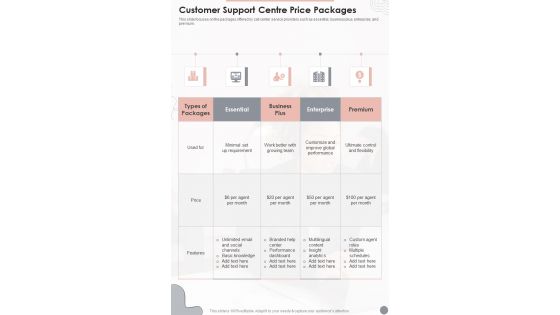
Customer Support Centre Price Packages One Pager Sample Example Document
This slide focuses on the packages offered by call center service providers such as essential, business plus, enterprise, and premium. Presenting you an exemplary Customer Support Centre Price Packages One Pager Sample Example Document. Our one-pager comprises all the must-have essentials of an inclusive document. You can edit it with ease, as its layout is completely editable. With such freedom, you can tweak its design and other elements to your requirements. Download this Customer Support Centre Price Packages One Pager Sample Example Document brilliant piece now.

Statistical Evaluation Of Research Discovery Statistical Analysis Team Cost Structure One Pager Sample Example Document
This slide focuses on the packages offered by call center service providers such as essential, business plus, enterprise, and premium. Presenting you an exemplary Statistical Evaluation Of Research Discovery Statistical Analysis Team Cost Structure One Pager Sample Example Document. Our one pager comprises all the must have essentials of an inclusive document. You can edit it with ease, as its layout is completely editable. With such freedom, you can tweak its design and other elements to your requirements. Download this Statistical Evaluation Of Research Discovery Statistical Analysis Team Cost Structure One Pager Sample Example Document brilliant piece now.
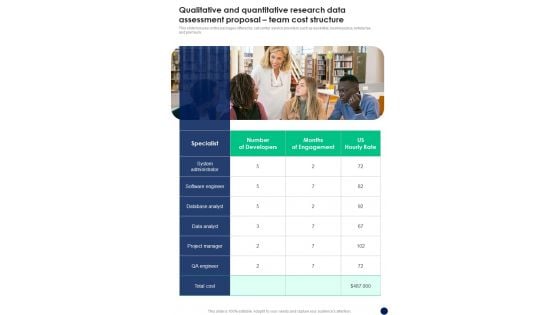
Qualitative And Quantitative Research Data Assessment Proposal Team Cost Structure One Pager Sample Example Document
This slide focuses on the packages offered by call center service providers such as essential, business plus, enterprise, and premium. Presenting you an exemplary Qualitative And Quantitative Research Data Assessment Proposal Team Cost Structure One Pager Sample Example Document. Our one pager comprises all the must have essentials of an inclusive document. You can edit it with ease, as its layout is completely editable. With such freedom, you can tweak its design and other elements to your requirements. Download this Qualitative And Quantitative Research Data Assessment Proposal Team Cost Structure One Pager Sample Example Document brilliant piece now.
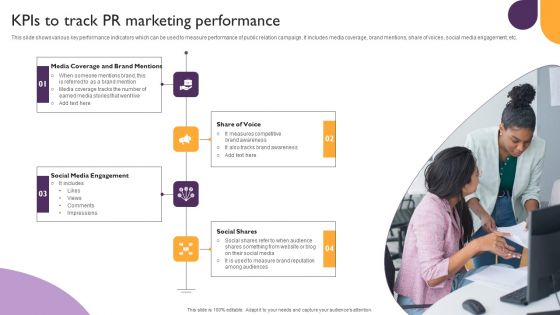
Public Relations Guide To Enhance Brand Credibility Kpis To Track PR Marketing Performance Infographics PDF
This slide shows various key performance indicators which can be used to measure performance of public relation campaign. It includes media coverage, brand mentions, share of voices, social media engagement, etc. Formulating a presentation can take up a lot of effort and time, so the content and message should always be the primary focus. The visuals of the PowerPoint can enhance the presenters message, so our Public Relations Guide To Enhance Brand Credibility Kpis To Track PR Marketing Performance Infographics PDF was created to help save time. Instead of worrying about the design, the presenter can concentrate on the message while our designers work on creating the ideal templates for whatever situation is needed. Slidegeeks has experts for everything from amazing designs to valuable content, we have put everything into Public Relations Guide To Enhance Brand Credibility Kpis To Track PR Marketing Performance Infographics PDF
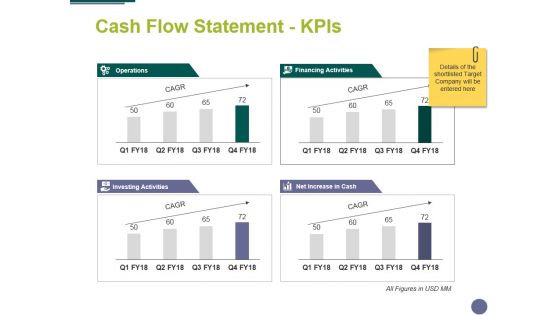
Cash Flow Statement Kpis Ppt PowerPoint Presentation File Styles
This is a cash flow statement kpis ppt powerpoint presentation file styles. This is a four stage process. The stages in this process are management, business, marketing, compere, strategy.
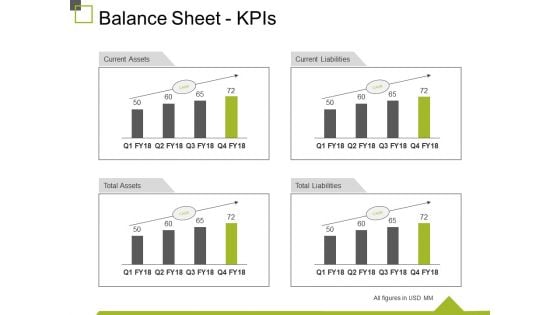
Balance Sheet Kpis Ppt PowerPoint Presentation Visual Aids Inspiration
This is a balance sheet kpis ppt powerpoint presentation visual aids inspiration. This is a four stage process. The stages in this process are current assets, current liabilities, total liabilities, total assets, business.
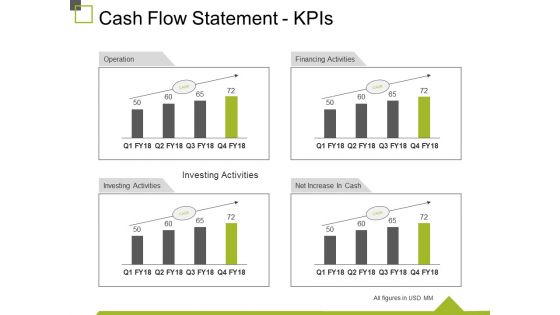
Cash Flow Statement Kpis Ppt PowerPoint Presentation Ideas Graphics
This is a cash flow statement kpis ppt powerpoint presentation ideas graphics. This is a four stage process. The stages in this process are operation, financing activities, net increase in cash, investing activities, business.
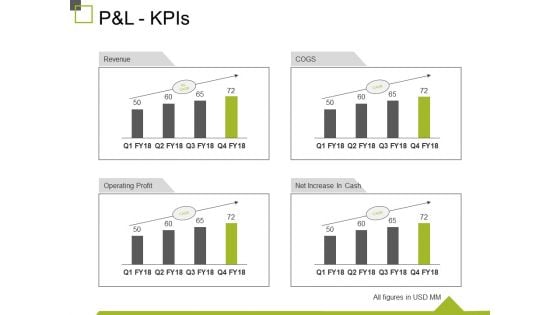
P And L Kpis Ppt PowerPoint Presentation Show Design Inspiration
This is a p and l kpis ppt powerpoint presentation show design inspiration. This is a four stage process. The stages in this process are revenue, operating profit, cogs, net increase in cash, business.
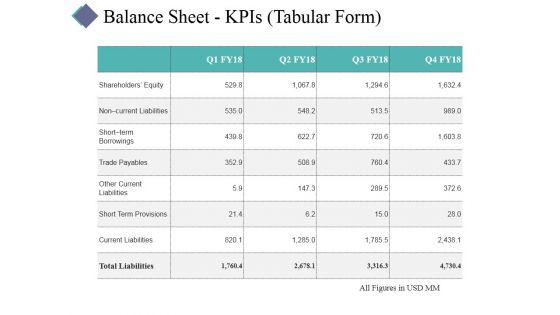
Balance Sheet Kpis Template 1 Ppt PowerPoint Presentation Gallery Visuals
This is a balance sheet kpis template 1 ppt powerpoint presentation gallery visuals. This is a four stage process. The stages in this process are business, table, management, analysis, success.
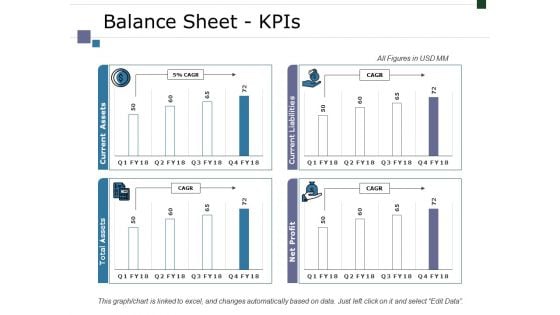
Balance Sheet Kpis Ppt PowerPoint Presentation Infographic Template Designs
This is a balance sheet kpis ppt powerpoint presentation infographic template designs. This is a four stage process. The stages in this process are business, marketing, finance, graph, strategy.
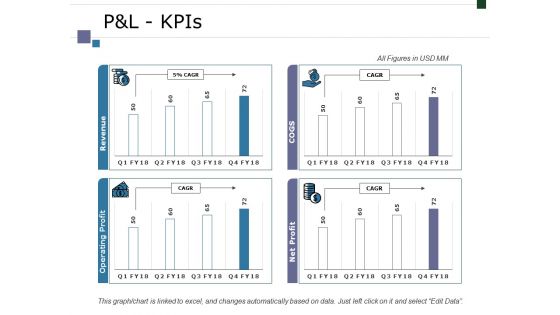
Pandl Kpis Ppt PowerPoint Presentation Infographic Template Graphics Tutorials
This is a pandl kpis ppt powerpoint presentation infographic template graphics tutorials. This is a four stage process. The stages in this process are business, marketing, finance, graph, strategy.
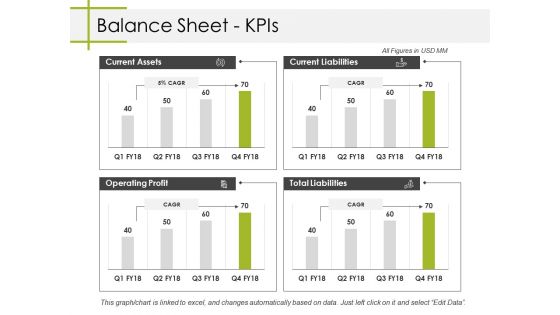
Balance Sheet Kpis Ppt PowerPoint Presentation Summary Designs Download
This is a balance sheet kpis ppt powerpoint presentation summary designs download. This is a four stage process. The stages in this process are current assets, current liabilities, total liabilities, operating profit, business.
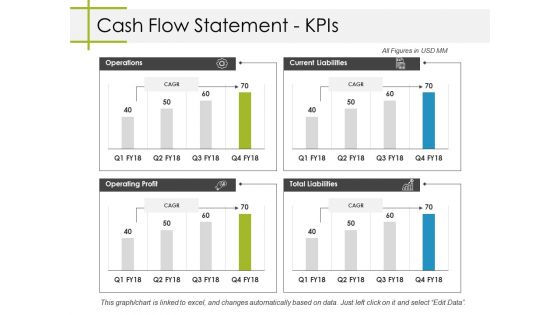
Cash Flow Statement Kpis Ppt PowerPoint Presentation Styles Themes
This is a cash flow statement kpis ppt powerpoint presentation styles themes. This is a four stage process. The stages in this process are business, operations, operating profit, total liabilities, current liabilities.
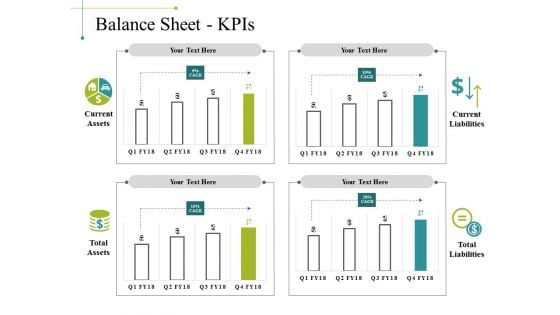
Balance Sheet Kpis Template 1 Ppt PowerPoint Presentation Show Inspiration
This is a balance sheet kpis template 1 ppt powerpoint presentation show inspiration. This is a four stage process. The stages in this process are business, marketing, graph, current liabilities, total liabilities.
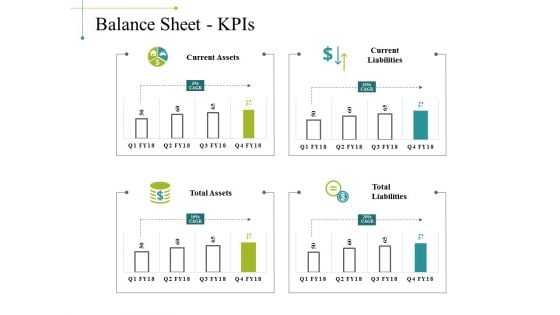
Balance Sheet Kpis Template 2 Ppt PowerPoint Presentation Gallery Example
This is a balance sheet kpis template 2 ppt powerpoint presentation gallery example. This is a four stage process. The stages in this process are business, marketing, graph, current liabilities, total liabilities.
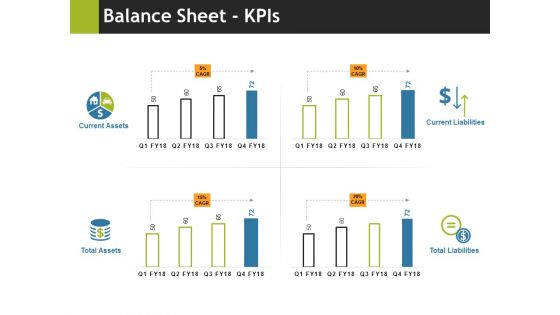
Balance Sheet Kpis Ppt PowerPoint Presentation Slides Download
This is a balance sheet kpis ppt powerpoint presentation slides download. This is a four stage process. The stages in this process are current assets, total assets, current liabilities, total liabilities, business.
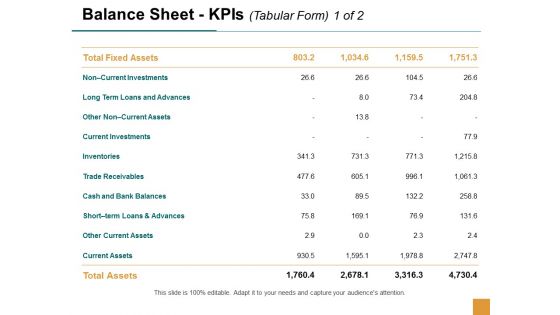
Balance Sheet Kpis Current Investments Ppt Powerpoint Presentation Professional Deck
This is a balance sheet kpis current investments ppt powerpoint presentation professional deck. This is a four stage process. The stages in this process are business, management, planning, strategy, marketing.
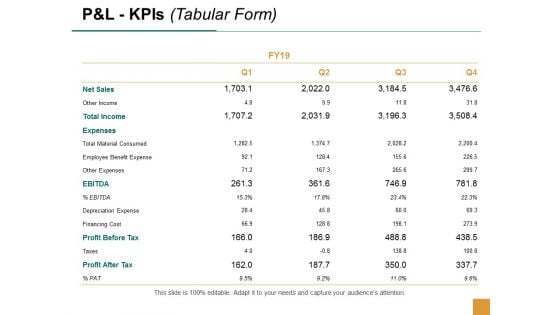
P And L Kpis Expenses Ppt Powerpoint Presentation Gallery Layouts
This is a p and l kpis expenses ppt powerpoint presentation gallery layouts. This is a four stage process. The stages in this process are business, management, planning, strategy, marketing.

Cash Flow Statement Kpis Ppt PowerPoint Presentation Gallery Vector
This is a cash flow statement kpis ppt powerpoint presentation gallery vector. This is a four stage process. The stages in this process are business, planning, strategy, marketing, management.
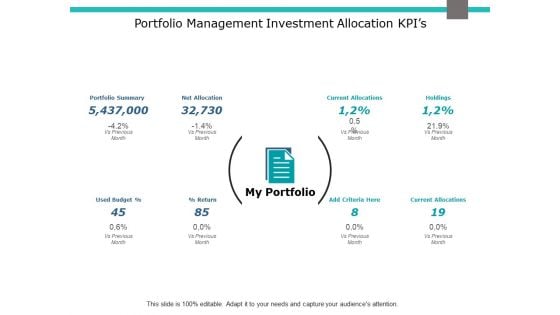
Portfolio Management Investment Allocation Kpis Ppt PowerPoint Presentation Gallery Slide
This is a portfolio management investment allocation kpis ppt powerpoint presentation gallery slide. This is a eight stage process. The stages in this process are business, management, marketing, agenda.
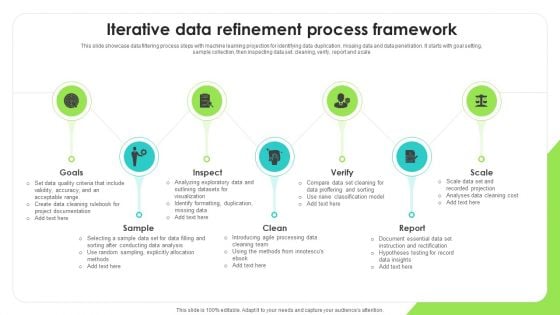
Iterative Data Refinement Process Framework Download PDF
This slide showcase data filtering process steps with machine learning projection for identifying data duplication, missing data and data penetration. It starts with goal setting, sample collection, then inspecting data set, cleaning, verify, report and scale. Presenting Iterative Data Refinement Process Framework Download PDF to dispense important information. This template comprises seven stages. It also presents valuable insights into the topics including Explicitly Allocation, Introducing Processing, Classification Model. This is a completely customizable PowerPoint theme that can be put to use immediately. So, download it and address the topic impactfully.
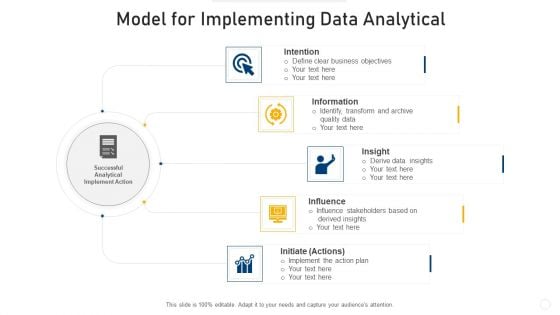
Model For Implementing Data Analytical Infographics PDF
Presenting model for implementing data analytical infographics pdf to dispense important information. This template comprises five stages. It also presents valuable insights into the topics including intention, insight, influence. This is a completely customizable PowerPoint theme that can be put to use immediately. So, download it and address the topic impactfully.

Agenda For Data Analytics Management Diagrams PDF
Presenting Agenda For Data Analytics Management Diagrams PDF to provide visual cues and insights. Share and navigate important information on five stages that need your due attention. This template can be used to pitch topics like Agenda. In addtion, this PPT design contains high resolution images, graphics, etc, that are easily editable and available for immediate download.
Shipment Tracking Solutions To Minimize Decline Of Sales Demonstration PDF
Following slide presents digital solutions for warehouse management that can be implemented by managers to streamline inventory management and reduce lost sales. Major solutions are radio frequency handheld device, dashboard, data analytics, trailer management etc. Persuade your audience using this Shipment Tracking Solutions To Minimize Decline Of Sales Demonstration PDF. This PPT design covers six stages, thus making it a great tool to use. It also caters to a variety of topics including Dashboard, Trailer Management, Advanced Solutions. Download this PPT design now to present a convincing pitch that not only emphasizes the topic but also showcases your presentation skills.
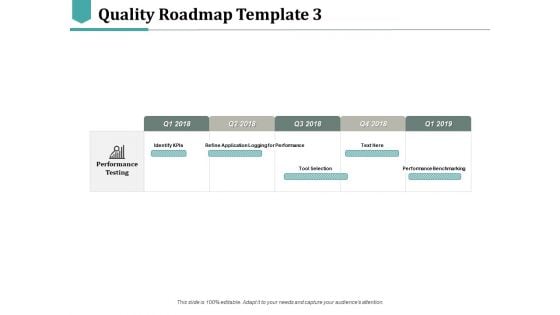
Quality Roadmap Identify Kpis Ppt PowerPoint Presentation Pictures Slideshow
This is a quality roadmap identify kpis ppt powerpoint presentation pictures slideshow. This is a five stage process. The stages in this process are identify kpis, tool selection, performance benchmarking.
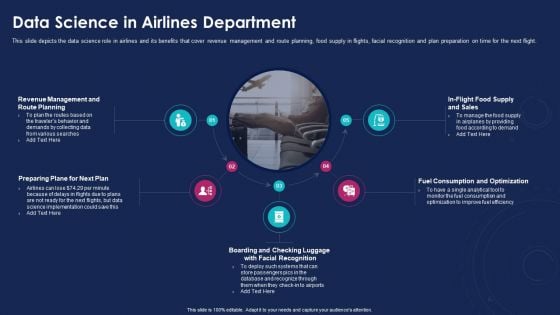
Data Analytics IT Data Science In Airlines Department Ppt Pictures Graphics Example PDF
This slide depicts the data science role in airlines and its benefits that cover revenue management and route planning, food supply in flights, facial recognition and plan preparation on time for the next flight. Presenting data analytics it data science in airlines department ppt pictures graphics example pdf to provide visual cues and insights. Share and navigate important information on five stages that need your due attention. This template can be used to pitch topics like revenue management planning, plan, facial recognition, consumption and optimization, sales. In addtion, this PPT design contains high resolution images, graphics, etc, that are easily editable and available for immediate download.
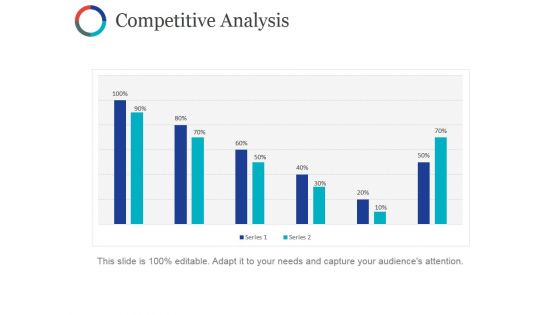
Competitive Analysis Template Ppt PowerPoint Presentation Infographic Template Files
This is a competitive analysis template ppt powerpoint presentation infographic template files. This is a twelve stage process. The stages in this process are table, data analysis, business, marketing, strategy.
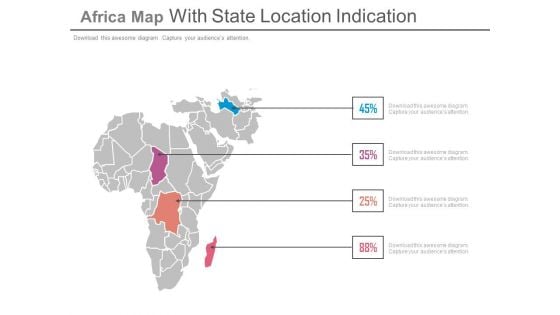
State Location On Africa Map With Percentage Data Powerpoint Slides
This PowerPoint template displays state location on Africa map with percentage data. This Map template can be used for annual growth report. This slide can also be used by school students for educational projects.
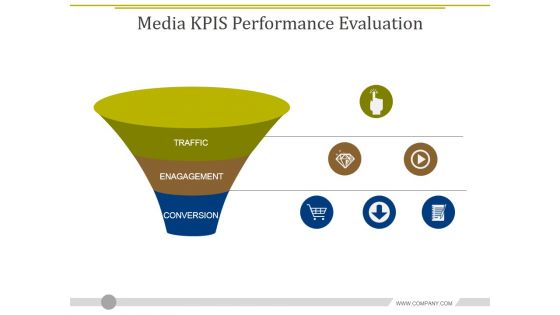
Media Kpis Performance Evaluation Ppt PowerPoint Presentation Pictures Show
This is a media kpis performance evaluation ppt powerpoint presentation pictures show. This is a three stage process. The stages in this process are traffic, engagement, conversion.
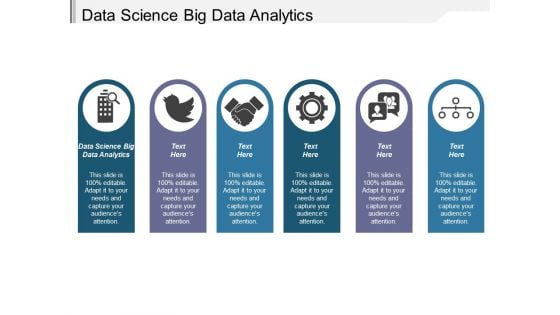
Data Science Big Data Analytics Ppt PowerPoint Presentation Gallery Shapes
This is a data science big data analytics ppt powerpoint presentation gallery shapes. This is a six stage process. The stages in this process are data science big data analytics.

Enterprise KPIS Diagram PowerPoint Topics
Presenting this set of slides with name enterprise kpis diagram powerpoint topics. This is a five stage process. The stages in this process are industry, financials, people, efficiency, corporate. This is a completely editable PowerPoint presentation and is available for immediate download. Download now and impress your audience.


 Continue with Email

 Home
Home


