Business Snapshot
Recruitment Dashboard For Managing Cloud Recruiting Technologies PPT Example
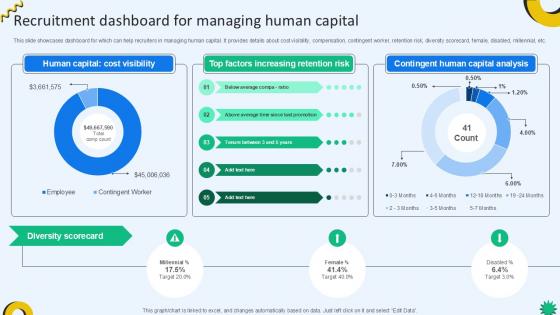
This slide showcases dashboard for which can help recruiters in managing human capital. It provides details about cost visibility, compensation, contingent worker, retention risk, diversity scorecard, female, disabled, millennial, etc. The Recruitment Dashboard For Managing Cloud Recruiting Technologies PPT Example is a compilation of the most recent design trends as a series of slides. It is suitable for any subject or industry presentation, containing attractive visuals and photo spots for businesses to clearly express their messages. This template contains a variety of slides for the user to input data, such as structures to contrast two elements, bullet points, and slides for written information. Slidegeeks is prepared to create an impression. This slide showcases dashboard for which can help recruiters in managing human capital. It provides details about cost visibility, compensation, contingent worker, retention risk, diversity scorecard, female, disabled, millennial, etc.
Recruitment Dashboard For Managing Human Capital PPT Example
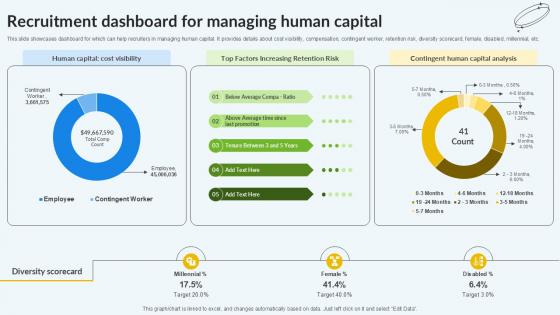
This slide showcases dashboard for which can help recruiters in managing human capital. It provides details about cost visibility, compensation, contingent worker, retention risk, diversity scorecard, female, disabled, millennial, etc. The Recruitment Dashboard For Managing Human Capital PPT Example is a compilation of the most recent design trends as a series of slides. It is suitable for any subject or industry presentation, containing attractive visuals and photo spots for businesses to clearly express their messages. This template contains a variety of slides for the user to input data, such as structures to contrast two elements, bullet points, and slides for written information. Slidegeeks is prepared to create an impression. This slide showcases dashboard for which can help recruiters in managing human capital. It provides details about cost visibility, compensation, contingent worker, retention risk, diversity scorecard, female, disabled, millennial, etc.
Implementing Strategies To Enhance KPI Dashboard To Assess Retail Sales Performance
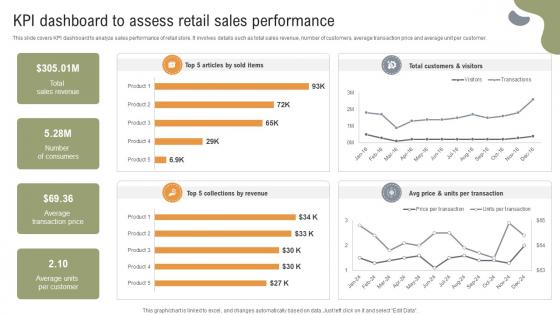
This slide covers KPI dashboard to analyze sales performance of retail store. It involves details such as total sales revenue, number of customers, average transaction price and average unit per customer. The Implementing Strategies To Enhance KPI Dashboard To Assess Retail Sales Performance is a compilation of the most recent design trends as a series of slides. It is suitable for any subject or industry presentation, containing attractive visuals and photo spots for businesses to clearly express their messages. This template contains a variety of slides for the user to input data, such as structures to contrast two elements, bullet points, and slides for written information. Slidegeeks is prepared to create an impression. This slide covers KPI dashboard to analyze sales performance of retail store. It involves details such as total sales revenue, number of customers, average transaction price and average unit per customer.
Activity Tracking Dashboard For Umbrella Brand Strategies For Achieving Summary Pdf
This slide provides information regarding activities tracking dashboard for umbrella brand in terms of customer retention, market share, etc. The Activity Tracking Dashboard For Umbrella Brand Strategies For Achieving Summary Pdf is a compilation of the most recent design trends as a series of slides. It is suitable for any subject or industry presentation, containing attractive visuals and photo spots for businesses to clearly express their messages. This template contains a variety of slides for the user to input data, such as structures to contrast two elements, bullet points, and slides for written information. Slidegeeks is prepared to create an impression. This slide provides information regarding activities tracking dashboard for umbrella brand in terms of customer retention, market share, etc.
Kpi Dashboard To Analyze Email Campaign Key Step To Implementation University Strategy SS V
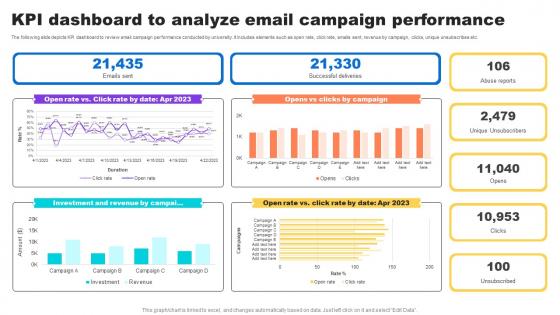
The following slide depicts KPI dashboard to review email campaign performance conducted by university. It includes elements such as open rate, click rate, emails sent, revenue by campaign, clicks, unique unsubscribes etc.The Kpi Dashboard To Analyze Email Campaign Key Step To Implementation University Strategy SS V is a compilation of the most recent design trends as a series of slides. It is suitable for any subject or industry presentation, containing attractive visuals and photo spots for businesses to clearly express their messages. This template contains a variety of slides for the user to input data, such as structures to contrast two elements, bullet points, and slides for written information. Slidegeeks is prepared to create an impression. The following slide depicts KPI dashboard to review email campaign performance conducted by university. It includes elements such as open rate, click rate, emails sent, revenue by campaign, clicks, unique unsubscribes etc.
KPI Dashboard To Analyze Email Campaign Higher Education Ppt Sample Strategy SS V
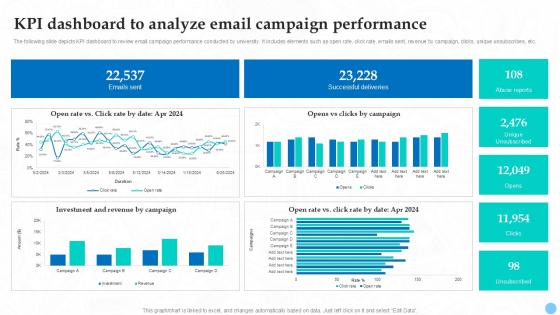
The following slide depicts KPI dashboard to review email campaign performance conducted by university. It includes elements such as open rate, click rate, emails sent, revenue by campaign, clicks, unique unsubscribes, etc. The KPI Dashboard To Analyze Email Campaign Higher Education Ppt Sample Strategy SS V is a compilation of the most recent design trends as a series of slides. It is suitable for any subject or industry presentation, containing attractive visuals and photo spots for businesses to clearly express their messages. This template contains a variety of slides for the user to input data, such as structures to contrast two elements, bullet points, and slides for written information. Slidegeeks is prepared to create an impression. The following slide depicts KPI dashboard to review email campaign performance conducted by university. It includes elements such as open rate, click rate, emails sent, revenue by campaign, clicks, unique unsubscribes, etc.
Online Marketing Ad Data Science Analytics Dashboard Ppt Inspiration Guidelines Pdf
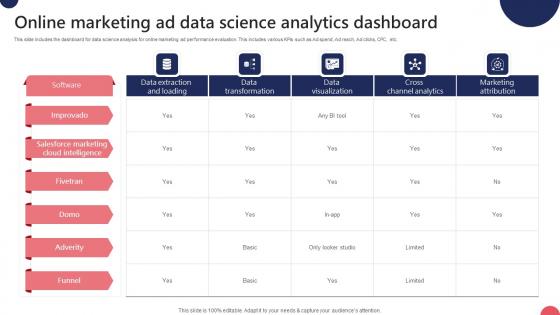
This slide includes the dashboard for data science analysis for online marketing ad performance evaluation. This includes various KPIs such as Ad spend, Ad reach, Ad clicks, CPC, etc. Pitch your topic with ease and precision using this Online Marketing Ad Data Science Analytics Dashboard Ppt Inspiration Guidelines Pdf. This layout presents information on Ad Spend, Cost Per Thousand, Cost Per Click. It is also available for immediate download and adjustment. So, changes can be made in the color, design, graphics or any other component to create a unique layout. This slide includes the dashboard for data science analysis for online marketing ad performance evaluation. This includes various KPIs such as Ad spend, Ad reach, Ad clicks, CPC, etc.
Kpis To Assess Competitor Digital Presence Ppt Examples Pdf
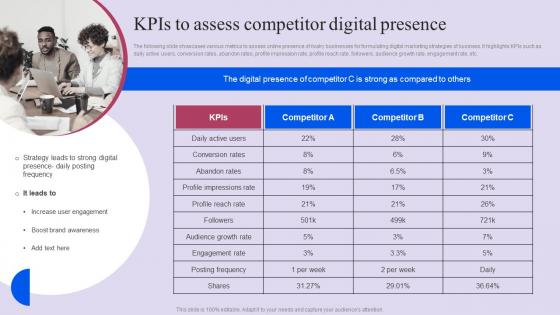
The following slide showcases various metrics to assess online presence of rivalry businesses for formulating digital marketing strategies of business. It highlights KPIs such as daily active users, conversion rates, abandon rates, profile impression rate, profile reach rate, followers, audience growth rate, engagement rate, etc. If you are looking for a format to display your unique thoughts, then the professionally designed Kpis To Assess Competitor Digital Presence Ppt Examples Pdf is the one for you. You can use it as a Google Slides template or a PowerPoint template. Incorporate impressive visuals, symbols, images, and other charts. Modify or reorganize the text boxes as you desire. Experiment with shade schemes and font pairings. Alter, share or cooperate with other people on your work. Download Kpis To Assess Competitor Digital Presence Ppt Examples Pdf and find out how to give a successful presentation. Present a perfect display to your team and make your presentation unforgettable. The following slide showcases various metrics to assess online presence of rivalry businesses for formulating digital marketing strategies of business. It highlights KPIs such as daily active users, conversion rates, abandon rates, profile impression rate, profile reach rate, followers, audience growth rate, engagement rate, etc.
KPIs To Assess Competitor Digital How To Conduct Competitive Assessment Summary Pdf
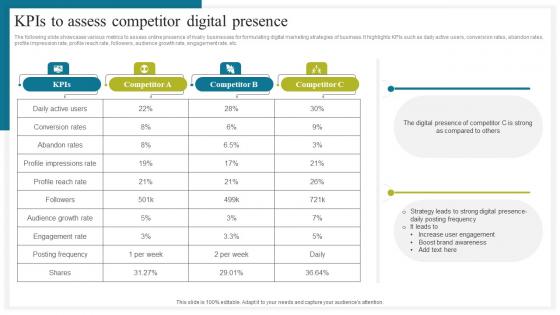
The following slide showcases various metrics to assess online presence of rivalry businesses for formulating digital marketing strategies of business. It highlights KPIs such as daily active users, conversion rates, abandon rates, profile impression rate, profile reach rate, followers, audience growth rate, engagement rate, etc. Boost your pitch with our creative KPIs To Assess Competitor Digital How To Conduct Competitive Assessment Summary Pdf. Deliver an awe inspiring pitch that will mesmerize everyone. Using these presentation templates you will surely catch everyones attention. You can browse the ppts collection on our website. We have researchers who are experts at creating the right content for the templates. So you do not have to invest time in any additional work. Just grab the template now and use them. The following slide showcases various metrics to assess online presence of rivalry businesses for formulating digital marketing strategies of business. It highlights KPIs such as daily active users, conversion rates, abandon rates, profile impression rate, profile reach rate, followers, audience growth rate, engagement rate, etc.
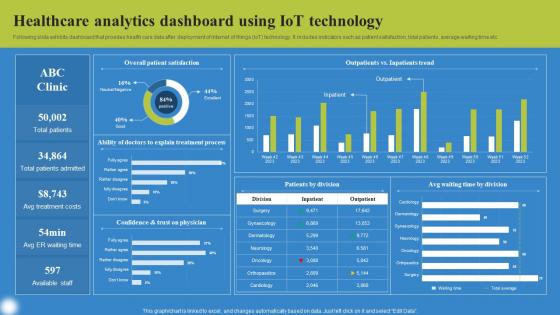
Healthcare Analytics Dashboard Using Deploying IoT Solutions For Enhanced Healthcare Background Pdf
Following slide exhibits dashboard that provides health care data after deployment of internet of things IoT technology. It includes indicators such as patient satisfaction, total patients, average waiting time etc. Do you know about Slidesgeeks Healthcare Analytics Dashboard Using Deploying IoT Solutions For Enhanced Healthcare Background Pdf These are perfect for delivering any kind od presentation. Using it, create PowerPoint presentations that communicate your ideas and engage audiences. Save time and effort by using our pre designed presentation templates that are perfect for a wide range of topic. Our vast selection of designs covers a range of styles, from creative to business, and are all highly customizable and easy to edit. Download as a PowerPoint template or use them as Google Slides themes. Following slide exhibits dashboard that provides health care data after deployment of internet of things IoT technology. It includes indicators such as patient satisfaction, total patients, average waiting time etc.
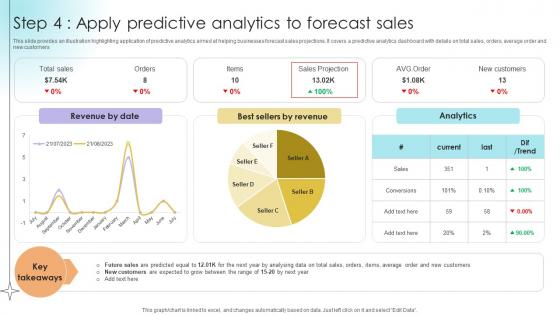
Step 4 Apply Predictive Analytics To Forecast Sales Data Analytics SS V
This slide provides an illustration highlighting application of predictive analytics aimed at helping businesses forecast sales projections. It covers a predictive analytics dashboard with details on total sales, orders, average order and new customers.Coming up with a presentation necessitates that the majority of the effort goes into the content and the message you intend to convey. The visuals of a PowerPoint presentation can only be effective if it supplements and supports the story that is being told. Keeping this in mind our experts created Step 4 Apply Predictive Analytics To Forecast Sales Data Analytics SS V to reduce the time that goes into designing the presentation. This way, you can concentrate on the message while our designers take care of providing you with the right template for the situation. This slide provides an illustration highlighting application of predictive analytics aimed at helping businesses forecast sales projections. It covers a predictive analytics dashboard with details on total sales, orders, average order and new customers.
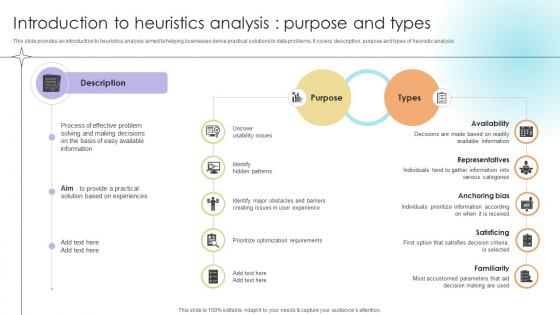
Introduction To Heuristics Analysis Purpose And Types Data Analytics SS V
This slide provides an introduction to heuristics analysis aimed ta helping businesses derive practical solutions to data problems. It covers description, purpose and types of heuristic analysis.There are so many reasons you need a Introduction To Heuristics Analysis Purpose And Types Data Analytics SS V. The first reason is you can not spend time making everything from scratch, Thus, Slidegeeks has made presentation templates for you too. You can easily download these templates from our website easily. This slide provides an introduction to heuristics analysis aimed ta helping businesses derive practical solutions to data problems. It covers description, purpose and types of heuristic analysis.

Types Of Attribution Analysis Models Product Analytics Implementation Data Analytics V
This slide outlines major types of attribution analysis methods aimed at helping businesses improve marketing ROI. It covers various types such as first touch, last touch, linear, time decay, custom and U shaped attribution The Types Of Attribution Analysis Models Product Analytics Implementation Data Analytics V is a compilation of the most recent design trends as a series of slides. It is suitable for any subject or industry presentation, containing attractive visuals and photo spots for businesses to clearly express their messages. This template contains a variety of slides for the user to input data, such as structures to contrast two elements, bullet points, and slides for written information. Slidegeeks is prepared to create an impression. This slide outlines major types of attribution analysis methods aimed at helping businesses improve marketing ROI. It covers various types such as first touch, last touch, linear, time decay, custom and U shaped attribution
Zero Trust Network Access Performance Tracking Dashboard Software Defined Perimeter SDP
This slide represents the performance tracking dashboard for zero trust network access. The purpose of this slide is to showcase the level of request modes, connected users, daily usage of the network, security rating, device risk and threat flow. The Zero Trust Network Access Performance Tracking Dashboard Software Defined Perimeter SDP is a compilation of the most recent design trends as a series of slides. It is suitable for any subject or industry presentation, containing attractive visuals and photo spots for businesses to clearly express their messages. This template contains a variety of slides for the user to input data, such as structures to contrast two elements, bullet points, and slides for written information. Slidegeeks is prepared to create an impression. This slide represents the performance tracking dashboard for zero trust network access. The purpose of this slide is to showcase the level of request modes, connected users, daily usage of the network, security rating, device risk and threat flow.
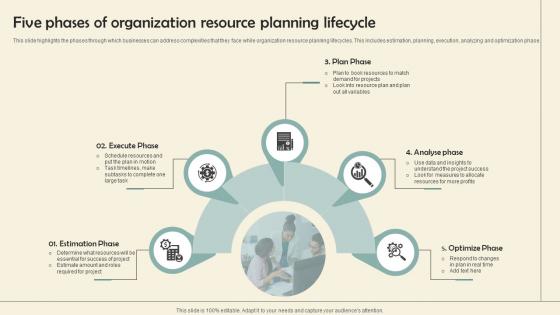
Five Phases Of Organization Resource Planning Lifecycle Pictures Pdf
This slide highlights the phases through which businesses can address complexities that they face while organization resource planning lifecycles. This includes estimation, planning, execution, analyzing and optimization phase.Pitch your topic with ease and precision using this Five Phases Of Organization Resource Planning Lifecycle Pictures Pdf This layout presents information on Estimation Phase, Execute Phase, Analyse Phase It is also available for immediate download and adjustment. So, changes can be made in the color, design, graphics or any other component to create a unique layout. This slide highlights the phases through which businesses can address complexities that they face while organization resource planning lifecycles. This includes estimation, planning, execution, analyzing and optimization phase.

Graph Illustrating Impact Of Prescriptive Analytics Data Analytics SS V
This slide showcases graph highlighting impact analysis of prescriptive analytics on businesses via use of major performance indicators. It provides information total revenue, inventory levels and labour costs with key insights.Take your projects to the next level with our ultimate collection of Graph Illustrating Impact Of Prescriptive Analytics Data Analytics SS V. Slidegeeks has designed a range of layouts that are perfect for representing task or activity duration, keeping track of all your deadlines at a glance. Tailor these designs to your exact needs and give them a truly corporate look with your own brand colors they will make your projects stand out from the rest This slide showcases graph highlighting impact analysis of prescriptive analytics on businesses via use of major performance indicators. It provides information total revenue, inventory levels and labour costs with key insights.

Global Data Security Industry Report Strategies And Recommendations For Cybersecurity Industry IR SS V
The purpose of the slide is to provide valuable recommendations and effective strategies for cybersecurity industry players to succeed in a dynamic and competitive market. It covers strategies such as. The Global Data Security Industry Report Strategies And Recommendations For Cybersecurity Industry IR SS V is a compilation of the most recent design trends as a series of slides. It is suitable for any subject or industry presentation, containing attractive visuals and photo spots for businesses to clearly express their messages. This template contains a variety of slides for the user to input data, such as structures to contrast two elements, bullet points, and slides for written information. Slidegeeks is prepared to create an impression. The purpose of the slide is to provide valuable recommendations and effective strategies for cybersecurity industry players to succeed in a dynamic and competitive market. It covers strategies such as.
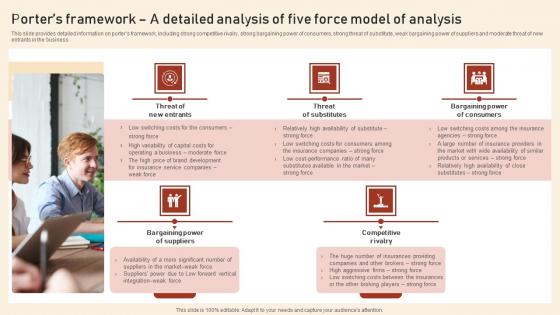
Porters Framework A Detailed Analysis Of Five Force Model Of Analysis Assurant Insurance Agency Introduction Pdf
This slide provides detailed information on porters framework, including strong competitive rivalry, strong bargaining power of consumers, strong threat of substitute, weak bargaining power of suppliers and moderate threat of new entrants in the business. The Porters Framework A Detailed Analysis Of Five Force Model Of Analysis Assurant Insurance Agency Introduction Pdf is a compilation of the most recent design trends as a series of slides. It is suitable for any subject or industry presentation, containing attractive visuals and photo spots for businesses to clearly express their messages. This template contains a variety of slides for the user to input data, such as structures to contrast two elements, bullet points, and slides for written information. Slidegeeks is prepared to create an impression. This slide provides detailed information on porters framework, including strong competitive rivalry, strong bargaining power of consumers, strong threat of substitute, weak bargaining power of suppliers and moderate threat of new entrants in the business.
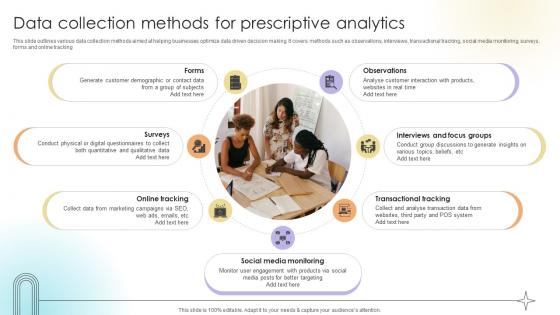
Data Collection Methods For Prescriptive Analytics Data Analytics SS V
This slide outlines various data collection methods aimed at helping businesses optimize data driven decision making. It covers methods such as observations, interviews, transactional tracking, social media monitoring, surveys, forms and online tracking.Slidegeeks has constructed Data Collection Methods For Prescriptive Analytics Data Analytics SS V after conducting extensive research and examination. These presentation templates are constantly being generated and modified based on user preferences and critiques from editors. Here, you will find the most attractive templates for a range of purposes while taking into account ratings and remarks from users regarding the content. This is an excellent jumping-off point to explore our content and will give new users an insight into our top-notch PowerPoint Templates. This slide outlines various data collection methods aimed at helping businesses optimize data driven decision making. It covers methods such as observations, interviews, transactional tracking, social media monitoring, surveys, forms and online tracking.

View Of Vibrant Rose Flowers PowerPoint Templates Ppt Backgrounds For Slides 1212
We present our View Of Vibrant Rose Flowers PowerPoint Templates PPT Backgrounds For Slides 1212.Present our Holidays PowerPoint Templates because you have the moves to sway the market. Download and present our Festival PowerPoint Templates because the ideas and plans are on your finger tips. Use our Nature PowerPoint Templates because this business powerpoint template helps expound on the logic of your detailed thought process to take your company forward. Use our Shapes PowerPoint Templates because You have found the one missing link in the picture. That one strand that will bring together the entire edifice. Put it out there for all to see. Emphasise the value of its contribution in propelling the venture forward. Use our Beauty PowerPoint Templates because this layout helps you to impress upon the audience how your strategy will carry all to the top of the corporate heap.Use these PowerPoint slides for presentations relating to Vibrant flower bouquet, beauty, holidays, festival, nature, shapes. The prominent colors used in the PowerPoint template are Purple, Pink, Green. You can be sure our View Of Vibrant Rose Flowers PowerPoint Templates PPT Backgrounds For Slides 1212 are Functional. You can be sure our holidays PowerPoint templates and PPT Slides are Versatile. The feedback we get is that our View Of Vibrant Rose Flowers PowerPoint Templates PPT Backgrounds For Slides 1212 are Fancy. People tell us our beauty PowerPoint templates and PPT Slides are Striking. Customers tell us our View Of Vibrant Rose Flowers PowerPoint Templates PPT Backgrounds For Slides 1212 are Upbeat. Customers tell us our holidays PowerPoint templates and PPT Slides are Majestic. Even out the odds with our View Of Vibrant Rose Flowers PowerPoint Templates Ppt Backgrounds For Slides 1212. Make a fair assessment of the probabilities.
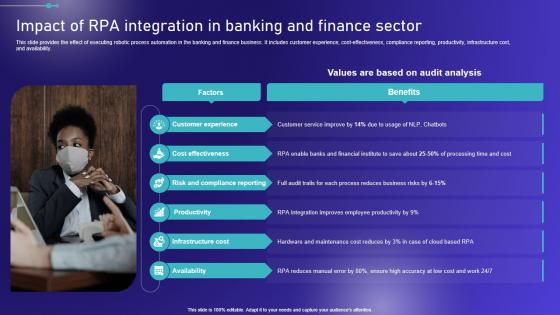
Impact Of Integration In Banking And Finance Embracing Robotic Process Themes PDF
This slide provides the effect of executing robotic process automation in the banking and finance business. It includes customer experience, cost-effectiveness, compliance reporting, productivity, infrastructure cost, and availability. The Impact Of Integration In Banking And Finance Embracing Robotic Process Themes PDF is a compilation of the most recent design trends as a series of slides. It is suitable for any subject or industry presentation, containing attractive visuals and photo spots for businesses to clearly express their messages. This template contains a variety of slides for the user to input data, such as structures to contrast two elements, bullet points, and slides for written information. Slidegeeks is prepared to create an impression. This slide provides the effect of executing robotic process automation in the banking and finance business. It includes customer experience, cost-effectiveness, compliance reporting, productivity, infrastructure cost, and availability.
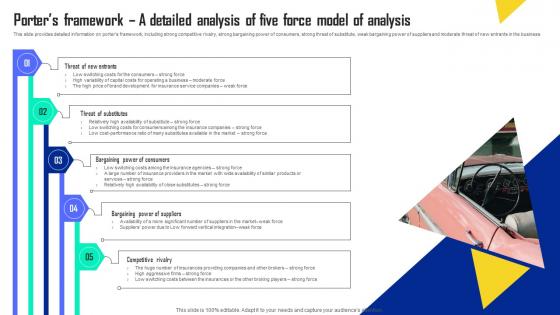
Porters Framework A Detailed Analysis Of Five Force Model Automobile Insurance Agency Rules Pdf
This slide provides detailed information on porters framework, including strong competitive rivalry, strong bargaining power of consumers, strong threat of substitute, weak bargaining power of suppliers and moderate threat of new entrants in the business. The Porters Framework A Detailed Analysis Of Five Force Model Automobile Insurance Agency Rules Pdf is a compilation of the most recent design trends as a series of slides. It is suitable for any subject or industry presentation, containing attractive visuals and photo spots for businesses to clearly express their messages. This template contains a variety of slides for the user to input data, such as structures to contrast two elements, bullet points, and slides for written information. Slidegeeks is prepared to create an impression. This slide provides detailed information on porters framework, including strong competitive rivalry, strong bargaining power of consumers, strong threat of substitute, weak bargaining power of suppliers and moderate threat of new entrants in the business.

Advantages Of Leveraging Heuristics Analytics Data Analytics SS V
This slide outlines key advantages of leveraging heuristic analysis aimed at helping businesses improve decision making. It covers the benefits such as faster decisions, decisions with limited information and identification of errors Find a pre-designed and impeccable Advantages Of Leveraging Heuristics Analytics Data Analytics SS V. The templates can ace your presentation without additional effort. You can download these easy-to-edit presentation templates to make your presentation stand out from others. So, what are you waiting for Download the template from Slidegeeks today and give a unique touch to your presentation. This slide outlines key advantages of leveraging heuristic analysis aimed at helping businesses improve decision making. It covers the benefits such as faster decisions, decisions with limited information and identification of errors
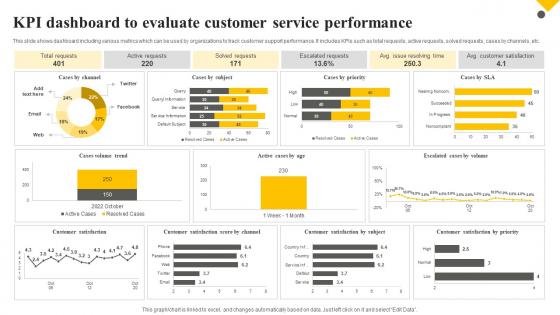
Client Support Plan To Increase Customer Kpi Dashboard To Evaluate Customer Service Performance Strategy SS V
This slide shows dashboard including various metrics which can be used by organizations to track customer support performance. It includes KPIs such as total requests, active requests, solved requests, cases by channels, etc. Find highly impressive Client Support Plan To Increase Customer Kpi Dashboard To Evaluate Customer Service Performance Strategy SS V on Slidegeeks to deliver a meaningful presentation. You can save an ample amount of time using these presentation templates. No need to worry to prepare everything from scratch because Slidegeeks experts have already done a huge research and work for you. You need to download Client Support Plan To Increase Customer Kpi Dashboard To Evaluate Customer Service Performance Strategy SS V for your upcoming presentation. All the presentation templates are 100 percent editable and you can change the color and personalize the content accordingly. Download now This slide shows dashboard including various metrics which can be used by organizations to track customer support performance. It includes KPIs such as total requests, active requests, solved requests, cases by channels, etc.
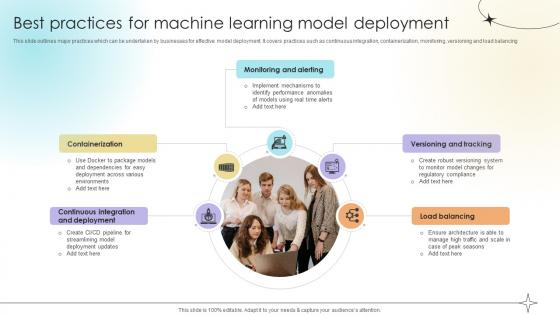
Best Practices For Machine Learning Model Deployment Data Analytics SS V
This slide outlines major practices which can be undertaken by businesses for effective model deployment. It covers practices such as continuous integration, containerization, monitoring, versioning and load balancing.This Best Practices For Machine Learning Model Deployment Data Analytics SS V is perfect for any presentation, be it in front of clients or colleagues. It is a versatile and stylish solution for organizing your meetings. The Best Practices For Machine Learning Model Deployment Data Analytics SS V features a modern design for your presentation meetings. The adjustable and customizable slides provide unlimited possibilities for acing up your presentation. Slidegeeks has done all the homework before launching the product for you. So, do not wait, grab the presentation templates today This slide outlines major practices which can be undertaken by businesses for effective model deployment. It covers practices such as continuous integration, containerization, monitoring, versioning and load balancing.

Micosoft Intensive Growth Mergers And Acquisition Strategy Of Microsoft Corporations Strategy SS V
This slide shows how microsoft used mergers and acquisition to stay ahead and generate huge in the business. It includes information about key acquisitions by microsoft over the past years. The Micosoft Intensive Growth Mergers And Acquisition Strategy Of Microsoft Corporations Strategy SS V is a compilation of the most recent design trends as a series of slides. It is suitable for any subject or industry presentation, containing attractive visuals and photo spots for businesses to clearly express their messages. This template contains a variety of slides for the user to input data, such as structures to contrast two elements, bullet points, and slides for written information. Slidegeeks is prepared to create an impression. This slide shows how microsoft used mergers and acquisition to stay ahead and generate huge in the business. It includes information about key acquisitions by microsoft over the past years.
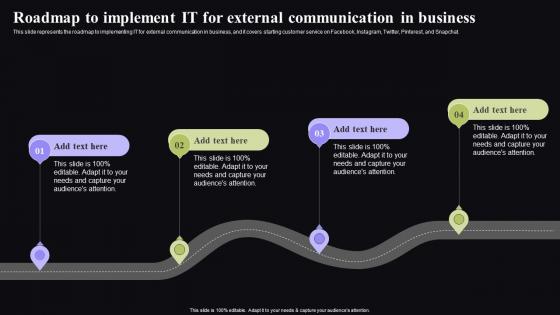
Roadmap To Implement It For External Video Conferencing In Corporate Pictures Pdf
This slide represents the roadmap to implementing IT for external communication in business, and it covers starting customer service on Facebook, Instagram, Twitter, Pinterest, and Snapchat. The Roadmap To Implement It For External Video Conferencing In Corporate Pictures Pdf is a compilation of the most recent design trends as a series of slides. It is suitable for any subject or industry presentation, containing attractive visuals and photo spots for businesses to clearly express their messages. This template contains a variety of slides for the user to input data, such as structures to contrast two elements, bullet points, and slides for written information. Slidegeeks is prepared to create an impression. This slide represents the roadmap to implementing IT for external communication in business, and it covers starting customer service on Facebook, Instagram, Twitter, Pinterest, and Snapchat.
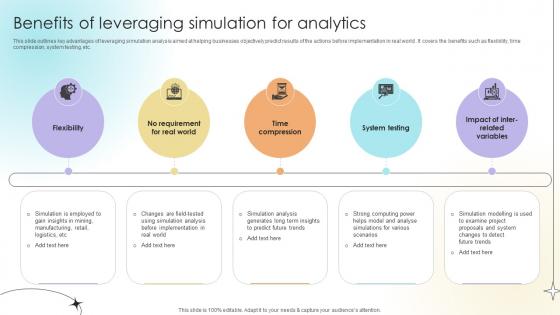
Benefits Of Leveraging Simulation For Analytics Data Analytics SS V
This slide outlines key advantages of leveraging simulation analysis aimed at helping businesses objectively predict results of the actions before implementation in real world . It covers the benefits such as flexibility, time compression, system testing, etc. This modern and well-arranged Benefits Of Leveraging Simulation For Analytics Data Analytics SS V provides lots of creative possibilities. It is very simple to customize and edit with the Powerpoint Software. Just drag and drop your pictures into the shapes. All facets of this template can be edited with Powerpoint, no extra software is necessary. Add your own material, put your images in the places assigned for them, adjust the colors, and then you can show your slides to the world, with an animated slide included. This slide outlines key advantages of leveraging simulation analysis aimed at helping businesses objectively predict results of the actions before implementation in real world . It covers the benefits such as flexibility, time compression, system testing, etc.
Google Ads Categories Dashboard To Track Top Google Ads Campaign Performances MKT SS V
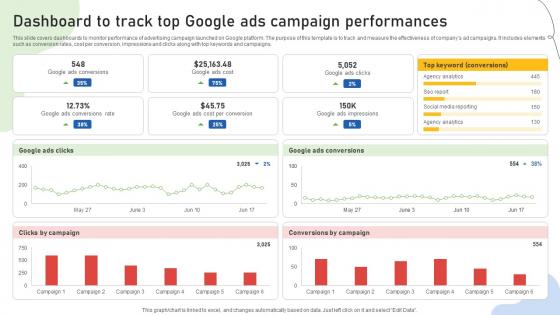
This slide covers dashboards to monitor performance of advertising campaign launched on Google platform. The purpose of this template is to track and measure the effectiveness of companys ad campaigns. It includes elements such as conversion rates, cost per conversion, impressions and clicks along with top keywords and campaigns. The Google Ads Categories Dashboard To Track Top Google Ads Campaign Performances MKT SS V is a compilation of the most recent design trends as a series of slides. It is suitable for any subject or industry presentation, containing attractive visuals and photo spots for businesses to clearly express their messages. This template contains a variety of slides for the user to input data, such as structures to contrast two elements, bullet points, and slides for written information. Slidegeeks is prepared to create an impression. This slide covers dashboards to monitor performance of advertising campaign launched on Google platform. The purpose of this template is to track and measure the effectiveness of companys ad campaigns. It includes elements such as conversion rates, cost per conversion, impressions and clicks along with top keywords and campaigns.
Major Steps To Create Decision Tree Data Analytics SS V
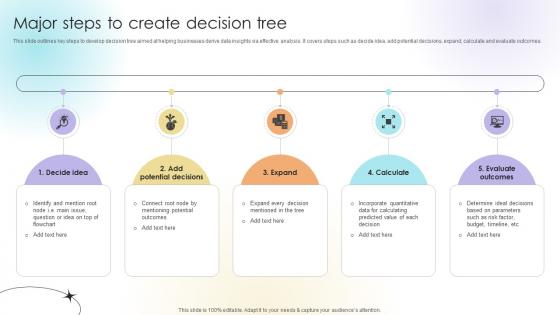
This slide outlines key steps to develop decision tree aimed at helping businesses derive data insights via effective analysis. It covers steps such as decide idea, add potential decisions, expand, calculate and evaluate outcomes. Crafting an eye-catching presentation has never been more straightforward. Let your presentation shine with this tasteful yet straightforward Major Steps To Create Decision Tree Data Analytics SS V template. It offers a minimalistic and classy look that is great for making a statement. The colors have been employed intelligently to add a bit of playfulness while still remaining professional. Construct the ideal Major Steps To Create Decision Tree Data Analytics SS V that effortlessly grabs the attention of your audience Begin now and be certain to wow your customers This slide outlines key steps to develop decision tree aimed at helping businesses derive data insights via effective analysis. It covers steps such as decide idea, add potential decisions, expand, calculate and evaluate outcomes.
Merger And Acquisitions Deals Multinational Organization Customer Goods Topics Pdf
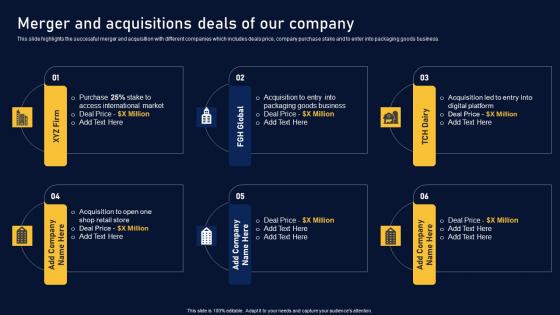
This slide highlights the successful merger and acquisition with different companies which includes deals price, company purchase stake and to enter into packaging goods business. The Merger And Acquisitions Deals Multinational Organization Customer Goods Topics Pdf is a compilation of the most recent design trends as a series of slides. It is suitable for any subject or industry presentation, containing attractive visuals and photo spots for businesses to clearly express their messages. This template contains a variety of slides for the user to input data, such as structures to contrast two elements, bullet points, and slides for written information. Slidegeeks is prepared to create an impression. This slide highlights the successful merger and acquisition with different companies which includes deals price, company purchase stake and to enter into packaging goods business.
Client Acquisition Strategic Plan Dashboard With Metrics Clipart Pdf
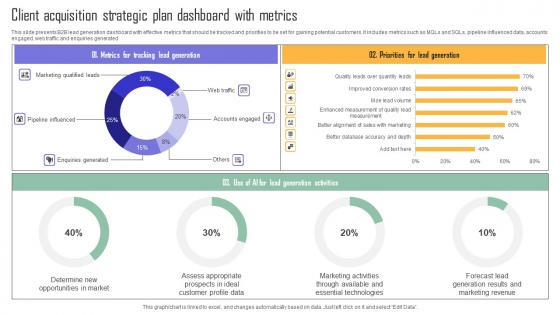
This slide presents B2B lead generation dashboard with effective metrics that should be tracked and priorities to be set for gaining potential customers. It includes metrics such as MQLs and SQLs, pipeline influenced data, accounts engaged, web traffic and enquiries generated. Pitch your topic with ease and precision using this Client Acquisition Strategic Plan Dashboard With Metrics Clipart Pdf. This layout presents information on Priorities For Lead Generation, Tracking Lead Generation. It is also available for immediate download and adjustment. So, changes can be made in the color, design, graphics or any other component to create a unique layout. This slide presents B2B lead generation dashboard with effective metrics that should be tracked and priorities to be set for gaining potential customers. It includes metrics such as MQLs and SQLs, pipeline influenced data, accounts engaged, web traffic and enquiries generated.
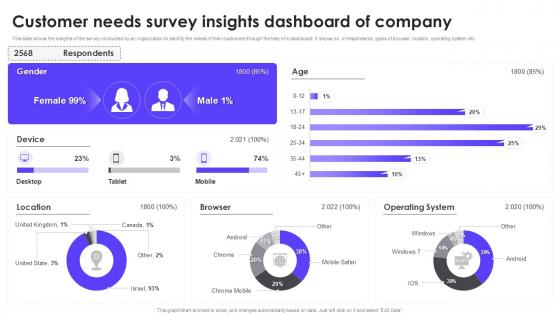
Customer Needs Survey Insights Dashboard Of Company
This Customer Needs Survey Insights Dashboard Of Company is perfect for any presentation, be it in front of clients or colleagues. It is a versatile and stylish solution for organizing your meetings. The Customer Needs Survey Insights Dashboard Of Company features a modern design for your presentation meetings. The adjustable and customizable slides provide unlimited possibilities for acing up your presentation. Slidegeeks has done all the homework before launching the product for you. So, do not wait, grab the presentation templates today This slide showcases insights from survey conducted by the organization to understand customer needs. The dashboard showcases key data, including the number of respondents, browser types, location, operating system, and other valuable factors to guide customer-focused decisions.
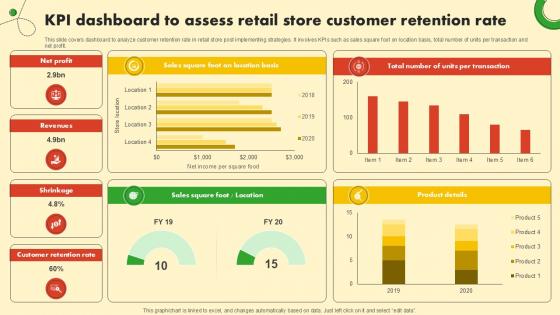
KPI Dashboard To Assess Retail Store Food And Grocery Retail Ppt Presentation
This slide covers dashboard to analyze customer retention rate in retail store post implementing strategies. It involves KPIs such as sales square foot on location basis, total number of units per transaction and net profit. Present like a pro with KPI Dashboard To Assess Retail Store Food And Grocery Retail Ppt Presentation. Create beautiful presentations together with your team, using our easy-to-use presentation slides. Share your ideas in real-time and make changes on the fly by downloading our templates. So whether you are in the office, on the go, or in a remote location, you can stay in sync with your team and present your ideas with confidence. With Slidegeeks presentation got a whole lot easier. Grab these presentations today. This slide covers dashboard to analyze customer retention rate in retail store post implementing strategies. It involves KPIs such as sales square foot on location basis, total number of units per transaction and net profit.
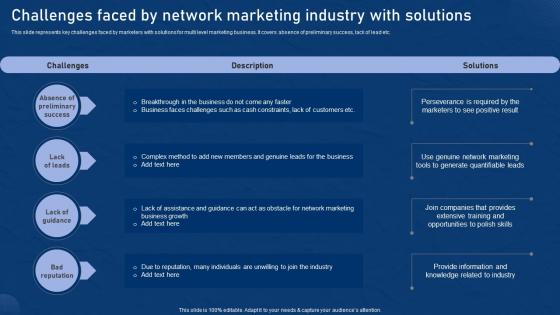
Challenges Faced By Network Marketing Effective Network Marketing Promotion Tactics Rules Pdf
This slide represents key challenges faced by marketers with solutions for multi level marketing business. It covers absence of preliminary success, lack of lead etc. The Challenges Faced By Network Marketing Effective Network Marketing Promotion Tactics Rules Pdf is a compilation of the most recent design trends as a series of slides. It is suitable for any subject or industry presentation, containing attractive visuals and photo spots for businesses to clearly express their messages. This template contains a variety of slides for the user to input data, such as structures to contrast two elements, bullet points, and slides for written information. Slidegeeks is prepared to create an impression. This slide represents key challenges faced by marketers with solutions for multi level marketing business. It covers absence of preliminary success, lack of lead etc.
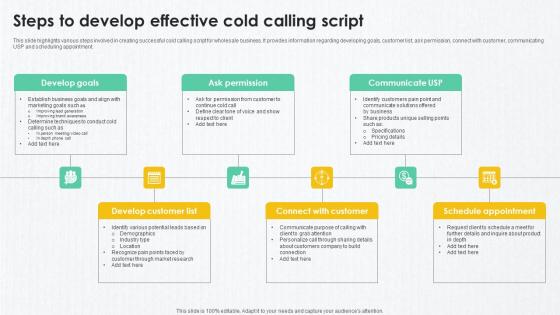
B2B Marketing Techniques Steps To Develop Effective Cold Calling Script
This slide highlights various steps involved in creating successful cold calling script for wholesale business. It provides information regarding developing goals, customer list, ask permission, connect with customer, communicating USP and scheduling appointment. The B2B Marketing Techniques Steps To Develop Effective Cold Calling Script is a compilation of the most recent design trends as a series of slides. It is suitable for any subject or industry presentation, containing attractive visuals and photo spots for businesses to clearly express their messages. This template contains a variety of slides for the user to input data, such as structures to contrast two elements, bullet points, and slides for written information. Slidegeeks is prepared to create an impression. This slide highlights various steps involved in creating successful cold calling script for wholesale business. It provides information regarding developing goals, customer list, ask permission, connect with customer, communicating USP and scheduling appointment.

Quarterly Timeline For Managing SMEs Transformation DT SS V
This slide represents a timeline that help enable a seamless digital transformation of small and medium sized enterprise business. It includes three stages such as transformed operations, processes, and employees.The Quarterly Timeline For Managing SMEs Transformation DT SS V is a compilation of the most recent design trends as a series of slides. It is suitable for any subject or industry presentation, containing attractive visuals and photo spots for businesses to clearly express their messages. This template contains a variety of slides for the user to input data, such as structures to contrast two elements, bullet points, and slides for written information. Slidegeeks is prepared to create an impression. This slide represents a timeline that help enable a seamless digital transformation of small and medium sized enterprise business. It includes three stages such as transformed operations, processes, and employees.
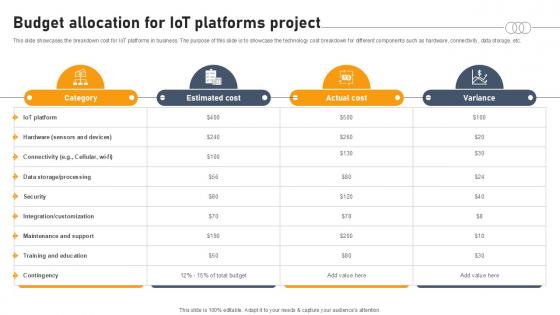
Budget Allocation For Iot Platforms Project Aws IOT Platform Ppt Template
This slide showcases the breakdown cost for IoT platforms in business. The purpose of this slide is to showcase the technology cost breakdown for different components such as hardware, connectivity, data storage, etc. The Budget Allocation For Iot Platforms Project Aws IOT Platform Ppt Template is a compilation of the most recent design trends as a series of slides. It is suitable for any subject or industry presentation, containing attractive visuals and photo spots for businesses to clearly express their messages. This template contains a variety of slides for the user to input data, such as structures to contrast two elements, bullet points, and slides for written information. Slidegeeks is prepared to create an impression. This slide showcases the breakdown cost for IoT platforms in business. The purpose of this slide is to showcase the technology cost breakdown for different components such as hardware, connectivity, data storage, etc.

Key Evaluation Metrics Ppt Slides
This is a key evaluation metrics ppt slides. This is a five stage process. The stages in this process are business, finance, marketing, symbol.
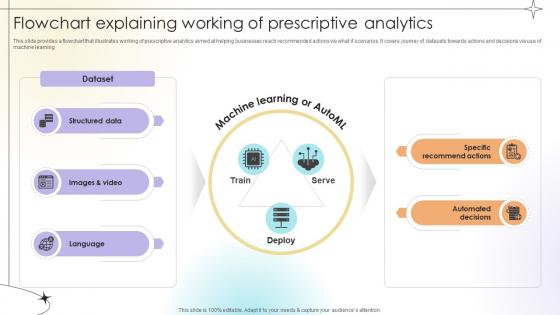
Flowchart Explaining Working Of Prescriptive Analytics Data Analytics SS V
This slide provides a flowchart that illustrates working of prescriptive analytics aimed at helping businesses reach recommended actions via what if scenarios. It covers journey of datasets towards actions and decisions via use of machine learning.This Flowchart Explaining Working Of Prescriptive Analytics Data Analytics SS V from Slidegeeks makes it easy to present information on your topic with precision. It provides customization options, so you can make changes to the colors, design, graphics, or any other component to create a unique layout. It is also available for immediate download, so you can begin using it right away. Slidegeeks has done good research to ensure that you have everything you need to make your presentation stand out. Make a name out there for a brilliant performance. This slide provides a flowchart that illustrates working of prescriptive analytics aimed at helping businesses reach recommended actions via what if scenarios. It covers journey of datasets towards actions and decisions via use of machine learning.
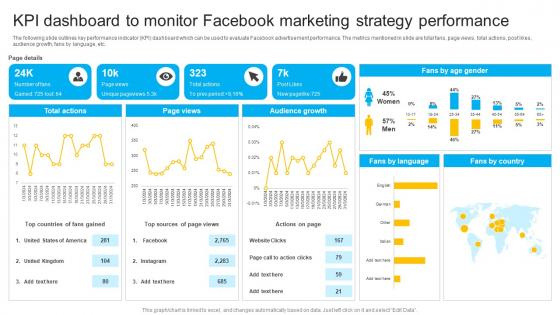
How To Create Cost Effective KPI Dashboard To Monitor Facebook Marketing Strategy SS V
The following slide outlines key performance indicator KPI dashboard which can be used to evaluate Facebook advertisement performance. The metrics mentioned in slide are total fans, page views, total actions, post likes, audience growth, fans by language, etc. Do you know about Slidesgeeks How To Create Cost Effective KPI Dashboard To Monitor Facebook Marketing Strategy SS V These are perfect for delivering any kind od presentation. Using it, create PowerPoint presentations that communicate your ideas and engage audiences. Save time and effort by using our pre-designed presentation templates that are perfect for a wide range of topic. Our vast selection of designs covers a range of styles, from creative to business, and are all highly customizable and easy to edit. Download as a PowerPoint template or use them as Google Slides themes. The following slide outlines key performance indicator KPI dashboard which can be used to evaluate Facebook advertisement performance. The metrics mentioned in slide are total fans, page views, total actions, post likes, audience growth, fans by language, etc.
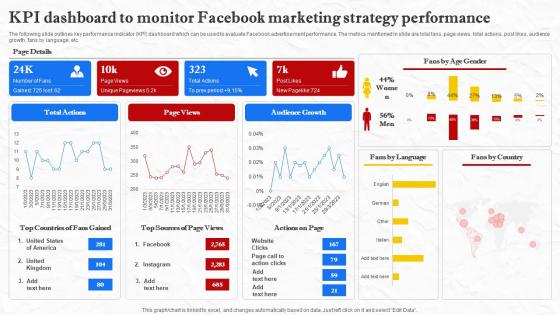
Facebook Marketing Techniques KPI Dashboard To Monitor Facebook Marketing Strategy SS V
The following slide outlines key performance indicator KPI dashboard which can be used to evaluate Facebook advertisement performance. The metrics mentioned in slide are total fans, page views, total actions, post likes, audience growth, fans by language, etc. Do you know about Slidesgeeks Facebook Marketing Techniques KPI Dashboard To Monitor Facebook Marketing Strategy SS V These are perfect for delivering any kind od presentation. Using it, create PowerPoint presentations that communicate your ideas and engage audiences. Save time and effort by using our pre-designed presentation templates that are perfect for a wide range of topic. Our vast selection of designs covers a range of styles, from creative to business, and are all highly customizable and easy to edit. Download as a PowerPoint template or use them as Google Slides themes. The following slide outlines key performance indicator KPI dashboard which can be used to evaluate Facebook advertisement performance. The metrics mentioned in slide are total fans, page views, total actions, post likes, audience growth, fans by language, etc.

Advantages Of Implementing MLOps Exploring Machine Learning Operations Diagrams Pdf
This slide shows the significant advantages that businesses can achieve by implementing MLOps practices. By leveraging MLOps, businesses can streamline their ML workflow and automate repetitive tasks and much more. This modern and well arranged Advantages Of Implementing MLOps Exploring Machine Learning Operations Diagrams Pdf provides lots of creative possibilities. It is very simple to customize and edit with the Powerpoint Software. Just drag and drop your pictures into the shapes. All facets of this template can be edited with Powerpoint, no extra software is necessary. Add your own material, put your images in the places assigned for them, adjust the colors, and then you can show your slides to the world, with an animated slide included. This slide shows the significant advantages that businesses can achieve by implementing MLOps practices. By leveraging MLOps, businesses can streamline their ML workflow and automate repetitive tasks and much more.
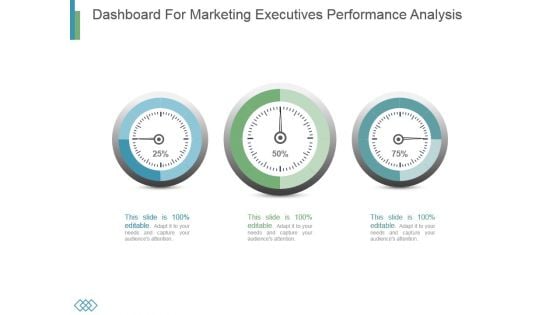
Dashboard For Marketing Executives Performance Analysis
This is a dashboard for marketing executives performance analysis. This is a three stage process. The stages in this process are business, marketing, dashboard, analysis, finance.
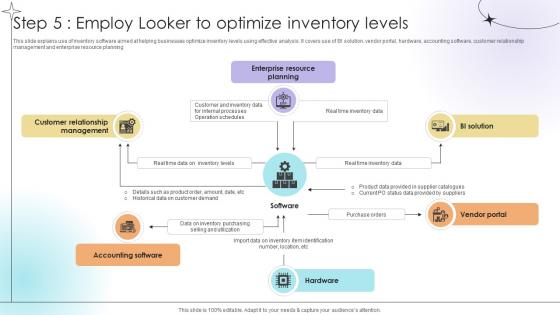
Step 5 Employ Looker To Optimize Inventory Levels Data Analytics SS V
This slide explains use of inventory software aimed at helping businesses optimize inventory levels using effective analysis. It covers use of BI solution, vendor portal, hardware, accounting software, customer relationship management and enterprise resource planning.This modern and well-arranged Step 5 Employ Looker To Optimize Inventory Levels Data Analytics SS V provides lots of creative possibilities. It is very simple to customize and edit with the Powerpoint Software. Just drag and drop your pictures into the shapes. All facets of this template can be edited with Powerpoint, no extra software is necessary. Add your own material, put your images in the places assigned for them, adjust the colors, and then you can show your slides to the world, with an animated slide included. This slide explains use of inventory software aimed at helping businesses optimize inventory levels using effective analysis. It covers use of BI solution, vendor portal, hardware, accounting software, customer relationship management and enterprise resource planning.
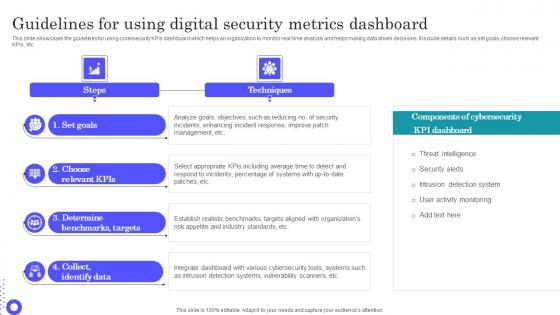
Guidelines For Using Digital Security Metrics Dashboard Introduction Pdf
Pitch your topic with ease and precision using this Guidelines For Using Digital Security Metrics Dashboard Introduction Pdf This layout presents information on Benchmarks Targets, Integrate Dashboard, Incidents Enhancing It is also available for immediate download and adjustment. So, changes can be made in the color, design, graphics or any other component to create a unique layout. This slide showcases the guidelines for using cybersecurity KPIs dashboard which helps an organization to monitor real time analysis and helps making data driven decisions. It include details such as set goals, choose relevant KPIs, etc.
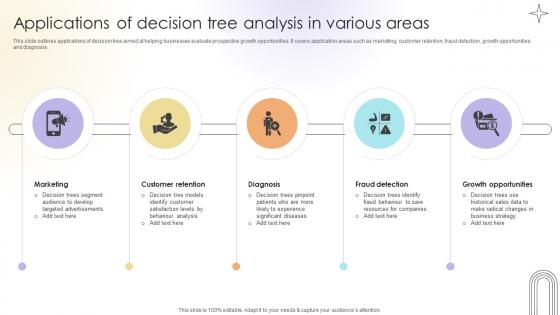
Applications Of Decision Tree Analysis In Various Areas Data Analytics SS V
This slide outlines applications of decision tree aimed at helping businesses evaluate prospective growth opportunities. It covers application areas such as marketing, customer retention, fraud detection, growth opportunities and diagnosis.Get a simple yet stunning designed Applications Of Decision Tree Analysis In Various Areas Data Analytics SS V. It is the best one to establish the tone in your meetings. It is an excellent way to make your presentations highly effective. So, download this PPT today from Slidegeeks and see the positive impacts. Our easy-to-edit Applications Of Decision Tree Analysis In Various Areas Data Analytics SS V can be your go-to option for all upcoming conferences and meetings. So, what are you waiting for Grab this template today. This slide outlines applications of decision tree aimed at helping businesses evaluate prospective growth opportunities. It covers application areas such as marketing, customer retention, fraud detection, growth opportunities and diagnosis.
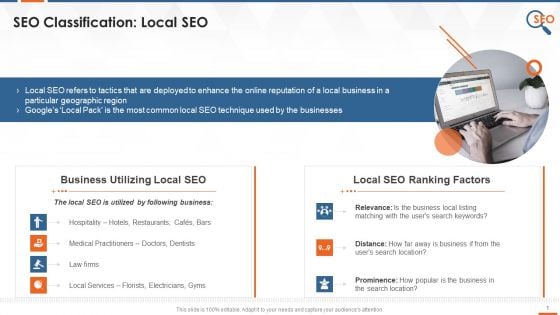
Local SEO And Improvement In Local Ranking Training Ppt
The purpose of the following slide is to provide an introduction to local SEO. It also includes details of multiple businesses that utilize it, such as hospitality, law firms, florists, etc. Further, it also covers information about local SEO ranking factors such as relevance, distance, and prominence.

Education Institute Multilingual SEO Approach Training Ppt
This slide covers multilingual SEO technique for international student recruitment in education industry. It also depicts that translating from original website is good but search engine will give extra rewards if businesses will generate fresh, unique content for the second language page.
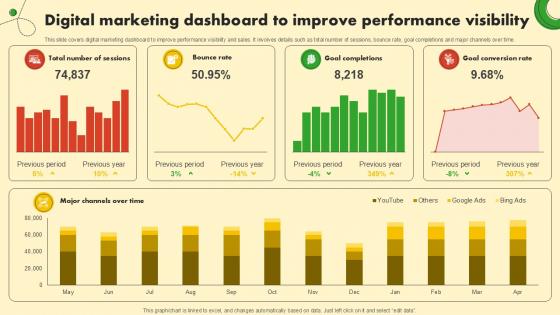
Digital Marketing Dashboard To Food And Grocery Retail Ppt Slide
This slide covers digital marketing dashboard to improve performance visibility and sales. It involves details such as total number of sessions, bounce rate, goal completions and major channels over time. Do you have an important presentation coming up Are you looking for something that will make your presentation stand out from the rest Look no further than Digital Marketing Dashboard To Food And Grocery Retail Ppt Slide. With our professional designs, you can trust that your presentation will pop and make delivering it a smooth process. And with Slidegeeks, you can trust that your presentation will be unique and memorable. So why wait Grab Digital Marketing Dashboard To Food And Grocery Retail Ppt Slide today and make your presentation stand out from the rest This slide covers digital marketing dashboard to improve performance visibility and sales. It involves details such as total number of sessions, bounce rate, goal completions and major channels over time.
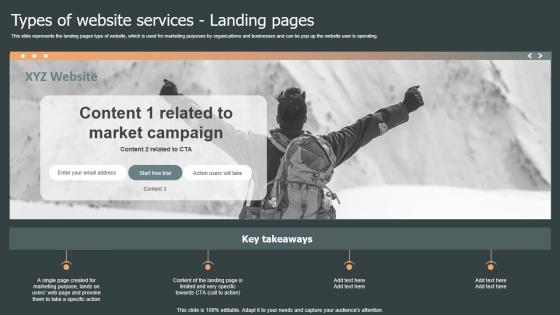
Types Of Website Services Landing Role Web Designing User Engagement Guidelines PDF
This slide represents the landing pages type of website, which is used for marketing purposes by organizations and businesses and can be pop up the website user is operating. Do you know about Slidesgeeks Types Of Website Services Homepages Role Web Designing User Engagement Pictures PDF These are perfect for delivering any kind od presentation. Using it, create PowerPoint presentations that communicate your ideas and engage audiences. Save time and effort by using our pre-designed presentation templates that are perfect for a wide range of topic. Our vast selection of designs covers a range of styles, from creative to business, and are all highly customizable and easy to edit. Download as a PowerPoint template or use them as Google Slides themes. This slide represents the landing pages type of website, which is used for marketing purposes by organizations and businesses and can be pop up the website user is operating.
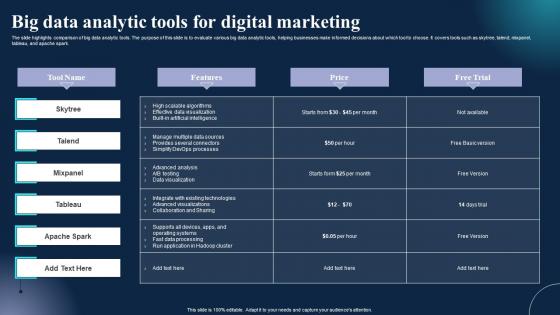
Big Data Analytic Tools For Digital Marketing Information Pdf
The slide highlights comparison of big data analytic tools. The purpose of this slide is to evaluate various big data analytic tools, helping businesses make informed decisions about which tool to choose. It covers tools such as skytree, talend, mixpanel, tableau, and apache spark. Pitch your topic with ease and precision using this Big Data Analytic Tools For Digital Marketing Information Pdf. This layout presents information on Tool Name, Features, Price. It is also available for immediate download and adjustment. So, changes can be made in the color, design, graphics or any other component to create a unique layout. The slide highlights comparison of big data analytic tools. The purpose of this slide is to evaluate various big data analytic tools, helping businesses make informed decisions about which tool to choose. It covers tools such as skytree, talend, mixpanel, tableau, and apache spark.
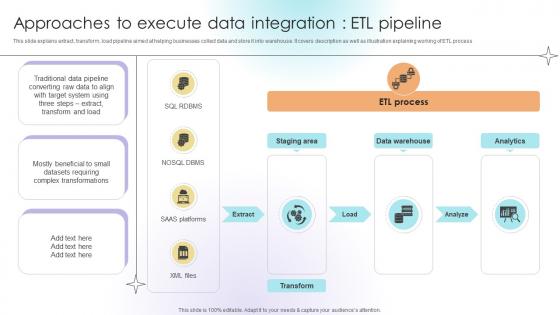
Approaches To Execute Data Integration ETL Pipeline Data Analytics SS V
This slide explains extract, transform, load pipeline aimed at helping businesses collect data and store it into warehouse. It covers description as well as illustration explaining working of ETL process.Crafting an eye-catching presentation has never been more straightforward. Let your presentation shine with this tasteful yet straightforward Approaches To Execute Data Integration ETL Pipeline Data Analytics SS V template. It offers a minimalistic and classy look that is great for making a statement. The colors have been employed intelligently to add a bit of playfulness while still remaining professional. Construct the ideal Approaches To Execute Data Integration ETL Pipeline Data Analytics SS V that effortlessly grabs the attention of your audience Begin now and be certain to wow your customers This slide explains extract, transform, load pipeline aimed at helping businesses collect data and store it into warehouse. It covers description as well as illustration explaining working of ETL process.

Approaches To Execute Data Integration ELT Pipeline Data Analytics SS V
This slide explains extract, load, transform pipeline aimed at helping businesses collect data and store it into warehouse. It covers description as well as illustration explaining working of ELT process.Are you in need of a template that can accommodate all of your creative concepts This one is crafted professionally and can be altered to fit any style. Use it with Google Slides or PowerPoint. Include striking photographs, symbols, depictions, and other visuals. Fill, move around, or remove text boxes as desired. Test out color palettes and font mixtures. Edit and save your work, or work with colleagues. Download Approaches To Execute Data Integration ELT Pipeline Data Analytics SS V and observe how to make your presentation outstanding. Give an impeccable presentation to your group and make your presentation unforgettable. This slide explains extract, load, transform pipeline aimed at helping businesses collect data and store it into warehouse. It covers description as well as illustration explaining working of ELT process.

Introduction To Machine Learning Description And Features Data Analytics SS V
This slide provides an introduction to machine learning aimed ta helping businesses derive patterns and connections in the data. It covers description and features of machine learning.Do you have to make sure that everyone on your team knows about any specific topic I yes, then you should give Introduction To Machine Learning Description And Features Data Analytics SS V a try. Our experts have put a lot of knowledge and effort into creating this impeccable Introduction To Machine Learning Description And Features Data Analytics SS V. You can use this template for your upcoming presentations, as the slides are perfect to represent even the tiniest detail. You can download these templates from the Slidegeeks website and these are easy to edit. So grab these today This slide provides an introduction to machine learning aimed ta helping businesses derive patterns and connections in the data. It covers description and features of machine learning.
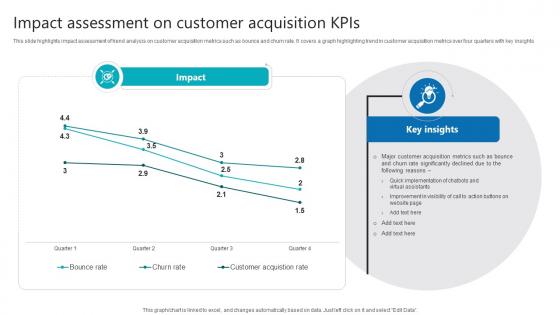
Impact Assessment On Customer Acquisition Kpis Product Analytics Implementation Data Analytics V
This slide highlights impact assessment of trend analysis on customer acquisition metrics such as bounce and churn rate. It covers a graph highlighting trend in customer acquisition metrics over four quarters with key insights The Impact Assessment On Customer Acquisition Kpis Product Analytics Implementation Data Analytics V is a compilation of the most recent design trends as a series of slides. It is suitable for any subject or industry presentation, containing attractive visuals and photo spots for businesses to clearly express their messages. This template contains a variety of slides for the user to input data, such as structures to contrast two elements, bullet points, and slides for written information. Slidegeeks is prepared to create an impression. This slide highlights impact assessment of trend analysis on customer acquisition metrics such as bounce and churn rate. It covers a graph highlighting trend in customer acquisition metrics over four quarters with key insights
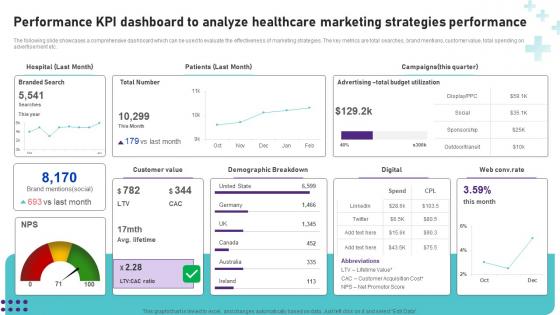
Performance KPI Dashboard To Analyze Healthcare Operational Areas Healthcare Rules PDF
Do you know about Slidesgeeks Performance KPI Dashboard To Analyze Healthcare Operational Areas Healthcare Rules PDF These are perfect for delivering any kind od presentation. Using it, create PowerPoint presentations that communicate your ideas and engage audiences. Save time and effort by using our pre-designed presentation templates that are perfect for a wide range of topic. Our vast selection of designs covers a range of styles, from creative to business, and are all highly customizable and easy to edit. Download as a PowerPoint template or use them as Google Slides themes. The following slide showcases a comprehensive dashboard which can be used to evaluate the effectiveness of marketing strategies. The key metrics are total searches, brand mentions, customer value, total spending on advertisement etc.
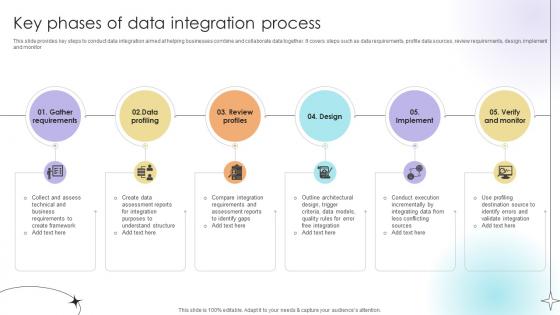
Key Phases Of Data Integration Process Data Analytics SS V
This slide provides key steps to conduct data integration aimed at helping businesses combine and collaborate data together. It covers steps such as data requirements, profile data sources, review requirements, design, implement and monitor.Slidegeeks is here to make your presentations a breeze with Key Phases Of Data Integration Process Data Analytics SS V With our easy-to-use and customizable templates, you can focus on delivering your ideas rather than worrying about formatting. With a variety of designs to choose from, you are sure to find one that suits your needs. And with animations and unique photos, illustrations, and fonts, you can make your presentation pop. So whether you are giving a sales pitch or presenting to the board, make sure to check out Slidegeeks first This slide provides key steps to conduct data integration aimed at helping businesses combine and collaborate data together. It covers steps such as data requirements, profile data sources, review requirements, design, implement and monitor.
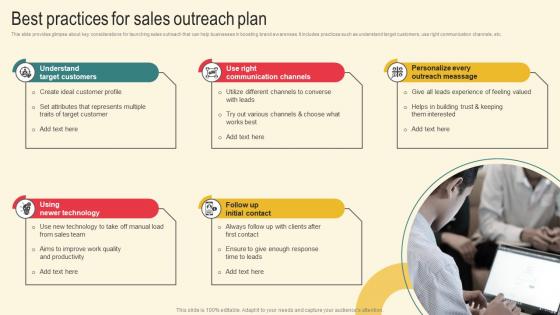
Best Practices For Sales Marketing Plan For Boosting Client Retention In Retail Banking Pictures Pdf
This slide provides glimpse about key considerations for launching sales outreach that can help businesses in boosting brand awareness. It includes practices such as understand target customers, use right communication channels, etc. The Best Practices For Sales Marketing Plan For Boosting Client Retention In Retail Banking Pictures Pdf is a compilation of the most recent design trends as a series of slides. It is suitable for any subject or industry presentation, containing attractive visuals and photo spots for businesses to clearly express their messages. This template contains a variety of slides for the user to input data, such as structures to contrast two elements, bullet points, and slides for written information. Slidegeeks is prepared to create an impression. This slide provides glimpse about key considerations for launching sales outreach that can help businesses in boosting brand awareness. It includes practices such as understand target customers, use right communication channels, etc.
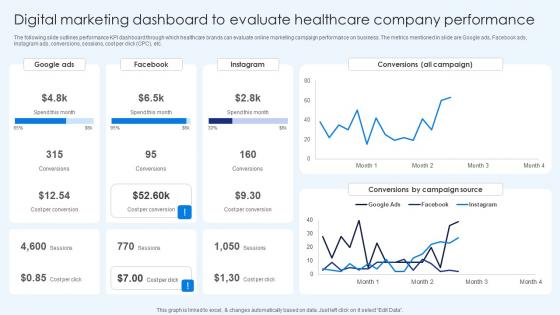
Digital Marketing Dashboard To Evaluate Healthcare Promotion Introduction Pdf
The following slide outlines performance KPI dashboard through which healthcare brands can evaluate online marketing campaign performance on business. The metrics mentioned in slide are Google ads, Facebook ads, Instagram ads, conversions, sessions, cost per click CPC, etc. Present like a pro with Digital Marketing Dashboard To Evaluate Healthcare Promotion Introduction Pdf Create beautiful presentations together with your team, using our easy-to-use presentation slides. Share your ideas in real-time and make changes on the fly by downloading our templates. So whether you are in the office, on the go, or in a remote location, you can stay in sync with your team and present your ideas with confidence. With Slidegeeks presentation got a whole lot easier. Grab these presentations today. The following slide outlines performance KPI dashboard through which healthcare brands can evaluate online marketing campaign performance on business. The metrics mentioned in slide are Google ads, Facebook ads, Instagram ads, conversions, sessions, cost per click CPC, etc.


 Continue with Email

 Home
Home


