Business Snapshot
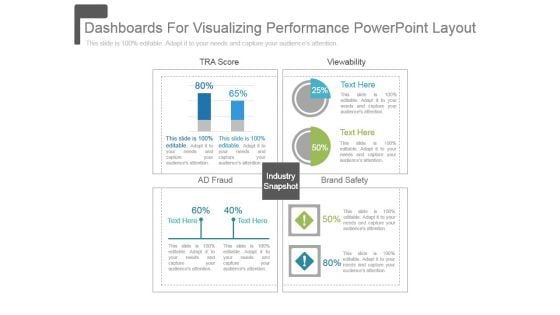
Dashboards For Visualizing Performance Powerpoint Layout
This is a dashboards for visualizing performance powerpoint layout. This is a four stage process. The stages in this process are tra score, view ability, ad fraud, brand safety, industry snapshot.
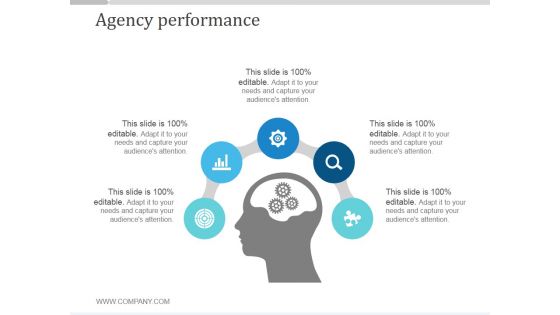
Agency Performance Slide2 Ppt PowerPoint Presentation Deck
This is a agency performance slide2 ppt powerpoint presentation deck. This is a four stage process. The stages in this process are tra store, ad fraud, brand safety, industry snapshot, viewability.
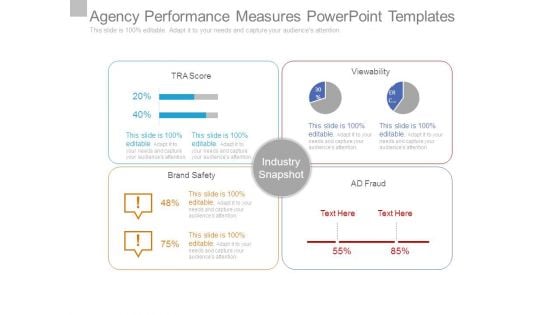
Agency Performance Measures Powerpoint Templates
This is a agency performance measures powerpoint templates. This is a four stage process. The stages in this process are industry snapshot, brand safety, ad fraud, viewability, tra score.
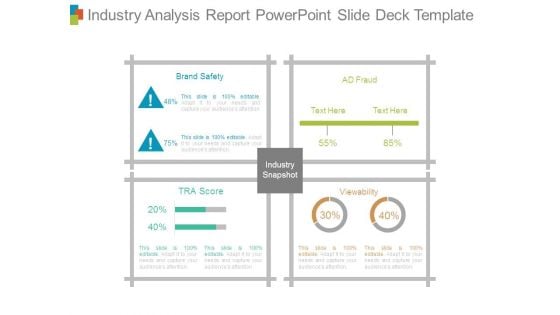
Industry Analysis Report Powerpoint Slide Deck Template
This is a industry analysis report powerpoint slide deck template. This is a four stage process. The stages in this process are industry snapshot, brand safety, ad fraud, viewability, tra score.
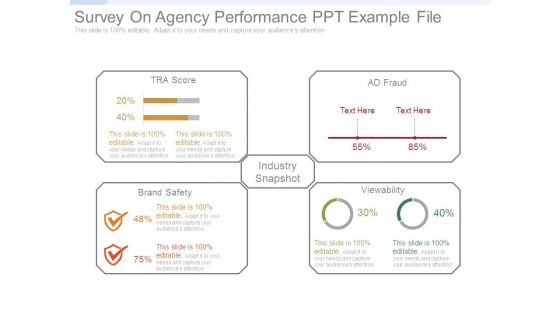
Survey On Agency Performance Ppt Example File
This is a survey on agency performance ppt example file. This is a four stage process. The stages in this process are industry snapshot, brand safety, ad fraud, viewability, tra score.
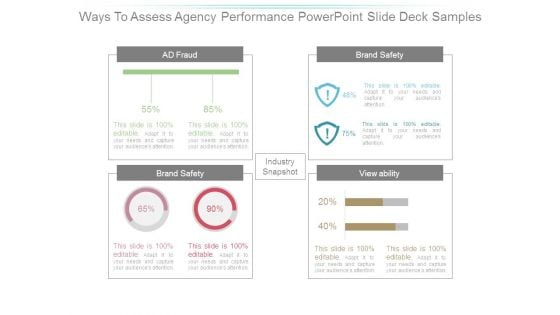
Ways To Assess Agency Performance Powerpoint Slide Deck Samples
This is a ways to assess agency performance powerpoint slide deck samples. This is a four stage process. The stages in this process are industry snapshot, brand safety, ad fraud, viewability, tra score.
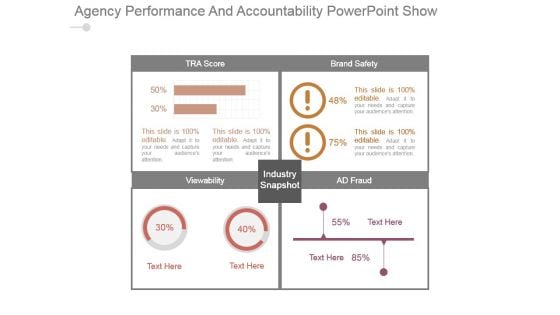
Agency Performance And Accountability Powerpoint Show
This is a agency performance and accountability powerpoint show. This is a four stage process. The stages in this process are tra score, brand safety, view ability, ad fraud, industry snapshot.
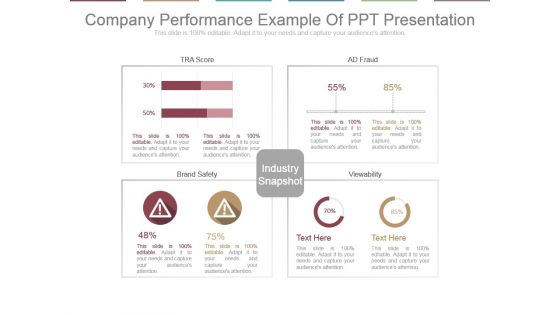
Company Performance Example Of Ppt Presentation
This is a company performance example of ppt presentation. This is a four stage process. The stages in this process are tra score, ad fraud, brand safety, view ability, industry snapshot.
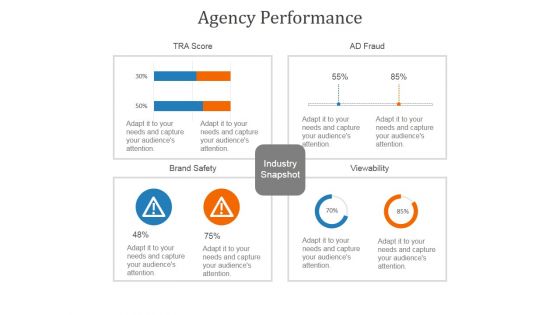
Agency Performance Template 2 Ppt PowerPoint Presentation Background Images
This is a agency performance template 2 ppt powerpoint presentation background images. This is a four stage process. The stages in this process are brand safety, viewability, industry snapshot.
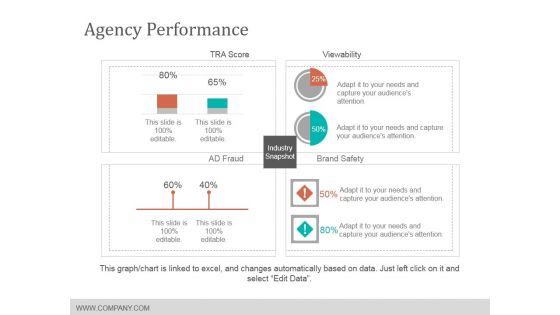
Agency Performance Template 2 Ppt Powerpoint Presentation Slides Designs
This is a agency performance template 2 ppt powerpoint presentation slides designs. This is a four stage process. The stages in this process are tra score, viewability, brand safety, industry snapshot.
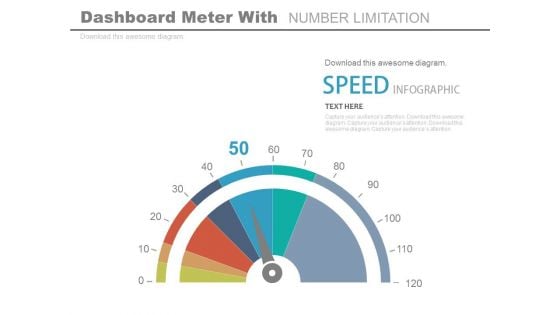
Dashboard To Impact The Performance Powerpoint Slides
This PowerPoint template graphics of meter chart. Download this PPT chart for business performance analysis. This PowerPoint slide is of great help in the business sector to make realistic presentations and provides effective way of presenting your newer thoughts.
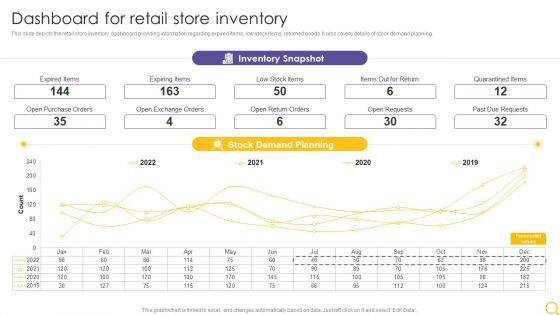
Retail Outlet Operational Efficiency Analytics Dashboard For Retail Store Inventory Summary PDF
This slide depicts the retail store inventory dashboard providing information regarding expired items, low stock items, returned goods. It also covers details of stock demand planning. Deliver and pitch your topic in the best possible manner with this Retail Outlet Operational Efficiency Analytics Dashboard For Retail Store Inventory Summary PDF. Use them to share invaluable insights on Inventory Snapshot, Stock Demand Planning, Expired Items and impress your audience. This template can be altered and modified as per your expectations. So, grab it now.
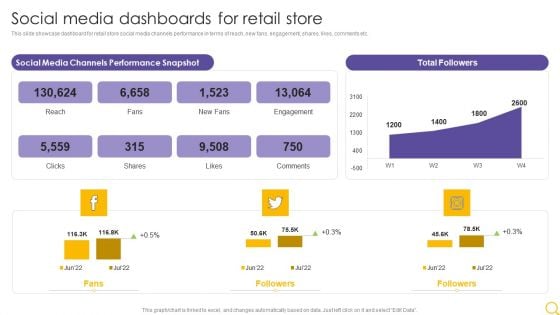
Retail Outlet Operational Efficiency Analytics Social Media Dashboards For Retail Store Slides PDF
This slide showcase dashboard for retail store social media channels performance in terms of reach, new fans, engagement, shares, likes, comments etc. Deliver and pitch your topic in the best possible manner with this Retail Outlet Operational Efficiency Analytics Social Media Dashboards For Retail Store Slides PDF. Use them to share invaluable insights on Social Media Channels, Performance Snapshot, Total Followers and impress your audience. This template can be altered and modified as per your expectations. So, grab it now.
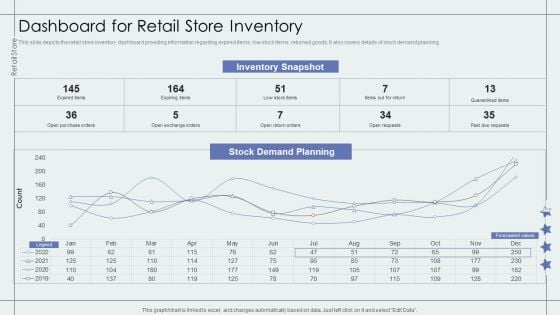
Dashboard For Retail Store Inventory Retail Outlet Performance Assessment Clipart PDF
This slide depicts the retail store inventory dashboard providing information regarding expired items, low stock items, returned goods. It also covers details of stock demand planning.Deliver an awe inspiring pitch with this creative Dashboard For Retail Store Inventory Retail Outlet Performance Assessment Clipart PDF bundle. Topics like Expired Items, Inventory Snapshot, Demand Planning can be discussed with this completely editable template. It is available for immediate download depending on the needs and requirements of the user.
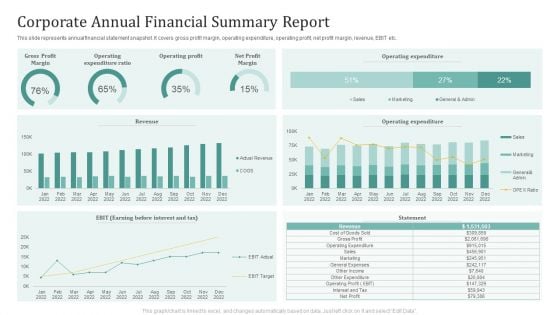
Corporate Annual Financial Summary Report Ppt Portfolio Skills PDF
This slide represents annual financial statement snapshot. It covers gross profit margin, operating expenditure, operating profit, net profit margin, revenue, EBIT etc. Pitch your topic with ease and precision using this Corporate Annual Financial Summary Report Ppt Portfolio Skills PDF. This layout presents information on Operating Expenditure Ratio, Operating Profit, Net Profit Margin. It is also available for immediate download and adjustment. So, changes can be made in the color, design, graphics or any other component to create a unique layout.
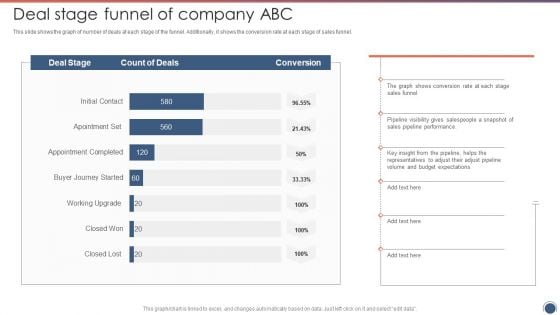
Deal Stage Funnel Of Company ABC Sales Funnel Management Strategies To Increase Sales Sample PDF
This slide shows the graph of number of deals at each stage of the funnel. Additionally, it shows the conversion rate at each stage of sales funnel.Deliver an awe inspiring pitch with this creative Deal Stage Funnel Of Company ABC Sales Funnel Management Strategies To Increase Sales Sample PDF bundle. Topics like Pipeline Visibility, Salespeople A Snapshot, Budget Expectations can be discussed with this completely editable template. It is available for immediate download depending on the needs and requirements of the user.
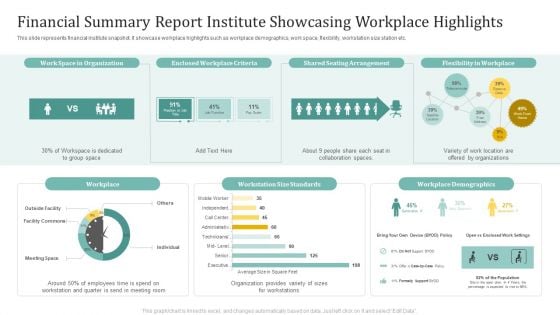
Financial Summary Report Institute Showcasing Workplace Highlights Ppt Infographics Inspiration PDF
This slide represents financial institute snapshot. It showcase workplace highlights such as workplace demographics, work space, flexibility, workstation size station etc. Pitch your topic with ease and precision using this Financial Summary Report Institute Showcasing Workplace Highlights Ppt Infographics Inspiration PDF. This layout presents information on Shared Seating Arrangement, Flexibility Workplace, Workplace. It is also available for immediate download and adjustment. So, changes can be made in the color, design, graphics or any other component to create a unique layout.
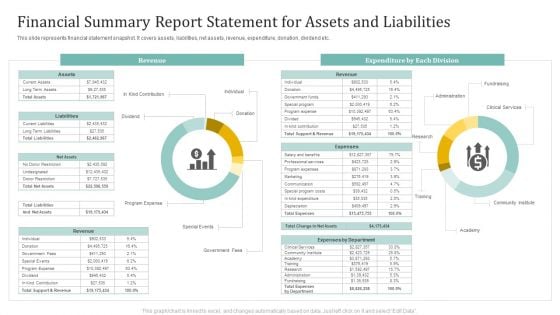
Financial Summary Report Statement For Assets And Liabilities Ppt Slides Guide PDF
This slide represents financial statement snapshot. It covers assets, liabilities, net assets, revenue, expenditure, donation, dividend etc. Pitch your topic with ease and precision using this Financial Summary Report Statement For Assets And Liabilities Ppt Slides Guide PDF. This layout presents information on Revenue, Expenditure Each Division, Fundraising. It is also available for immediate download and adjustment. So, changes can be made in the color, design, graphics or any other component to create a unique layout.
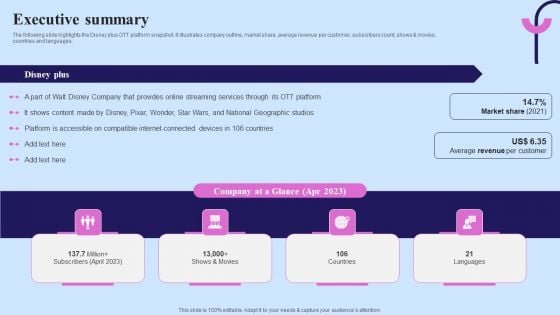
Video Streaming Technology Company Introduction Executive Summary Topics PDF
The following slide highlights the Disney plus OTT platform snapshot. It illustrates company outline, market share, average revenue per customer, subscribers count, shows and movies, countries and languages. There are so many reasons you need a Video Streaming Technology Company Introduction Executive Summary Topics PDF. The first reason is you cannot spend time making everything from scratch, Thus, Slidegeeks has made presentation templates for you too. You can easily download these templates from our website easily.
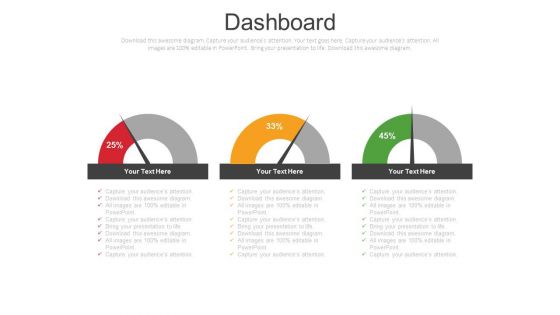
Parameters Of Growth And Development Powerpoint Slides
Dashboard design has been displayed in this business slide. This business diagram helps to exhibit parameters of growth and development. Download this PowerPoint template to build an exclusive presentation.
Market Trends Chart With Icons Powerpoint Slides
This PowerPoint template has been designed with business info graphic chart. You may use this business slide design to display market trends. This PPT slide is powerful tool to describe your ideas.
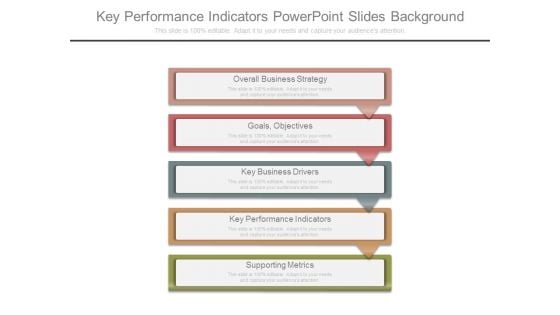
Key Performance Indicators Powerpoint Slides Background
This is a key performance indicators powerpoint slides background. This is a five stage process. The stages in this process are overall business strategy, goals, objectives, key business drivers, key performance indicators, supporting metrics.

Stock Photo Three Blue Doors For Opportunity Representation PowerPoint Slide
This image displays three blue doors on white background. This image contains the concept of business opportunities and options. This editable slide is useful for business and success related presentations.
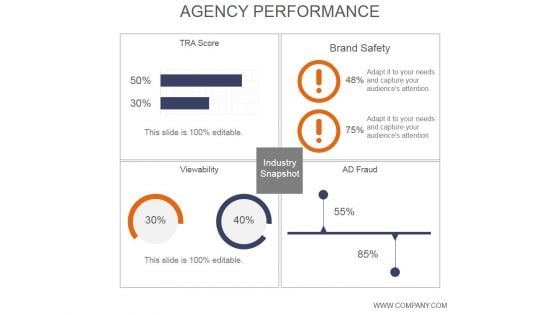
Agency Performance Ppt PowerPoint Presentation Layout
This is a agency performance ppt powerpoint presentation layout. This is a four stage process. The stages in this process are tra score, viewability, industry snapshot, brand safety, ad fraud.
Stock Photo Legos Separated PowerPoint Slide
This image is designed with graphic of colorful lego blocks. In this image blocks representing the team concept. Use this image in your business presentations to display teamwork.

Supply Chain Kpi Dashboard Ppt PowerPoint Presentation Complete Deck With Slides
This is a supply chain kpi dashboard ppt powerpoint presentation complete deck with slides. This is a one stage process. The stages in this process are business, strategy, marketing, analysis, business model.
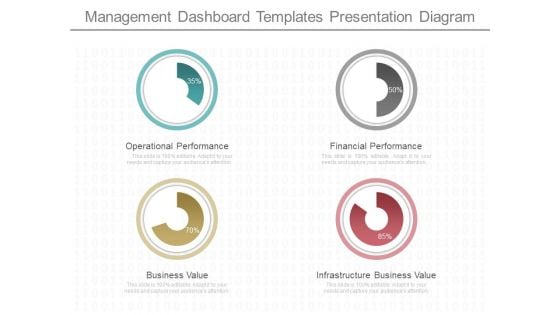
Management Dashboard Templates Presentation Diagram
This is a management dashboard templates presentation diagram. This is a four stage process. The stages in this process are operational performance, business value, financial performance, infrastructure business value.
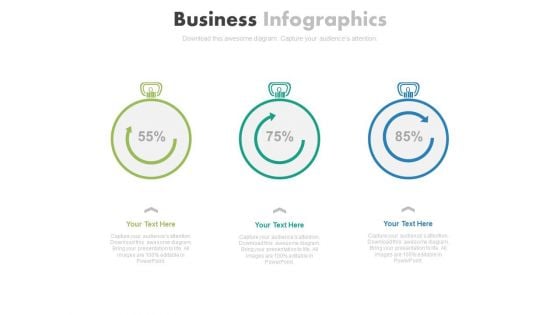
Three Stopwatches For Percentage Growth Powerpoint Slides
Three stopwatches have been displayed in this business slide. This business diagram helps to exhibit parameters of growth and development. Download this PowerPoint template to build an exclusive presentation.
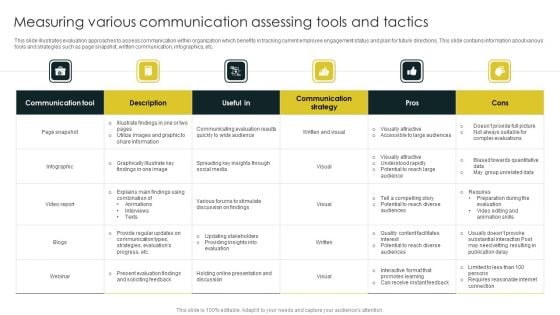
Measuring Various Communication Assessing Tools And Tactics Information PDF
This slide illustrates evaluation approaches to assess communication within organization which benefits in tracking current employee engagement status and plan for future directions. This slide contains information about various tools and strategies such as page snapshot, written communication, infographics, etc. Showcasing this set of slides titled Measuring Various Communication Assessing Tools And Tactics Information PDF. The topics addressed in these templates are Communication Tool, Communication Strategy, Description. All the content presented in this PPT design is completely editable. Download it and make adjustments in color, background, font etc. as per your unique business setting.
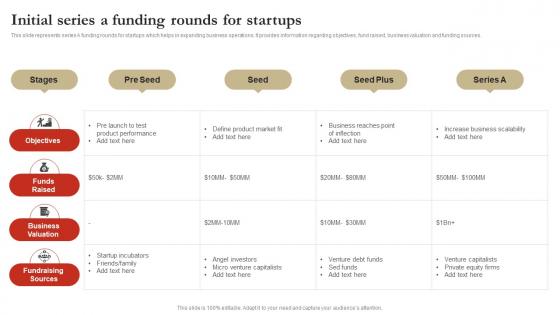
Initial Series A Funding Rounds For Startups Pictures Pdf
This slide represents series A funding rounds for startups which helps in expanding business operations. It provides information regarding objectives, fund raised, business valuation and funding sources. Showcasing this set of slides titled Initial Series A Funding Rounds For Startups Pictures Pdf. The topics addressed in these templates are Business Valuation, Fundraising Sources, Private Equity Firms. All the content presented in this PPT design is completely editable. Download it and make adjustments in color, background, font etc. as per your unique business setting. This slide represents series A funding rounds for startups which helps in expanding business operations. It provides information regarding objectives, fund raised, business valuation and funding sources.

Stock Photo Loss Cutting Scissors PowerPoint Slide
This image slide has been designed with scissors cutting the loss word. This image contains the graphic loss cutting scissors depicting how to cut losses. This image is suitable for business and marketing related presentations.

Strategies For Dynamic Supply Chain Agility Supply Chain Kpi Dashboard For Effective Financial Analysis Demonstration PDF
Mentioned slide illustrates KPI dashboard that can be used by managers to assess financial health of supply chain business. KPIs covered are supply chain costs versus sales, cash to order cycle, warehouse operating cost distribution etc. The Strategies For Dynamic Supply Chain Agility Supply Chain Kpi Dashboard For Effective Financial Analysis Demonstration PDF is a compilation of the most recent design trends as a series of slides. It is suitable for any subject or industry presentation, containing attractive visuals and photo spots for businesses to clearly express their messages. This template contains a variety of slides for the user to input data, such as structures to contrast two elements, bullet points, and slides for written information. Slidegeeks is prepared to create an impression.
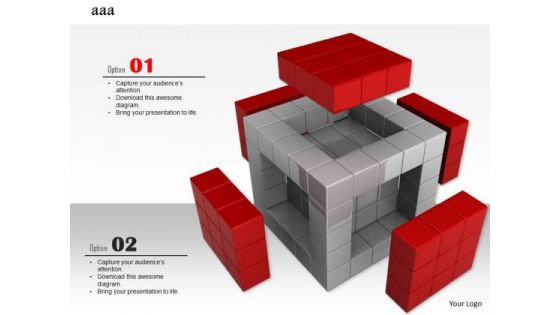
Stock Photo Five Open Sides Of Cube PowerPoint Slide
Create visually amazing Presentations with this image of cube with five open sides. Use this image with design of cube to make business presentations. Add this image in your presentations to visually support your content.
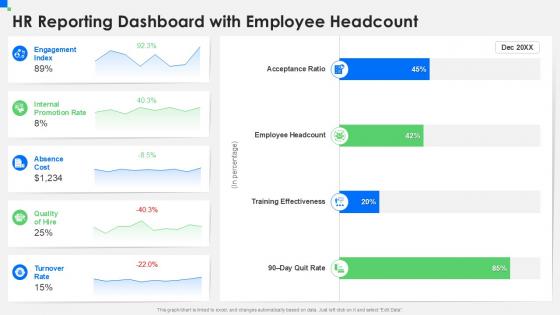
HR Reporting Dashboard With Employee Headcount
Do you have to make sure that everyone on your team knows about any specific topic I yes, then you should give HR Reporting Dashboard With Employee Headcount a try. Our experts have put a lot of knowledge and effort into creating this impeccable HR Reporting Dashboard With Employee Headcount. You can use this template for your upcoming presentations, as the slides are perfect to represent even the tiniest detail. You can download these templates from the Slidegeeks website and these are easy to edit. So grab these today Our HR Reporting Dashboard with Employee Headcount template is expertly designed to provide a visually appealing and organized layout for tracking and presenting key HR data. It offers a clear overview of employee metrics, helping you communicate important insights regarding workforce demographics and staffing levels.
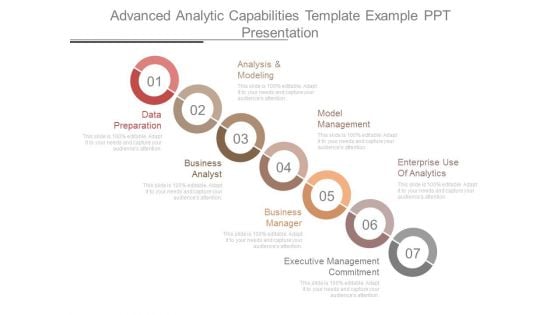
Advanced Analytic Capabilities Template Example Ppt Presentation
This is a advanced analytic capabilities template example ppt presentation. This is a seven stage process. The stages in this process are analysis and modeling, model management, enterprise use of analytics, data preparation, business analyst, business manager, executive management commitment

Stock Photo Red Ball On Slope Shows Balance PowerPoint Slide
This red ball on slope image is a stunning image that you can use to make business presentations. Set your imagination with this 3d business image. Use this image to make outstanding presentations.
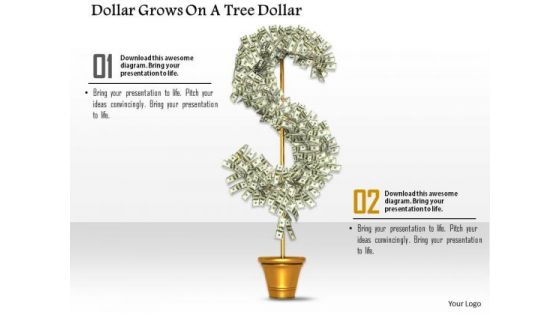
Stock Photo Illustration Of Dollar Plant PowerPoint Slide
Explain the concept of business growth in any presentation by using this professional image. This image contains the graphic of dollar plant. This image is useful for finance and business related presentations.

Stock Photo 3d Chain Be Different Concept PowerPoint Slide
Use this image of chain graphics with unique blue link in business presentations. This chain graphics image may also be used to display flow of business steps. This image is designed to attract the attention of your audience.

Stock Photo Girl Holding Green Umbrella Pwerpoint Slide
This beautiful image has been crafted with graphic of girl whose holding green umbrella. This image display the concept of business safety and protection. Use this image for your business presentations.
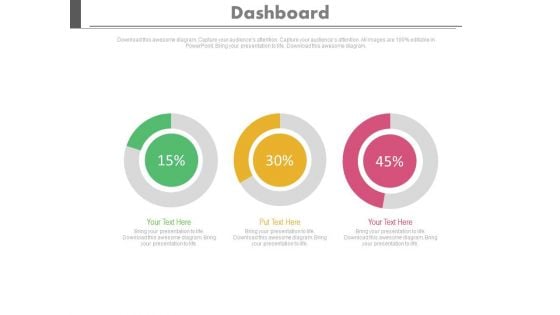
Three Dashboard With Percentage Value Growth Powerpoint Slides
This PowerPoint template has been designed with three dashboards. Use this PPT slide to depict rise in business profit. This professional diagram slide will help you express your views to target audience.
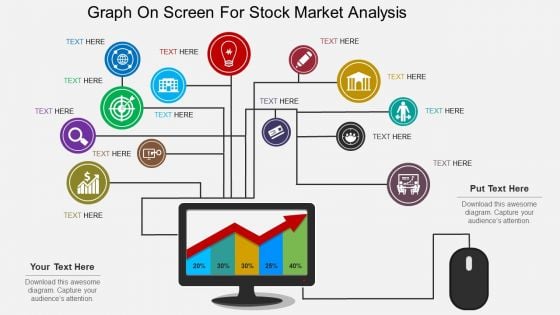
Graph On Screen For Stock Market Analysis Powerpoint Template
This PowerPoint slide contains computer screen with business graph. This professional slide may be used for visual explanation of data. Adjust the above diagram in your business presentations to give professional impact.
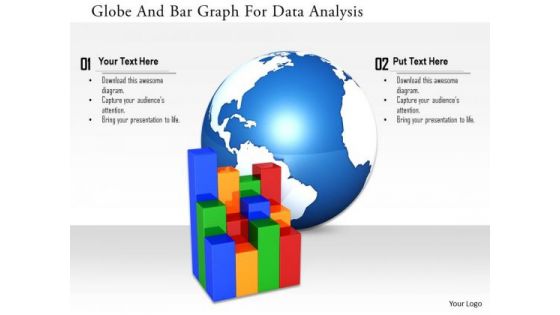
Stock Photo Globe And Bar Graph For Data Analysis Image Graphics For PowerPoint Slide
This image slide has been designed with business graph with globe in background. This image slide represents topics like global business, economic growth. This image will enhance the quality of your presentations.
Abc Steps Chart For Data Analysis Powerpoint Slides
Our above PPT slide contains graphics of ABC steps chart. This business diagram helps to depict business information for strategic management. Use this diagram to impart more clarity to data and to create more sound impact on viewers.
Organization Tactical M And A Process Icon With Roadmap Ppt Pictures Inspiration PDF
Showcasing this set of slides titled Organization Tactical M And A Process Icon With Roadmap Ppt Pictures Inspiration PDF. The topics addressed in these templates are Organization Tactical, M And A, Process Icon, Roadmap. All the content presented in this PPT design is completely editable. Download it and make adjustments in color, background, font etc. as per your unique business setting.
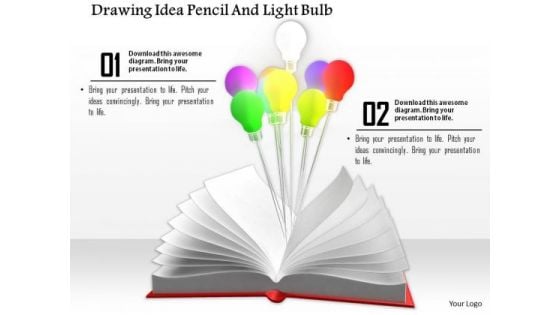
Stock Photo Colorful Light Bulbs Over Open Book PowerPoint Slide
Use this professional image slide to communicate about some new business ideas. This image is designed with colorful light bulbs over an open book. This image can be used for business presentations and also for educational topics.
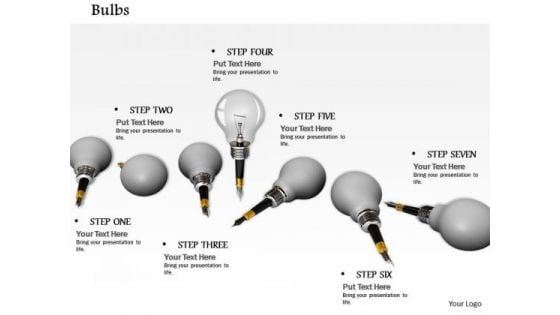
0814 Stock Photo Creative Idea Bulb Conceptual Image PowerPoint Slide
The above image shows conceptual image of creative idea bulb. This pre-designed and appealing graphics offer an optimized possibility to illustrate your business strategy. You can present your opinions using this impressive image related to business ideas.
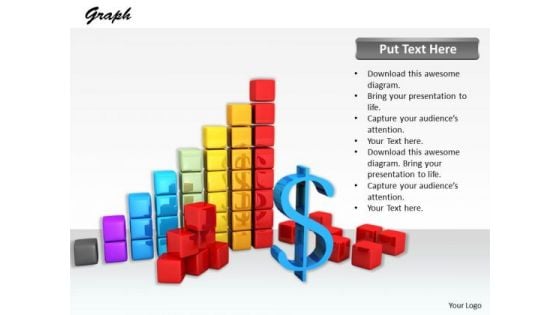
Stock Photo Design Of Financial Charts And Reports PowerPoint Slide
This image slide has been professionally designed to give complete look to your business presentations. This image is designed with graphics of business reports and charts. Use this image in marketing and sales related presentations.
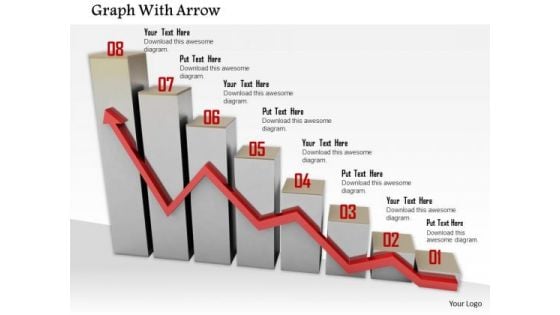
Stock Photo Red Growth Arrow On Bar Graph PowerPoint Slide
Explain the concepts of business growth with this unique image. This image has been designed with red growth arrow on bar graph. Use this image in business and finance related topics
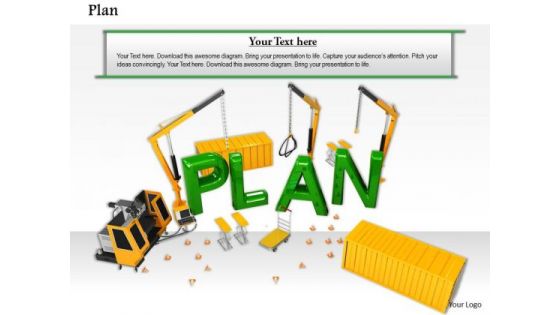
Stock Photo Conceptual Image Of Plan Construction PowerPoint Slide
This business image has been crafted with graphic of plan word on construction site. This image shows the concept of construction and planning. Make a presentation on business plans with this innovative image.

Stock Photo Illustration Of Construction Plan PowerPoint Slide
This business image has been crafted with graphic of plan word on construction site. This image shows the concept of construction and planning. Make a presentation on business plans with this innovative image.

Stock Photo 3d Glossy Dices On Chess Board PowerPoint Slide
This business power point slide has been designed with 3d glossy dices on chess board. This image slide contains the concept of business and sales strategy. Download this image for gaming and gambling related topics.

Stock Photo Be Different Concept Alarm Clocks PowerPoint Slide
This business power point slide has been designed with graphic of alarm clocks. This image slide contains row of alarm clocks with one unique standing ahead depicting concept of time management. Explain time management in your business presentations.
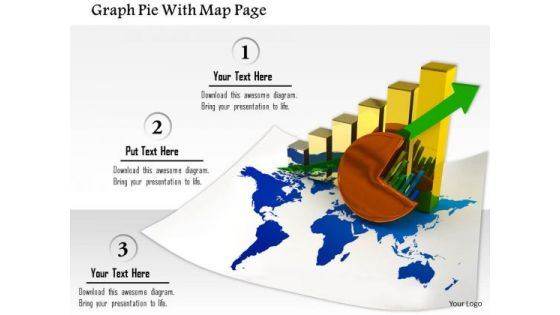
Stock Photo Graph Pie With Map Page PowerPoint Slide
This image slide contains business charts on world map. This image is designed with bar graph and pie chart on world map depicting global economy. Use this image slide to represent financial growth in any business presentation.
Stock Photo Pencil With Green Tick Mark PowerPoint Slide
This image slide has been designed with graphic of pencil with green checklist. This image contains the concept of checklist formation and overviewed strategy for business. This image can be used for business and marketing related presentations.
Stock Photo Pencil With Green Tick Marks PowerPoint Slide
This image slide has been designed with graphic of pencil with green checklist. This image contains the concept of checklist formation and overviewed strategy for business. This image can be used for business and marketing related presentations.
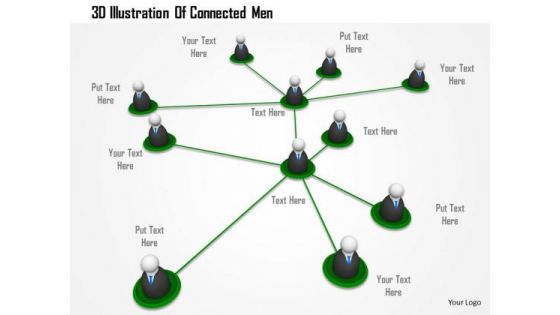
Stock Photo 3d Illustration Of Connected Men PowerPoint Slide
Use this PowerPoint slide which contains graphics of men connected to each other to perform single task. This Diagram can also be used for presentations on network, business, co-operation, communications, community, business and communication.

Numbers That Prove SEO Works Training Ppt
This slide provides information regarding the key statistics which reflect the importance of SEO for business organizations.
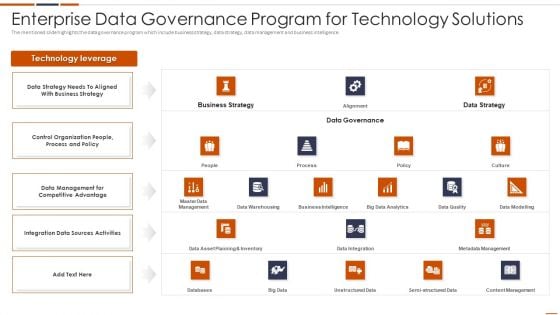
Enterprise Data Governance Program For Technology Solutions Themes PDF
The mentioned slide highlights the data governance program which include business strategy, data strategy, data management and business intelligence.Pitch your topic with ease and precision using this Enterprise Data Governance Program For Technology Solutions Themes PDF This layout presents information on Business Intelligence, Management For Competitive Advantage, Business Strategy It is also available for immediate download and adjustment. So, changes can be made in the color, design, graphics or any other component to create a unique layout.
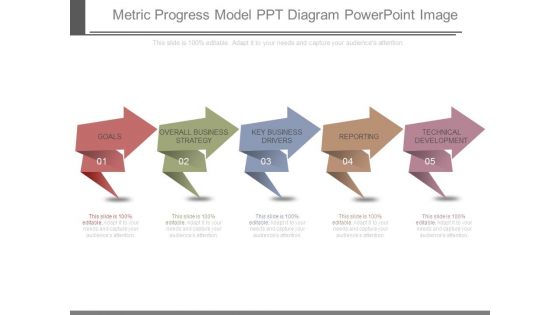
Metric Progress Model Ppt Diagram Powerpoint Image
This is a metric progress model ppt diagram powerpoint image. This is a five stage process. The stages in this process are goals, overall business strategy, key business drivers, reporting, technical development.
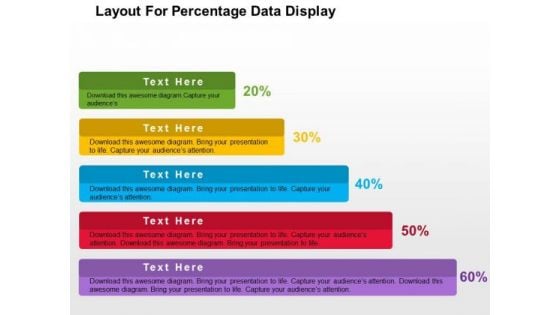
Layout For Precentage Data Display PowerPoint Template
Growth analysis for business can be defined with this business diagram. This slide depicts text boxes in increasing flow. Present your views using this innovative slide and be assured of leaving a lasting impression


 Continue with Email

 Home
Home


