Business Tax
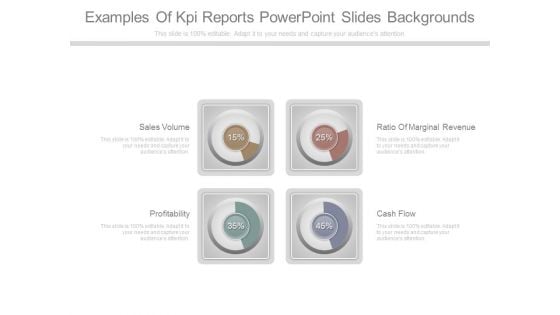
Examples Of Kpi Reports Powerpoint Slides Backgrounds
This is a examples of kpi reports powerpoint slides backgrounds. This is a four stage process. The stages in this process are sales volume, profitability, ratio of marginal revenue, cash flow.
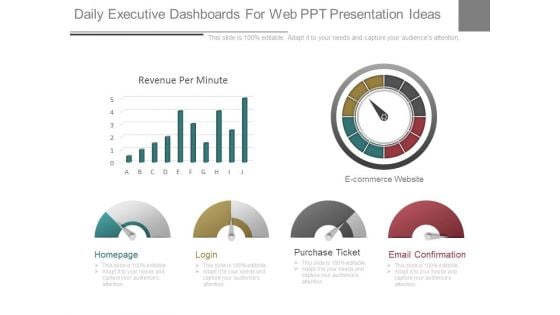
Daily Executive Dashboards For Web Ppt Presentation Ideas
This is a daily executive dashboards for web ppt presentation ideas. This is a six stage process. The stages in this process are homepage, login, purchase ticket, email confirmation, ecommerce website, revenue per minute.

Dashboard Report Ppt Powerpoint Ideas
This is a dashboard report ppt powerpoint ideas. This is a six stage process. The stages in this process are sales vs quotes, target for week, the sales, inventory, revenue.
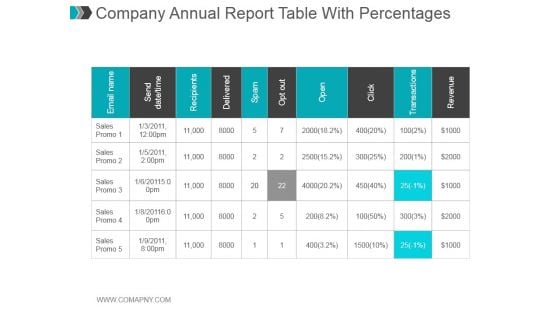
Company Annual Report Table With Percentages Ppt PowerPoint Presentation Slides
This is a company annual report table with percentages ppt powerpoint presentation slides. This is ten stage process. The stages in this process are send date time, email name, recipients, delivered, spam, opt out, open, transactions, revenue.
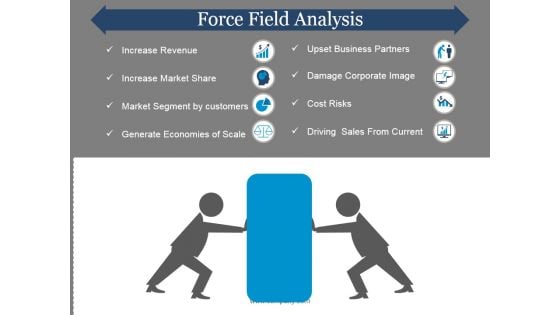
Force Field Analysis Template 1 Ppt PowerPoint Presentation Pictures
This is a force field analysis template 1 ppt powerpoint presentation pictures. This is a two stage process. The stages in this process are increase revenue, increase market sharel, market segment by customers, generate economies of scale.
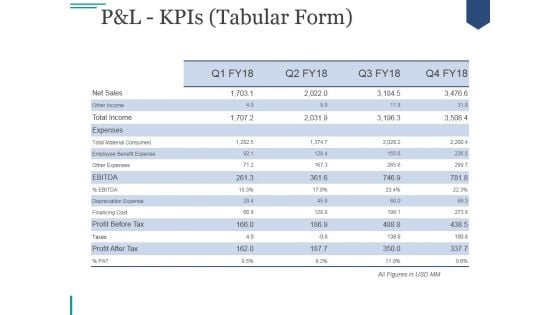
Pandl Kpis Tabular Form Ppt PowerPoint Presentation Visual Aids
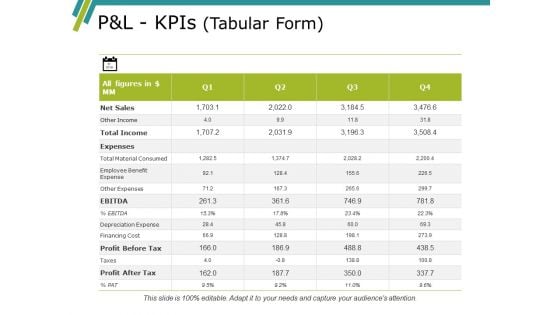
This is a pandl kpis tabular form ppt powerpoint presentation visual aids. This is a four stage process. The stages in this process are revenue, cogs, operating profit, net profit.
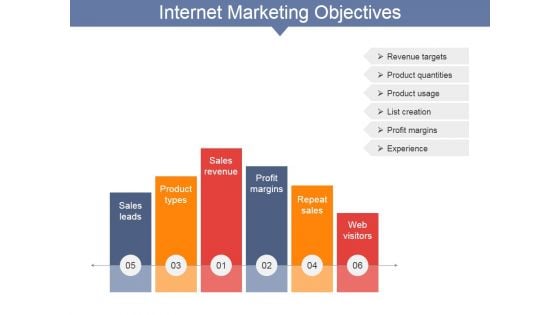
Internet Marketing Objectives Ppt PowerPoint Presentation Layouts Smartart
This is a internet marketing objectives ppt powerpoint presentation layouts smartart. This is a six stage process. The stages in this process are sales leads, product types, sales revenue, profit margins, repeat sales, web visitors.
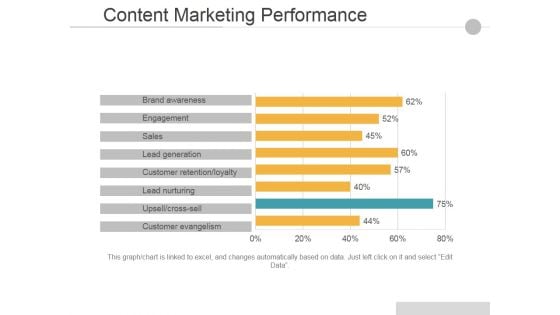
Content Marketing Performance Ppt PowerPoint Presentation Guidelines
This is a content marketing performance ppt powerpoint presentation guidelines. This is a eight stage process. The stages in this process are conversion rate, quality of leads, number of leads, sales revenue, website traffic.
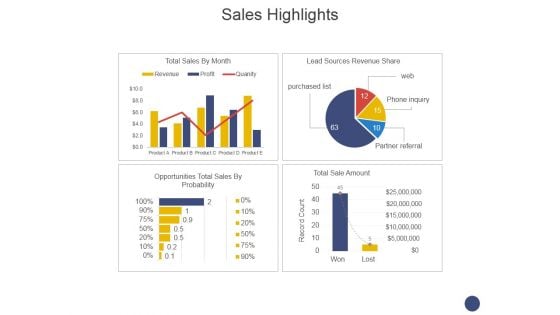
Sales Highlights Ppt PowerPoint Presentation Gallery Tips
This is a sales highlights ppt powerpoint presentation gallery tips. This is a four stage process. The stages in this process are opportunities total sales by probability, lead sources revenue share, total sales by month, total sale amount.
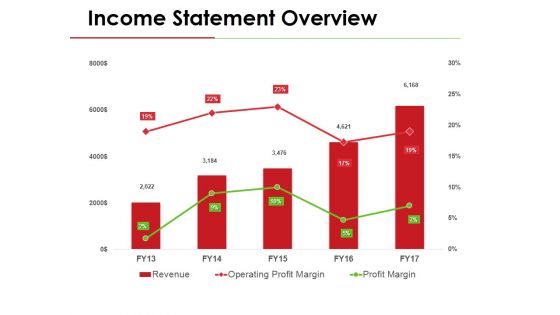
Income Statement Overview Ppt PowerPoint Presentation Gallery Template
This is a income statement overview ppt powerpoint presentation gallery template. This is a three stage process. The stages in this process are revenue, operating profit margin, profit margin.
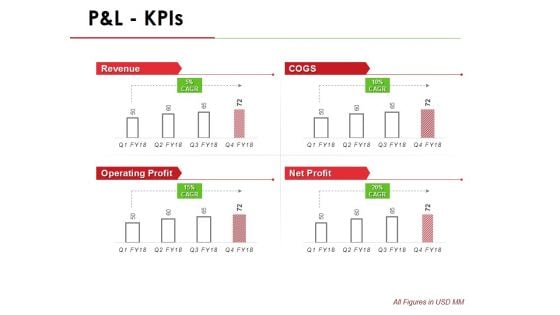
P And L Kpis Template 1 Ppt PowerPoint Presentation Infographic Template Outline
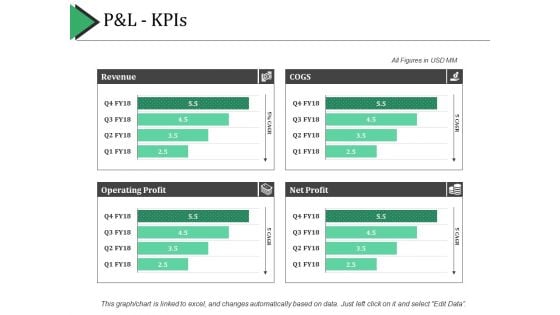
This is a p and l kpis template 1 ppt powerpoint presentation infographic template outline. This is a four stage process. The stages in this process are revenue, operating profit, cogs, net profit.
Pandl Kpis Tabular Form Ppt PowerPoint Presentation Gallery Icon
This is a pandl kpis tabular form ppt powerpoint presentation gallery icon. This is a four stage process. The stages in this process are revenue, cogs, operating profit, net profit.
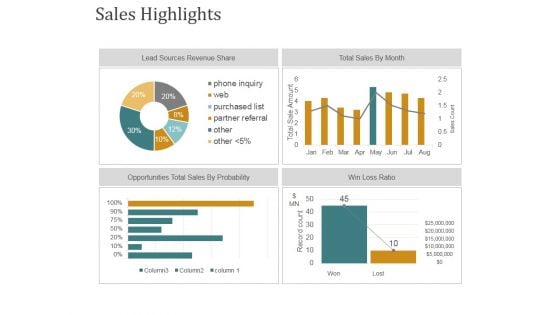
Sales Highlights Ppt PowerPoint Presentation Infographic Template Show
This is a sales highlights ppt powerpoint presentation infographic template show. This is a four stage process. The stages in this process are lead sources revenue share, total sales by month, opportunities total sales by probability, win loss ratio.
Content Marketing Performance Template 1 Ppt PowerPoint Presentation Icon Skills
This is a content marketing performance template 1 ppt powerpoint presentation icon skills. This is a eight stage process. The stages in this process are conversion rate, website traffic, number of leads, sales revenue, quality of leads.

Income Statement Graphical Representation Ppt PowerPoint Presentation Layouts Designs Download
This is a income statement graphical representation ppt powerpoint presentation layouts designs download. This is a four stage process. The stages in this process are revenue, cogs, operating profit, net profit.

Sales Kpi Performance Summary Ppt PowerPoint Presentation Infographic Template Infographics
This is a sales kpi performance summary ppt powerpoint presentation infographic template infographics. This is a seven stage process. The stages in this process are revenue comparison, quantity comparison, product sales mix, regional sales mix.
Sales Kpi Tracker Ppt PowerPoint Presentation Visual Aids Files
This is a sales kpi tracker ppt powerpoint presentation visual aids files. This is a six stage process. The stages in this process are leads created, sales ratio, opportunities won, top products in revenue, open deals vs last yr.
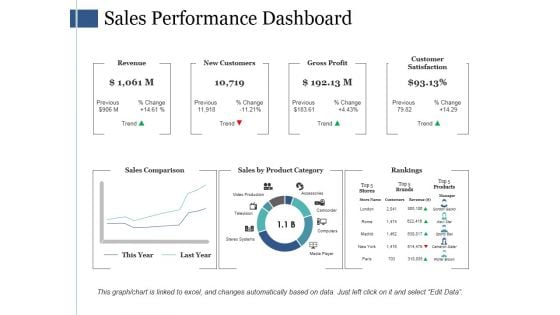
Sales Performance Dashboard Ppt PowerPoint Presentation Ideas Portfolio
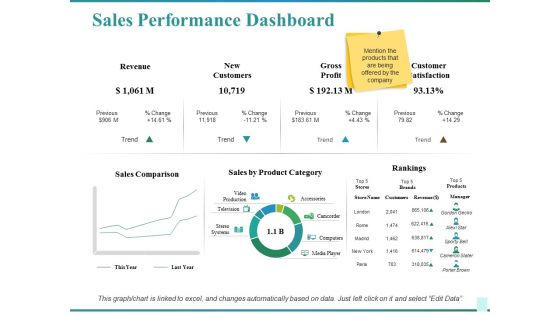
This is a sales performance dashboard ppt powerpoint presentation ideas portfolio. This is a three stage process. The stages in this process are revenue, new customers, gross profit, customer satisfaction, sales comparison.
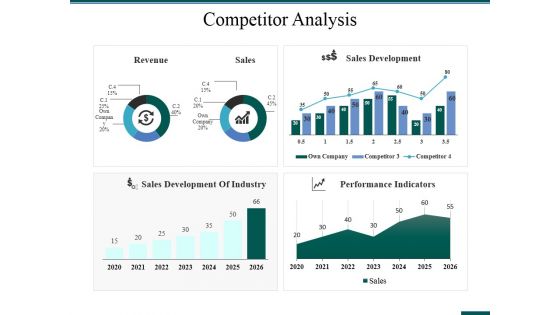
Competitor Analysis Ppt PowerPoint Presentation Model Visual Aids
This is a competitor analysis ppt powerpoint presentation model visual aids. This is a four stage process. The stages in this process are competitor analysis, revenue, sales, sales development, performance indicators.

Sales Kpi Performance Summary Ppt PowerPoint Presentation Ideas Graphics Template
This is a sales kpi performance summary ppt powerpoint presentation ideas graphics template. This is a seven stage process. The stages in this process are revenue comparison, quantity comparison, product sales mix, regional sales mix.
Sales Kpi Tracker Ppt PowerPoint Presentation Pictures Designs
This is a sales kpi tracker ppt powerpoint presentation pictures designs. This is a two stage process. The stages in this process are leads created, sales ratio, opportunities won, top products in revenue, win ratio vs last yr.
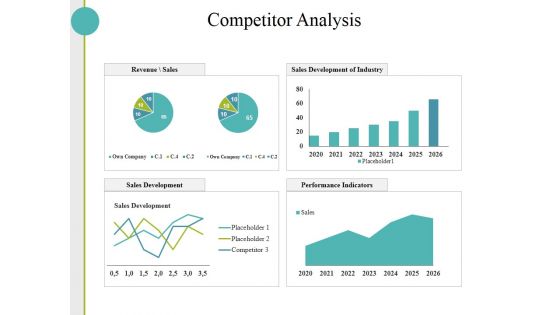
Competitor Analysis Ppt PowerPoint Presentation Layouts Slides
This is a competitor analysis ppt powerpoint presentation layouts slides. This is a four stage process. The stages in this process are sales development, performance indicators, sales development of industry, revenue sales.
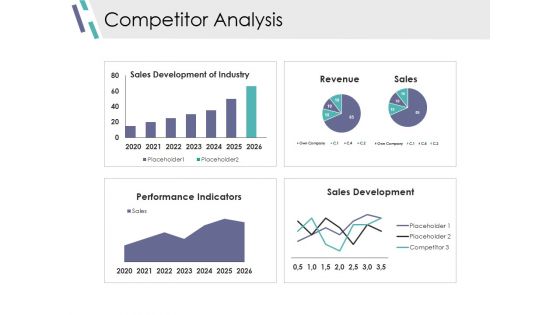
Competitor Analysis Ppt PowerPoint Presentation Layouts Background Images
This is a competitor analysis ppt powerpoint presentation layouts background images. This is a four stage process. The stages in this process are sales development of industry, revenue, performance indicators, sales development.
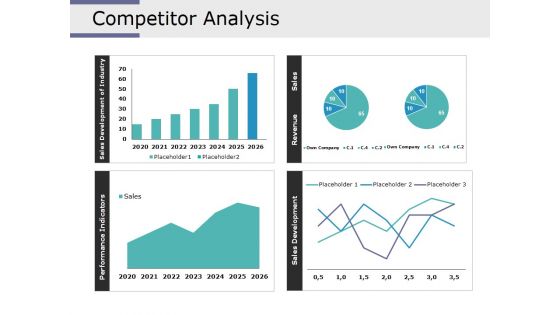
Competitor Analysis Ppt PowerPoint Presentation Model Show
This is a competitor analysis ppt powerpoint presentation model show. This is a four stage process. The stages in this process are performance indicators, sales development of industry, sales development, revenue, sales.
P And L Kpis Template 2 Ppt PowerPoint Presentation Summary Icon
This is a p and l kpis template 2 ppt powerpoint presentation summary icon. This is a four stage process. The stages in this process are revenue, cogs, operating profit, net profit.
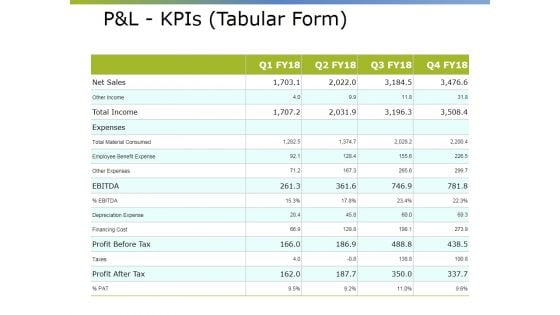
Pandl Kpis Tabular Form Ppt PowerPoint Presentation Pictures Visual Aids
This is a pandl kpis tabular form ppt powerpoint presentation pictures visual aids. This is a four stage process. The stages in this process are revenue, operating profit, cogs, net profit.
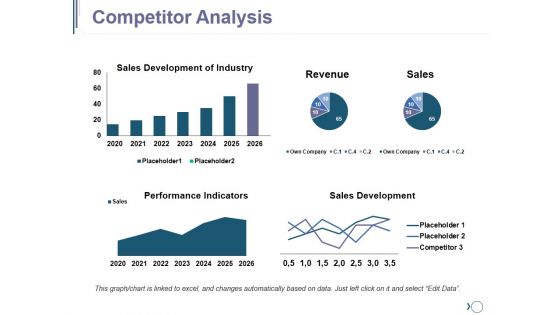
Competitor Analysis Ppt PowerPoint Presentation Outline Ideas
This is a competitor analysis ppt powerpoint presentation outline ideas. This is a four stage process. The stages in this process are sales development of industry, revenue, sales, performance indicators.
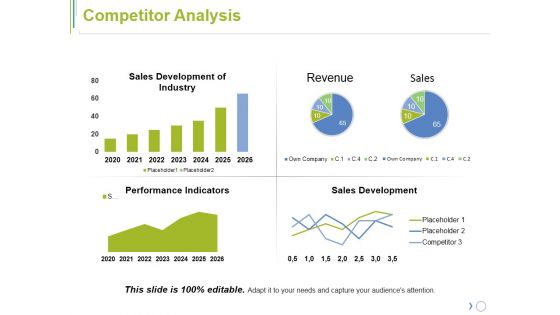
Competitor Analysis Ppt PowerPoint Presentation File Mockup
This is a competitor analysis ppt powerpoint presentation file mockup. This is a four stage process. The stages in this process are sales development of industry, revenue, performance indicators, sales development.
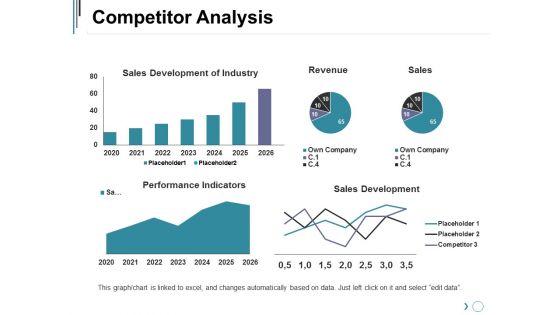
Competitor Analysis Ppt PowerPoint Presentation Layouts Slideshow
This is a competitor analysis ppt powerpoint presentation layouts slideshow. This is a four stage process. The stages in this process are sales development of industry, performance indicators, sales development, revenue, sales.
Pandl Kpis Template Ppt PowerPoint Presentation Model Icon
This is a pandl kpis template ppt powerpoint presentation model icon. This is a four stage process. The stages in this process are revenue, cogs, operating profit, net profit.
Pandl Kpis Template Ppt PowerPoint Presentation Gallery Summary
This is a pandl kpis template ppt powerpoint presentation gallery summary. This is a four stage process. The stages in this process are revenue, cogs, operating profit, net profit.
P And L Kpis Ppt PowerPoint Presentation Show Example Introduction
This is a p and l kpis ppt powerpoint presentation show example introduction. This is a four stage process. The stages in this process are revenue, cogs, net profit, operating profit.

Sales Kpi Performance Summary Ppt PowerPoint Presentation Show Themes
This is a sales kpi performance summary ppt powerpoint presentation show themes. This is a three stage process. The stages in this process are revenue comparison, quantity comparison, product sales mix, markets, sales channel.
Sales Kpi Tracker Ppt PowerPoint Presentation Pictures Layout Ideas
This is a sales kpi tracker ppt powerpoint presentation pictures layout ideas. This is a four stage process. The stages in this process are opportunities won, top products in revenue, leads created, win ratio vs last yr, open deals vs.
Sales Performance Dashboard Ppt PowerPoint Presentation Show Graphics Design
This is a sales performance dashboard ppt powerpoint presentation show graphics design. This is a two stage process. The stages in this process are sales comparison, sales by product category, rankings, customer satisfaction, revenue.
Sales Performance Dashboard Template Ppt PowerPoint Presentation Professional Elements
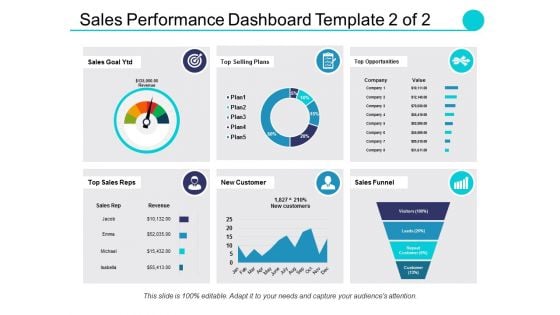
This is a sales performance dashboard template ppt powerpoint presentation professional elements. This is a eight stage process. The stages in this process are sales comparison, sales by product category, sales by month, brand profitability, revenue.
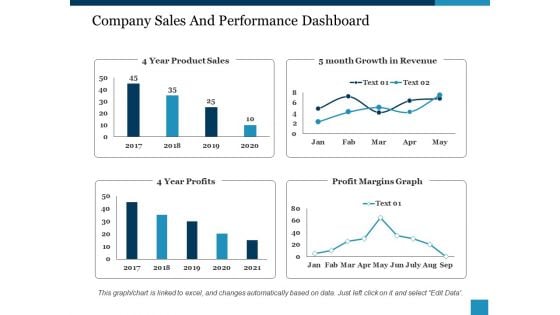
Company Sales And Performance Dashboard Ppt PowerPoint Presentation Show Structure
This is a company sales and performance dashboard ppt powerpoint presentation show structure. This is a four stage process. The stages in this process are year product sales, month growth in revenue, profit margins graph, year profits.
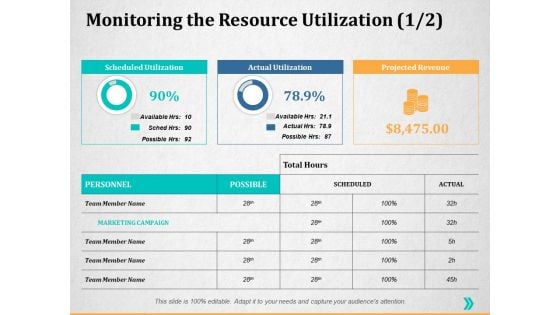
Monitoring The Resource Utilization Ppt PowerPoint Presentation Slides Rules
This is a monitoring the resource utilization ppt powerpoint presentation slides rules. This is a three stage process. The stages in this process are scheduled utilization, actual utilization, projected revenue.
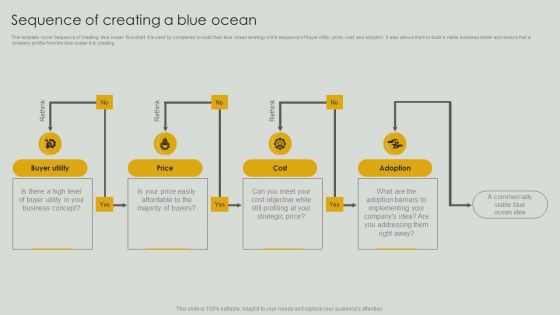
Sequence Of Creating A Blue Ocean Ppt PowerPoint Presentation File Ideas PDF
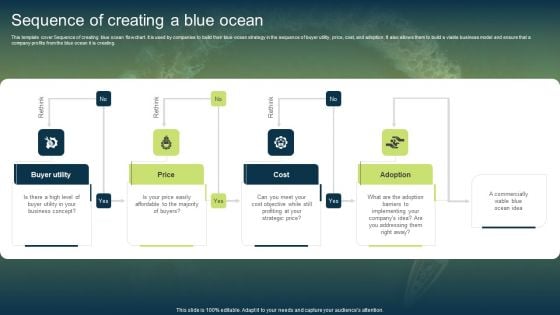
This template cover Sequence of creating blue ocean flowchart. It is used by companies to build their blue ocean strategy in the sequence of buyer utility, price, cost, and adoption. It also allows them to build a viable business model and ensure that a company profits from the blue ocean it is creating. Slidegeeks is here to make your presentations a breeze with Sequence Of Creating A Blue Ocean Ppt PowerPoint Presentation File Ideas PDF With our easy to use and customizable templates, you can focus on delivering your ideas rather than worrying about formatting. With a variety of designs to choose from, you are sure to find one that suits your needs. And with animations and unique photos, illustrations, and fonts, you can make your presentation pop. So whether you are giving a sales pitch or presenting to the board, make sure to check out Slidegeeks first.
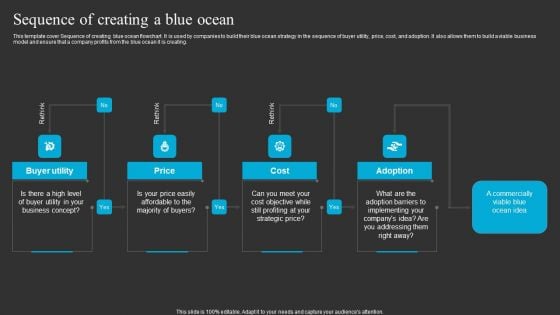
Sequence Of Creating A Blue Ocean Ppt Layouts Maker PDF
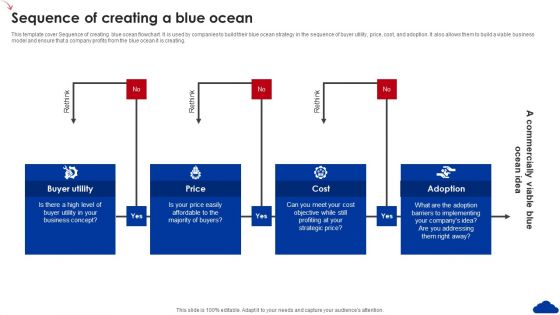
This template cover Sequence of creating blue ocean flowchart. It is used by companies to build their blue ocean strategy in the sequence of buyer utility, price, cost, and adoption. It also allows them to build a viable business model and ensure that a company profits from the blue ocean it is creating. This modern and well arranged Sequence Of Creating A Blue Ocean Ppt Layouts Maker PDF provides lots of creative possibilities. It is very simple to customize and edit with the Powerpoint Software. Just drag and drop your pictures into the shapes. All facets of this template can be edited with Powerpoint no extra software is necessary. Add your own material, put your images in the places assigned for them, adjust the colors, and then you can show your slides to the world, with an animated slide included.
Unconstrained Market Growth Using Blue Ocean Strategies Sequence Of Creating A Blue Ocean Professional PDF
This template cover Sequence of creating blue ocean flowchart. It is used by companies to build their blue ocean strategy in the sequence of buyer utility, price, cost, and adoption. It also allows them to build a viable business model and ensure that a company profits from the blue ocean it is creating. Slidegeeks has constructed Unconstrained Market Growth Using Blue Ocean Strategies Sequence Of Creating A Blue Ocean Professional PDF after conducting extensive research and examination. These presentation templates are constantly being generated and modified based on user preferences and critiques from editors. Here, you will find the most attractive templates for a range of purposes while taking into account ratings and remarks from users regarding the content. This is an excellent jumping off point to explore our content and will give new users an insight into our top notch PowerPoint Templates.
5 Step Guide For Transitioning To Blue Ocean Strategy Sequence Of Creating A Blue Ocean Microsoft PDF
This template cover Sequence of creating blue ocean flowchart. It is used by companies to build their blue ocean strategy in the sequence of buyer utility, price, cost, and adoption. It also allows them to build a viable business model and ensure that a company profits from the blue ocean it is creating. Slidegeeks is one of the best resources for PowerPoint templates. You can download easily and regulate 5 Step Guide For Transitioning To Blue Ocean Strategy Sequence Of Creating A Blue Ocean Microsoft PDF for your personal presentations from our wonderful collection. A few clicks is all it takes to discover and get the most relevant and appropriate templates. Use our Templates to add a unique zing and appeal to your presentation and meetings. All the slides are easy to edit and you can use them even for advertisement purposes.
Growth Illustration Of 5 Stages Pie Chart Ppt Businessplans PowerPoint Slides
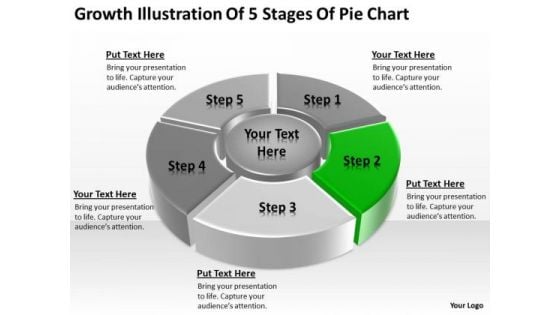
We present our growth illustration of 5 stages pie chart ppt businessplans PowerPoint Slides.Download and present our Circle Charts PowerPoint Templates because You are working at that stage with an air of royalty. Let our PowerPoint Templates and Slides be the jewels in your crown. Present our Process and Flows PowerPoint Templates because Our PowerPoint Templates and Slides will let your ideas bloom. Create a bed of roses for your audience. Download our Marketing PowerPoint Templates because Our PowerPoint Templates and Slides offer you the widest possible range of options. Present our Shapes PowerPoint Templates because Your success is our commitment. Our PowerPoint Templates and Slides will ensure you reach your goal. Download and present our Business PowerPoint Templates because Our PowerPoint Templates and Slides will provide you the cutting edge. Slice through the doubts in the minds of your listeners.Use these PowerPoint slides for presentations relating to Pie, chart, round, flow, slices, steps, process, graph, wheel, corporate, business, blank, curving, diagram, copyspace, graphic,directional, shape, modern, cycle, illustration, circular, clipart, stages, segments, colorful, clip,infographic, art, work, clockwise, financial, five. The prominent colors used in the PowerPoint template are Green, Black, Gray. Our Growth Illustration Of 5 Stages Pie Chart Ppt Businessplans PowerPoint Slides are exceptionally customer-centric. They put clients before everything else.
Template For Organizational Chart Of Multidimensional Data 4 Stages PowerPoint Templates
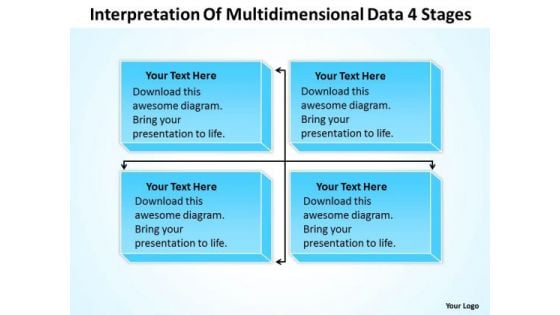
We present our template for organizational chart of multidimensional data 4 stages powerpoint templates.Use our Advertising PowerPoint Templates because You can Rise to the occasion with our PowerPoint Templates and Slides. You will bring your audience on their feet in no time. Present our Leadership PowerPoint Templates because Our PowerPoint Templates and Slides team portray an attitude of elegance. Personify this quality by using them regularly. Download our Arrows PowerPoint Templates because You can Connect the dots. Fan expectations as the whole picture emerges. Download our Org Charts PowerPoint Templates because Our PowerPoint Templates and Slides will let you Clearly mark the path for others to follow. Present our Business PowerPoint Templates because Our PowerPoint Templates and Slides are specially created by a professional team with vast experience. They diligently strive to come up with the right vehicle for your brilliant Ideas. Use these PowerPoint slides for presentations relating to Chart, flow, organization, flowchart, diagram, sitemap, process, box, arrow, graph, business, graphical, data, design, important, rectangle, corporate, plan, president, concept, hierarchy, glossy, teamwork, tier, chain, supervisor, relation, steps, glassy, connection, ladder, administration, group, connect, organize, connectivity, site-map, office, financial, structure, officer, glass. The prominent colors used in the PowerPoint template are Blue, Gray, Black. Be treated as an equal with our Template For Organizational Chart Of Multidimensional Data 4 Stages PowerPoint Templates. Feel the bonhomie of your peers.
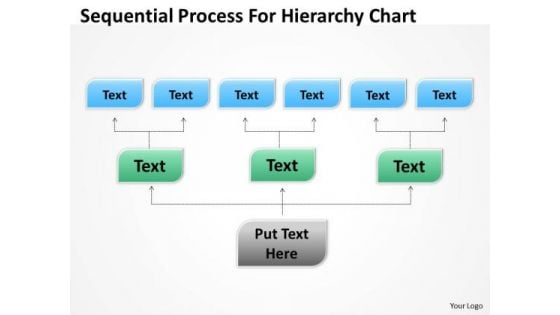
Template For Organizational Chart Sequential Process Hierarchy PowerPoint Templates
We present our template for organizational chart sequential process hierarchy powerpoint templates.Use our Advertising PowerPoint Templates because Our PowerPoint Templates and Slides will let your team Walk through your plans. See their energy levels rise as you show them the way. Download our Leadership PowerPoint Templates because Our PowerPoint Templates and Slides will let your words and thoughts hit bullseye everytime. Present our Arrows PowerPoint Templates because Your ideas provide food for thought. Our PowerPoint Templates and Slides will help you create a dish to tickle the most discerning palate. Present our Org Charts PowerPoint Templates because Our PowerPoint Templates and Slides are effectively colour coded to prioritise your plans They automatically highlight the sequence of events you desire. Present our Business PowerPoint Templates because Our PowerPoint Templates and Slides will let Your superior ideas hit the target always and everytime.Use these PowerPoint slides for presentations relating to Chart, flow, organization, flowchart, diagram, sitemap, process, box, arrow, graph, business, graphical, data, design, important, rectangle, corporate, plan, president, concept, hierarchy, glossy, teamwork, tier, chain, supervisor, relation, steps, glassy, connection, ladder, administration, group, connect, organize, connectivity, site-map, office, financial, structure, officer, glass. The prominent colors used in the PowerPoint template are Green, Blue, Black. Dispatch your thoughts on our Template For Organizational Chart Sequential Process Hierarchy PowerPoint Templates. They will take them the farthest possible.
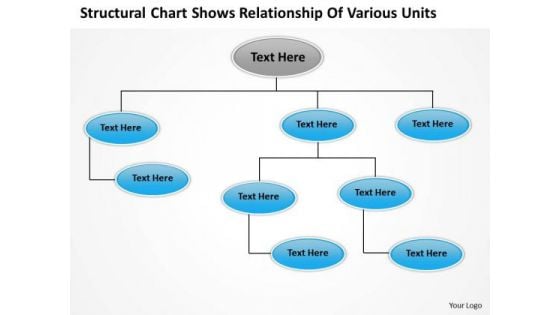
Template For Organizational Chart Shows Relationship Of Various Units PowerPoint Templates
We present our template for organizational chart shows relationship of various units powerpoint templates.Download our Advertising PowerPoint Templates because Timeline crunches are a fact of life. Meet all deadlines using our PowerPoint Templates and Slides. Download our Leadership PowerPoint Templates because Our PowerPoint Templates and Slides offer you the widest possible range of options. Download our Arrows PowerPoint Templates because Our PowerPoint Templates and Slides are conceived by a dedicated team. Use them and give form to your wondrous ideas. Use our Org Charts PowerPoint Templates because It is Aesthetically crafted by artistic young minds. Our PowerPoint Templates and Slides are designed to display your dexterity. Download and present our Business PowerPoint Templates because Your audience will believe you are the cats whiskers.Use these PowerPoint slides for presentations relating to Chart, flow, organization, flowchart, diagram, sitemap, process, box, arrow, graph, business, graphical, data, design, important, rectangle, corporate, plan, president, concept, hierarchy, glossy, teamwork, tier, chain, supervisor, relation, steps, glassy, connection, ladder, administration, group, connect, organize, connectivity, site-map, office, financial, structure, officer, glass. The prominent colors used in the PowerPoint template are Blue, Gray, Black. Fact of the matter is that you have great ideas. Drive this ability home with our Template For Organizational Chart Shows Relationship Of Various Units PowerPoint Templates.
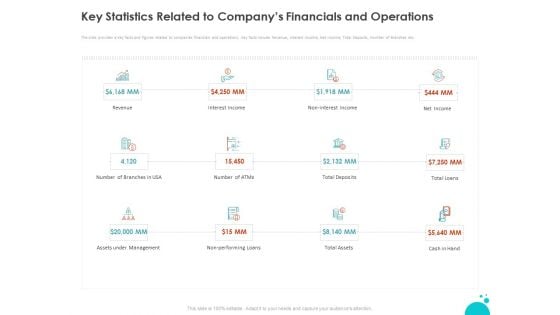
Investment Pitch For Aftermarket Key Statistics Related To Companys Financials And Operations Portrait
Presenting this set of slides with name investment pitch for aftermarket key statistics related to companys financials and operations portrait. This is a twelve stage process. The stages in this process are revenue, interest income, non interest income, net income, number branches, number atms, total deposits, total loans, assets under management, non performing loans, total assets, cash hand. This is a completely editable PowerPoint presentation and is available for immediate download. Download now and impress your audience.
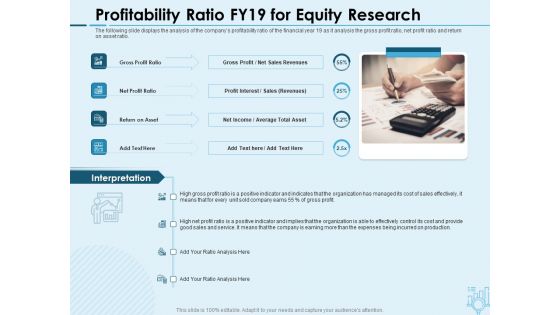
Assessing Stocks In Financial Market Profitability Ratio FY19 For Equity Research Ppt PowerPoint Presentation Background PDF
Presenting this set of slides with name assessing stocks in financial market profitability ratio fy19 for equity research ppt powerpoint presentation background pdf. This is a four stage process. The stages in this process are gross profit ratio, net profit ratio, return asset, gross profit, net sales revenues. This is a completely editable PowerPoint presentation and is available for immediate download. Download now and impress your audience.
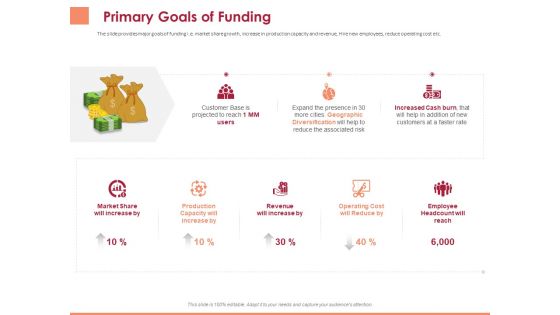
Pitch Deck To Raise Funding From Equity Crowdfunding Primary Goals Of Funding Ppt Layouts Graphics PDF
Presenting this set of slides with name pitch deck to raise funding from equity crowdfunding primary goals of funding ppt layouts graphics pdf. This is a eight stage process. The stages in this process are customer base is projected to reach, expand the presence, increased cash burn, market share increase production capacity increase, revenue increase, operating cost reduce, employee headcount reach. This is a completely editable PowerPoint presentation and is available for immediate download. Download now and impress your audience.
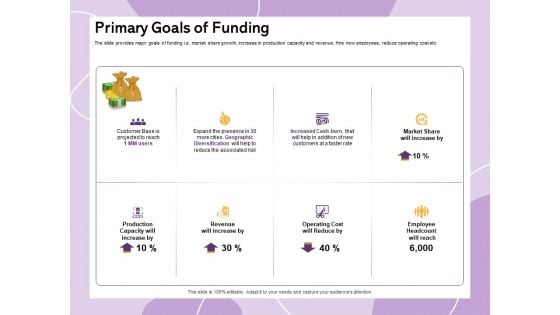
Investor Presentation For Society Funding Primary Goals Of Funding Ppt PowerPoint Presentation Slides Graphics Pictures PDF
Presenting this set of slides with name investor presentation for society funding primary goals of funding ppt powerpoint presentation slides graphics pictures pdf. This is a eight stage process. The stages in this process are customer base, projected reach, expand presence, geographic diversification, increased cash burn, market share increase, production capacity increase, revenue, operating cost, employee headcount reach. This is a completely editable PowerPoint presentation and is available for immediate download. Download now and impress your audience.
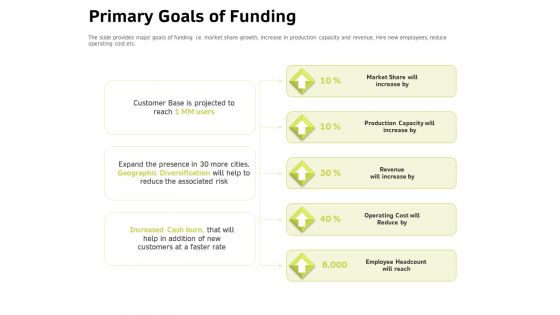
Customer Relationship Management In Freehold Property Primary Goals Of Funding Ppt Ideas Vector PDF
Presenting this set of slides with name customer relationship management in freehold property primary goals of funding ppt ideas vector pdf. This is a five stage process. The stages in this process are customer base, projected reach, expand presence, geographic diversification, increased cash burn, market share increase, production capacity increase, revenue, operating cost, employee headcount reach. This is a completely editable PowerPoint presentation and is available for immediate download. Download now and impress your audience.
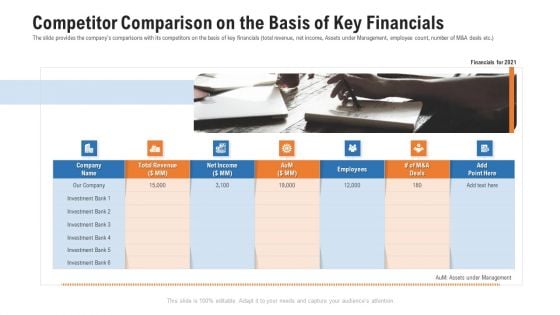
Pitch Deck For Procurement Deal Competitor Comparison On The Basis Of Key Financials Pictures PDF
The slide provides the companys comparisons with its competitors on the basis of key financials total revenue, net income, Assets under Management, employee count, number of M and A deals etc. This is a pitch deck for procurement deal competitor comparison on the basis of key financials pictures pdf template with various stages. Focus and dispense information on one stage using this creative set, that comes with editable features. It contains large content boxes to add your information on topics like net income, total revenue, competitor comparison on the basis of key financials. You can also showcase facts, figures, and other relevant content using this PPT layout. Grab it now.
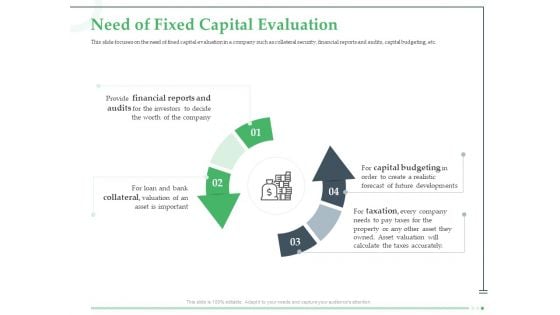
Funds Requisite Evaluation Need Of Fixed Capital Evaluation Portrait PDF
Presenting this set of slides with name funds requisite evaluation need of fixed capital evaluation portrait pdf. This is a four stage process. The stages in this process are financial, investors, valuation, taxation, capital budgeting. This is a completely editable PowerPoint presentation and is available for immediate download. Download now and impress your audience.
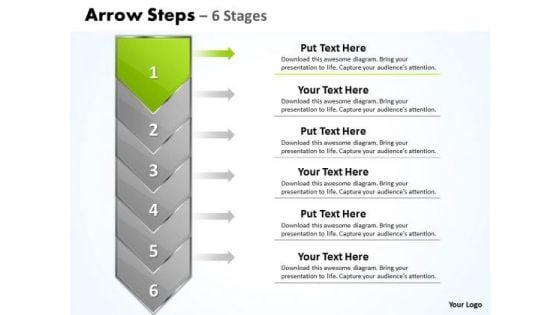
Process PowerPoint Template Arrow 6 Stages 1 Communication Skills Design
We present our process PowerPoint template arrow 6 stages 1 communication skills design. Use our Abstract PowerPoint Templates because; now imprint them on the minds of your audience via our slides. Use our Symbol PowerPoint Templates because, Its also been said that prevention is better than cure, either way you have a store of knowledge for sure. Use our Arrows PowerPoint Templates because, aesthetically designed to make a great first impression this template highlights. Use our Business PowerPoint Templates because, they are indicators of the path you have in mind. Use our Process and Flows PowerPoint Templates because, Brainstorming Light Bulbs: - The atmosphere in the workplace is electric. Use these PowerPoint slides for presentations relating to Arrow, Background, Business, Chart, Diagram, Financial, Graphic, Gray, Icon, Illustration, Management, Orange, Perspective, Planning, Process, Process, Stages, Steps, Text. The prominent colors used in the PowerPoint template are Green, Gray, and Black Announce your arrival on the stage with our Process PowerPoint Template Arrow 6 Stages 1 Communication Skills Design. They allow you to make a grand entry,
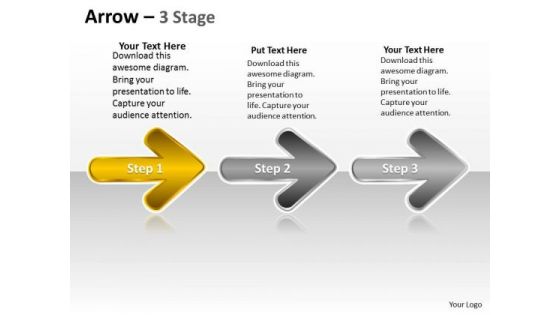
Ppt Series Of Continual New Sales Representation Video PowerPoint Templates Plan 2 Image
We present our PPT series of continual new sales representation video PowerPoint templates plan 2 Image. Use our Arrows PowerPoint Templates because, Corporate Ladder:- The graphic is a symbol of growth and success. Use our Symbol PowerPoint Templates because; Use them to help you organize the logic of your views. Use our Metaphor PowerPoint Templates because; Break it all down to Key Result Areas. Use our Process and Flows PowerPoint Templates because, Timelines Template:- Getting it done may not be enough. Use our Business PowerPoint Templates because, Present your views using our innovative slides and be assured of leaving a lasting impression. Use these PowerPoint slides for presentations relating to arrow, background, business, chart, diagram, financial, graphic, gray, icon, illustration, management, orange, perspective, planning, process, stages, steps, text. The prominent colors used in the PowerPoint template are Yellow, Gray, and Black Break through the farce with your thoughts. Take a dive into the facts with our Ppt Series Of Continual New Sales Representation Video PowerPoint Templates Plan 2 Image.
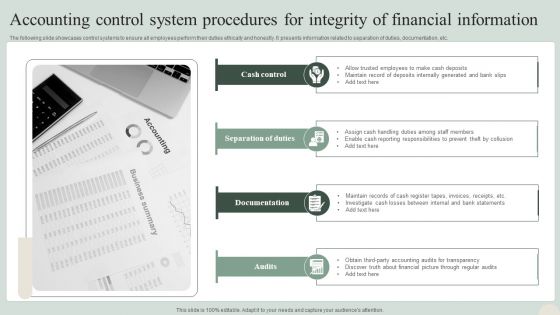
Accounting Control System Procedures For Integrity Of Financial Information Mockup PDF
The following slide showcases control systems to ensure all employees perform their duties ethically and honestly. It presents information related to separation of duties, documentation, etc. Presenting Accounting Control System Procedures For Integrity Of Financial Information Mockup PDF to dispense important information. This template comprises four stages. It also presents valuable insights into the topics including Documentation, Separation Of Duties, Cash Control. This is a completely customizable PowerPoint theme that can be put to use immediately. So, download it and address the topic impactfully.

Weekly Report On Corporate Product Sales Portrait Pdf
Mentioned slide showcases weekly product sales report to inform management about revenue growth. It comprises of components such as price per unit, units sold and total sales for four weeks. Showcasing this set of slides titled Weekly Report On Corporate Product Sales Portrait Pdf. The topics addressed in these templates are Weekly Report, Corporate Product Sales. All the content presented in this PPT design is completely editable. Download it and make adjustments in color, background, font etc. as per your unique business setting. Mentioned slide showcases weekly product sales report to inform management about revenue growth. It comprises of components such as price per unit, units sold and total sales for four weeks.
Major Components For Corporate Economic Planning Ppt PowerPoint Presentation Icon Ideas PDF
This slide showcase key elements for Financials and accounting planning. It includes major activities such as-inter organization accounting management, spend assessment and management, monitor and assessment of Financials etc. Persuade your audience using this major components for corporate economic planning ppt powerpoint presentation icon ideas pdf. This PPT design covers six stages, thus making it a great tool to use. It also caters to a variety of topics including record to report, expenditure cycle, income cycle. Download this PPT design now to present a convincing pitch that not only emphasizes the topic but also showcases your presentation skills.

Money Network Marketing Ppt PowerPoint Presentation Show Outline Cpb
This is a money network marketing ppt powerpoint presentation show outline cpb. This is a four stage process. The stages in this process are money network marketing, management, marketing, business.
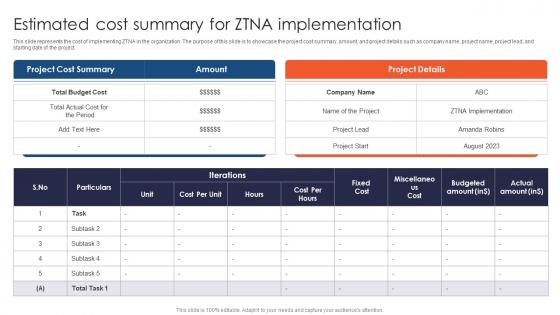
Zero Trust Network Access Estimated Cost Summary For ZTNA Implementation
This slide represents the cost of implementing ZTNA in the organization. The purpose of this slide is to showcase the project cost summary, amount, and project details such as company name, project name, project lead, and starting date of the project. Are you searching for a Zero Trust Network Access Estimated Cost Summary For ZTNA Implementation that is uncluttered, straightforward, and original Its easy to edit, and you can change the colors to suit your personal or business branding. For a presentation that expresses how much effort you have put in, this template is ideal With all of its features, including tables, diagrams, statistics, and lists, its perfect for a business plan presentation. Make your ideas more appealing with these professional slides. Download Zero Trust Network Access Estimated Cost Summary For ZTNA Implementation from Slidegeeks today. This slide represents the cost of implementing ZTNA in the organization. The purpose of this slide is to showcase the project cost summary, amount, and project details such as company name, project name, project lead, and starting date of the project.


 Continue with Email

 Home
Home


