Business Tax
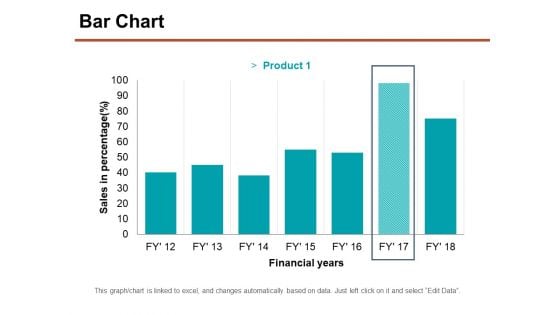
Bar Chart Ppt PowerPoint Presentation Professional Graphics Download
This is a bar chart ppt powerpoint presentation professional graphics download. This is a seven stage process. The stages in this process are sales in percentage, financial years, chart, business.
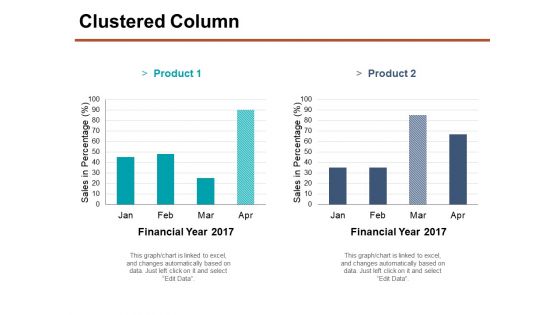
Clustered Column Ppt PowerPoint Presentation Portfolio Smartart
This is a clustered column ppt powerpoint presentation portfolio smartart. This is a two stage process. The stages in this process are financial year, product, sales in percentage, finance, business, graph.
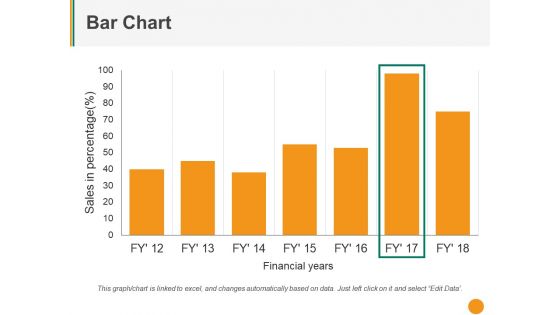
Bar Chart Ppt PowerPoint Presentation Styles Outfit
This is a bar chart ppt powerpoint presentation styles outfit. This is a Seven stage process. The stages in this process are sales in percentage, financial years, graph, business.
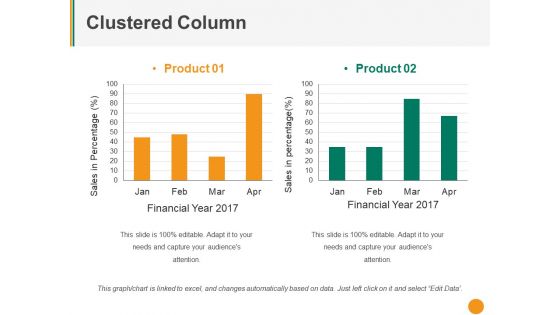
Clustered Column Ppt PowerPoint Presentation Pictures Mockup
This is a clustered column ppt powerpoint presentation pictures mockup. This is a two stage process. The stages in this process are product, sales in percentage, financial year, graph, business.
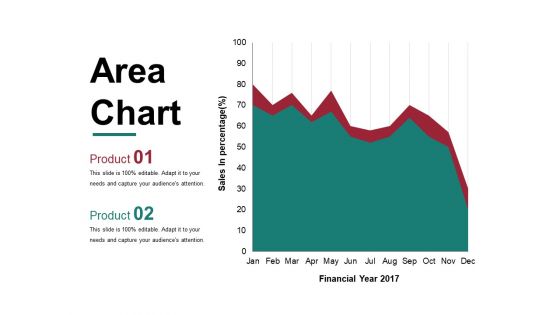
Area Chart Ppt PowerPoint Presentation Layouts Maker
This is a area chart ppt powerpoint presentation layouts maker. This is a two stage process. The stages in this process are financial year, sales in percentage, graph, business, marketing.
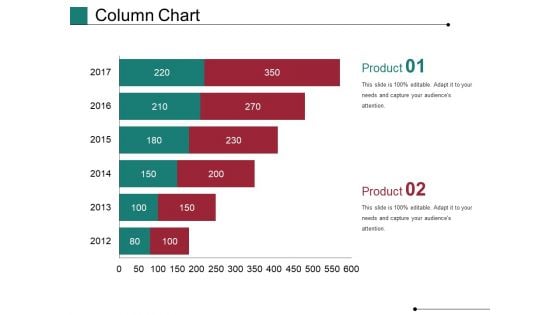
Column Chart Ppt PowerPoint Presentation Show Master Slide
This is a column chart ppt powerpoint presentation show master slide. This is a six stage process. The stages in this process are financial, years, business, marketing, finance, graph.
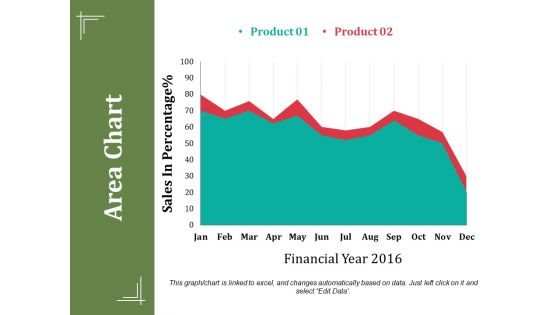
Area Chart Ppt PowerPoint Presentation Summary Show
This is a area chart ppt powerpoint presentation summary show. This is a two stage process. The stages in this process are sales in percentage, financial year, business, marketing, finance.
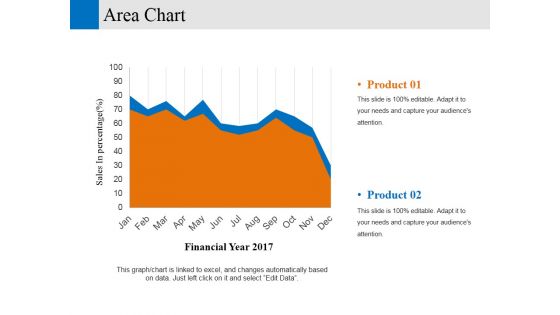
area chart ppt powerpoint presentation professional elements
This is a area chart ppt powerpoint presentation professional elements. This is a two stage process. The stages in this process are financial year sales in percentage, business, marketing, graph.
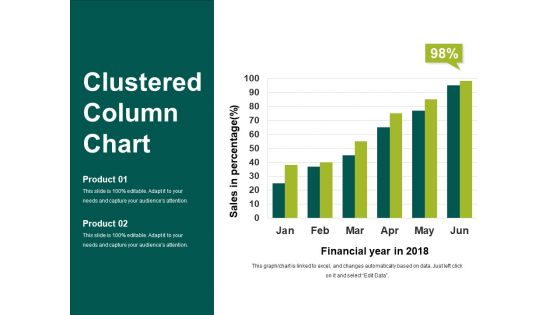
Clustered Column Chart Ppt PowerPoint Presentation Show Slideshow
This is a clustered column chart ppt powerpoint presentation show slideshow. This is a six stage process. The stages in this process are financial year in, sales in percentage, business, marketing, finance.
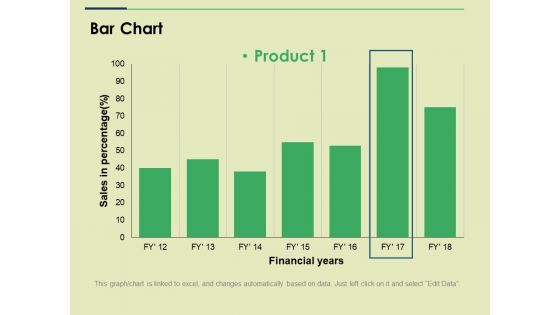
Bar Chart Ppt PowerPoint Presentation File Slide
This is a bar chart ppt powerpoint presentation file slide. This is a one stage process. The stages in this process are sales in percentage financial years, business, marketing, strategy, graph.
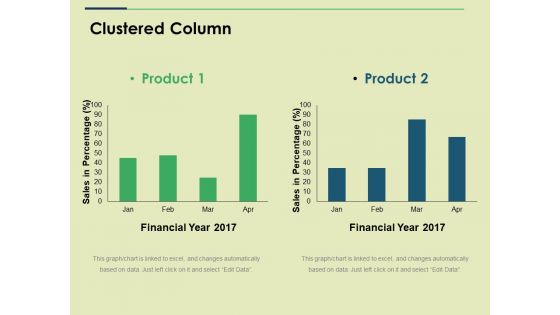
Clustered Column Ppt PowerPoint Presentation Show Graphics
This is a clustered column ppt powerpoint presentation show graphics. This is a two stage process. The stages in this process are financial year, sales in percentage, business, marketing, graph.
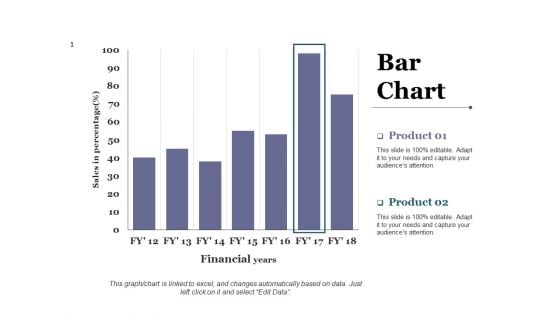
Bar Chart Ppt PowerPoint Presentation Diagram Lists
This is a bar chart ppt powerpoint presentation diagram lists. This is a two stage process. The stages in this process are business, marketing, financial years, sales in percentage, graph.
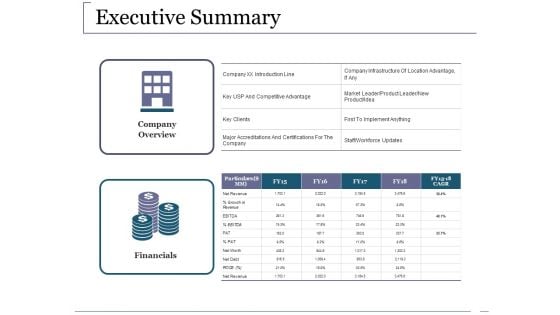
Executive Summary Ppt PowerPoint Presentation Layouts Example Topics
This is a executive summary ppt powerpoint presentation layouts example topics. This is a two stage process. The stages in this process are company overview, financials, particulars, business, marketing.
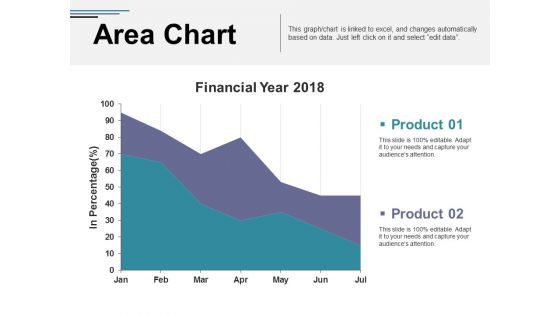
Area Chart Ppt PowerPoint Presentation Inspiration Professional
This is a area chart ppt powerpoint presentation inspiration professional. This is a two stage process. The stages in this process are financial year, in percentage, area chart, finance, business, marketing.
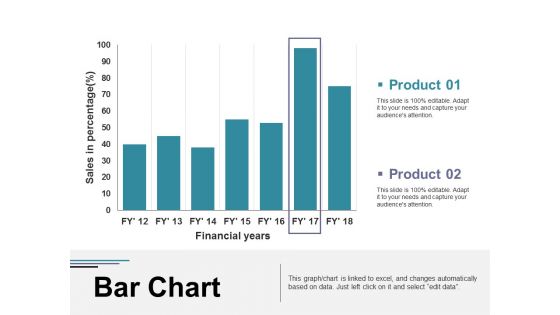
Bar Chart Ppt PowerPoint Presentation Visual Aids Diagrams
This is a bar chart ppt powerpoint presentation visual aids diagrams. This is a two stage process. The stages in this process are business, marketing, financial years, sales in percentage, graph.
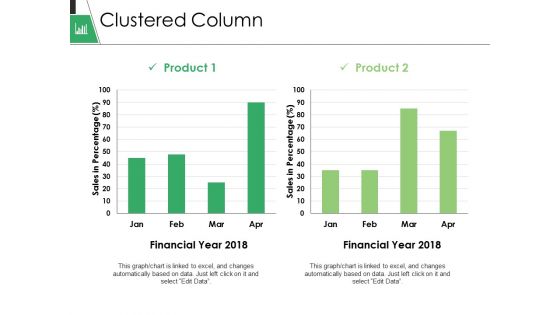
Clustered Column Ppt PowerPoint Presentation Gallery Format
This is a clustered column ppt powerpoint presentation gallery format. This is a two stage process. The stages in this process are business, marketing, graph, financial year, sales in percentage.
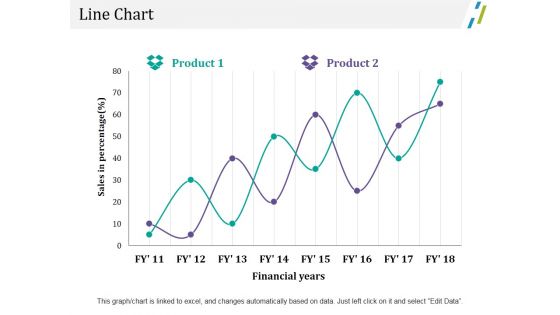
Line Chart Ppt PowerPoint Presentation Outline File Formats
This is a line chart ppt powerpoint presentation outline file formats. This is a two stage process. The stages in this process are business, marketing, sales in percentage, financial years, chart.
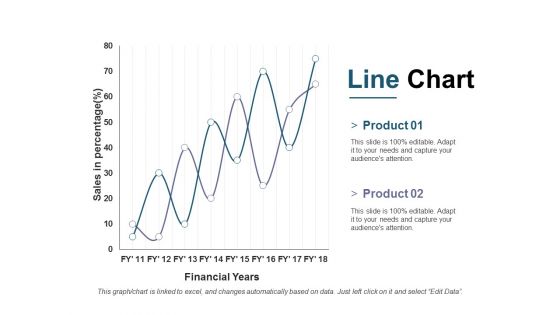
Line Chart Ppt PowerPoint Presentation Outline Ideas
This is a line chart ppt powerpoint presentation outline ideas. This is a two stage process. The stages in this process are business, marketing, financial years, sales in percentage, strategy.
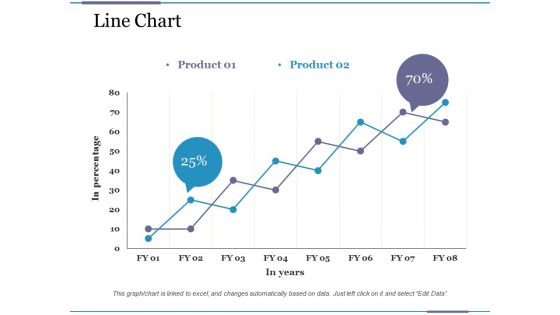
Line Chart Ppt PowerPoint Presentation Pictures File Formats
This is a line chart ppt powerpoint presentation pictures file formats. This is a two stage process. The stages in this process are business, financial, in percentage, in years, graph.
Column Chart Ppt PowerPoint Presentation Infographic Template Icon
This is a column chart ppt powerpoint presentation infographic template icon. This is a two stage process. The stages in this process are business, marketing, sales in percentage, financial year, graph.
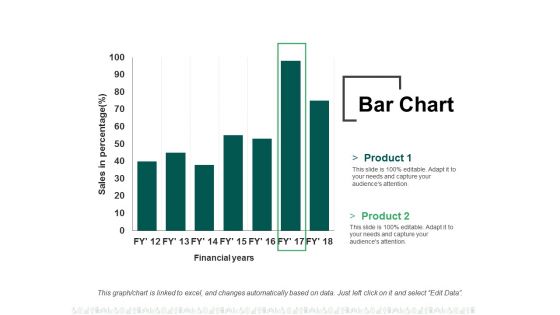
Bar Chart Ppt PowerPoint Presentation Summary File Formats
This is a bar chart ppt powerpoint presentation summary file formats. This is a two stage process. The stages in this process are business, finance, financial years, sales in percentage, graph.
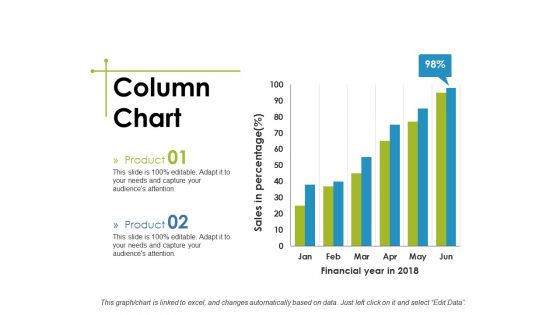
Column Chart Ppt PowerPoint Presentation Show Structure
This is a column chart ppt powerpoint presentation show structure. This is a two stage process. The stages in this process are business, financial year in, sales in percentage, marketing, graph.
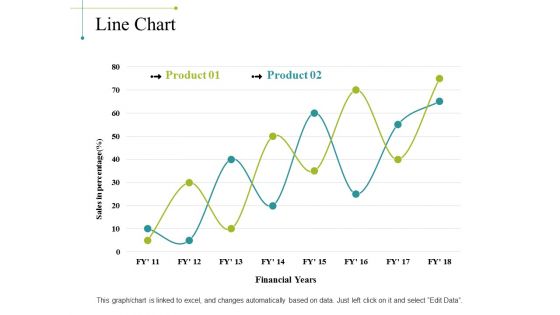
Line Chart Ppt PowerPoint Presentation Portfolio Background Image
This is a line chart ppt powerpoint presentation portfolio background image. This is a two stage process. The stages in this process are sales in percentage, financial years, chart, business, marketing, finance.
Area Chart Ppt PowerPoint Presentation Icon Aids
This is a area chart ppt powerpoint presentation icon aids. This is a three stage process. The stages in this process are financial years, sales in percentage, business, marketing, graph.
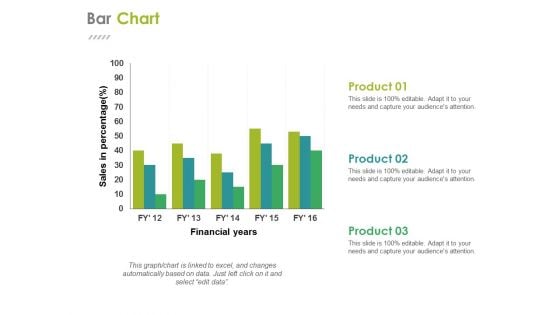
Bar Chart Ppt PowerPoint Presentation Summary Themes
This is a bar chart ppt powerpoint presentation summary themes. This is a three stage process. The stages in this process are financial years, sales in percentage, business, marketing, graph.
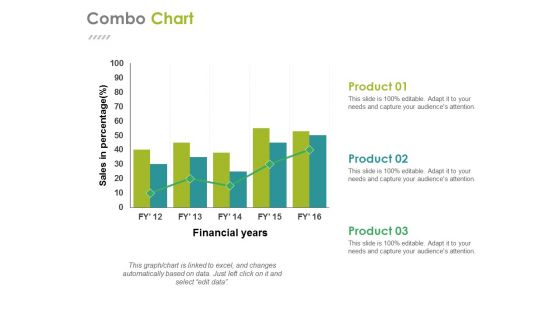
Combo Chart Ppt PowerPoint Presentation Gallery Design Ideas
This is a combo chart ppt powerpoint presentation gallery design ideas. This is a three stage process. The stages in this process are business, financial years, sales in percentage, finance, graph.
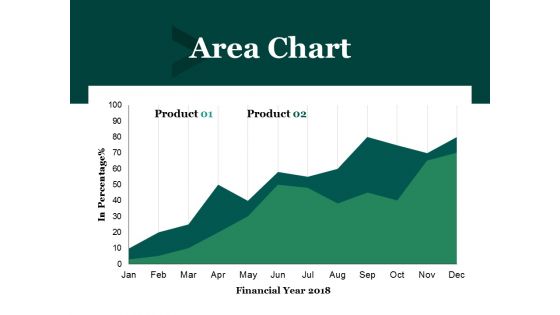
Area Chart Ppt PowerPoint Presentation Outline Graphics Pictures
This is a area chart ppt powerpoint presentation outline graphics pictures. This is a two stage process. The stages in this process are financial year, in percentage, business, marketing, finance.
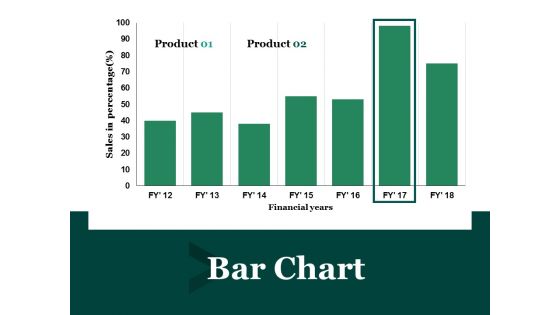
Bar Chart Ppt PowerPoint Presentation Layouts Template
This is a bar chart ppt powerpoint presentation layouts template. This is a two stage process. The stages in this process are financial year, sales in percentage, business, marketing, finance.
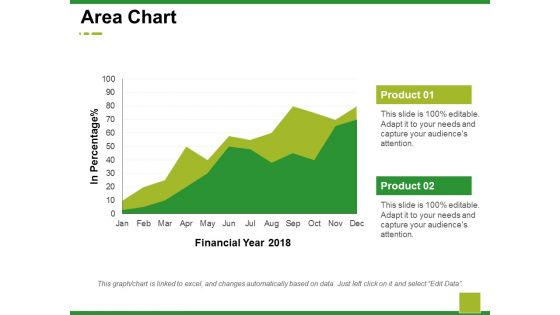
Area Chart Ppt PowerPoint Presentation Model Demonstration
This is a area chart ppt powerpoint presentation model demonstration. This is a two stage process. The stages in this process are business, marketing, financial year, in percentage, graph.
Bar Graph Ppt PowerPoint Presentation Infographics Icon
This is a bar graph ppt powerpoint presentation infographics icon. This is a two stage process. The stages in this process are business, marketing, financial year, in percentage, graph.
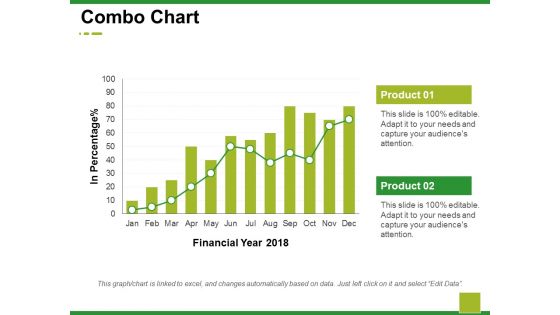
Combo Chart Ppt PowerPoint Presentation Summary Background Images
This is a combo chart ppt powerpoint presentation summary background images. This is a two stage process. The stages in this process are business, marketing, financial year, in percentage, graph.
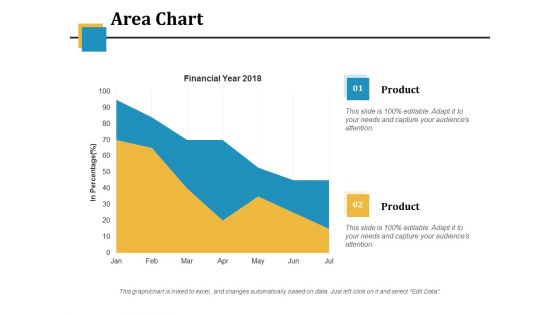
Area Chart Ppt PowerPoint Presentation Model Inspiration
This is a area chart ppt powerpoint presentation model inspiration. This is a two stage process. The stages in this process are financial year, in percentage, area chart, business, marketing.
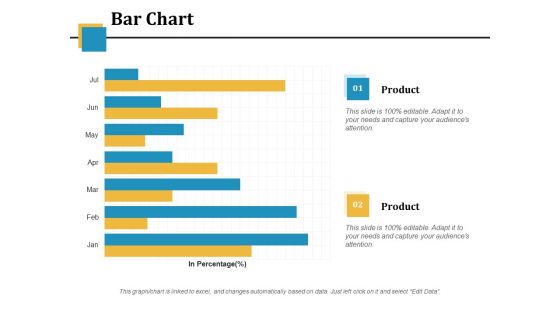
Bar Chart Ppt PowerPoint Presentation Infographic Template Picture
This is a bar chart ppt powerpoint presentation infographic template picture. This is a two stage process. The stages in this process are financial, in percentage, business, marketing, bar chart.
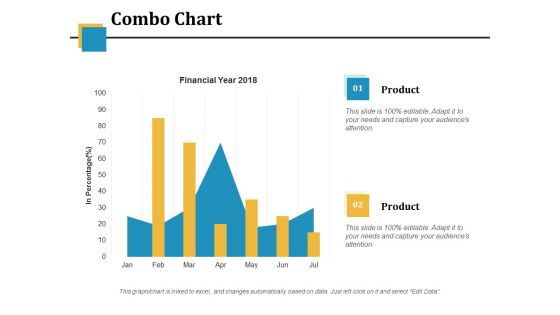
Combo Chart Ppt PowerPoint Presentation Model Vector
This is a combo chart ppt powerpoint presentation model vector. This is a two stage process. The stages in this process are financial year, in percentage, business, marketing, combo chart.
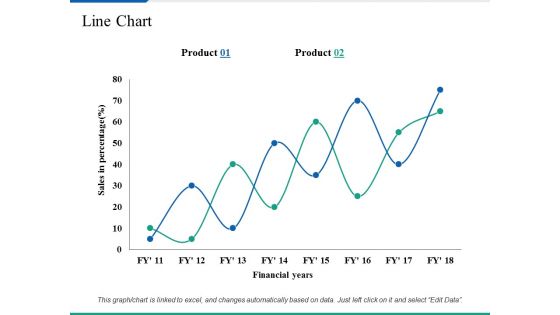
Line Chart Ppt PowerPoint Presentation Summary Clipart Images
This is a line chart ppt powerpoint presentation summary clipart images. This is a two stage process. The stages in this process are business, marketing, sales in percentage, financial years, strategy.

Area Chart Finance Ppt PowerPoint Presentation Infographics Layouts
This is a area chart finance ppt powerpoint presentation infographics layouts. This is a one stages process. The stages in this process are area chart, financial, marketing, planning, business.
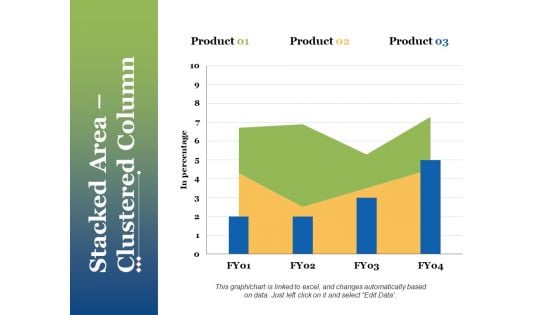
Stacked Area Clustered Column Ppt PowerPoint Presentation Portfolio Sample
This is a stacked area clustered column ppt powerpoint presentation portfolio sample. This is a three stage process. The stages in this process are stacked area, clustered column, financial, strategy, business, planning.
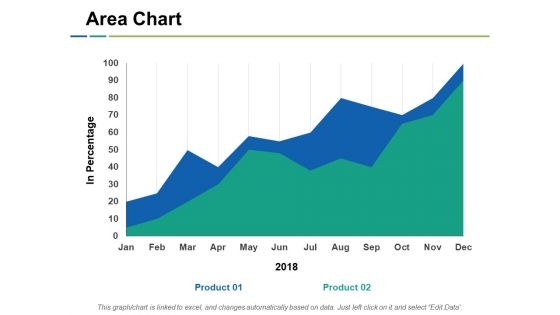
Area Chart Ppt PowerPoint Presentation Model Slide Portrait
This is a area chart ppt powerpoint presentation model slide portrait. This is a two stage process. The stages in this process are area chart, financial, business, marketing, planning, strategy.
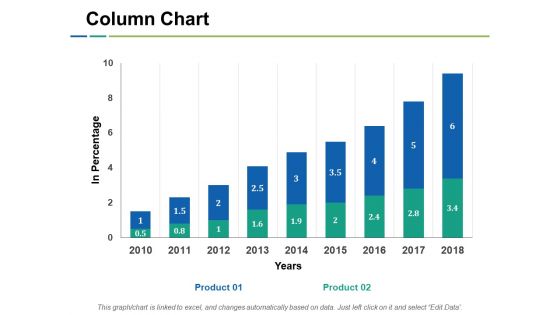
Column Chart Ppt PowerPoint Presentation Background Images
This is a column chart ppt powerpoint presentation background images. This is a two stage process. The stages in this process are column chart, financial, business, marketing, planning, strategy.

Content Distribution Matrix Ppt PowerPoint Presentation Professional Graphics Template
This is a content distribution matrix ppt powerpoint presentation professional graphics template. This is a two stage process. The stages in this process are business, management, financial, marketing, sales.
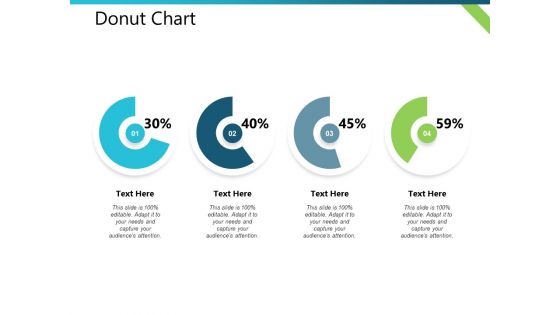
Donut Chart Distribution Plan Ppt PowerPoint Presentation Visual Aids Outline
This is a donut chart distribution plan ppt powerpoint presentation visual aids outline. This is a four stage process. The stages in this process are business, management, financial, marketing, strategy.

Employee Performance Measurement Kpi Ppt PowerPoint Presentation Inspiration Design Inspiration
This is a employee performance measurement kpi ppt powerpoint presentation inspiration design inspiration. This is a four stage process. The stages in this process are financial, business, management, marketing.
Social Media And Word Of Mouth Metrics Ppt Powerpoint Presentation Icon Portfolio
This is a social media and word of mouth metrics ppt powerpoint presentation icon portfolio. This is a ten stage process. The stages in this process are financial, marketing, analysis, investment, business.
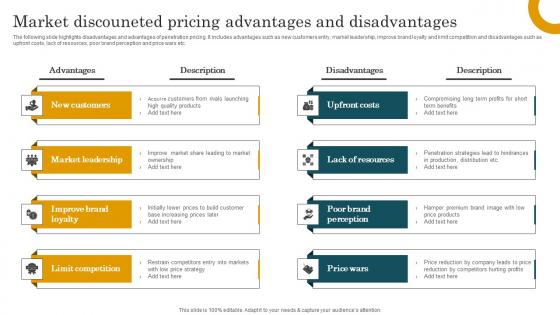
Market Discouneted Pricing Advantages And Disadvantages Designs Pdf
The following slide highlights disadvantages and advantages of penetration pricing. It includes advantages such as new customers entry, market leadership, improve brand loyalty and limit competition and disadvantages such as upfront costs, lack of resources, poor brand perception and price wars etc. Showcasing this set of slides titled Market Discouneted Pricing Advantages And Disadvantages Designs Pdf The topics addressed in these templates are New Customers, Market Leadership, Limit Competition All the content presented in this PPT design is completely editable. Download it and make adjustments in color, background, font etc. as per your unique business setting. The following slide highlights disadvantages and advantages of penetration pricing. It includes advantages such as new customers entry, market leadership, improve brand loyalty and limit competition and disadvantages such as upfront costs, lack of resources, poor brand perception and price wars etc.
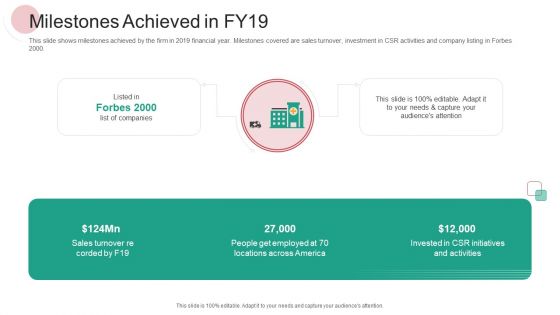
Real Capital Market Bid Assessment Milestones Achieved In FY19 Elements PDF
This slide shows milestones achieved by the firm in 2019 financial year. Milestones covered are sales turnover, investment in CSR activities and company listing in Forbes 2000.This is a real capital market bid assessment milestones achieved in fy19 elements pdf. template with various stages. Focus and dispense information on two stages using this creative set, that comes with editable features. It contains large content boxes to add your information on topics like sales, people get employed. You can also showcase facts, figures, and other relevant content using this PPT layout. Grab it now.
Corporate Video Your Investment For Corporate Video Production Services Price Ppt Outline Icon PDF
Presenting this set of slides with name corporate video your investment for corporate video production services price ppt outline icon pdf. This is a one stage process. The stages in this process are research, plan, edit, final review and output. This is a completely editable PowerPoint presentation and is available for immediate download. Download now and impress your audience.
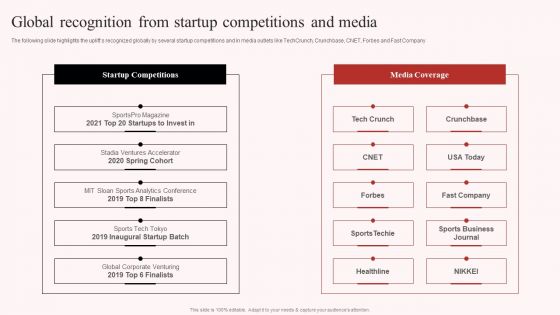
Uplift Capital Raising Pitch Deck Global Recognition From Startup Competitions And Media Microsoft PDF
The following slide highlights the uplifts recognized globally by several startup competitions and in media outlets like TechCrunch, Crunchbase, CNET, Forbes and Fast Company. Do you know about Slidesgeeks Uplift Capital Raising Pitch Deck Global Recognition From Startup Competitions And Media Microsoft PDF These are perfect for delivering any kind od presentation. Using it, create PowerPoint presentations that communicate your ideas and engage audiences. Save time and effort by using our pre designed presentation templates that are perfect for a wide range of topic. Our vast selection of designs covers a range of styles, from creative to business, and are all highly customizable and easy to edit. Download as a PowerPoint template or use them as Google Slides themes.
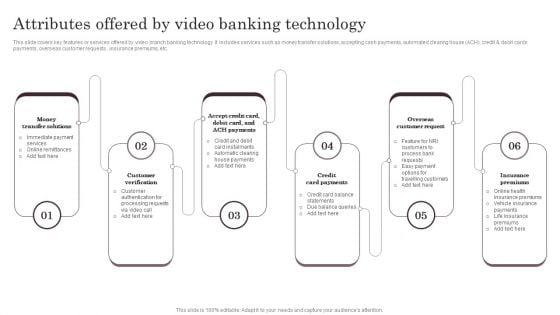
Omnichannel Services Solution In Financial Sector Attributes Offered By Video Banking Technology Guidelines PDF
This slide covers key features or services offered by video branch banking technology. It includes services such as money transfer solutions, accepting cash payments, automated clearing house ACH, credit and debit cards payments, overseas customer requests , insurance premiums, etc. Slidegeeks is here to make your presentations a breeze with Omnichannel Services Solution In Financial Sector Attributes Offered By Video Banking Technology Guidelines PDF With our easy to use and customizable templates, you can focus on delivering your ideas rather than worrying about formatting. With a variety of designs to choose from, you are sure to find one that suits your needs. And with animations and unique photos, illustrations, and fonts, you can make your presentation pop. So whether you are giving a sales pitch or presenting to the board, make sure to check out Slidegeeks first.
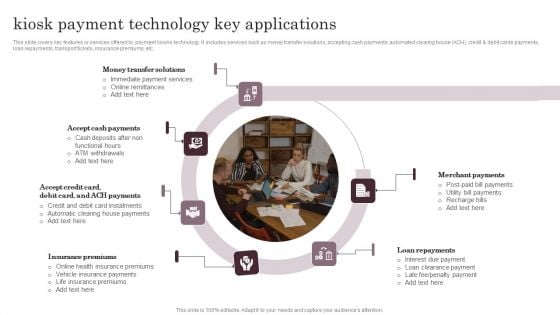
Omnichannel Services Solution In Financial Sector Kiosk Payment Technology Key Structure PDF
This slide covers key features or services offered by payment kiosks technology. It includes services such as money transfer solutions, accepting cash payments, automated clearing house ACH, credit and debit cards payments, loan repayments, transport tickets, insurance premiums, etc. Want to ace your presentation in front of a live audience Our Omnichannel Services Solution In Financial Sector Kiosk Payment Technology Key Structure PDF can help you do that by engaging all the users towards you. Slidegeeks experts have put their efforts and expertise into creating these impeccable powerpoint presentations so that you can communicate your ideas clearly. Moreover, all the templates are customizable, and easy to edit and downloadable. Use these for both personal and commercial use.
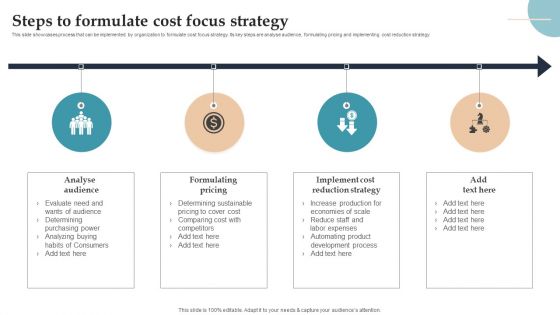
Product Rollout Techniques Steps To Formulate Cost Focus Strategy Guidelines PDF
This slide showcases process that can be implemented by organization to formulate cost focus strategy. Its key steps are analyse audience, formulating pricing and implementing cost reduction strategy. Present like a pro with Product Rollout Techniques Steps To Formulate Cost Focus Strategy Guidelines PDF Create beautiful presentations together with your team, using our easy-to-use presentation slides. Share your ideas in real-time and make changes on the fly by downloading our templates. So whether youre in the office, on the go, or in a remote location, you can stay in sync with your team and present your ideas with confidence. With Slidegeeks presentation got a whole lot easier. Grab these presentations today.
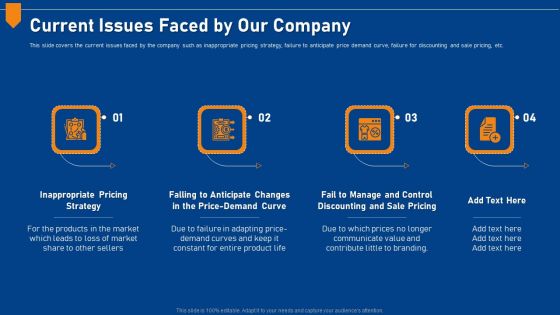
Evaluating Price Efficiency In Organization Current Issues Faced By Our Company Elements PDF
This slide covers the current issues faced by the company such as inappropriate pricing strategy, failure to anticipate price demand curve, failure for discounting and sale pricing, etc. This is a evaluating price efficiency in organization current issues faced by our company elements pdf template with various stages. Focus and dispense information on four stages using this creative set, that comes with editable features. It contains large content boxes to add your information on topics like inappropriate pricing strategy, price demand curve, control discounting and sale pricing. You can also showcase facts, figures, and other relevant content using this PPT layout. Grab it now.
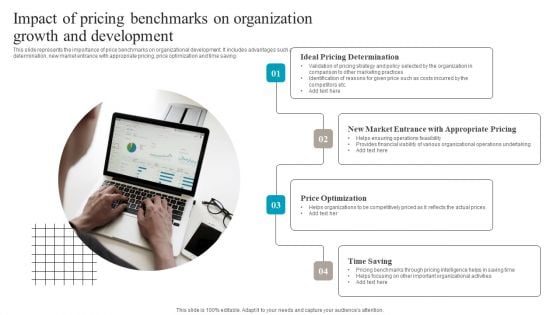
Impact Of Pricing Benchmarks On Organization Growth And Development Sample PDF
This slide represents the importance of price benchmarks on organizational development. It includes advantages such as ideal pricing determination, new market entrance with appropriate pricing, price optimization and time saving. Presenting Impact Of Pricing Benchmarks On Organization Growth And Development Sample PDF to dispense important information. This template comprises Four stages. It also presents valuable insights into the topics including Ideal Pricing Determination, Price Optimization, Time Saving. This is a completely customizable PowerPoint theme that can be put to use immediately. So, download it and address the topic impactfully.

Financial Ppt PowerPoint Presentation Outline Pictures
This is a financial ppt powerpoint presentation outline pictures. This is a three stage process. The stages in this process are minimum, medium, maximum.
Financial Ppt PowerPoint Presentation Icon Introduction
This is a financial ppt powerpoint presentation icon introduction. This is a four stage process. The stages in this disk space, data base, bandwich, accounts.
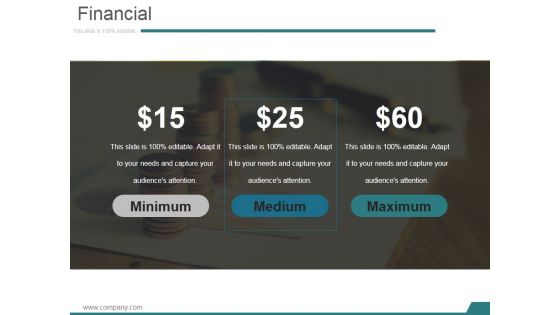
Financial Ppt PowerPoint Presentation Outline Diagrams
This is a financial ppt powerpoint presentation outline diagrams. This is a three stage process. The stages in this process are minimum, medium, maximum.
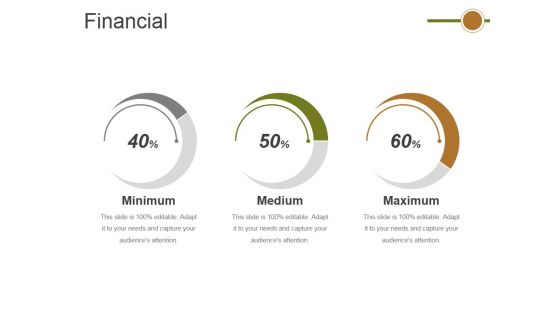
Financial Ppt PowerPoint Presentation Professional Good
This is a financial ppt powerpoint presentation professional good. This is a three stage process. The stages in this process are minimum, medium, maximum.
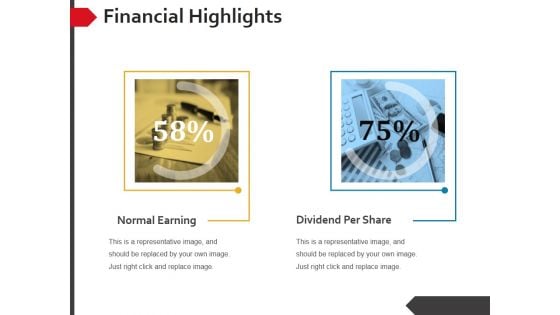
Financial Highlights Ppt PowerPoint Presentation Model Show
This is a financial highlights ppt powerpoint presentation model show. This is a two stage process. The stages in this process are normal earning, dividend per share.
Financial Projections Ppt PowerPoint Presentation Icon Show
This is a financial projections ppt powerpoint presentation icon show. This is a three stage process. The stages in this process are minimum, medium, maximum, icons, finance.
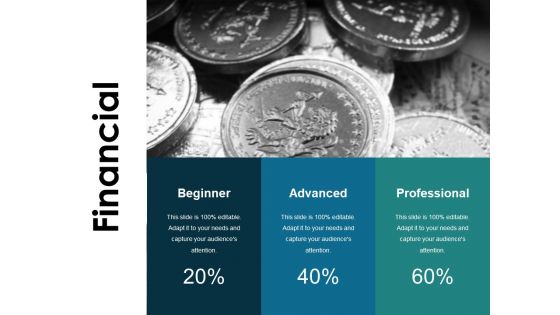
Financial Ppt PowerPoint Presentation Infographic Template
This is a financial ppt powerpoint presentation infographic template. This is a three stage process. The stages in this process are beginner, advanced, professional, finance, percentage.
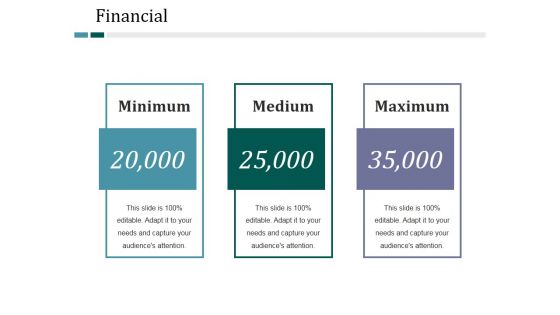
Financial Ppt PowerPoint Presentation Portfolio Clipart Images
This is a financial ppt powerpoint presentation portfolio clipart images. This is a three stage process. The stages in this process are minimum, medium, maximum.


 Continue with Email

 Home
Home


