Business Tax
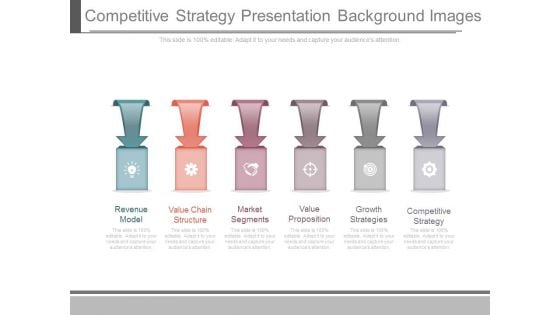
Competitive Strategy Presentation Background Images
This is a competitive strategy presentation background images. This is a six stage process. The stages in this process are revenue model, value chain structure, market segments, value proposition, growth strategies, competitive strategy.
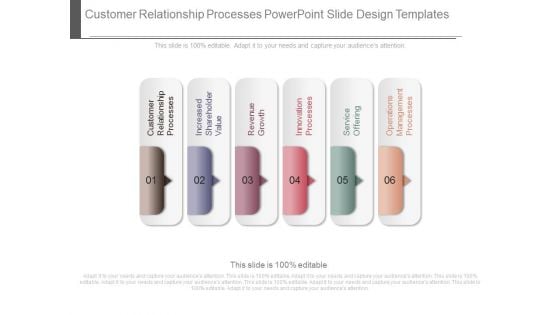
Customer Relationship Processes Powerpoint Slide Design Templates
This is a customer relationship processes powerpoint slide design templates. This is a six stage process. The stages in this process are customer relationship processes, increased shareholder value, revenue growth, innovation processes, service offering, operations management processes.
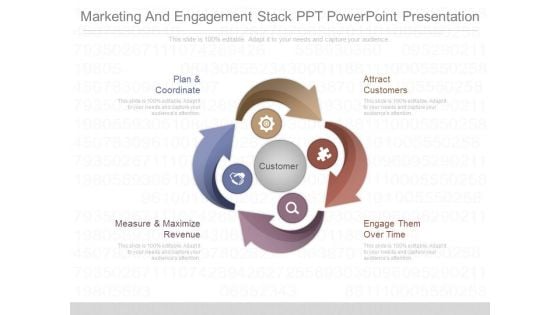
Marketing And Engagement Stack Ppt Powerpoint Presentation
This is a marketing and engagement stack ppt powerpoint presentation. This is a four stage process. The stages in this process are plan and coordinate, measure and maximize revenue, attract customers, engage them over time, customer.
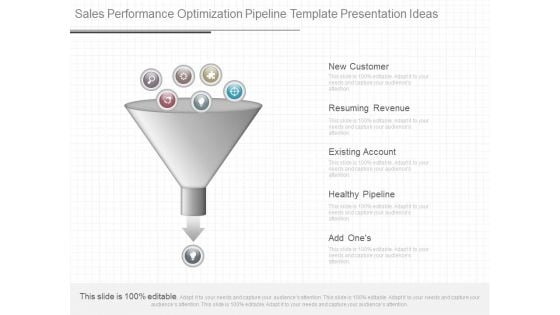
Sales Performance Optimization Pipeline Template Presentation Ideas
This is a sales performance optimization pipeline template presentation ideas. This is a five stage process. The stages in this process are new customer, resuming revenue, existing account, healthy pipeline, add ones.
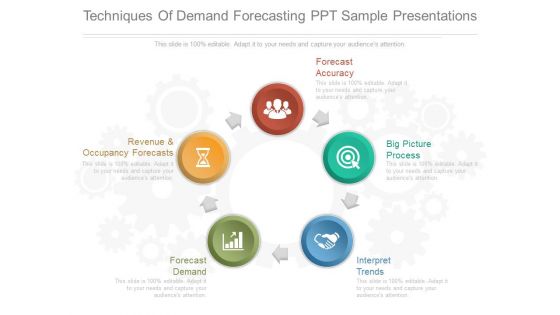
Techniques Of Demand Forecasting Ppt Sample Presentations
This is a techniques of demand forecasting ppt sample presentations. This is a five stage process. The stages in this process are revenue and occupancy forecasts, forecast accuracy, big picture process, interpret trends, forecast demand.
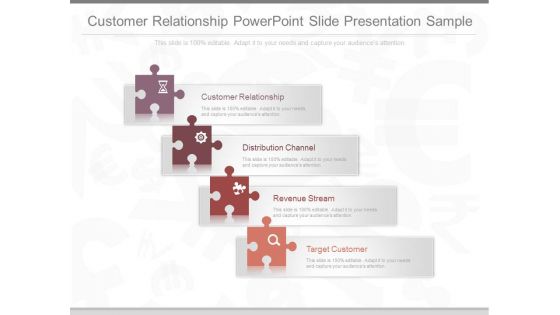
Customer Relationship Powerpoint Slide Presentation Sample
This is a customer relationship powerpoint slide presentation sample. This is a four stage process. The stages in this process are customer relationship, distribution channel, revenue stream, target customer.
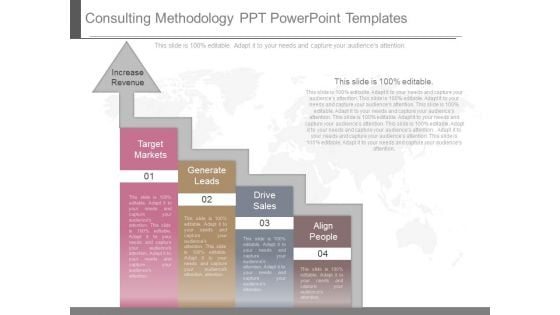
Consulting Methodology Ppt Powerpoint Templates
This is a consulting methodology ppt powerpoint templates. This is a four stage process. The stages in this process are target markets, increase revenue, generate leads, drive sales, align people.
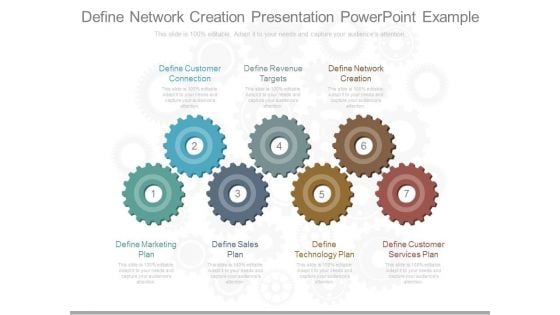
Define Network Creation Presentation Powerpoint Example
This is a define network creation presentation powerpoint example. This is a seven stage process. The stages in this process are define customer connection, define revenue targets, define network creation, define marketing plan, define technology plan, define customer services plan.\n\n\n\n
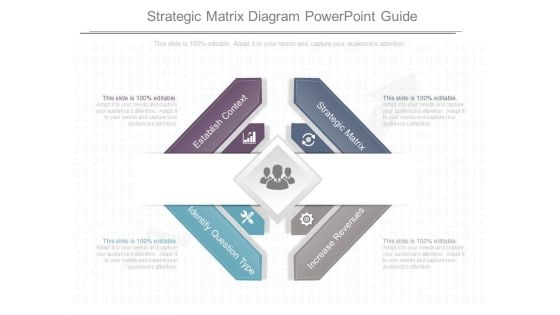
Strategic Matrix Diagram Powerpoint Guide
This is a strategic matrix diagram powerpoint guide. This is a four stage process. The stages in this process are establish , strategic matrix, increase revenues, identify question type.
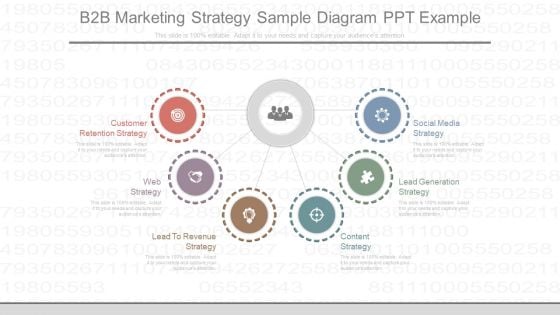
B2b Marketing Strategy Sample Diagram Ppt Example
This is a b2b marketing strategy sample diagram ppt example. This is a six stage process. The stages in this process are customer retention strategy, web strategy, lead to revenue strategy, content strategy, lead generation strategy, social media strategy.
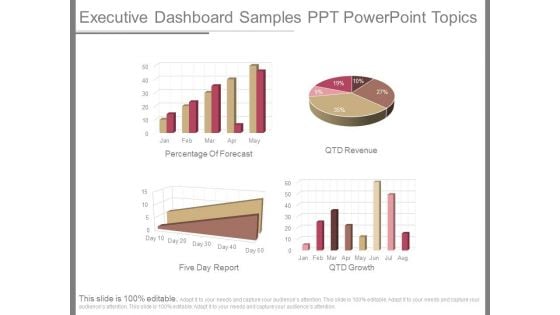
Executive Dashboard Samples Ppt Powerpoint Topics
This is a executive dashboard samples ppt powerpoint topics. This is a four stage process. The stages in this process are percentage of forecast, qtd revenue, five day report, qtd growth
Bi Dashboard Design For Solutions Ppt Powerpoint Slides
This is a bi dashboard design for solutions ppt powerpoint slides. This is a four stage process. The stages in this process are total understand, total brands, total revenue, total sales.
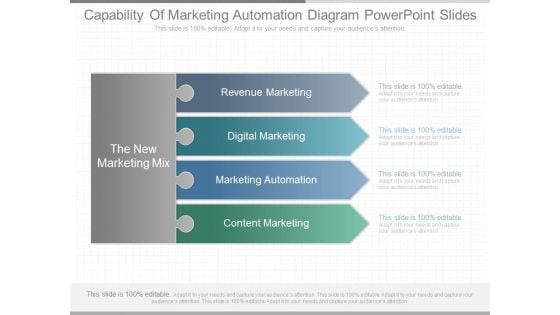
Capability Of Marketing Automation Diagram Powerpoint Slides
This is a capability of marketing automation diagram powerpoint slides. This is a four stage process. The stages in this process are the new marketing mix, revenue marketing, digital marketing, marketing automation, content marketing.
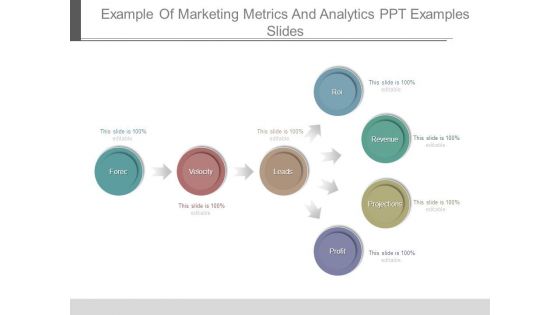
Example Of Marketing Metrics And Analytics Ppt Examples Slides
This is a example of marketing metrics and analytics ppt examples slides. This is a seven stage process. The stages in this process are forec, velocity, leads, roi, revenue, projections, profit.
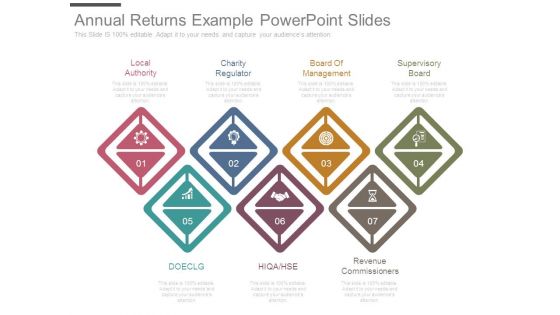
Annual Returns Example Powerpoint Slides
This is a annual returns example powerpoint slides. This is a seven stage process. The stages in this process are local authority, charity regulator, board of management, supervisory board, doeclg, hiqa hse, revenue commissioners.
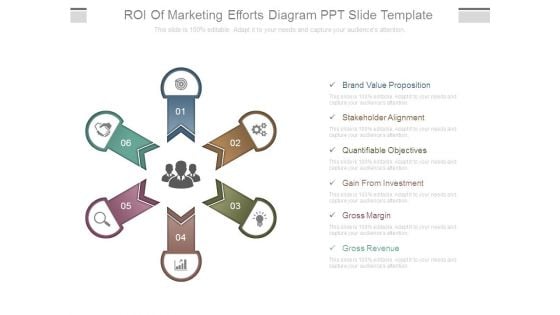
Roi Of Marketing Efforts Diagram Ppt Slide Template
This is a roi of marketing efforts diagram ppt slide template. This is a six stage process. The stages in this process are brand value proposition, stakeholder alignment, quantifiable objectives, gain from investment, gross margin, gross revenue.

Criteria Based Competition Comparison Table Powerpoint Slides
This is a criteria based competition comparison table powerpoint slides. This is a seven stage process. The stages in this process are revenue, profit, market share, main activity, number of employee, product quality.
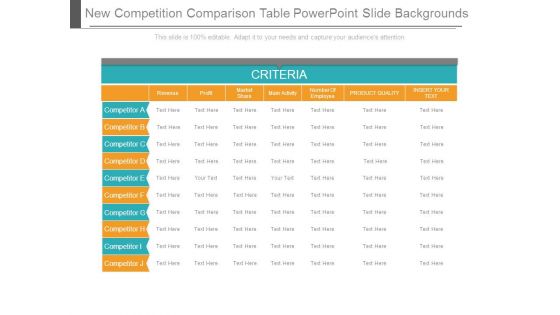
New Competition Comparison Table Powerpoint Slide Backgrounds
This is a new competition comparison table powerpoint slide backgrounds. This is a seven stage process. The stages in this process are revenue, profit, market share, main activity, number of employee, product quality, insert your text.
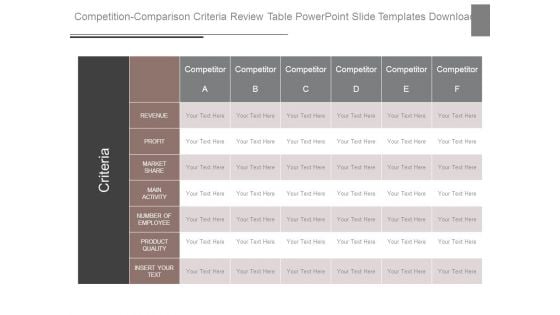
Competition Comparison Criteria Review Table Powerpoint Slide Templates Download
This is a competition comparison criteria review table powerpoint slide templates download. This is a six stage process. The stages in this process are criteria, competitor revenue, profit, market share, main activity, number of employee, product quality, insert your text.
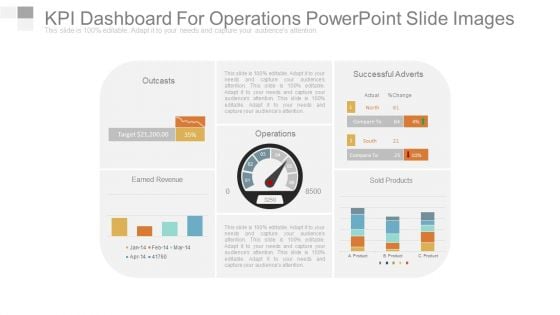
Kpi Dashboard For Operations Powerpoint Slide Images
This is a kpi dashboard for operations powerpoint slide images. This is a four stage process. The stages in this process are outcasts, earned revenue, operations, successful adverts, sold products.
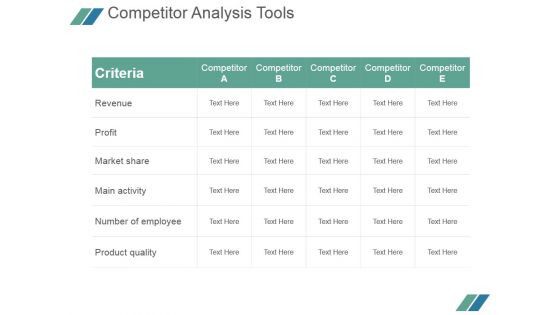
Competitor Analysis Tools Ppt PowerPoint Presentation Example File
This is a competitor analysis tools ppt powerpoint presentation example file. This is a five stage process. The stages in this process are criteria, revenue, profit, market share, main activity, number of employee, product quality.
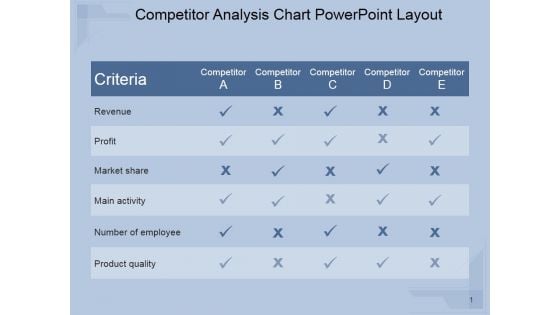
Competitor Analysis Chart Ppt PowerPoint Presentation Visuals
This is a competitor analysis chart ppt powerpoint presentation visuals. This is a five stage process. The stages in this process are revenue, profit, market share, main activity, number of employee, product quality.

Measuring Content Marketing Performance Ppt PowerPoint Presentation Design Ideas
This is a measuring content marketing performance ppt powerpoint presentation design ideas. This is a eight stage process. The stages in this process are conversion rate, quality of leads, website traffic, number of leads, sales revenue, subscriber list growth.
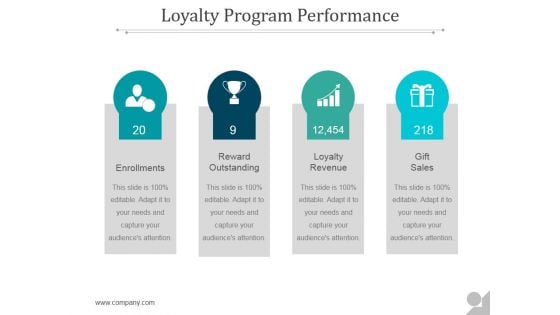
Loyalty Program Performance Ppt PowerPoint Presentation Tips
This is a loyalty program performance ppt powerpoint presentation tips. This is a four stage process. The stages in this process are enrollments, reward outstanding, loyalty revenue, gift sales.
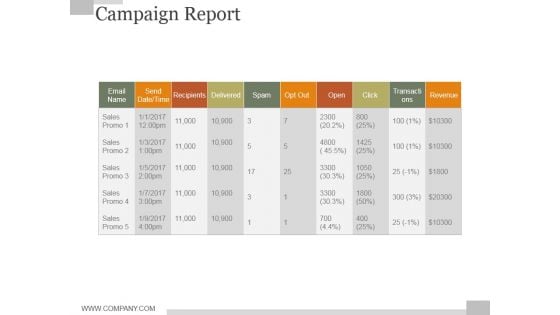
Campaign Report Ppt PowerPoint Presentation Example File
This is a campaign report ppt powerpoint presentation example file. This is a nine stage process. The stages in this process are send date time, recipients, delivered, spam, opt out, open, click, transactions, revenue.
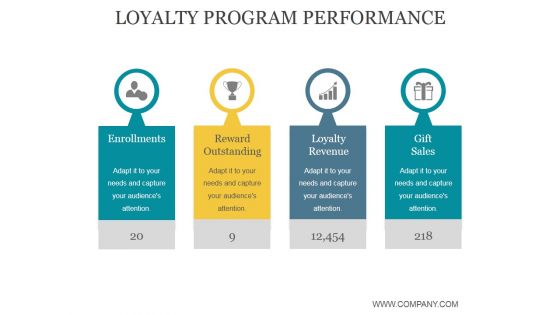
Loyalty Program Performance Ppt PowerPoint Presentation Portfolio
This is a loyalty program performance ppt powerpoint presentation portfolio. This is a four stage process. The stages in this process are enrollments, reward outstanding, loyalty revenue, gift sales.
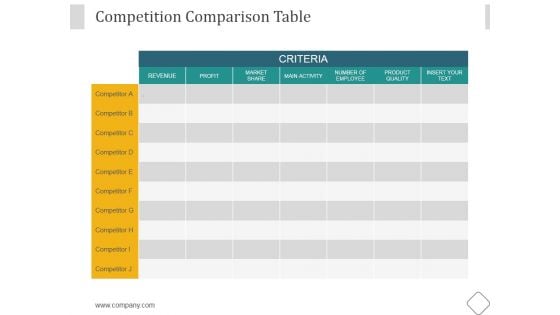
Competition Comparison Table Ppt PowerPoint Presentation Outline
This is a competition comparison table ppt powerpoint presentation outline. This is a seven stage process. The stages in this process are revenue, profit, market share, main activity, number of employee, product quality.
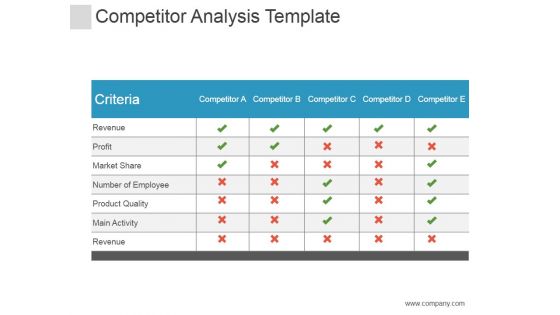
Competitor Analysis Template Ppt PowerPoint Presentation Guidelines
This is a competitor analysis template ppt powerpoint presentation guidelines. This is a five stage process. The stages in this process are revenue, profit, market share, competitor, number of employee.
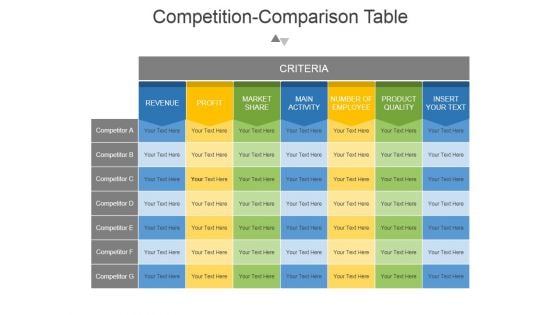
Competition Comparison Table Ppt PowerPoint Presentation Backgrounds
This is a competition comparison table ppt powerpoint presentation backgrounds. This is a seven stage process. The stages in this process are revenue, profit, market share , main activity, number of employee, product quality , insert your text.
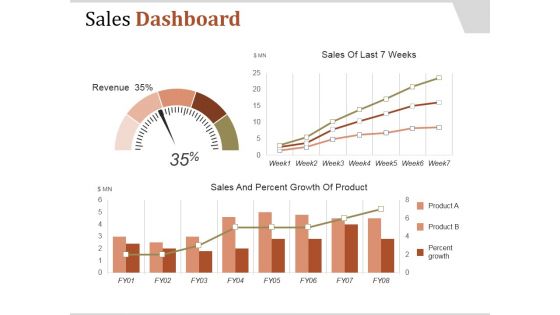
Sales Dashboard Template 1 Ppt PowerPoint Presentation Samples
This is a sales dashboard template 1 ppt powerpoint presentation samples. This is a one stage process. The stages in this process are sales and percent growth of product, revenue, product, percent growth.
Campaign Report Ppt PowerPoint Presentation Icon Visuals
This is a campaign report ppt powerpoint presentation icon visuals. This is a ten stage process. The stages in this process are email name, send date time, recipients, delivered, spam, opt out, revenue.
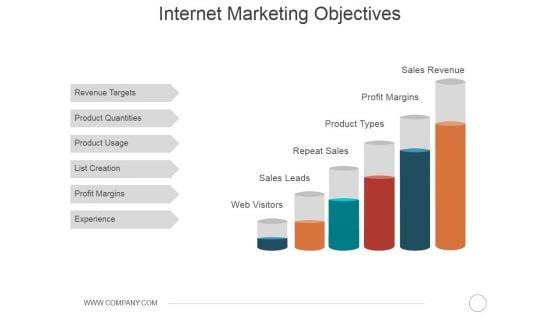
Internet Marketing Objectives Ppt PowerPoint Presentation Portfolio Summary
This is a internet marketing objectives ppt powerpoint presentation portfolio summary. This is a six stage process. The stages in this process are revenue targets, product quantities, product usage, list creation, profit margins, experience.
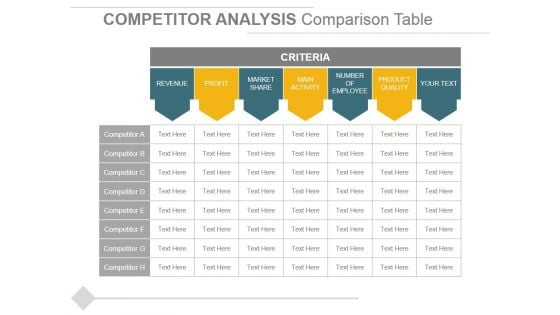
Competitor Analysis Comparison Table Ppt PowerPoint Presentation Outline Slides
This is a competitor analysis comparison table ppt powerpoint presentation outline slides. This is a two stage process. The stages in this process are revenue, profit, market share, main activity, number of employee, product quality.
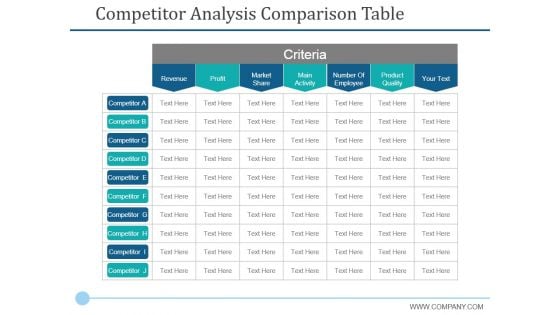
Competitor Analysis Comparison Table Ppt PowerPoint Presentation Infographic Template Graphics
This is a competitor analysis comparison table ppt powerpoint presentation infographic template graphics. This is a seven stage process. The stages in this process are profit, revenue, market share, main activity, criteria.
Competitor Analysis Comparison Table Ppt PowerPoint Presentation Icon Designs Download
This is a competitor analysis comparison table ppt powerpoint presentation icon designs download. This is a seven stage process. The stages in this process are revenue, profit, market share, main activity, number of employee, product quality.

Competition Comparison Table Ppt PowerPoint Presentation Pictures File Formats
This is a competition comparison table ppt powerpoint presentation pictures file formats. This is a seven stage process. The stages in this process are revenue, profit, market share, main activity, number of employee, product quality.
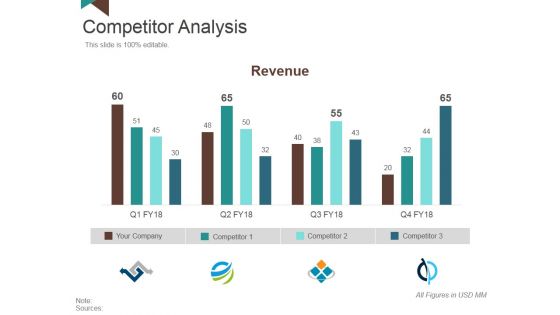
Competitor Analysis Template 4 Ppt PowerPoint Presentation Styles Visual Aids
This is a competitor analysis template 4 ppt powerpoint presentation styles visual aids. This is a four stage process. The stages in this process are revenue, your company, competitor.
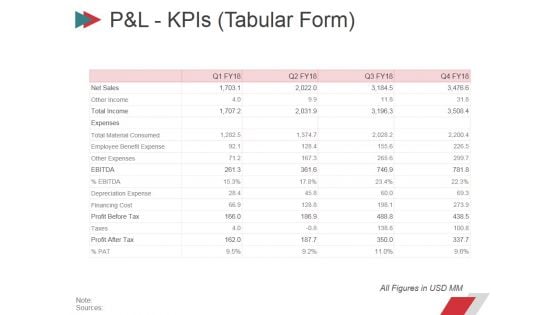
Pandl Kpis Tabular Form Ppt PowerPoint Presentation Summary Layout
This is a pandl kpis tabular form ppt powerpoint presentation summary layout. This is a four stage process. The stages in this process are revenue, cogs, operating profit, net profit.
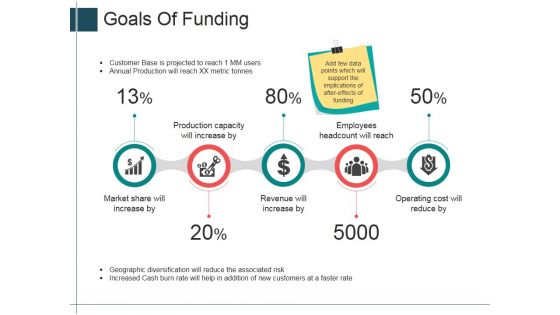
Goals Of Funding Ppt Powerpoint Presentation Slides Deck
This is a goals of funding ppt powerpoint presentation slides deck. This is a five stage process. The stages in this process are production capacity will increase by, revenue will increase by, market share will increase by.
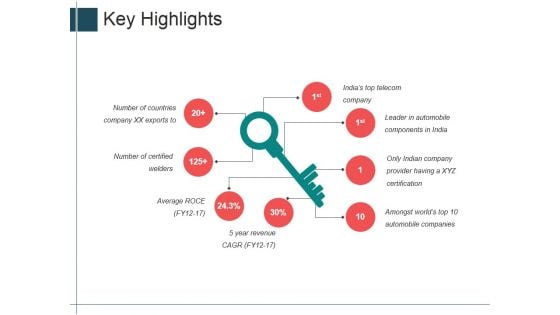
Key Highlights Ppt Powerpoint Presentation Styles Portfolio
This is a key highlights ppt powerpoint presentation styles portfolio. This is a seven stage process. The stages in this process are average roce, 5 year revenue cagr, indies top telecom company, key.
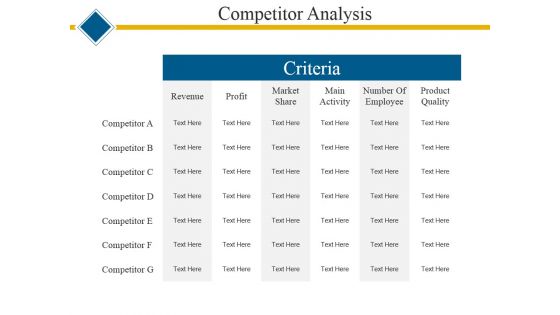
Competitor Analysis Ppt PowerPoint Presentation Professional Themes
This is a competitor analysis ppt powerpoint presentation professional themes. This is a six stage process. The stages in this process are revenue, profit, market share, main activity, number of employee, product quality.
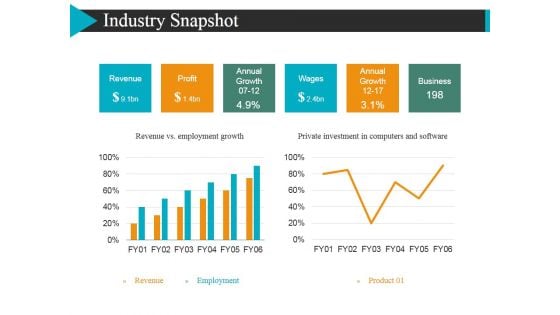
Industry Snapshot Template 2 Ppt Powerpoint Presentation Layouts Sample
This is a industry snapshot template 2 ppt powerpoint presentation layouts sample. This is a two stage process. The stages in this process are revenue, profit, annual growth, wages.
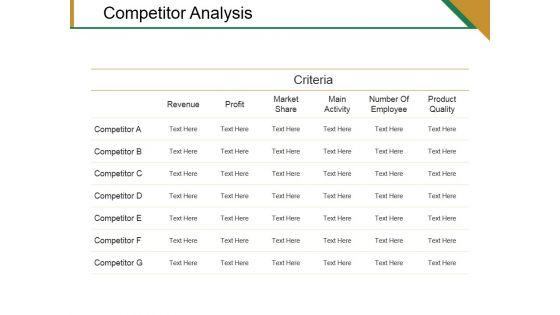
Competitor Analysis Ppt PowerPoint Presentation Pictures Designs Download
This is a competitor analysis ppt powerpoint presentation pictures designs download. This is a six stage process. The stages in this process are revenue, profit, market share, main activity, number of employee, product quality.
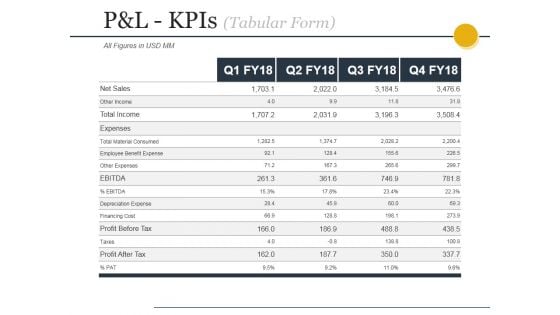
Pandl Kpis Tabular Form Ppt PowerPoint Presentation File Design Templates
This is a pandl kpis tabular form ppt powerpoint presentation file design templates. This is a four stage process. The stages in this process are revenue, cogs, operating profit, net profit.
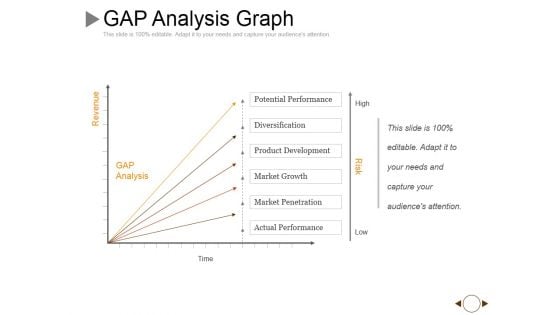
Gap Analysis Graph Ppt PowerPoint Presentation Slides Graphics Pictures
This is a gap analysis graph ppt powerpoint presentation slides graphics pictures. This is a five stage process. The stages in this process are revenue, time, high, low, risk.
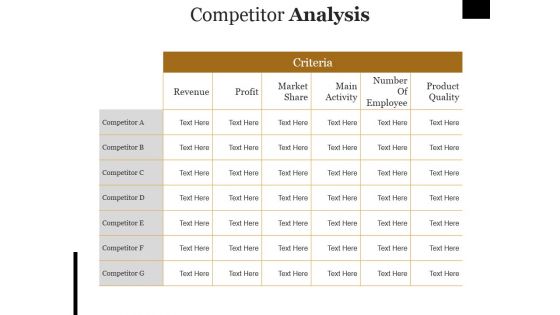
Competitor Analysis Ppt PowerPoint Presentation Outline Rules
This is a competitor analysis ppt powerpoint presentation outline rules. This is a seven stage process. The stages in this process are revenue, profit, market share, main activity, number of employee.
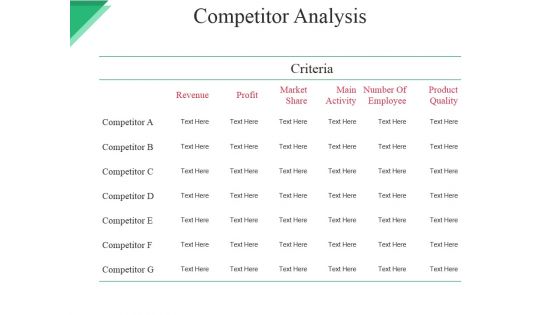
Competitor Analysis Ppt PowerPoint Presentation Show Infographics
This is a competitor analysis ppt powerpoint presentation show infographics. This is a seven stage process. The stages in this process are revenue, profit, market, share, main activity, number of employee.
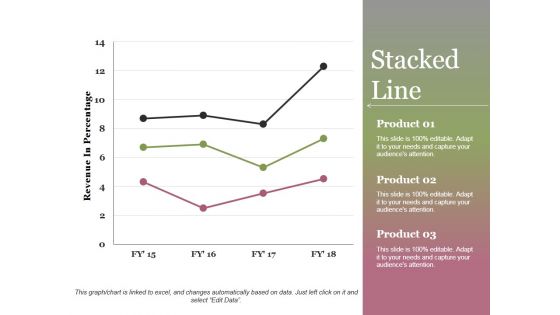
Stacked Line Ppt PowerPoint Presentation Show
This is a stacked line ppt powerpoint presentation show. This is a three stage process. The stages in this process are revenue in percentage, product, stacked line, growth, success.
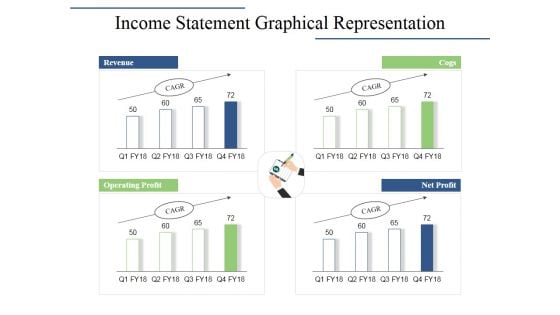
Income Statement Graphical Representation Ppt PowerPoint Presentation Infographics Layouts
This is a income statement graphical representation ppt powerpoint presentation infographics layouts. This is a four stage process. The stages in this process are revenue, cogs, operating profit, net profit.
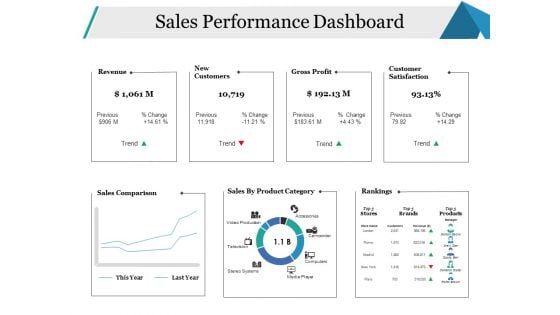
Sales Performance Dashboard Ppt PowerPoint Presentation Gallery Background
This is a sales performance dashboard ppt powerpoint presentation gallery backgroun. This is a six stage process. The stages in this process are sales comparison, sales by product category, rankings, revenue, new customers.
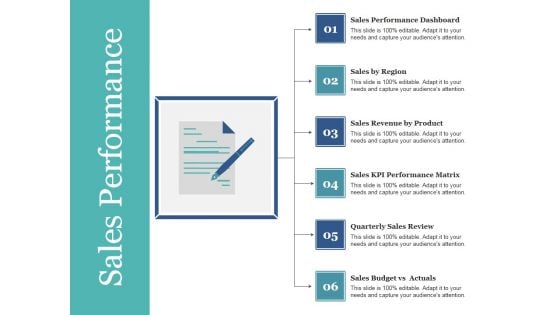
Sales Performance Ppt PowerPoint Presentation Summary Influencers
This is a sales performance ppt powerpoint presentation summary influencers. This is a six stage process. The stages in this process are sales performance dashboard, sales by region, sales revenue by product, sales kpi performance matrix, quarterly sales review.
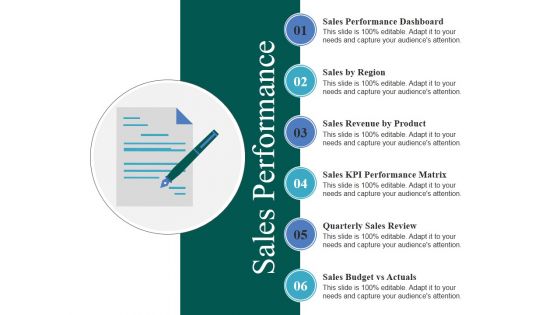
Sales Performance Ppt PowerPoint Presentation Infographics Visuals
This is a sales performance ppt powerpoint presentation infographics visuals. This is a six stage process. The stages in this process are sales by region, sales revenue by product, sales kpi performance matrix, quarterly sales review, sales budget vs actuals.
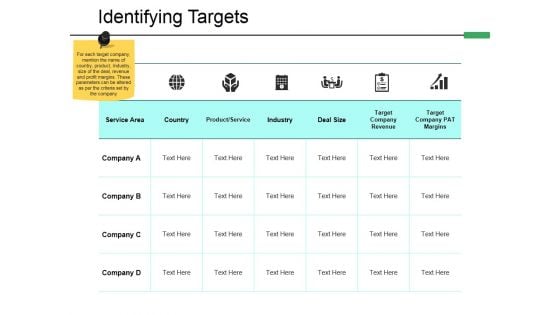
Identifying Targets Ppt PowerPoint Presentation File Templates
This is a identifying targets ppt powerpoint presentation file templates. This is a six stage process. The stages in this process are country, industry, deal size, target company revenue, product service.
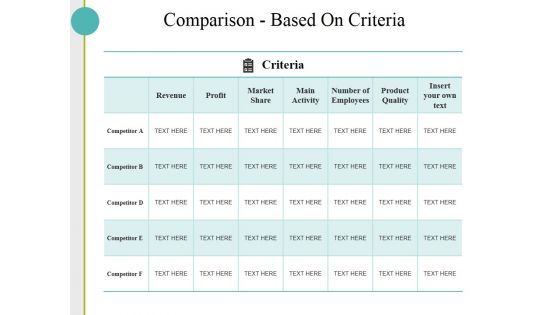
Comparison Based On Criteria Ppt PowerPoint Presentation Slides Skills
This is a comparison based on criteria ppt powerpoint presentation slides skills. This is a five stage process. The stages in this process are revenue, profit, market share, main activity, number of employees, product quality.
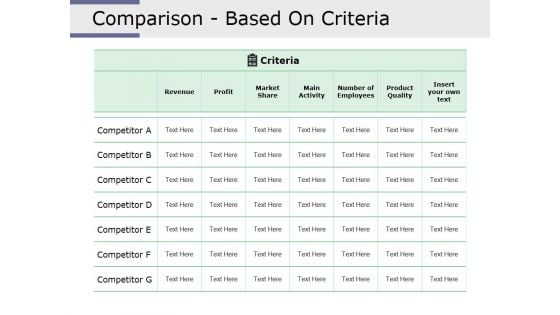
Comparison Based On Criteria Ppt PowerPoint Presentation Infographic Template Layout Ideas
This is a comparison based on criteria ppt powerpoint presentation infographic template layout ideas. This is a seven stage process. The stages in this process are revenue, profit, market share, main activity, number of employees, product quality.
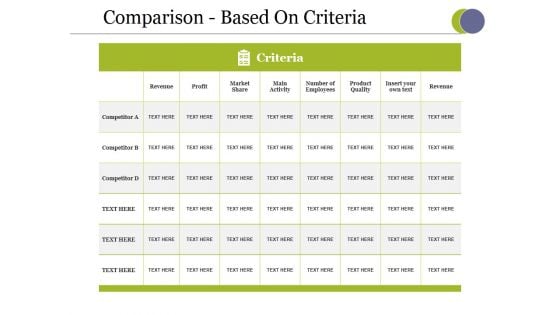
Comparison Based On Criteria Ppt PowerPoint Presentation Styles Designs
This is a comparison based on criteria ppt powerpoint presentation styles designs. This is a three stage process. The stages in this process are revenue, profit, market share, main activity, number of employees, product quality.
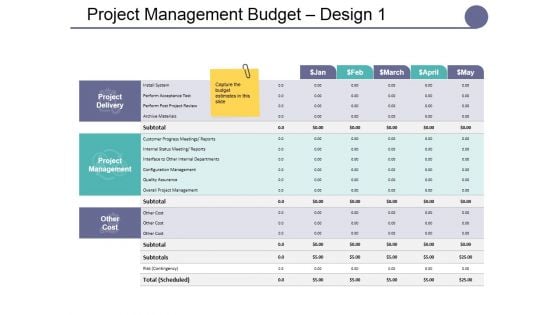
Project Management Budget Design Template 1 Ppt PowerPoint Presentation Show Model
This is a project management budget design template 1 ppt powerpoint presentation show model. This is a four stage process. The stages in this process are internal funding, department budget, existing revenue streams, government grants, itemized income.
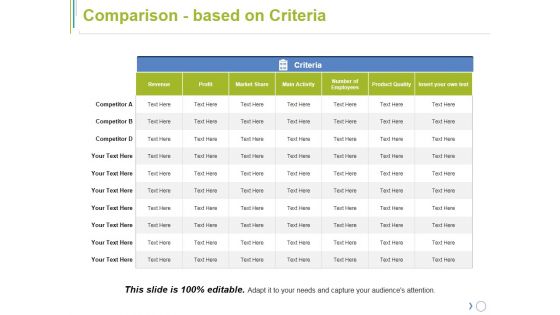
Comparison Based On Criteria Ppt PowerPoint Presentation Model Inspiration
This is a comparison based on criteria ppt powerpoint presentation model inspiration. This is a seven stage process. The stages in this process are revenue, profit, market share, number of employees, product quality.
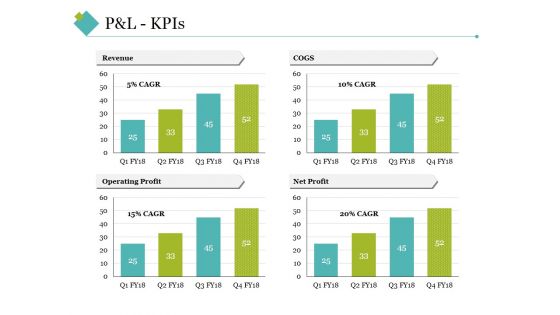
P And L Kpis Template 2 Ppt PowerPoint Presentation Inspiration Grid
This is a p and l kpis template 2 ppt powerpoint presentation inspiration grid. This is a four stage process. The stages in this process are revenue, cogs, operating profit, net profit.
Income Statement Overview Ppt PowerPoint Presentation Infographic Template Icon
This is a income statement overview ppt powerpoint presentation infographic template icon. This is a five stage process. The stages in this process are revenue, profit margin, operating profit margin.


 Continue with Email

 Home
Home


