Calendar Icon

Executive Summary Ppt PowerPoint Presentation Show Topics
This is a executive summary ppt powerpoint presentation show topics. This is a five stage process. The stages in this process are background, capabilities, accreditation, company s vision, company s mission.
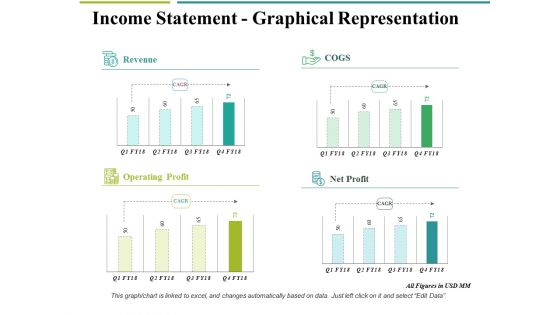
Income Statement Graphical Representation Ppt PowerPoint Presentation Pictures Design Templates
This is a income statement graphical representation ppt powerpoint presentation pictures design templates. This is a four stage process. The stages in this process are revenue, operating profit, net profit, cogs, business.
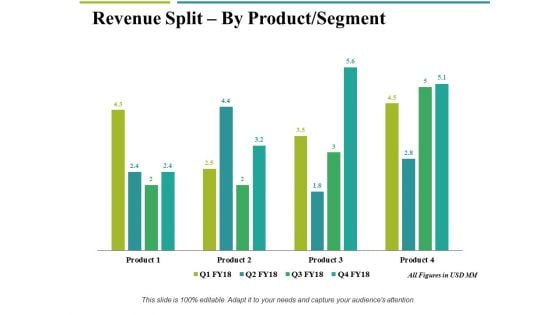
Revenue Split By Product Segment Template 2 Ppt PowerPoint Presentation Gallery Example File
This is a revenue split by product segment template 2 ppt powerpoint presentation gallery example file. This is a four stage process. The stages in this process are business, marketing, graph, finance, revenue split.
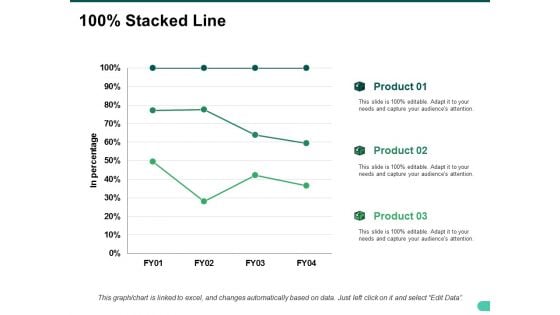
Stacked Line Ppt PowerPoint Presentation Slides Show
This is a stacked line ppt powerpoint presentation slides show. This is a three stage process. The stages in this process are in percentage, business, marketing, strategy, finance.
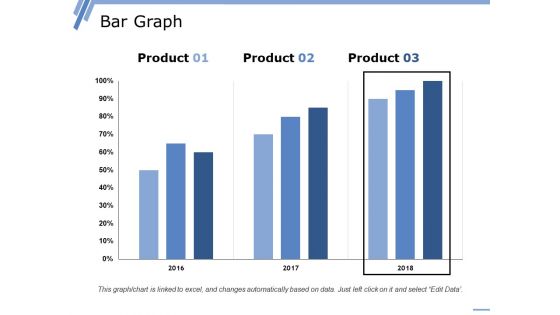
Bar Graph Ppt PowerPoint Presentation Outline Tips
This is a bar graph ppt powerpoint presentation outline tips. This is a three stage process. The stages in this process are bar graph, growth, success, business, product.
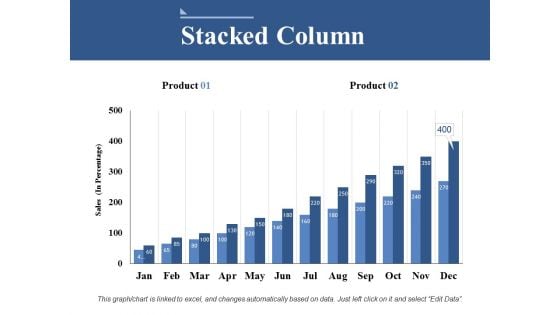
Stacked Column Ppt PowerPoint Presentation Model Information
This is a stacked column ppt powerpoint presentation model information. This is a two stage process. The stages in this process are business, sales, marketing, finance, strategy.
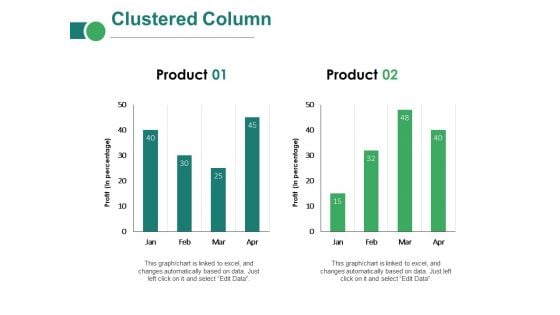
Clustered Column Ppt PowerPoint Presentation Inspiration Introduction
This is a clustered column ppt powerpoint presentation inspiration introduction. This is a two stage process. The stages in this process are business, marketing, in percentage, finance, graph, strategy.
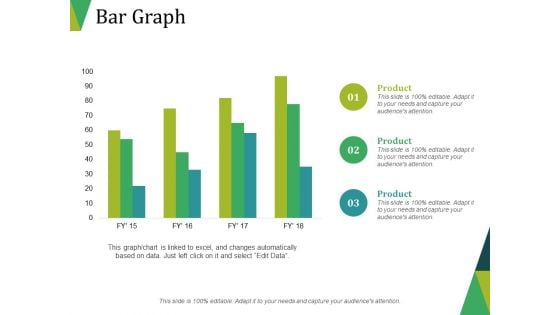
Bar Graph Ppt PowerPoint Presentation Layouts Portrait
This is a bar graph ppt powerpoint presentation layouts portrait. This is a three stage process. The stages in this process are bar graph, finance, marketing, strategy, business.
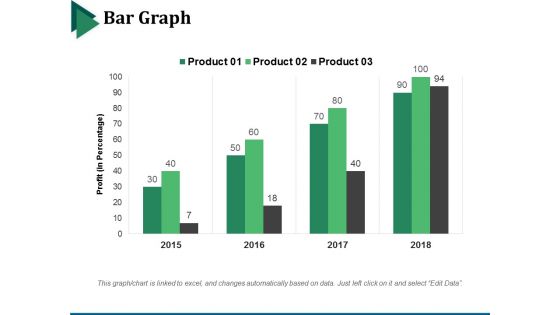
Bar Graph Ppt PowerPoint Presentation File Display
This is a bar graph ppt powerpoint presentation file display. This is a four stage process. The stages in this process are bar graph, marketing, strategy, finance, analysis.
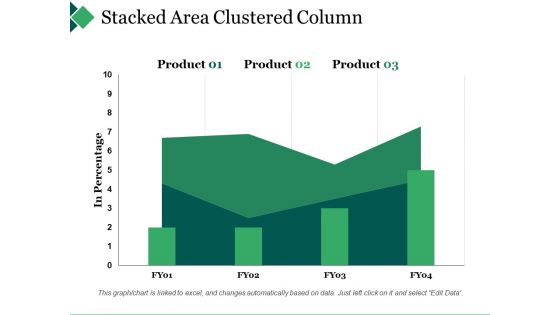
Stacked Area Clustered Column Ppt PowerPoint Presentation Gallery Gridlines
This is a stacked area clustered column ppt powerpoint presentation gallery gridlines. This is a three stage process. The stages in this process are bar graph, product, in percentage.
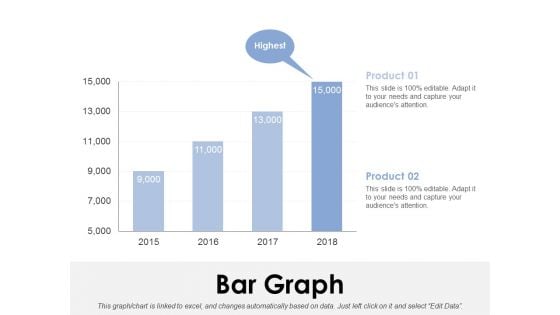
Bar Graph Ppt PowerPoint Presentation Professional Background
This is a bar graph ppt powerpoint presentation professional background. This is a two stage process. The stages in this process are bar graph, finance, marketing, strategy, business.
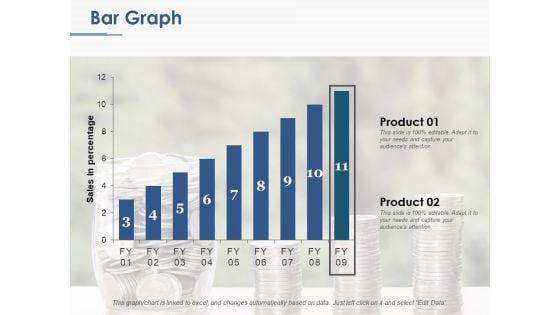
Bar Graph Ppt PowerPoint Presentation Ideas Display
This is a bar graph ppt powerpoint presentation ideas display. This is a two stage process. The stages in this process are product, sales in percentage, bar graph.
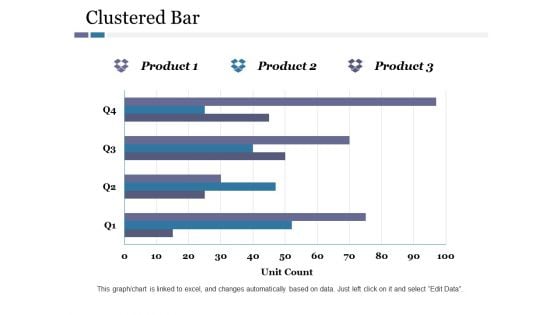
Clustered Bar Ppt PowerPoint Presentation Pictures Guidelines
This is a clustered bar ppt powerpoint presentation pictures guidelines. This is a three stage process. The stages in this process are clustered bar, finance, marketing, strategy, business.
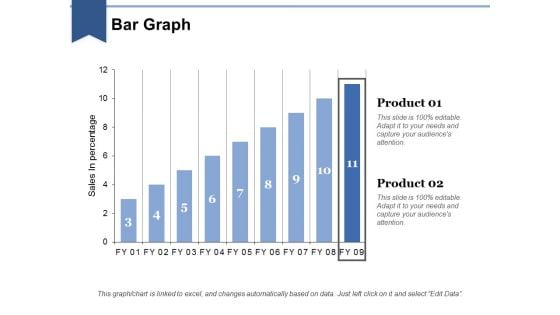
Bar Graph Ppt PowerPoint Presentation Layouts Influencers
This is a bar graph ppt powerpoint presentation layouts influencers. This is a two stage process. The stages in this process are business, marketing, in bar graph, sales in percentage, finance.
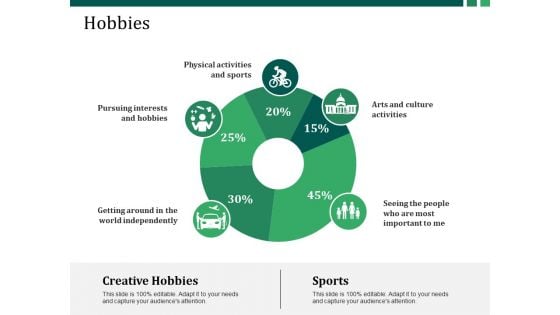
Hobbies Ppt PowerPoint Presentation Layouts Example Topics
This is a hobbies ppt powerpoint presentation layouts example topics. This is a three stage process. The stages in this process are getting around in the world independently, pursuing interests and hobbies, physical activities and sports, creative hobbies, sports.
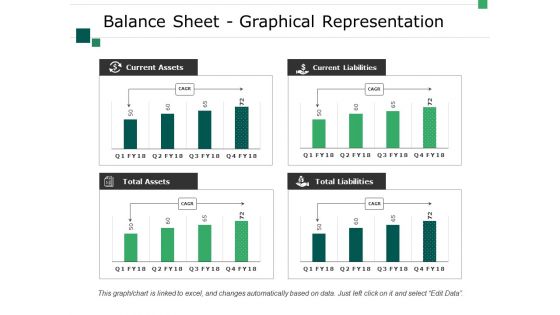
Balance Sheet Graphical Representation Ppt PowerPoint Presentation Infographics Layouts
This is a balance sheet graphical representation ppt powerpoint presentation infographics layouts. This is a four stage process. The stages in this process are business, current assets, total assets, total liabilities, current liabilities.
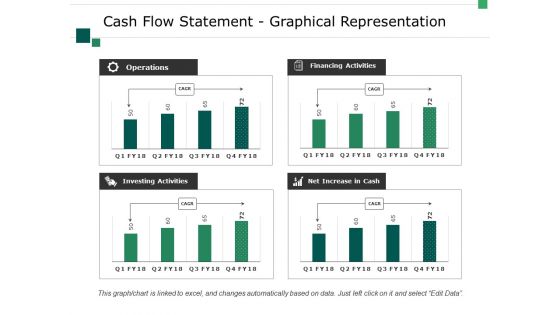
Cash Flow Statement Graphical Representation Ppt PowerPoint Presentation Professional Show
This is a cash flow statement graphical representation ppt powerpoint presentation professional show. This is a four stage process. The stages in this process are business, operations, investing activities, net increase in cash, financing activities.
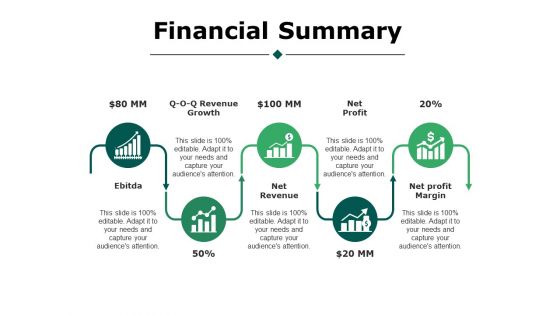
Financial Summary Ppt PowerPoint Presentation Styles Portfolio
This is a financial summary ppt powerpoint presentation styles portfolio. This is a five stage process. The stages in this process are business, ebitda, revenue growth, net revenue, net profit, net profit margin.

Income Statement Graphical Representation Ppt PowerPoint Presentation Visual Aids Layouts
This is a income statement graphical representation ppt powerpoint presentation visual aids layouts. This is a four stage process. The stages in this process are business, marketing, revenue, operating profit, net profit, cogs.
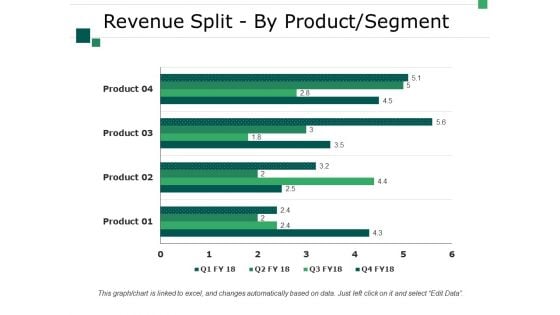
Revenue Split By Product Segment Template 2 Ppt PowerPoint Presentation Summary Good
This is a revenue split by product segment template 2 ppt powerpoint presentation summary good. This is a four stage process. The stages in this process are business, marketing, finance, strategy, graph.
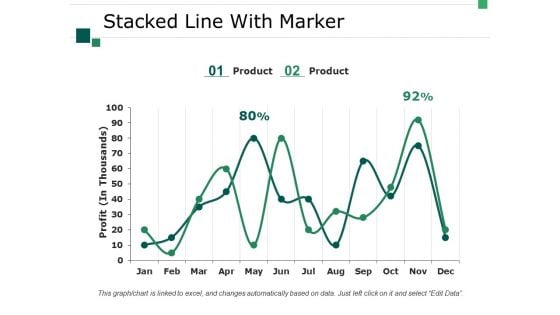
Stacked Line With Marker Ppt PowerPoint Presentation Professional Designs Download
This is a stacked line with marker ppt powerpoint presentation professional designs download. This is a two stage process. The stages in this process are business, marketing, strategy, graph, profit.
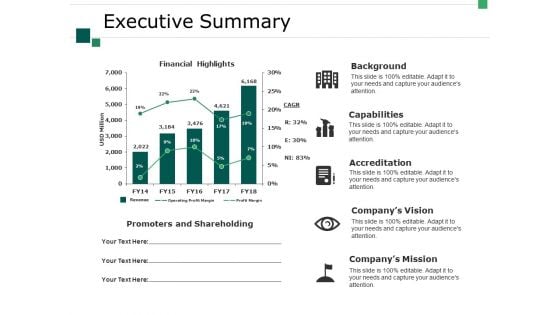
Executive Summary Ppt PowerPoint Presentation Outline Example Topics
This is a executive summary ppt powerpoint presentation outline example topics. This is a five stage process. The stages in this process are background, capabilities, accreditation, company s vision, company s mission.
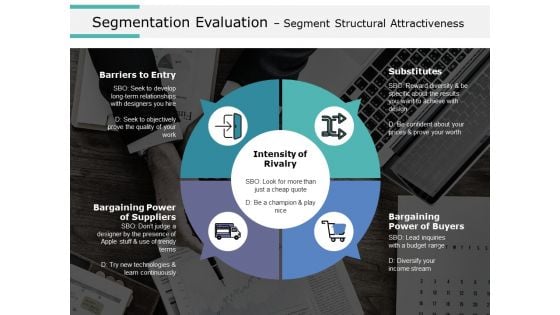
Segmentation Evaluation Segment Structural Attractiveness Ppt PowerPoint Presentation Ideas Slides
This is a segmentation evaluation segment structural attractiveness ppt powerpoint presentation ideas slides. This is a four stage process. The stages in this process are barriers to entry, substitutes, bargaining power of suppliers, bargaining power of buyers.
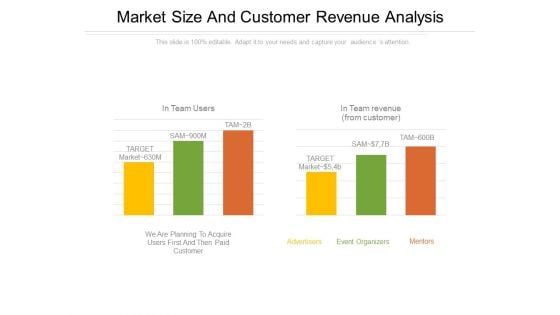
Market Size And Customer Revenue Analysis PowerPoint Presentation Examples
This is a market size and customer revenue analysis powerpoint presentation examples. This is a two stage process. The stages in this process are advertisers, mentors, event organizers, target, in team users.
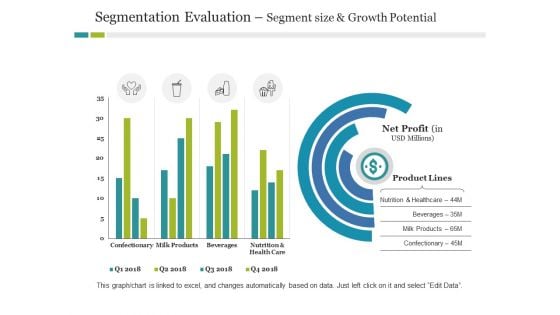
Segmentation Evaluation Segment Size And Growth Potential Ppt PowerPoint Presentation Infographic Template Outline
This is a segmentation evaluation segment size and growth potential ppt powerpoint presentation infographic template outline. This is a two stage process. The stages in this process are business, product lines, finance, marketing, strategy.
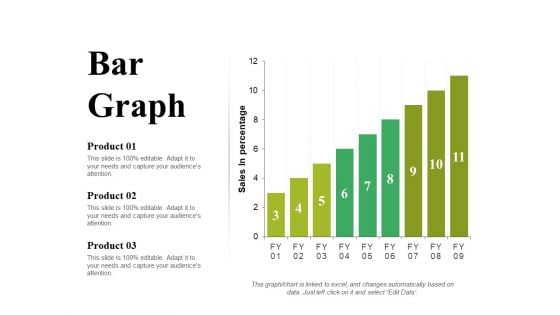
Bar Graph Ppt PowerPoint Presentation Portfolio Slide Portrait
This is a bar graph ppt powerpoint presentation portfolio slide portrait. This is a three stage process. The stages in this process are product, sales in percentage, bar graph, growth, success.
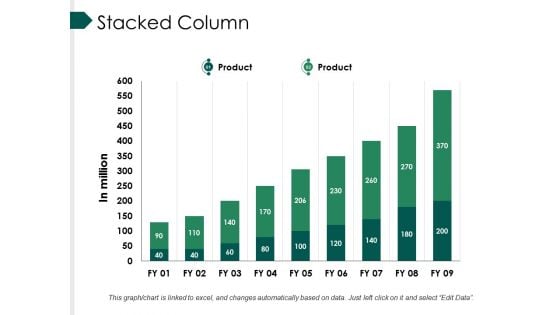
Stacked Column Ppt PowerPoint Presentation Professional Infographics
This is a stacked column ppt powerpoint presentation professional infographics. This is a nine stage process. The stages in this process are bar, marketing, strategy, finance, teamwork.
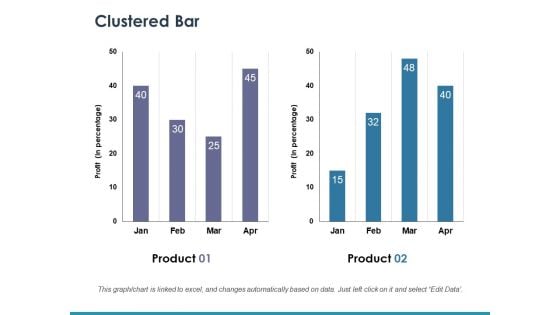
Clustered Bar Ppt PowerPoint Presentation Slides Ideas
This is a clustered bar ppt powerpoint presentation slides ideas. This is a two stage process. The stages in this process are bar graph, growth, success, business, marketing.
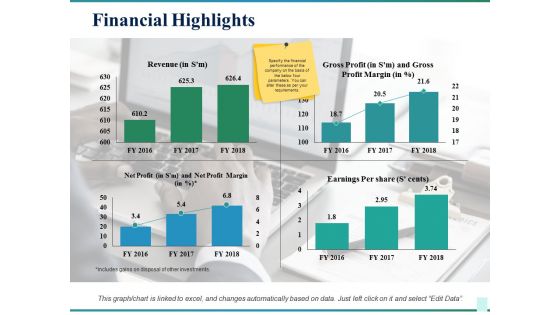
Financial Highlights Ppt PowerPoint Presentation Infographic Template Slide Download
This is a financial highlights ppt powerpoint presentation infographic template slide download. This is a four stage process. The stages in this process are business, revenue, gross profit, earnings per share, net profit, marketing.
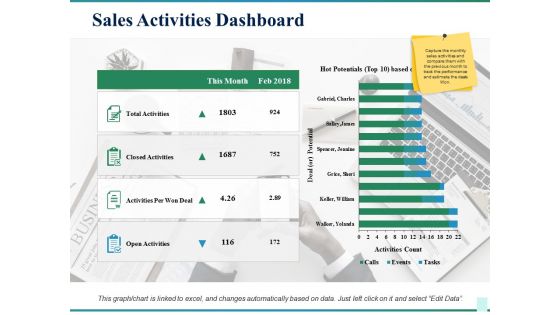
Sales Activities Dashboard Ppt PowerPoint Presentation Show Skills
This is a sales activities dashboard ppt powerpoint presentation show skills. This is a four stage process. The stages in this process are total activities, closed activities, activities per won deal, open activities, this month.
Sales Kpi Tracker Ppt PowerPoint Presentation Pictures Layout Ideas
This is a sales kpi tracker ppt powerpoint presentation pictures layout ideas. This is a four stage process. The stages in this process are opportunities won, top products in revenue, leads created, win ratio vs last yr, open deals vs.
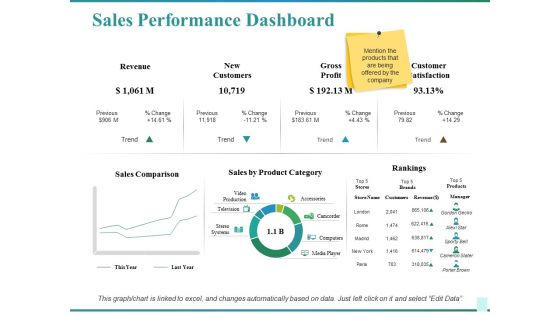
Sales Performance Dashboard Ppt PowerPoint Presentation Show Graphics Design
This is a sales performance dashboard ppt powerpoint presentation show graphics design. This is a two stage process. The stages in this process are sales comparison, sales by product category, rankings, customer satisfaction, revenue.
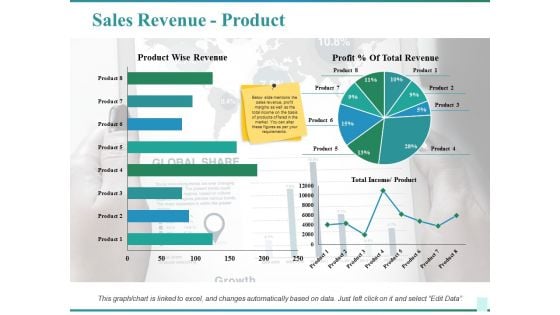
Sales Revenue Product Ppt PowerPoint Presentation Outline Portfolio
This is a sales revenue product ppt powerpoint presentation outline portfolio. This is a three stage process. The stages in this process are total income product, total revenue, product wise revenue, sales, business.
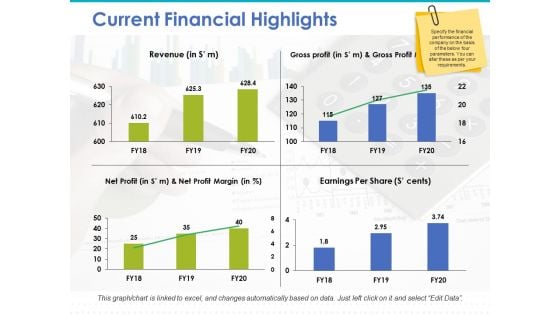
Current Financial Highlights Ppt PowerPoint Presentation Professional Slide Download
This is a current financial highlights ppt powerpoint presentation professional slide download. This is a four stage process. The stages in this process are revenue, gross profit, net profit, earnings per share.

Sales Product Performance Dashboard Ppt PowerPoint Presentation Model Graphics Design
This is a sales product performance dashboard ppt powerpoint presentation model graphics design. This is a four stage process. The stages in this process are top products in revenue, incremental sales, cost of goods.
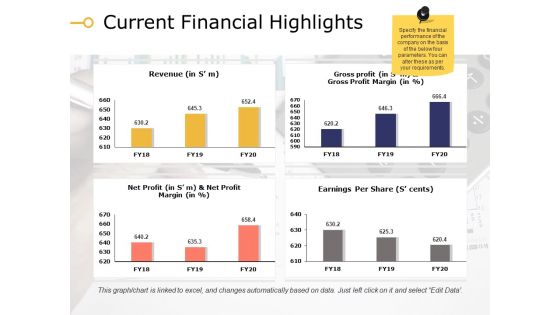
Current Financial Highlights Ppt PowerPoint Presentation File Demonstration
This is a current financial highlights ppt powerpoint presentation show example. This is a four stage process. The stages in this process are revenue, net profit, earnings per share, gross profit.
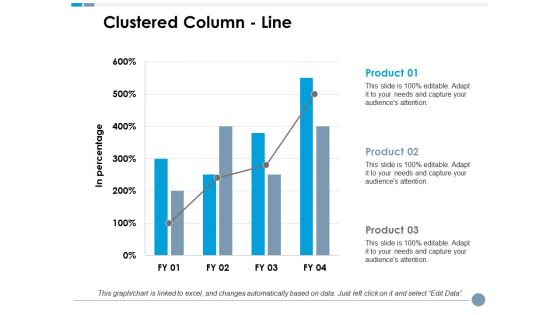
Clustered Column Line Ppt PowerPoint Presentation Model Graphics Tutorials
This is a clustered column line ppt powerpoint presentation model graphics tutorials. This is a three stage process. The stages in this process are business, marketing, in percentage, finance, graph.
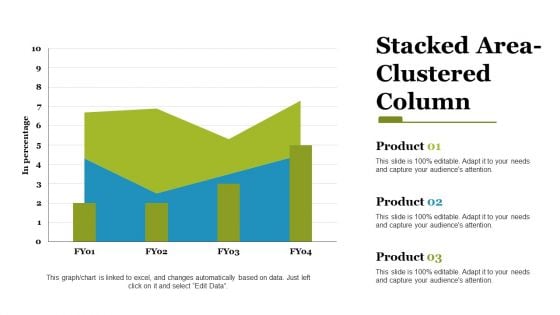
stacked area clustered column ppt powerpoint presentation styles files
This is a stacked area clustered column ppt powerpoint presentation styles files. This is a three stage process. The stages in this process are stacked area, clustered column, finance, marketing, strategy, business.
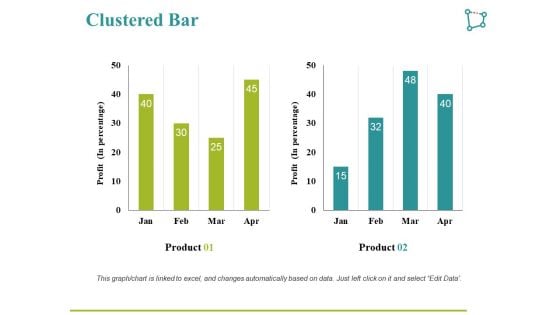
Clustered Bar Ppt PowerPoint Presentation Slides Deck
This is a clustered bar ppt powerpoint presentation slides deck. This is a two stage process. The stages in this process are product, profit, bar graph.
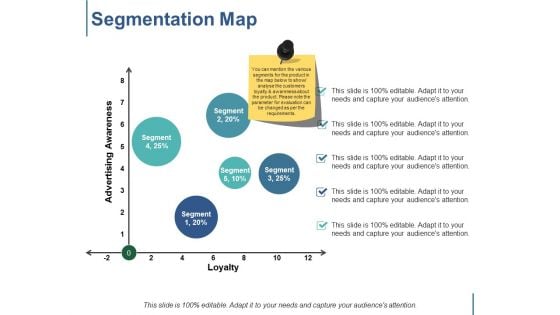
Segmentation Map Ppt PowerPoint Presentation Show Images
This is a segmentation map ppt powerpoint presentation show images. This is a five stage process. The stages in this process are segment, advertising awareness, loyalty.
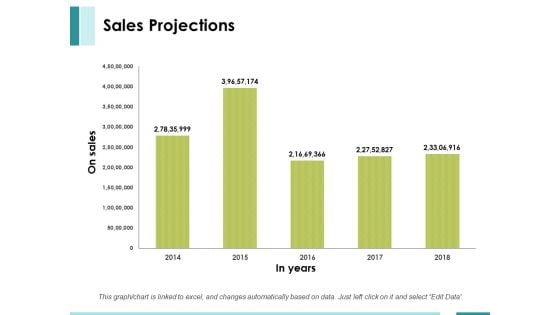
Sales Projections Ppt PowerPoint Presentation Model Examples
This is a sales projections ppt powerpoint presentation model examples. This is a five stage process. The stages in this process are on sales, in years, bar graph.
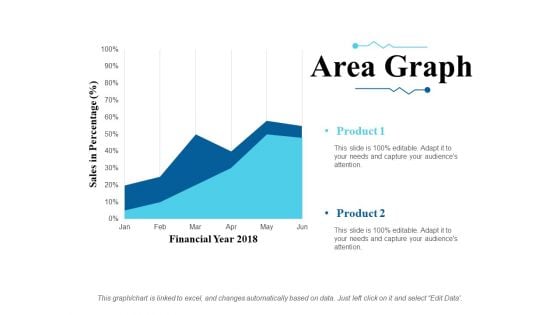
Area Graph Ppt PowerPoint Presentation Slides Ideas
This is a area graph ppt powerpoint presentation slides ideas. This is a two stage process. The stages in this process are sales in percentage, financial year, product.
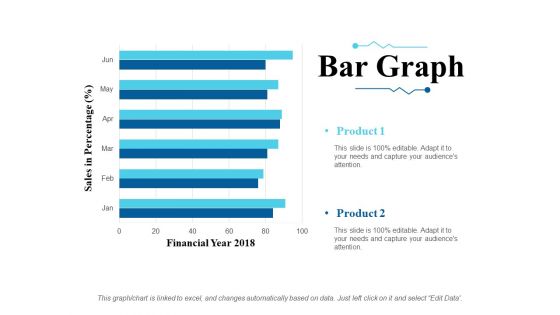
Bar Graph Ppt PowerPoint Presentation Inspiration Slides
This is a bar graph ppt powerpoint presentation inspiration slides. This is a six stage process. The stages in this process are sales in percentage, financial year, product.
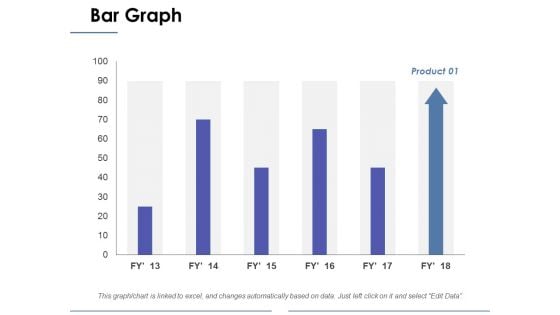
Bar Graph Ppt PowerPoint Presentation Layouts Backgrounds
This is a bar graph ppt powerpoint presentation layouts backgrounds. This is a one stage process. The stages in this process are business, marketing, finance, bar graph, strategy.
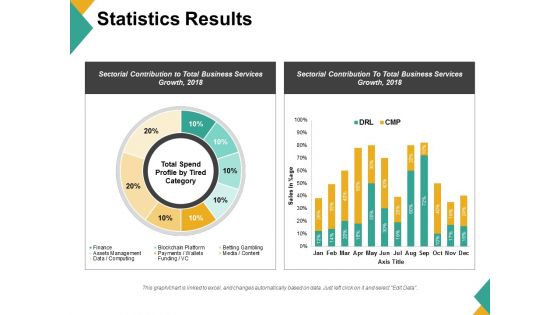
Statistics Results Ppt PowerPoint Presentation Gallery Graphics Pictures
This is a statistics results ppt powerpoint presentation gallery graphics pictures. This is a two stage process. The stages in this process are business, finance, marketing, strategy, analysis.
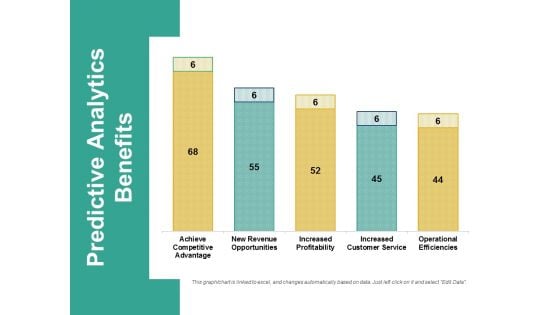
Predictive Analytics Benefits Ppt PowerPoint Presentation Professional Samples
This is a predictive analytics benefits ppt powerpoint presentation professional samples. This is a five stage process. The stages in this process are business, finance, marketing, strategy, analysis.
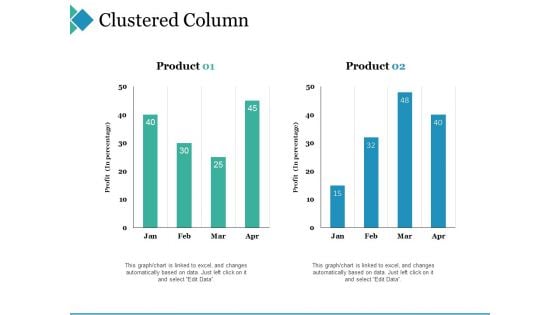
Clustered Column Ppt PowerPoint Presentation Gallery Microsoft
This is a clustered column ppt powerpoint presentation gallery microsoft. This is a two stage process. The stages in this process are clustered column, finance, marketing, strategy, analysis.
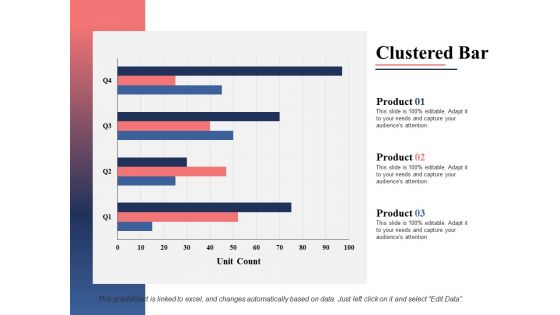
Clustered Bar Ppt PowerPoint Presentation Professional Guidelines
This is a clustered bar ppt powerpoint presentation professional guidelines. This is a three stage process. The stages in this process are clustered bar, finance, marketing, strategy, analysis.
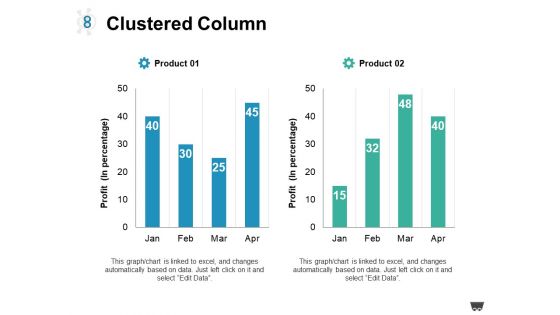
Clustered Column Ppt PowerPoint Presentation Show Introduction
This is a clustered column ppt powerpoint presentation show introduction. This is a two stage process. The stages in this process are product, profit, bar graph.
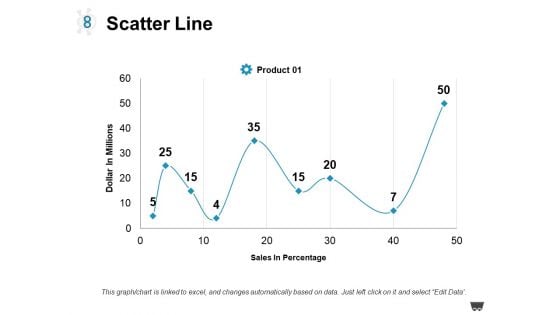
Scatter Line Ppt PowerPoint Presentation Styles Graphics Pictures
This is a scatter line ppt powerpoint presentation styles graphics pictures. This is a one stage process. The stages in this process are product, dollar in millions, sales in percentage.
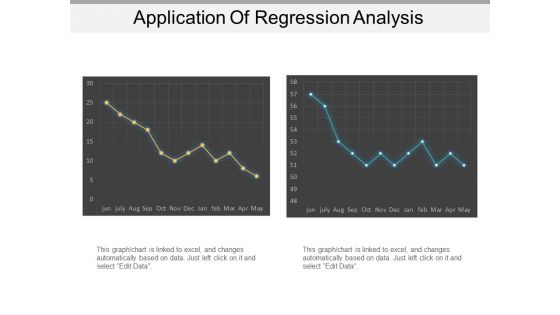
Application Of Regression Analysis Ppt PowerPoint Presentation Show Good
This is a application of regression analysis ppt powerpoint presentation show good. This is a two stage process. The stages in this process are linear periodization, linear growth, linear progression.
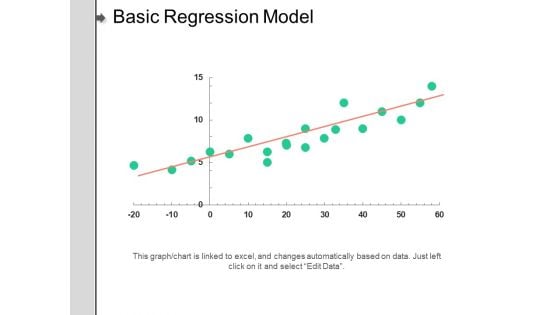
Basic Regression Model Ppt PowerPoint Presentation Pictures Layout Ideas
This is a basic regression model ppt powerpoint presentation pictures layout ideas. This is a one stage process. The stages in this process are linear periodization, linear growth, linear progression.
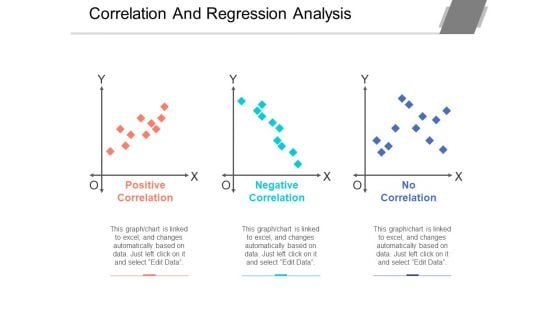
Correlation And Regression Analysis Ppt PowerPoint Presentation Styles Structure
This is a correlation and regression analysis ppt powerpoint presentation styles structure. This is a three stage process. The stages in this process are linear periodization, linear growth, linear progression.
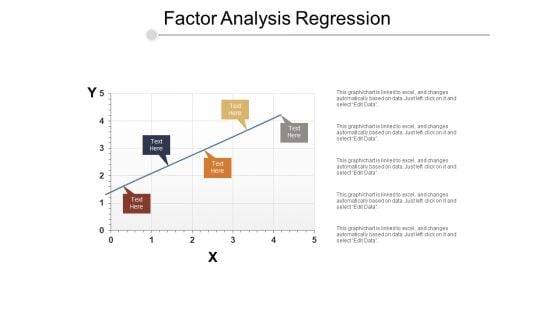
Factor Analysis Regression Ppt PowerPoint Presentation Styles Gallery
This is a factor analysis regression ppt powerpoint presentation styles gallery. This is a five stage process. The stages in this process are linear periodization, linear growth, linear progression.
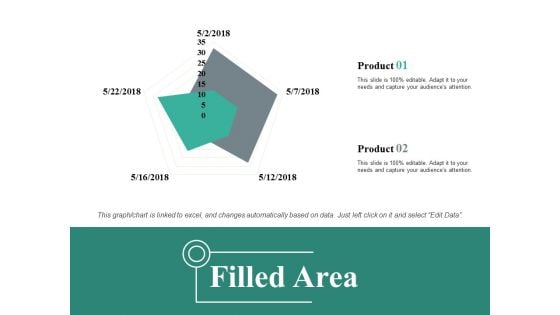
Filled Area Ppt PowerPoint Presentation Portfolio Gallery
This is a filled area ppt powerpoint presentation portfolio gallery. This is a two stage process. The stages in this process are filled area, business, marketing, finance, strategy.
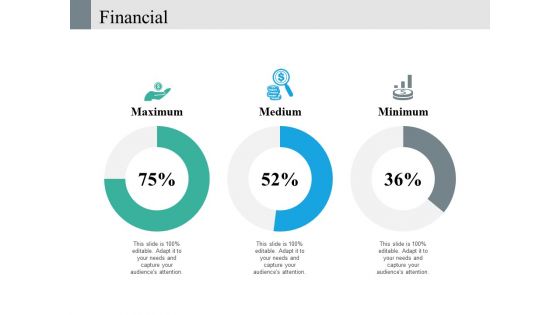
Financial Ppt PowerPoint Presentation Layouts Example
This is a financial ppt powerpoint presentation layouts example. This is a three stage process. The stages in this process are business, marketing, maximum, medium, minimum, financial.
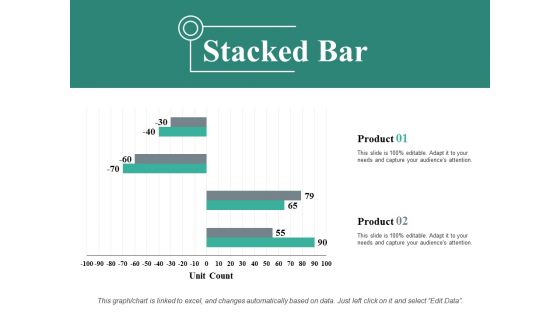
Stacked Bar Ppt PowerPoint Presentation Show Background Designs
This is a stacked bar ppt powerpoint presentation show background designs. This is a two stage process. The stages in this process are stacked bar, business, marketing, finance, unit count.
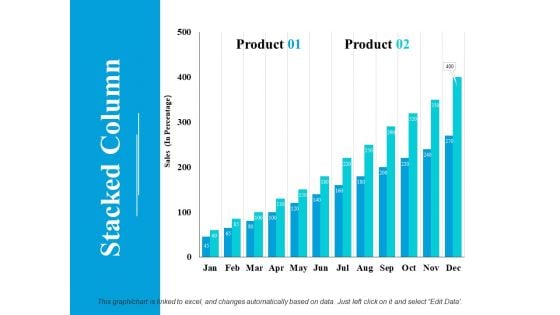
Stacked Column Ppt PowerPoint Presentation Model Inspiration
This is a stacked column ppt powerpoint presentation model inspiration. This is a two stage process. The stages in this process are product, sales, stacked column.
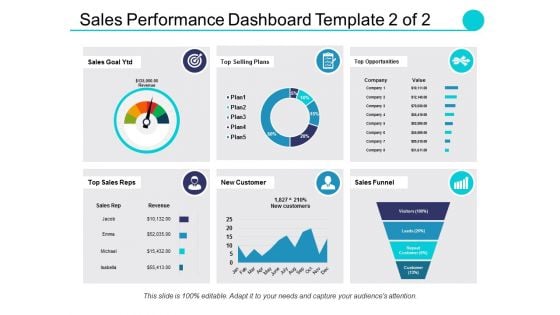
Sales Performance Dashboard Template Ppt PowerPoint Presentation Professional Elements
This is a sales performance dashboard template ppt powerpoint presentation professional elements. This is a eight stage process. The stages in this process are sales comparison, sales by product category, sales by month, brand profitability, revenue.
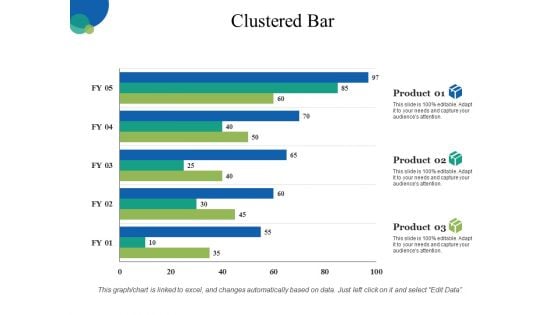
Clustered Bar Ppt PowerPoint Presentation Outline Templates
This is a clustered bar ppt powerpoint presentation outline templates. This is a three stage process. The stages in this process are business, finance, analysis, management, marketing.


 Continue with Email

 Home
Home


