Calendar Icon
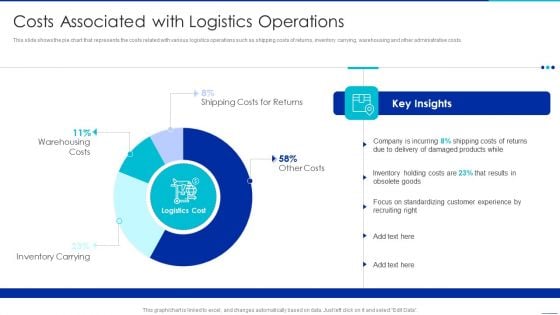
Optimizing Logistics Management Process Costs Associated With Logistics Operations Formats PDF
This slide shows the pie chart that represents the costs related with various logistics operations such as shipping costs of returns, inventory carrying, warehousing and other administrative costs. Deliver and pitch your topic in the best possible manner with this optimizing logistics management process costs associated with logistics operations formats pdf. Use them to share invaluable insights on warehousing costs, inventory carrying, shipping costs for returns and impress your audience. This template can be altered and modified as per your expectations. So, grab it now.
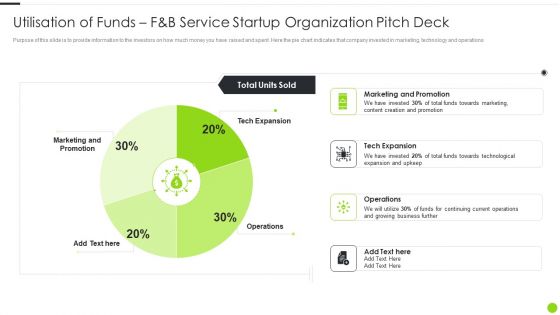
Utilisation Of Funds F And B Service Startup Organization Pitch Deck Structure PDF
Purpose of this slide is to provide information to the investors on how much money you have raised and spent. Here the pie chart indicates that company invested in marketing, technology and operations. Deliver and pitch your topic in the best possible manner with this utilisation of funds f and b service startup organization pitch deck structure pdf. Use them to share invaluable insights on marketing, tech expansion, operations and impress your audience. This template can be altered and modified as per your expectations. So, grab it now.

Charity Event Pitch Presentation For Group Of Hotels Allocation Of Funds Charity Download PDF
Purpose of this slide is to provide information to the investors about the areas where company will spent the raised money. Here the pie chart indicates that company will invest in the areas namely marketing, business expansion and operations. Deliver an awe inspiring pitch with this creative charity event pitch presentation for group of hotels allocation of funds charity download pdf bundle. Topics like marketing and promotion, business expansion, operations can be discussed with this completely editable template. It is available for immediate download depending on the needs and requirements of the user.
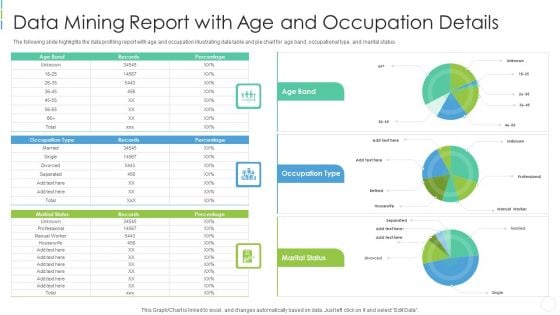
Data Mining Report With Age And Occupation Details Background PDF
The following slide highlights the data profiling report with age and occupation illustrating data table and pie chart for age band, occupational type, and marital status Showcasing this set of slides titled data mining report with age and occupation details background pdf . The topics addressed in these templates are data mining report with age and occupation details . All the content presented in this PPT design is completely editable. Download it and make adjustments in color, background, font etc. as per your unique business setting.
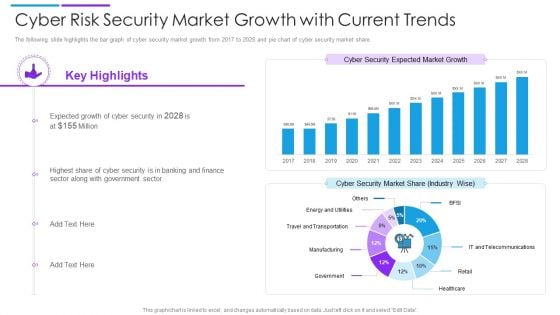
Cyber Risk Security Market Growth With Current Trends Summary PDF
The following slide highlights the bar graph of cyber security market growth from 2017 to 2028 and pie chart of cyber security market share. Showcasing this set of slides titled cyber risk security market growth with current trends summary pdf. The topics addressed in these templates are cyber security market share, cyber security expected market growth, banking and finance. All the content presented in this PPT design is completely editable. Download it and make adjustments in color, background, font etc. as per your unique business setting.
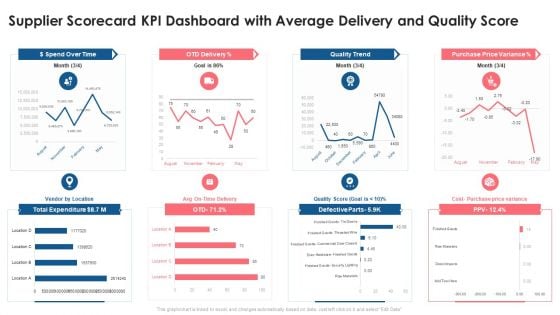
Supplier Scorecard Supplier Scorecard KPI Dashboard With Average Delivery And Quality Score Introduction PDF
This graph or chart is linked to excel, and changes automatically based on data. Just left click on it and select Edit Data. Deliver an awe inspiring pitch with this creative supplier scorecard supplier scorecard kpi dashboard with average delivery and quality score introduction pdf bundle. Topics like dollar spend over time, otd delivery, quality trend, purchase price variance, total expenditure can be discussed with this completely editable template. It is available for immediate download depending on the needs and requirements of the user.
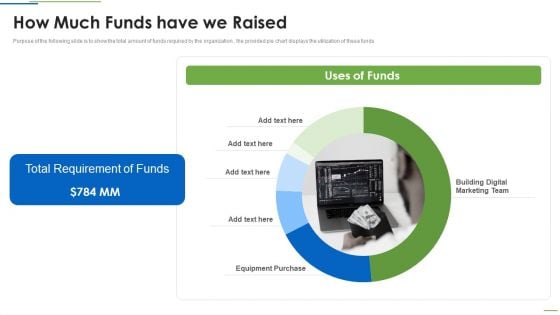
Social Networks Marketing Agency Investor Financing Elevator Pitch Deck How Much Funds Have We Raised Download PDF
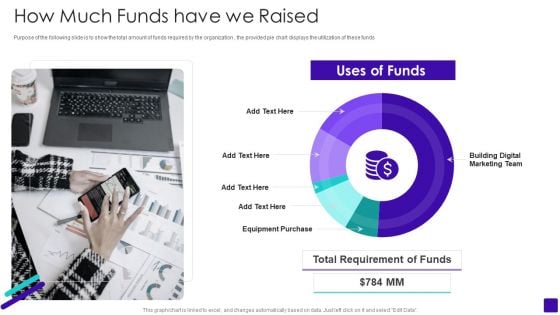
Purpose of the following slide is to show the total amount of funds required by the organization , the provided pie chart displays the utilization of these funds Deliver and pitch your topic in the best possible manner with this social networks marketing agency investor financing elevator pitch deck how much funds have we raised download pdf Use them to share invaluable insights on total requirement of funds, building digital marketing team, equipment purchase and impress your audience. This template can be altered and modified as per your expectations. So, grab it now.
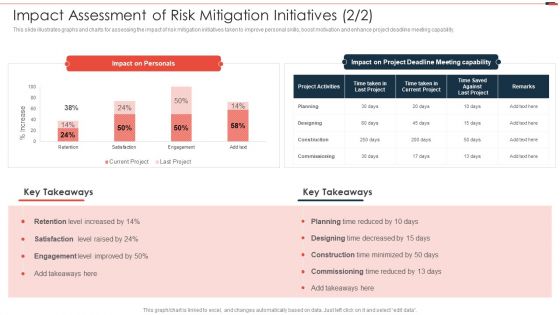
Impact Assessment Of Risk Mitigation Initiatives Commercial Property Development Graphics PDF
This slide illustrates graphs and charts for assessing the impact of risk mitigation initiatives taken to improve personal skills, boost motivation and enhance project deadline meeting capability. Deliver and pitch your topic in the best possible manner with this impact assessment of risk mitigation initiatives commercial property development graphics pdf. Use them to share invaluable insights on impact on personals, engagement level improved, satisfaction level raised, retention level increased and impress your audience. This template can be altered and modified as per your expectations. So, grab it now.
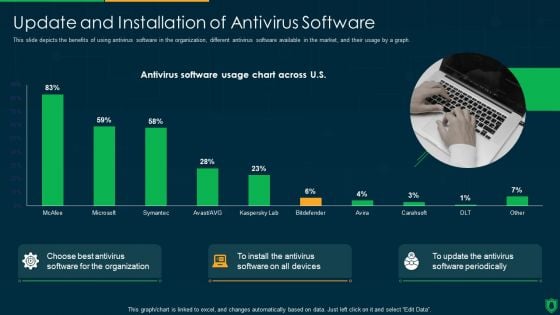
Info Security Update And Installation Of Antivirus Software Ppt PowerPoint Presentation File Designs PDF
This slide depicts the benefits of using antivirus software in the organization, different antivirus software available in the market, and their usage by a graph. Deliver and pitch your topic in the best possible manner with this info security update and installation of antivirus software ppt powerpoint presentation file designs pdf. Use them to share invaluable insights on antivirus software usage chart across us, choose best antivirus, organization and impress your audience. This template can be altered and modified as per your expectations. So, grab it now.
How Much Funds Have We Raised Online Branding Agency Investor Funding Elevator Pitch Deck Introduction PDF
Purpose of the following slide is to show the total amount of funds required by the organization , the provided pie chart displays the utilization of these funds. Deliver an awe inspiring pitch with this creative how much funds have we raised online branding agency investor funding elevator pitch deck introduction pdf bundle. Topics like building digital marketing team, equipment purchase can be discussed with this completely editable template. It is available for immediate download depending on the needs and requirements of the user.

Cryptocurrency Investment Playbook Dashboard To Effectively Track Bitcoin Performance Rules PDF
The following dashboard highlights key parameters that can be used by the organization to track the performance of their Bitcoin investment, it enlists major KPIs such as price of Bitcoin, transaction chart and its historical performance.Deliver and pitch your topic in the best possible manner with this cryptocurrency investment playbook dashboard to effectively track bitcoin performance rules pdf Use them to share invaluable insights on dashboard to effectively track bitcoin performance and impress your audience. This template can be altered and modified as per your expectations. So, grab it now.
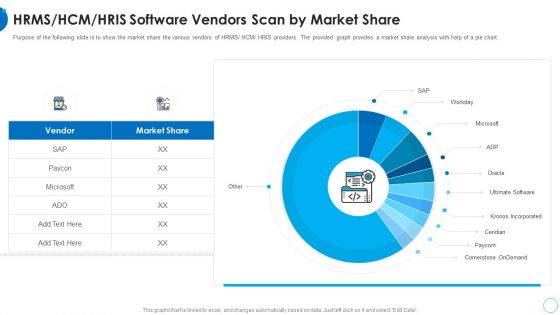
RMS HCM HRIS Software Vendors Scan By Market Share HR Change Management Tools Introduction PDF
Purpose of the following slide is to show the market share the various vendors of HRMS or HCM or HRIS providers. The provided graph provides a market share analysis with help of a pie chart. Deliver and pitch your topic in the best possible manner with this rms hcm hris software vendors scan by market share hr change management tools introduction pdf. Use them to share invaluable insights on hrms or hcm or hris software vendors scan by market share and impress your audience. This template can be altered and modified as per your expectations. So, grab it now.
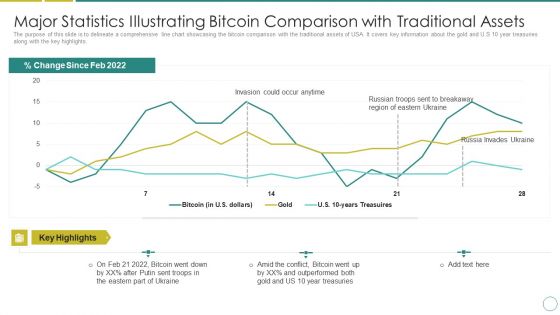
Russia Ukraine Major Statistics Illustrating Bitcoin Comparison With Traditional Assets Guidelines PDF
The purpose of this slide is to delineate a comprehensive line chart showcasing the bitcoin comparison with the traditional assets of USA. It covers key information about the gold and U.S 10 year treasuries along with the key highlights. Deliver an awe inspiring pitch with this creative russia ukraine major statistics illustrating bitcoin comparison with traditional assets guidelines pdf bundle. Topics like invasion could occur anytime, percent change since feb 2022 can be discussed with this completely editable template. It is available for immediate download depending on the needs and requirements of the user.

Allocation Of Funds Investor Pitch Deck For Hotel Business Graphics PDF
Purpose of this slide is to provide information to the investors about the areas where company will spent the raised money. Here the pie chart indicates that company will invest in the areas namely marketing, business expansion Deliver an awe inspiring pitch with this creative Allocation Of Funds Investor Pitch Deck For Hotel Business Graphics PDF bundle. Topics like Marketing And Promotion, Operations, Business Expansion can be discussed with this completely editable template. It is available for immediate download depending on the needs and requirements of the user.
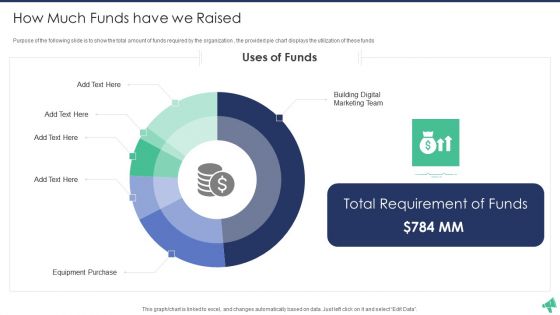
Digital Advertising And Promotion How Much Funds Have We Raised Elements PDF
Purpose of the following slide is to show the total amount of funds required by the organization , the provided pie chart displays the utilization of these funds. Deliver an awe inspiring pitch with this creative digital advertising and promotion how much funds have we raised elements pdf bundle. Topics like building digital marketing team, total requirement of funds, equipment purchase can be discussed with this completely editable template. It is available for immediate download depending on the needs and requirements of the user.
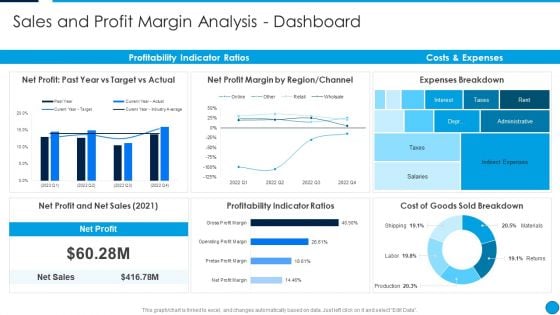
Summary Financial Sales And Profit Margin Analysis Dashboard Pictures PDF
This graph or chart is linked to excel, and changes automatically based on data. Just left click on it and select Edit Data. Deliver an awe inspiring pitch with this creative Summary Financial Sales And Profit Margin Analysis Dashboard Pictures PDF bundle. Topics like Net Profit, Past Year Vs Target Vs Actual, Net Profit Margin By Region, Channel, Expenses Breakdown, Costs And Expenses, Profitability Indicator Ratios can be discussed with this completely editable template. It is available for immediate download depending on the needs and requirements of the user.
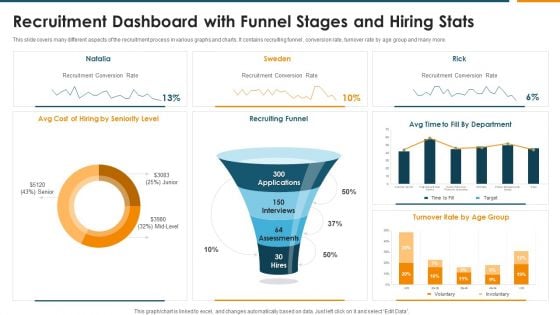
Recruitment Dashboard With Funnel Stages And Hiring Stats Rules PDF
This slide covers many different aspects of the recruitment process in various graphs and charts. It contains recruiting funnel , conversion rate, turnover rate by age group and many more. Pitch your topic with ease and precision using this Recruitment Dashboard With Funnel Stages And Hiring Stats Rules PDF. This layout presents information on Recruiting Funnel, Recruitment Conversion Rate, Seniority Level. It is also available for immediate download and adjustment. So, changes can be made in the color, design, graphics or any other component to create a unique layout.
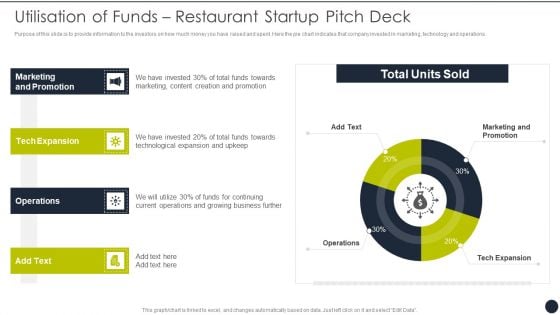
Utilisation Of Funds Restaurant Startup Pitch Deck Ideas PDF
Purpose of this slide is to provide information to the investors on how much money you have raised and spent. Here the pie chart indicates that company invested in marketing, technology and operations. Deliver and pitch your topic in the best possible manner with this Utilisation Of Funds Restaurant Startup Pitch Deck Ideas PDF. Use them to share invaluable insights on Marketing And Promotion, Tech Expansion, Operations and impress your audience. This template can be altered and modified as per your expectations. So, grab it now.
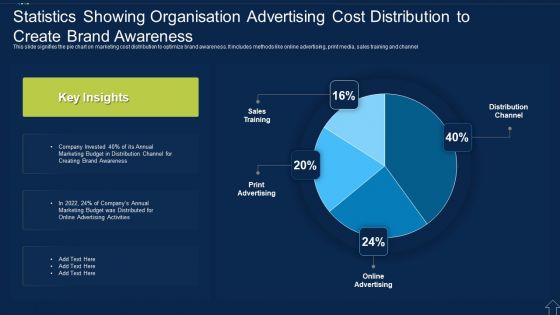
Statistics Showing Organisation Advertising Cost Distribution To Create Brand Awareness Slides PDF
This slide signifies the pie chart on marketing cost distribution to optimize brand awareness. It includes methods like online advertising, print media, sales training and channel.Showcasing this set of slides titled Statistics Showing Organisation Advertising Cost Distribution To Create Brand Awareness Slides PDF The topics addressed in these templates are Creating Brand Awareness, Marketing Budget, Advertising Activities All the content presented in this PPT design is completely editable. Download it and make adjustments in color, background, font etc. as per your unique business setting.
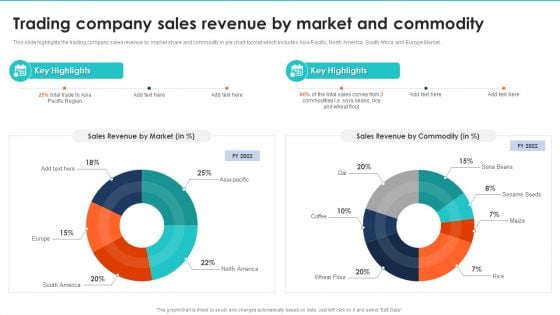
Export Management Company Profile Trading Company Sales Revenue By Market And Commodity Background PDF
This slide highlights the trading company sales revenue by market share and commodity in pie chart format which includes Asia Pacific, North America, South Africa and Europe Market. Deliver and pitch your topic in the best possible manner with this Export Management Company Profile Trading Company Sales Revenue By Market And Commodity Background PDF. Use them to share invaluable insights on Sales Revenue By Market, Sales Revenue By Commodity and impress your audience. This template can be altered and modified as per your expectations. So, grab it now.
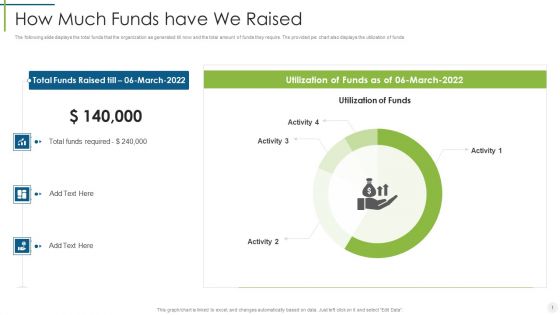
Saas Provider How Much Funds Have We Raised Ppt Professional Background Images PDF
The following slide displays the total funds that the organization as generated till now and the total amount of funds they require. The provided pie chart also displays the utilization of funds. Deliver an awe inspiring pitch with this creative Saas Provider How Much Funds Have We Raised Ppt Professional Background Images PDF bundle. Topics like Total Funds Required, Utilization Funds can be discussed with this completely editable template. It is available for immediate download depending on the needs and requirements of the user.
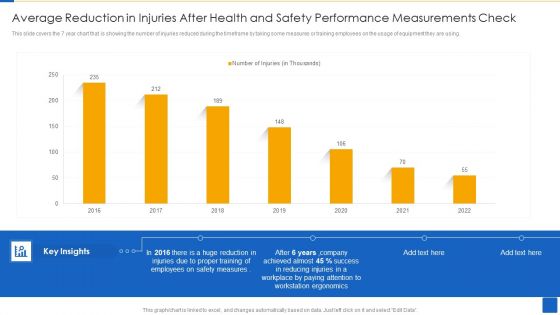
Average Reduction In Injuries After Health And Safety Performance Measurements Check Template PDF
This slide covers the 7 year chart that is showing the number of injuries reduced during the timeframe by taking some measures or training employees on the usage of equipment they are using. Showcasing this set of slides titled Average Reduction In Injuries After Health And Safety Performance Measurements Check Template PDF The topics addressed in these templates are Employees Safety Measures, Workstation Ergonomics, Workplace Paying Attention All the content presented in this PPT design is completely editable. Download it and make adjustments in color, background, font etc. as per your unique business setting.
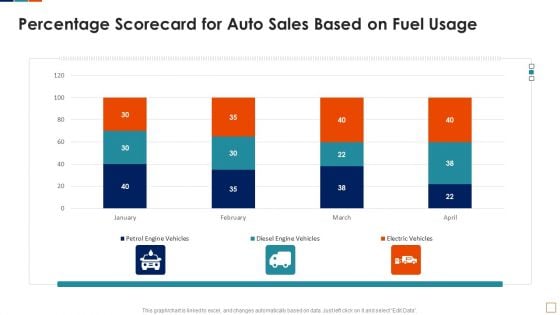
Automobile Sales Scorecard Percentage Scorecard For Auto Sales Based On Fuel Usage Graphics PDF
This graph or chart is linked to excel, and changes automatically based on data. Just left click on it and select Edit Data. Deliver and pitch your topic in the best possible manner with this Automobile Sales Scorecard Percentage Scorecard For Auto Sales Based On Fuel Usage Graphics PDF. Use them to share invaluable insights on Petrol Engine Vehicles, Diesel Engine Vehicles, Electric Vehicles Sales and impress your audience. This template can be altered and modified as per your expectations. So, grab it now.
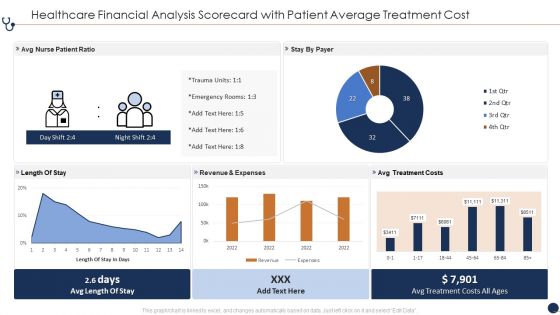
Healthcare Financial Analysis Scorecard With Patient Average Treatment Cost Ppt Infographic Template Slide Portrait PDF
This graph or chart is linked to excel, and changes automatically based on data. Just left click on it and select Edit Data. Deliver and pitch your topic in the best possible manner with this Healthcare Financial Analysis Scorecard With Patient Average Treatment Cost Ppt Infographic Template Slide Portrait PDF. Use them to share invaluable insights on Avg Nurse Patient, Revenue And Expenses, Avg Treatment Costs and impress your audience. This template can be altered and modified as per your expectations. So, grab it now.
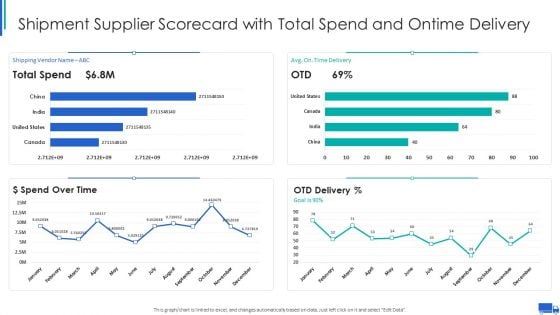
Shipment Supplier Scorecard With Total Spend And Ontime Delivery Ppt Slides Templates PDF
This graph or chart is linked to excel, and changes automatically based on data. Just left click on it and select Edit Data. Deliver and pitch your topic in the best possible manner with this Shipment Supplier Scorecard With Total Spend And Ontime Delivery Ppt Slides Templates PDF. Use them to share invaluable insights on Shipping Vendor Avg, Time Delivery Goal, Spend Over Time, OTD Delivery Percent and impress your audience. This template can be altered and modified as per your expectations. So, grab it now.
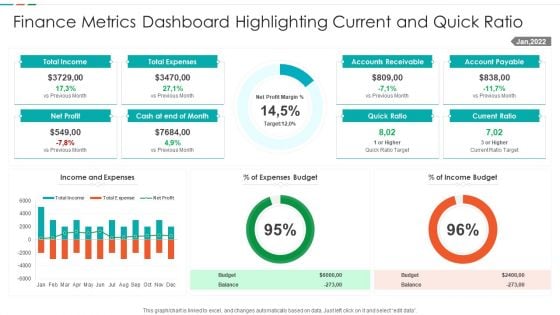
Finance Metrics Dashboard Highlighting Current And Quick Ratio Template PDF
This graph or chart is linked to excel, and changes automatically based on data. Just left click on it and select edit data. Showcasing this set of slides titled Finance Metrics Dashboard Highlighting Current And Quick Ratio Template PDF. The topics addressed in these templates are Total Income Budget, Total Expenses Balance, Net Profit Quick, Ratio Current Ratio. All the content presented in this PPT design is completely editable. Download it and make adjustments in color, background, font etc. as per your unique business setting.
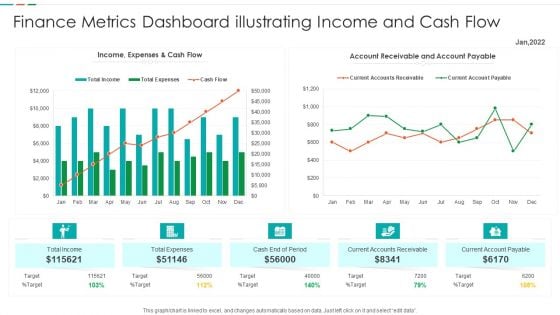
Finance Metrics Dashboard Illustrating Income And Cash Flow Template PDF
This graph or chart is linked to excel, and changes automatically based on data. Just left click on it and select edit data. Pitch your topic with ease and precision using this Finance Metrics Dashboard Illustrating Income And Cash Flow Template PDF. This layout presents information on Current Accounts Receivable, Current Account Payable, Cash End Period, Account Receivable Account. It is also available for immediate download and adjustment. So, changes can be made in the color, design, graphics or any other component to create a unique layout.
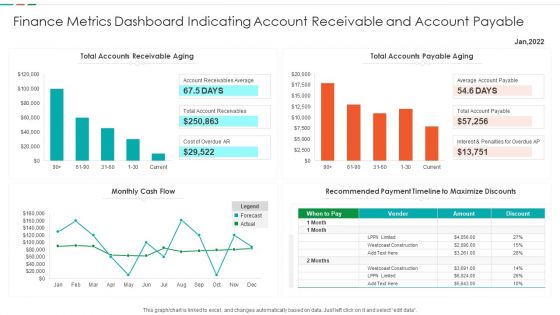
Finance Metrics Dashboard Indicating Account Receivable And Account Payable Demonstration PDF
This graph or chart is linked to excel, and changes automatically based on data. Just left click on it and select edit data. Showcasing this set of slides titled Finance Metrics Dashboard Indicating Account Receivable And Account Payable Demonstration PDF. The topics addressed in these templates are Total Accounts Receivable, Total Accounts Payable, Recommended Payment Timeline, Monthly Cash Flow. All the content presented in this PPT design is completely editable. Download it and make adjustments in color, background, font etc. as per your unique business setting.
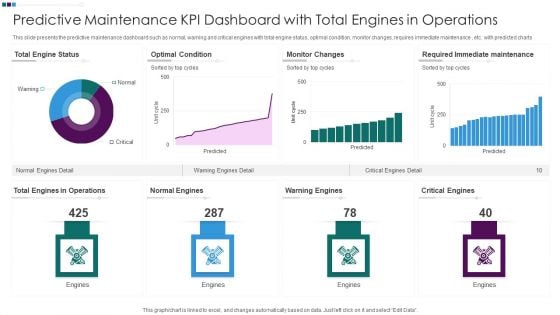
Predictive Maintenance KPI Dashboard With Total Engines In Operations Ppt Professional Inspiration PDF
This slide presents the predictive maintenance dashboard such as normal, warning and critical engines with total engine status, optimal condition, monitor changes, requires immediate maintenance , etc. with predicted charts. Pitch your topic with ease and precision using this Predictive Maintenance KPI Dashboard With Total Engines In Operations Ppt Professional Inspiration PDF. This layout presents information on Total Engine Status, Optimal Condition Monitor, Changes Warning Engines, Required Immediate Maintenance. It is also available for immediate download and adjustment. So, changes can be made in the color, design, graphics or any other component to create a unique layout.
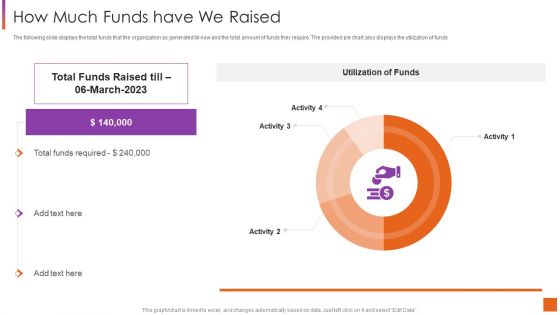
Investor Pitch Deck For Software Development How Much Funds Have We Raised Infographics PDF
The following slide displays the total funds that the organization as generated till now and the total amount of funds they require. The provided pie chart also displays the utilization of funds. Deliver an awe inspiring pitch with this creative Investor Pitch Deck For Software Development How Much Funds Have We Raised Infographics PDF bundle. Topics like Funds Raised, Utilization Funds, Activity can be discussed with this completely editable template. It is available for immediate download depending on the needs and requirements of the user.
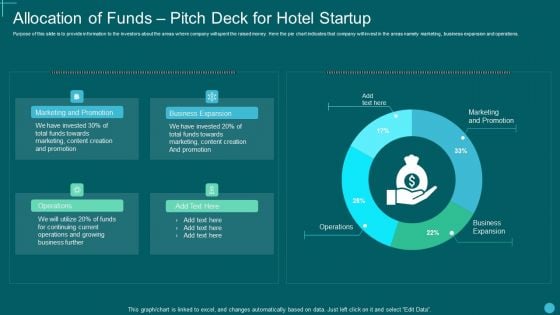
Allocation Of Funds Pitch Deck For Hotel Startup Slides PDF
Purpose of this slide is to provide information to the investors about the areas where company will spent the raised money. Here the pie chart indicates that company will invest in the areas namely marketing, business expansion and operations. Deliver an awe inspiring pitch with this creative Allocation Of Funds Pitch Deck For Hotel Startup Slides PDF bundle. Topics like Marketing Promotion, Business Expansion, Operations can be discussed with this completely editable template. It is available for immediate download depending on the needs and requirements of the user.
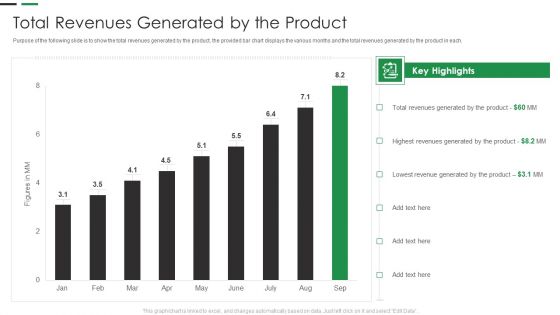
Evaluating New Commodity Impact On Market Total Revenues Generated By The Product Topics PDF
Purpose of the following slide is to show the total revenues generated by the product, the provided bar chart displays the various months and the total revenues generated by the product in each. Deliver an awe inspiring pitch with this creative Evaluating New Commodity Impact On Market Total Revenues Generated By The Product Topics PDF bundle. Topics like Key Highlights, Revenues Generated, Generated Product can be discussed with this completely editable template. It is available for immediate download depending on the needs and requirements of the user.
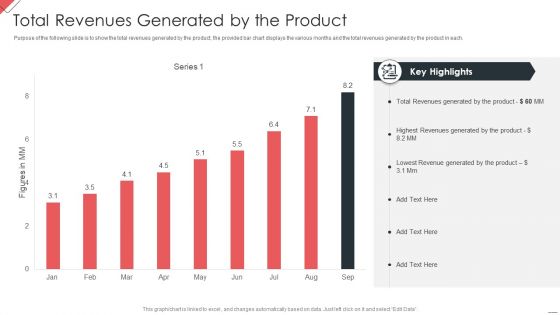
New Commodity Market Viability Review Total Revenues Generated By The Product Information PDF
Purpose of the following slide is to show the total revenues generated by the product, the provided bar chart displays the various months and the total revenues generated by the product in each. Deliver an awe inspiring pitch with this creative New Commodity Market Viability Review Total Revenues Generated By The Product Information PDF bundle. Topics like Revenues Generated, Highest Revenues, Lowest Revenue can be discussed with this completely editable template. It is available for immediate download depending on the needs and requirements of the user.
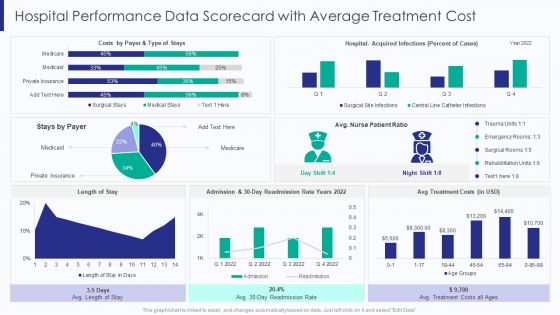
Healthcare Hospital Performance Data Scorecard With Average Treatment Cost Ppt Ideas Guide PDF
This graph or chart is linked to excel, and changes automatically based on data. Just left click on it and select Edit Data. Deliver and pitch your topic in the best possible manner with this Healthcare Hospital Performance Data Scorecard With Average Treatment Cost Ppt Ideas Guide PDF. Use them to share invaluable insights on Type Of Stays, Stays By Payer, Avg Treatment Costs, 30 Day Readmission and impress your audience. This template can be altered and modified as per your expectations. So, grab it now.
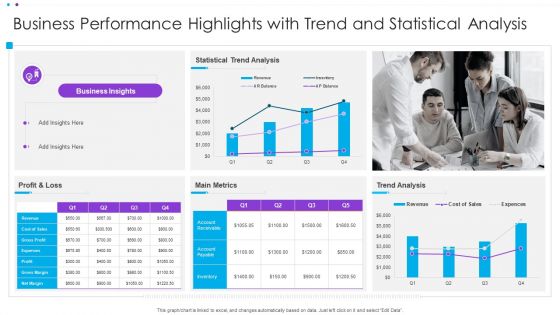
Business Performance Highlights With Trend And Statistical Analysis Ppt Infographic Template Display PDF
This graph or chart is linked to excel, and changes automatically based on data. Just left click on it and select Edit Data. Pitch your topic with ease and precision using this Business Performance Highlights With Trend And Statistical Analysis Ppt Infographic Template Display PDF. This layout presents information on Statistical Trend Analysis, Main Metrics, Profit And Loss. It is also available for immediate download and adjustment. So, changes can be made in the color, design, graphics or any other component to create a unique layout.
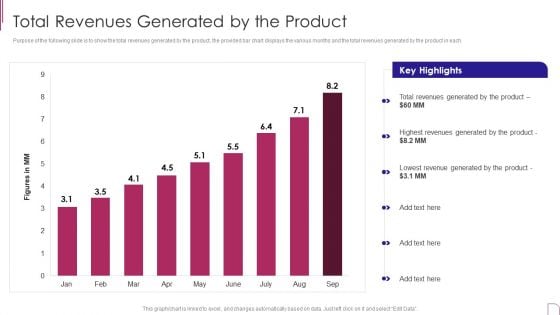
Yearly Product Performance Assessment Repor Total Revenues Generated By The Product Background PDF
Purpose of the following slide is to show the total revenues generated by the product, the provided bar chart displays the various months and the total revenues generated by the product in each. Deliver and pitch your topic in the best possible manner with this Yearly Product Performance Assessment Repor Total Revenues Generated By The Product Background PDF Use them to share invaluable insights on Key Highlights, Revenues Generated, Lowest Revenue and impress your audience. This template can be altered and modified as per your expectations. So, grab it now.
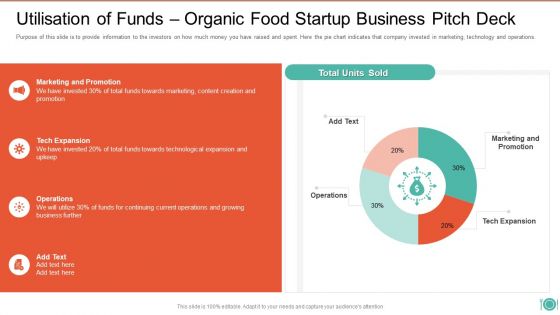
Utilisation Of Funds Organic Food Startup Business Pitch Deck Download PDF
Purpose of this slide is to provide information to the investors on how much money you have raised and spent. Here the pie chart indicates that company invested in marketing, technology and operations. Deliver an awe inspiring pitch with this creative Utilisation Of Funds Organic Food Startup Business Pitch Deck Download PDF bundle. Topics like Marketing And Promotion, Funds Towards Marketing, Towards Technological Expansion can be discussed with this completely editable template. It is available for immediate download depending on the needs and requirements of the user.
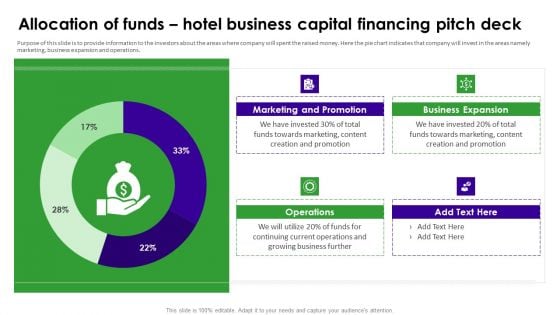
Allocation Of Funds Hotel Business Capital Financing Pitch Deck Information PDF
Purpose of this slide is to provide information to the investors about the areas where company will spent the raised money. Here the pie chart indicates that company will invest in the areas namely marketing, business expansion and operations. Deliver an awe inspiring pitch with this creative Allocation Of Funds Hotel Business Capital Financing Pitch Deck Information PDF bundle. Topics like Marketing And Promotion, Business Expansion, Operations can be discussed with this completely editable template. It is available for immediate download depending on the needs and requirements of the user.
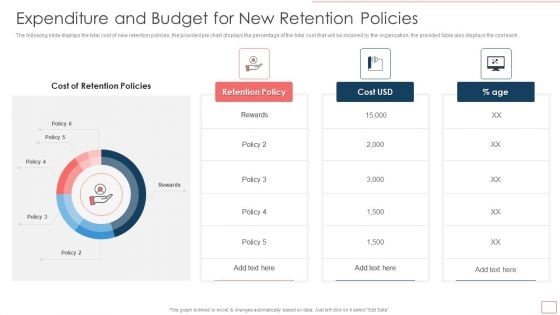
Strategic Human Resource Retention Management Expenditure And Budget Inspiration PDF
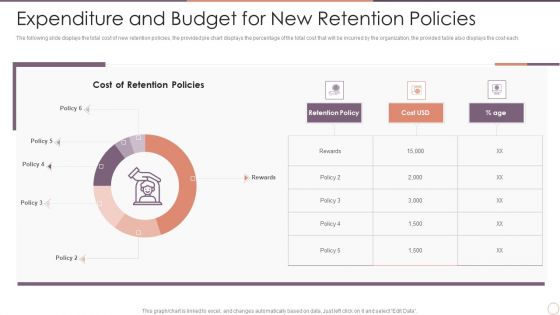
The following slide displays the total cost of new retention policies, the provided pie chart displays the percentage of the total cost that will be incurred by the organization, the provided table also displays the cost each. Deliver an awe inspiring pitch with this creative Strategic Human Resource Retention Management Expenditure And Budget Inspiration PDF bundle. Topics like Retention Policies, Rewards, Cost Of Retention can be discussed with this completely editable template. It is available for immediate download depending on the needs and requirements of the user.
Managing Employee Turnover Expenditure And Budget For New Retention Policies Topics PDF
The following slide displays the total cost of new retention policies, the provided pie chart displays the percentage of the total cost that will be incurred by the organization, the provided table also displays the cost each. Deliver and pitch your topic in the best possible manner with this Managing Employee Turnover Expenditure And Budget For New Retention Policies Topics PDF. Use them to share invaluable insights on Expenditure And Budget, New Retention Policies and impress your audience. This template can be altered and modified as per your expectations. So, grab it now.
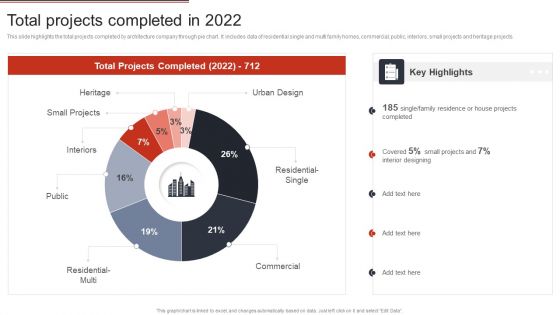
Building Design Firm Details Total Projects Completed In 2022 Ppt Infographic Template Graphics Pictures PDF
This slide highlights the total projects completed by architecture company through pie chart. It includes data of residential single and multi family homes, commercial, public, interiors, small projects and heritage projects. Deliver an awe inspiring pitch with this creative Building Design Firm Details Total Projects Completed In 2022 Ppt Infographic Template Graphics Pictures PDF bundle. Topics like Urban Design, Residential Single, Commercial, Interiors, Small Projects can be discussed with this completely editable template. It is available for immediate download depending on the needs and requirements of the user.
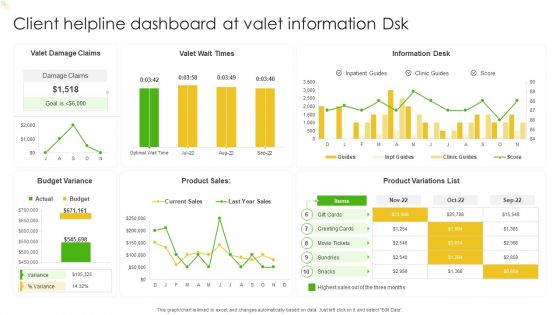
Client Helpline Dashboard At Valet Information Dsk Ppt Gallery Slide Portrait PDF
This graph or chart is linked to excel, and changes automatically based on data. Just left click on it and select Edit Data. Pitch your topic with ease and precision using this Client Helpline Dashboard At Valet Information Dsk Ppt Gallery Slide Portrait PDF. This layout presents information on Valet Damage Claims, Valet Wait Times, Information Desk. It is also available for immediate download and adjustment. So, changes can be made in the color, design, graphics or any other component to create a unique layout.
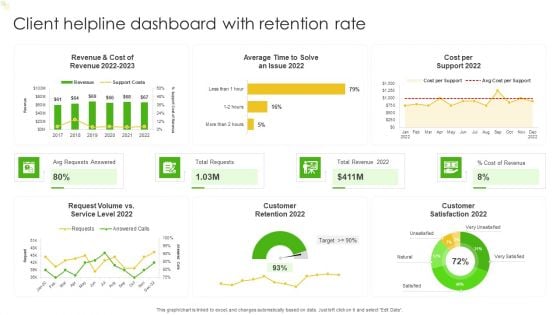
Client Helpline Dashboard With Retention Rate Ppt Gallery Ideas PDF
This graph or chart is linked to excel, and changes automatically based on data. Just left click on it and select Edit Data. Pitch your topic with ease and precision using this Client Helpline Dashboard With Retention Rate Ppt Gallery Ideas PDF. This layout presents information on Cost per Support 2022, Total Requests, Total Revenue 2022, Avg Requests Answered. It is also available for immediate download and adjustment. So, changes can be made in the color, design, graphics or any other component to create a unique layout.
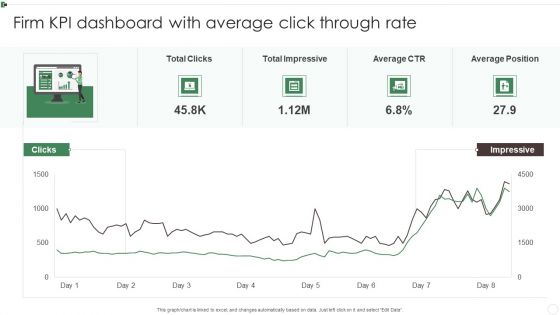
Firm KPI Dashboard With Average Click Through Rate Ppt Inspiration Sample PDF
This graph or chart is linked to excel, and changes automatically based on data. Just left click on it and select Edit Data. Pitch your topic with ease and precision using this Firm KPI Dashboard With Average Click Through Rate Ppt Inspiration Sample PDF. This layout presents information on Total Clicks, Total Impressive, Average CTR, Average Position. It is also available for immediate download and adjustment. So, changes can be made in the color, design, graphics or any other component to create a unique layout.
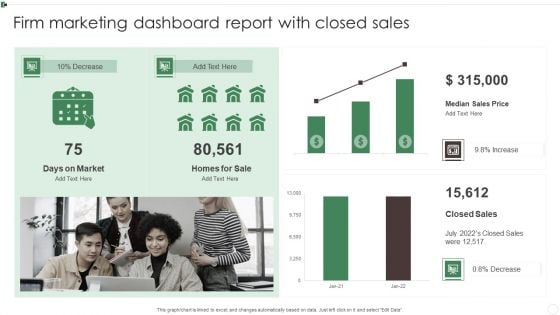
Firm Marketing Dashboard Report With Closed Sales Ppt Slides Graphics Example PDF
This graph or chart is linked to excel, and changes automatically based on data. Just left click on it and select Edit Data. Showcasing this set of slides titled Firm Marketing Dashboard Report With Closed Sales Ppt Slides Graphics Example PDF. The topics addressed in these templates are Days On Market, Homes For Sale, Median Sales Price, Closed Sales. All the content presented in this PPT design is completely editable. Download it and make adjustments in color, background, font etc. as per your unique business setting.
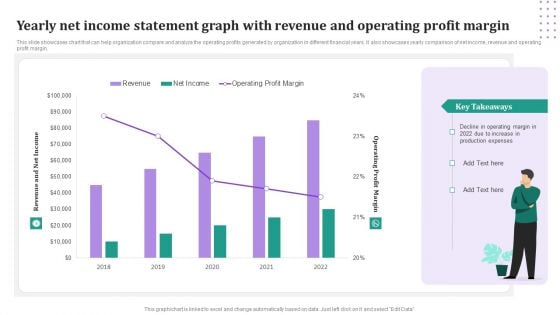
Yearly Net Income Statement Graph With Revenue And Operating Profit Margin Download PDF
This slide showcases chart that can help organization compare and analyze the operating profits generated by organization in different financial years. It also showcases yearly comparison of net income, revenue and operating profit margin. Pitch your topic with ease and precision using this Yearly Net Income Statement Graph With Revenue And Operating Profit Margin Download PDF. This layout presents information on Revenue, Net Income, Operating Profit Margin. It is also available for immediate download and adjustment. So, changes can be made in the color, design, graphics or any other component to create a unique layout.
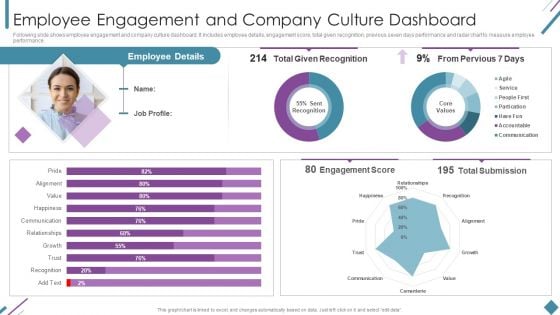
Metrics To Measure Business Performance Employee Engagement And Company Culture Demonstration PDF
Following slide shows employee engagement and company culture dashboard. It includes employee details, engagement score, total given recognition, previous seven days performance and radar chart to measure employee performance. Deliver and pitch your topic in the best possible manner with this Metrics To Measure Business Performance Employee Engagement And Company Culture Demonstration PDF. Use them to share invaluable insights on Employee Details, Total Given Recognition, Engagement Score and impress your audience. This template can be altered and modified as per your expectations. So, grab it now.
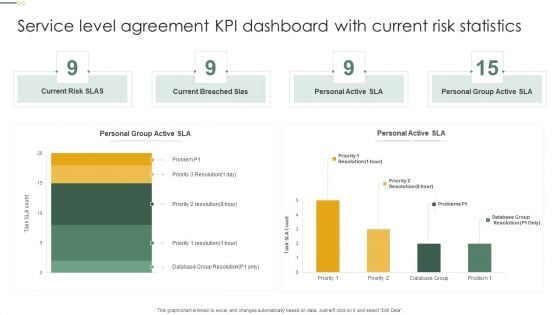
Service Level Agreement KPI Dashboard With Current Risk Statistics Topics PDF
This graph or chart is linked to excel, and changes automatically based on data. Just left click on it and select Edit Data. Pitch your topic with ease and precision using this Service Level Agreement KPI Dashboard With Current Risk Statistics Topics PDF. This layout presents information on Current Risk SLAS, Current Breached Slas, Personal Active SLA It is also available for immediate download and adjustment. So, changes can be made in the color, design, graphics or any other component to create a unique layout.
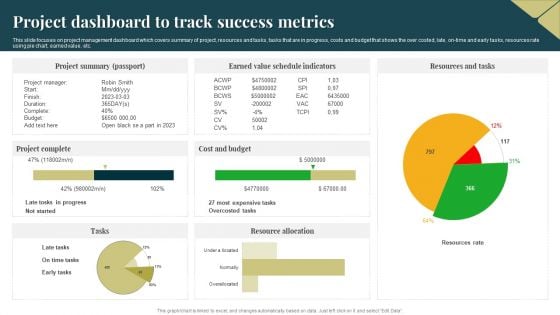
Project Dashboard To Track Success Metrics Background PDF
This slide focuses on project management dashboard which covers summary of project, resources and tasks, tasks that are in progress, costs and budget that shows the over costed, late, on time and early tasks, resources rate using pie chart, earned value, etc. Pitch your topic with ease and precision using this Project Dashboard To Track Success Metrics Background PDF. This layout presents information on Cost And Budget, Project Summary, Resource Allocation. It is also available for immediate download and adjustment. So, changes can be made in the color, design, graphics or any other component to create a unique layout.
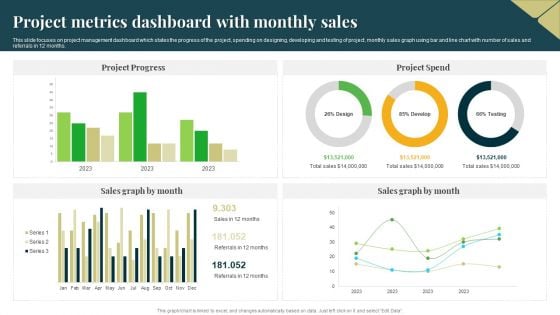
Project Metrics Dashboard With Monthly Sales Professional PDF
This slide focuses on project management dashboard which states the progress of the project, spending on designing, developing and testing of project, monthly sales graph using bar and line chart with number of sales and referrals in 12 months. Pitch your topic with ease and precision using this Project Metrics Dashboard With Monthly Sales Professional PDF. This layout presents information on Project Progress, Project Spend, Sales Graph. It is also available for immediate download and adjustment. So, changes can be made in the color, design, graphics or any other component to create a unique layout.
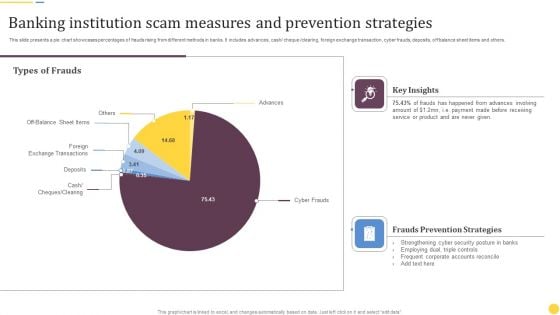
Banking Institution Scam Measures And Prevention Strategies Information PDF
This slide presents a pie chart showcases percentages of frauds rising from different methods in banks. It includes advances, cash or cheque or clearing, foreign exchange transaction, cyber frauds, deposits, off balance sheet items and others. Showcasing this set of slides titled Banking Institution Scam Measures And Prevention Strategies Information PDF. The topics addressed in these templates are Key Insights, Frauds Prevention Strategies, Types Of Frauds. All the content presented in this PPT design is completely editable. Download it and make adjustments in color, background, font etc. as per your unique business setting.
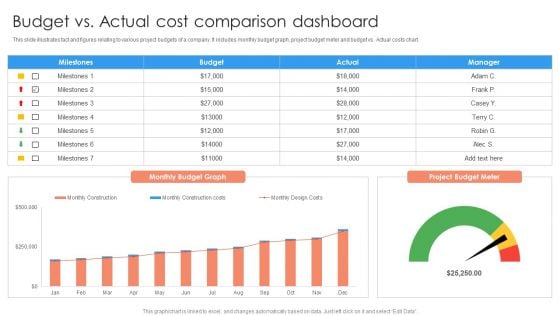
Budget Vs Actual Cost Comparison Dashboard Ppt PowerPoint Presentation Professional Format Ideas PDF
This slide illustrates fact and figures relating to various project budgets of a company. It includes monthly budget graph, project budget meter and budget vs. Actual costs chart.Pitch your topic with ease and precision using this Budget Vs Actual Cost Comparison Dashboard Ppt PowerPoint Presentation Professional Format Ideas PDF. This layout presents information on Milestones, Budget Graph, Manager. It is also available for immediate download and adjustment. So, changes can be made in the color, design, graphics or any other component to create a unique layout.
New Staff Onboarding Process KPI Tracking Dashboard Inspiration PDF
This slide showcase the KPI dashboard for tracking new hire onboarding completion progress. It includes KPIs such as onboarding completion status, employees per office, progress chart, hires starting in current and next week. Showcasing this set of slides titled New Staff Onboarding Process KPI Tracking Dashboard Inspiration PDF. The topics addressed in these templates are New Staff Onboarding Process, KPI Tracking Dashboard. All the content presented in this PPT design is completely editable. Download it and make adjustments in color, background, font etc. as per your unique business setting.
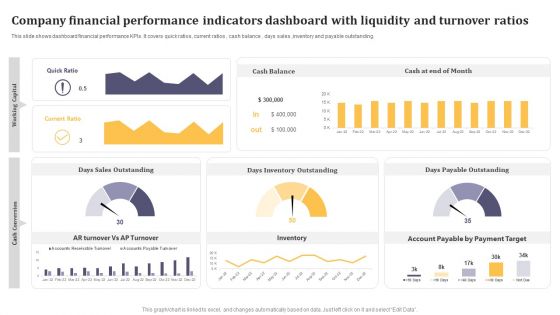
Company Financial Performance Indicators Dashboard With Liquidity And Turnover Ratios Formats PDF
This graph or chart is linked to excel, and changes automatically based on data. Just left click on it and select Edit Data. Pitch your topic with ease and precision using this Company Financial Performance Indicators Dashboard With Liquidity And Turnover Ratios Formats PDF. This layout presents information on Cash Balance, Days Inventory Outstanding, Days Payable Outstanding. It is also available for immediate download and adjustment. So, changes can be made in the color, design, graphics or any other component to create a unique layout.
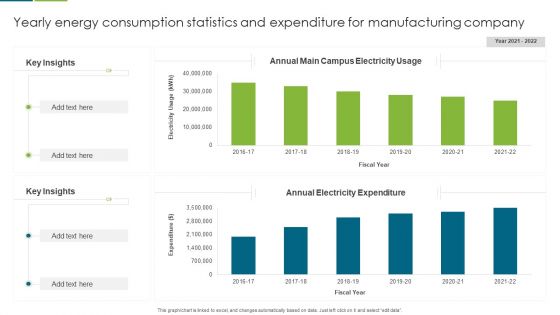
Yearly Energy Consumption Statistics And Expenditure For Manufacturing Company Guidelines PDF
This graph or chart is linked to excel, and changes automatically based on data. Just left click on it and select edit data. Pitch your topic with ease and precision using this Yearly Energy Consumption Statistics And Expenditure For Manufacturing Company Guidelines PDF. This layout presents information on Key Insights, Annual Electricity Expenditure, Annual Main Campus, Electricity Usage. It is also available for immediate download and adjustment. So, changes can be made in the color, design, graphics or any other component to create a unique layout.
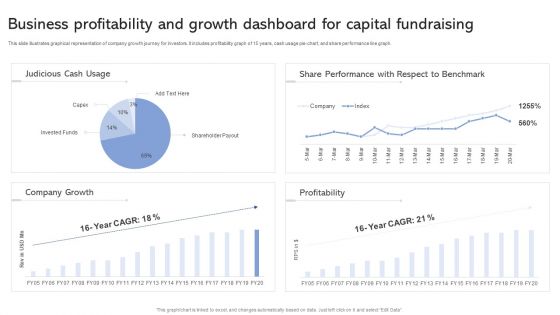
Business Profitability And Growth Dashboard For Capital Fundraising Ppt Slides Guide PDF
This slide illustrates graphical representation of company growth journey for investors. It includes profitability graph of 15 years, cash usage pie-chart, and share performance line graph. Showcasing this set of slides titled Business Profitability And Growth Dashboard For Capital Fundraising Ppt Slides Guide PDF. The topics addressed in these templates are Judicious Cash Usage, Share Performance, Respect To Benchmark. All the content presented in this PPT design is completely editable. Download it and make adjustments in color, background, font etc. as per your unique business setting.
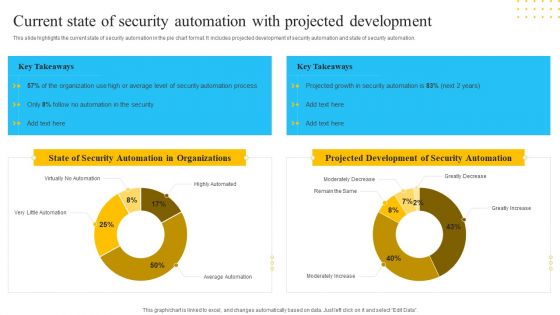
IT Security Automation Tools Integration Current State Of Security Automation With Projected Introduction PDF
This slide highlights the current state of security automation in the pie chart format. It includes projected development of security automation and state of security automation. Deliver and pitch your topic in the best possible manner with this IT Security Automation Tools Integration Current State Of Security Automation With Projected Introduction PDF. Use them to share invaluable insights on State Security, Automation Organizations, Projected Development, Security Automation and impress your audience. This template can be altered and modified as per your expectations. So, grab it now.
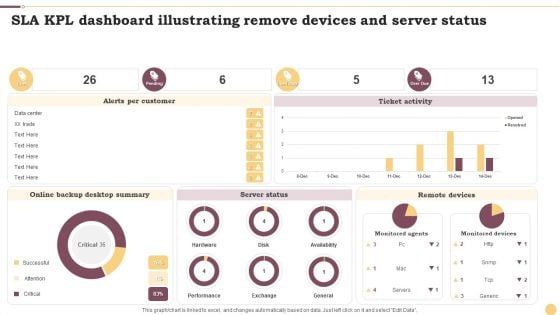
SLA KPL Dashboard Illustrating Remove Devices And Server Status Ppt Inspiration Layout Ideas PDF
This graph or chart is linked to excel, and changes automatically based on data. Just left click on it and select Edit Data. Showcasing this set of slides titled SLA KPL Dashboard Illustrating Remove Devices And Server Status Ppt Inspiration Layout Ideas PDF. The topics addressed in these templates are Alerts Per Customer, Ticket Activity, Server Status. All the content presented in this PPT design is completely editable. Download it and make adjustments in color, background, font etc. as per your unique business setting.
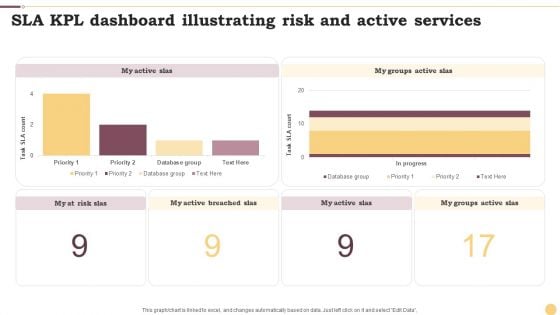
SLA KPL Dashboard Illustrating Risk And Active Services Ppt Portfolio Design Inspiration PDF
This graph or chart is linked to excel, and changes automatically based on data. Just left click on it and select Edit Data. Pitch your topic with ease and precision using this SLA KPL Dashboard Illustrating Risk And Active Services Ppt Portfolio Design Inspiration PDF. This layout presents information on My Active SLAs, Database Group, Priority. It is also available for immediate download and adjustment. So, changes can be made in the color, design, graphics or any other component to create a unique layout.
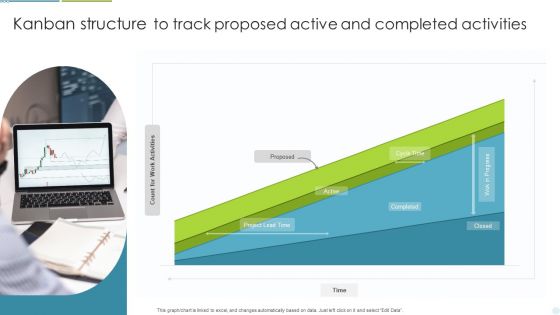
Kanban Structure To Track Proposed Active And Completed Activities Ppt Outline Slide Portrait PDF
This graph or chart is linked to excel, and changes automatically based on data. Just left click on it and select Edit Data. Pitch your topic with ease and precision using this Kanban Structure To Track Proposed Active And Completed Activities Ppt Outline Slide Portrait PDF. This layout presents information on Project Lead Time, Cycle Time, Completed. It is also available for immediate download and adjustment. So, changes can be made in the color, design, graphics or any other component to create a unique layout.


 Continue with Email

 Home
Home


