Capacity Dashboard
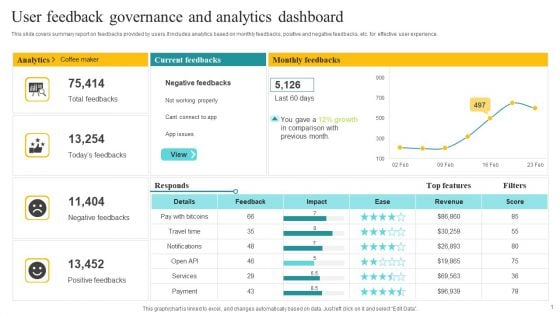
User Feedback Governance And Analytics Dashboard Ppt Professional Rules PDF
This slide covers summary report on feedbacks provided by users.It includes analytics based on monthly feedbacks, positive and negative feedbacks, etc. for effective user experience. Pitch your topic with ease and precision using this User Feedback Governance And Analytics Dashboard Ppt Professional Rules PDF. This layout presents information on Current Feedbacks, Monthly Feedbacks, Analytics. It is also available for immediate download and adjustment. So, changes can be made in the color, design, graphics or any other component to create a unique layout.
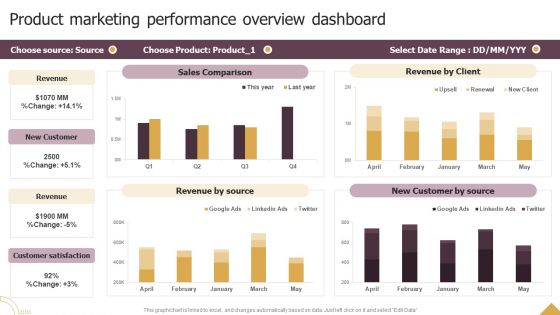
Product Marketing Performance Overview Dashboard Ppt Portfolio Professional PDF
The best PPT templates are a great way to save time, energy, and resources. Slidegeeks have 100 percent editable powerpoint slides making them incredibly versatile. With these quality presentation templates, you can create a captivating and memorable presentation by combining visually appealing slides and effectively communicating your message. Download Product Marketing Performance Overview Dashboard Ppt Portfolio Professional PDF from Slidegeeks and deliver a wonderful presentation.
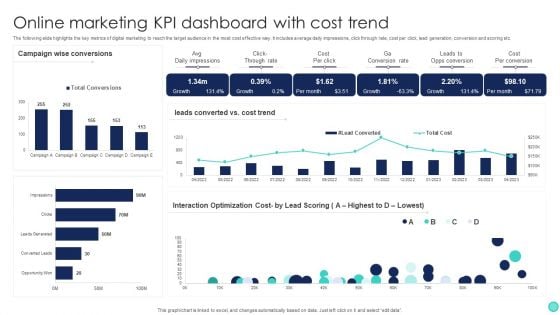
Online Marketing KPI Dashboard With Cost Trend Slides PDF
The following slide highlights the key metrics of digital marketing to reach the target audience in the most cost effective way. It includes average daily impressions, click through rate, cost per click, lead generation, conversion and scoring etc. Pitch your topic with ease and precision using this Online Marketing KPI Dashboard With Cost Trend Slides PDF. This layout presents information on Average Daily Impressions, Click Through Rate, Cost Per Click, Lead Generation, Conversion And Scoring. It is also available for immediate download and adjustment. So, changes can be made in the color, design, graphics or any other component to create a unique layout.
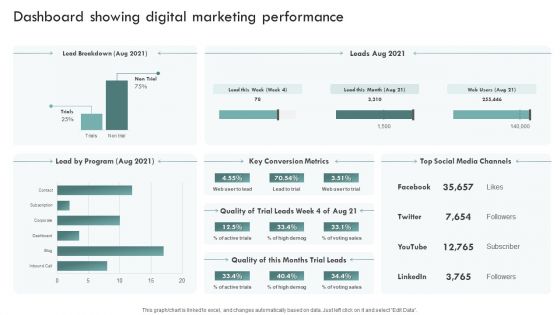
Brand Awareness Plan Dashboard Showing Digital Marketing Performance Sample PDF
This graph or chart is linked to excel, and changes automatically based on data. Just left click on it and select Edit Data. The best PPT templates are a great way to save time, energy, and resources. Slidegeeks have 100 percent editable powerpoint slides making them incredibly versatile. With these quality presentation templates, you can create a captivating and memorable presentation by combining visually appealing slides and effectively communicating your message. Download Brand Awareness Plan Dashboard Showing Digital Marketing Performance Sample PDF from Slidegeeks and deliver a wonderful presentation.
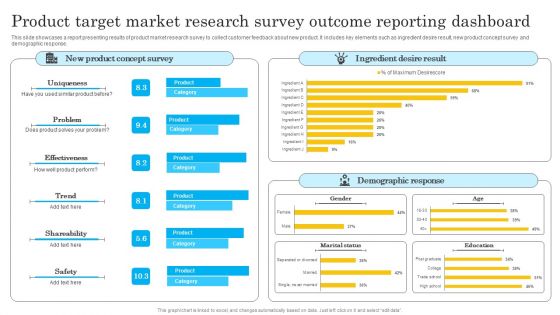
Product Target Market Research Survey Outcome Reporting Dashboard Portrait PDF
This slide showcases a report presenting results of product market research survey to collect customer feedback about new product. It includes key elements such as ingredient desire result, new product concept survey and demographic response. Showcasing this set of slides titled Product Target Market Research Survey Outcome Reporting Dashboard Portrait PDF. The topics addressed in these templates are Uniqueness, Problem, Effectiveness. All the content presented in this PPT design is completely editable. Download it and make adjustments in color, background, font etc. as per your unique business setting.
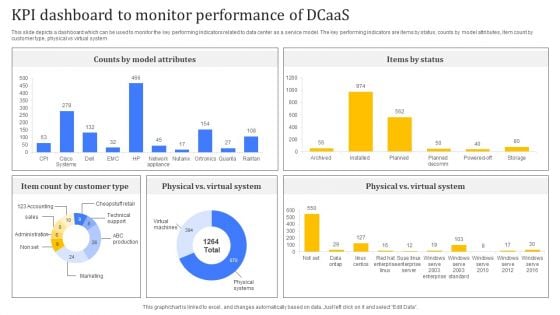
KPI Dashboard To Monitor Performance Of Dcaas Pictures PDF
Following slide highlights major benefits of applying data center as a service to business operations which can be used by businesses looking to modernize their IT infrastructure. Major benefits are in terms of scalability, flexibility, cost effectiveness, and security. Pitch your topic with ease and precision using this KPI Dashboard To Monitor Performance Of Dcaas Pictures PDF. This layout presents information on Customer Type, Counts By Model Attributes, Items By Status. It is also available for immediate download and adjustment. So, changes can be made in the color, design, graphics or any other component to create a unique layout.
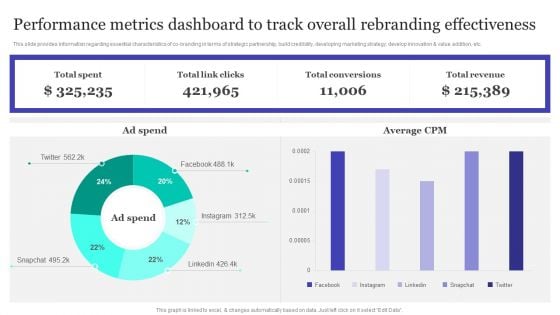
Performance Metrics Dashboard To Track Overall Rebranding Effectiveness Information PDF
This slide provides information regarding essential characteristics of co-branding in terms of strategic partnership, build credibility, developing marketing strategy, develop innovation and value addition, etc. This Performance Metrics Dashboard To Track Overall Rebranding Effectiveness Information PDF from Slidegeeks makes it easy to present information on your topic with precision. It provides customization options, so you can make changes to the colors, design, graphics, or any other component to create a unique layout. It is also available for immediate download, so you can begin using it right away. Slidegeeks has done good research to ensure that you have everything you need to make your presentation stand out. Make a name out there for a brilliant performance.
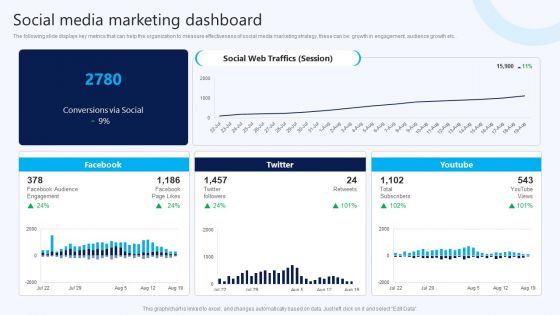
Social Media Marketing Dashboard B2B Electronic Commerce Startup Microsoft PDF
The following slide displays key metrics that can help the organization to measure effectiveness of social media marketing strategy, these can be growth in engagement, audience growth etc. Present like a pro with Social Media Marketing Dashboard B2B Electronic Commerce Startup Microsoft PDF Create beautiful presentations together with your team, using our easy-to-use presentation slides. Share your ideas in real-time and make changes on the fly by downloading our templates. So whether you are in the office, on the go, or in a remote location, you can stay in sync with your team and present your ideas with confidence. With Slidegeeks presentation got a whole lot easier. Grab these presentations today.
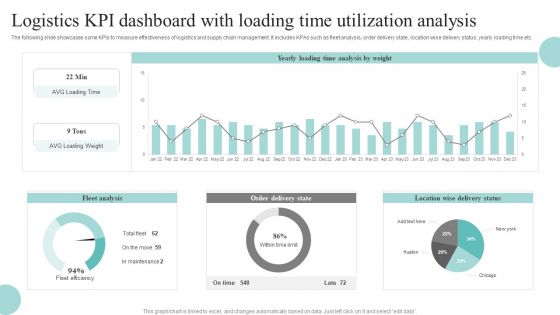
Logistics KPI Dashboard With Loading Time Utilization Analysis Download PDF
The following slide showcases some KPIs to measure effectiveness of logistics and supply chain management. It includes KPAs such as fleet analysis, order delivery state, location wise delivery status, yearly loading time etc. Pitch your topic with ease and precision using this Logistics KPI Dashboard With Loading Time Utilization Analysis Download PDF. This layout presents information on Fleet Analysis, Order Delivery State, Location Wise Delivery Status. It is also available for immediate download and adjustment. So, changes can be made in the color, design, graphics or any other component to create a unique layout.
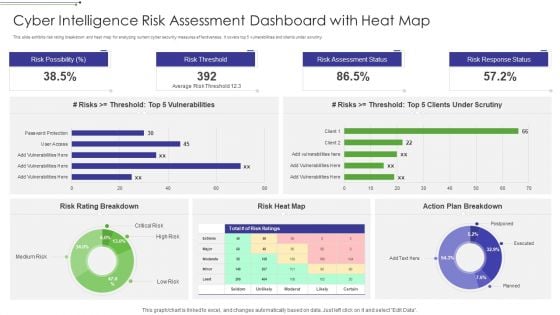
Cyber Intelligence Risk Assessment Dashboard With Heat Map Portrait PDF
This slide exhibits risk rating breakdown and heat map for analyzing current cyber security measures effectiveness. It covers top 5 vulnerabilities and clients under scrutiny. Pitch your topic with ease and precision using this Cyber Intelligence Risk Assessment Dashboard With Heat Map Portrait PDF This layout presents information on Risk Rating Breakdown, Action Plan Breakdown, Risk Possibility It is also available for immediate download and adjustment. So, changes can be made in the color, design, graphics or any other component to create a unique layout.
Key Blocks For Project Management Dashboard Ppt Icon Tips PDF
This slide illustrates graphical representations of facts and figures related to project drivers. It includes stakeholders engagement, feedback and response rate, business units performance etc. Showcasing this set of slides titled Key Blocks For Project Management Dashboard Ppt Icon Tips PDF. The topics addressed in these templates are Stakeholders Engagement Score, Business Units Performance, Effective Communication Score. All the content presented in this PPT design is completely editable. Download it and make adjustments in color, background, font etc. as per your unique business setting.
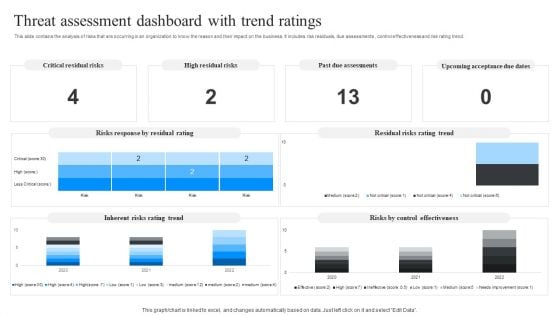
Threat Assessment Dashboard With Trend Ratings Ppt Model Vector PDF
This slide contains the analysis of risks that are occurring in an organization to know the reason and their impact on the business. It includes risk residuals, due assessments , control effectiveness and risk rating trend. Showcasing this set of slides titled Threat Assessment Dashboard With Trend Ratings Ppt Model Vector PDF. The topics addressed in these templates are Critical Residual Risks, High Residual Risks, Past Due Assessments. All the content presented in this PPT design is completely editable. Download it and make adjustments in color, background, font etc. as per your unique business setting.
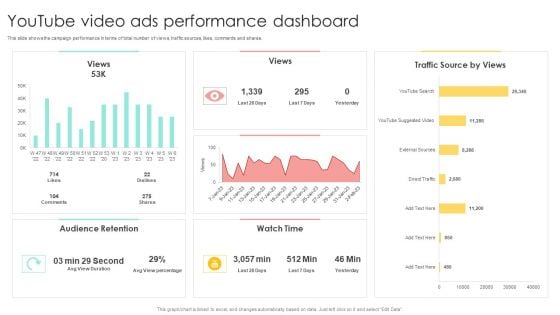
Media Advertising Youtube Video Ads Performance Dashboard Information PDF
This slide shows the campaign performance in terms of total number of views, traffic sources, likes, comments and shares. The best PPT templates are a great way to save time, energy, and resources. Slidegeeks have 100 percent editable powerpoint slides making them incredibly versatile. With these quality presentation templates, you can create a captivating and memorable presentation by combining visually appealing slides and effectively communicating your message. Download Media Advertising Youtube Video Ads Performance Dashboard Information PDF from Slidegeeks and deliver a wonderful presentation.
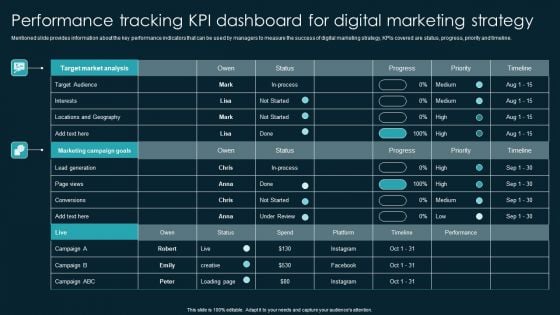
Performance Tracking KPI Dashboard For Digital Marketing Strategy Topics PDF
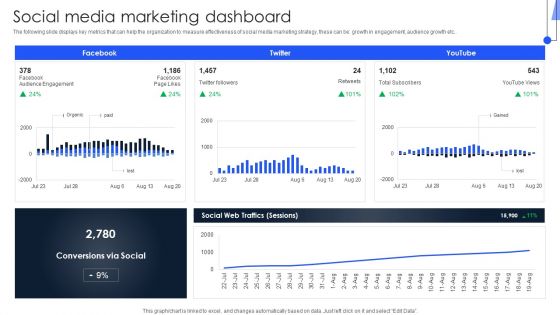
Implementing Marketing Strategies Social Media Marketing Dashboard Diagrams PDF
The following slide displays key metrics that can help the organization to measure effectiveness of social media marketing strategy, these can be growth in engagement, audience growth etc. Slidegeeks is here to make your presentations a breeze with Implementing Marketing Strategies Social Media Marketing Dashboard Diagrams PDF With our easy-to-use and customizable templates, you can focus on delivering your ideas rather than worrying about formatting. With a variety of designs to choose from, youre sure to find one that suits your needs. And with animations and unique photos, illustrations, and fonts, you can make your presentation pop. So whether youre giving a sales pitch or presenting to the board, make sure to check out Slidegeeks first.

Project Engagement Process Dashboard Ppt PowerPoint Presentation Complete Deck
Boost your confidence and team morale with this well-structured project engagement process dashboard ppt powerpoint presentation complete deck. This prefabricated set gives a voice to your presentation because of its well-researched content and graphics. Our experts have added all the components very carefully, thus helping you deliver great presentations with a single click. Not only that, it contains a set of twelve slides that are designed using the right visuals, graphics, etc. Various topics can be discussed, and effective brainstorming sessions can be conducted using the wide variety of slides added in this complete deck. Apart from this, our PPT design contains clear instructions to help you restructure your presentations and create multiple variations. The color, format, design anything can be modified as deemed fit by the user. Not only this, it is available for immediate download. So, grab it now.

Hiring KPI Dashboard Ppt PowerPoint Presentation Complete Deck With Slides
Boost your confidence and team morale with this well-structured Hiring KPI Dashboard Ppt PowerPoint Presentation Complete Deck With Slides. This prefabricated set gives a voice to your presentation because of its well-researched content and graphics. Our experts have added all the components very carefully, thus helping you deliver great presentations with a single click. Not only that, it contains a set of thridteen slides that are designed using the right visuals, graphics, etc. Various topics can be discussed, and effective brainstorming sessions can be conducted using the wide variety of slides added in this complete deck. Apart from this, our PPT design contains clear instructions to help you restructure your presentations and create multiple variations. The color, format, design anything can be modified as deemed fit by the user. Not only this, it is available for immediate download. So, grab it now.

Insurance Analytics Dashboard Ppt PowerPoint Presentation Complete With Slides
Boost your confidence and team morale with this well-structured Insurance Analytics Dashboard Ppt PowerPoint Presentation Complete With Slides. This prefabricated set gives a voice to your presentation because of its well-researched content and graphics. Our experts have added all the components very carefully, thus helping you deliver great presentations with a single click. Not only that, it contains a set of tweleve slides that are designed using the right visuals, graphics, etc. Various topics can be discussed, and effective brainstorming sessions can be conducted using the wide variety of slides added in this complete deck. Apart from this, our PPT design contains clear instructions to help you restructure your presentations and create multiple variations. The color, format, design anything can be modified as deemed fit by the user. Not only this, it is available for immediate download. So, grab it now.
Firm KPI Dashboard Ppt PowerPoint Presentation Complete Deck With Slides
Boost your confidence and team morale with this well-structured Firm KPI Dashboard Ppt PowerPoint Presentation Complete Deck With Slides. This prefabricated set gives a voice to your presentation because of its well-researched content and graphics. Our experts have added all the components very carefully, thus helping you deliver great presentations with a single click. Not only that, it contains a set of twelve slides that are designed using the right visuals, graphics, etc. Various topics can be discussed, and effective brainstorming sessions can be conducted using the wide variety of slides added in this complete deck. Apart from this, our PPT design contains clear instructions to help you restructure your presentations and create multiple variations. The color, format, design anything can be modified as deemed fit by the user. Not only this, it is available for immediate download. So, grab it now.

Incident Management Dashboard Ppt PowerPoint Presentation Complete Deck With Slides
Boost your confidence and team morale with this well structured Incident Management Dashboard Ppt PowerPoint Presentation Complete Deck With Slides. This prefabricated set gives a voice to your presentation because of its well researched content and graphics. Our experts have added all the components very carefully, thus helping you deliver great presentations with a single click. Not only that, it contains a set of Twenty slides that are designed using the right visuals, graphics, etc. Various topics can be discussed, and effective brainstorming sessions can be conducted using the wide variety of slides added in this complete deck. Apart from this, our PPT design contains clear instructions to help you restructure your presentations and create multiple variations. The color, format, design anything can be modified as deemed fit by the user. Not only this, it is available for immediate download. So, grab it now.
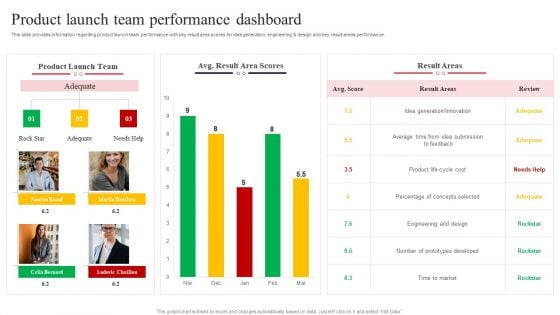
New Product Launch Product Launch Team Performance Dashboard Portrait PDF
This slide provides information regarding product launch team performance with key result area scores for idea generation, engineering AND design and key result areas performance. Retrieve professionally designed New Product Launch Product Launch Team Performance Dashboard Portrait PDF to effectively convey your message and captivate your listeners. Save time by selecting pre-made slideshows that are appropriate for various topics, from business to educational purposes. These themes come in many different styles, from creative to corporate, and all of them are easily adjustable and can be edited quickly. Access them as PowerPoint templates or as Google Slides themes. You dont have to go on a hunt for the perfect presentation because Slidegeeks got you covered from everywhere.
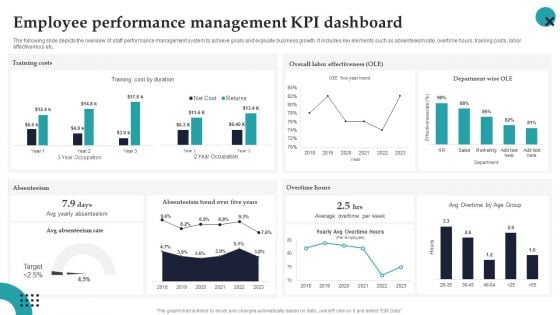
Employee Performance Management Kpi Dashboard Employee Performance Management Portrait PDF
The following slide depicts the overview of staff performance management system to achieve goals and evaluate business growth. It includes key elements such as absenteeism rate, overtime hours, training costs, labor effectiveness etc. Present like a pro with Employee Performance Management Kpi Dashboard Employee Performance Management Portrait PDF Create beautiful presentations together with your team, using our easy-to-use presentation slides. Share your ideas in real-time and make changes on the fly by downloading our templates. So whether you are in the office, on the go, or in a remote location, you can stay in sync with your team and present your ideas with confidence. With Slidegeeks presentation got a whole lot easier. Grab these presentations today.

Client Support Dashboard Ppt PowerPoint Presentation Complete Deck With Slides
Boost your confidence and team morale with this well-structured Client Support Dashboard Ppt PowerPoint Presentation Complete Deck With Slides. This prefabricated set gives a voice to your presentation because of its well-researched content and graphics. Our experts have added all the components very carefully, thus helping you deliver great presentations with a single click. Not only that, it contains a set of twelve slides that are designed using the right visuals, graphics, etc. Various topics can be discussed, and effective brainstorming sessions can be conducted using the wide variety of slides added in this complete deck. Apart from this, our PPT design contains clear instructions to help you restructure your presentations and create multiple variations. The color, format, design anything can be modified as deemed fit by the user. Not only this, it is available for immediate download. So, grab it now.
Leads Tracking Dashboard Ppt PowerPoint Presentation Complete Deck With Slides
Boost your confidence and team morale with this well-structured Leads Tracking Dashboard Ppt PowerPoint Presentation Complete Deck With Slides. This prefabricated set gives a voice to your presentation because of its well-researched content and graphics. Our experts have added all the components very carefully, thus helping you deliver great presentations with a single click. Not only that, it contains a set of twelve slides that are designed using the right visuals, graphics, etc. Various topics can be discussed, and effective brainstorming sessions can be conducted using the wide variety of slides added in this complete deck. Apart from this, our PPT design contains clear instructions to help you restructure your presentations and create multiple variations. The color, format, design anything can be modified as deemed fit by the user. Not only this, it is available for immediate download. So, grab it now.
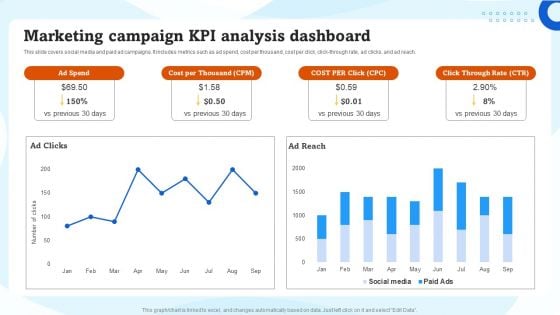
Marketing Campaign KPI Analysis Dashboard Ppt Inspiration Example File PDF
This slide covers social media and paid ad campaigns. It includes metrics such as ad spend, cost per thousand, cost per click, click-through rate, ad clicks, and ad reach. Coming up with a presentation necessitates that the majority of the effort goes into the content and the message you intend to convey. The visuals of a PowerPoint presentation can only be effective if it supplements and supports the story that is being told. Keeping this in mind our experts created Marketing Campaign KPI Analysis Dashboard Ppt Inspiration Example File PDF to reduce the time that goes into designing the presentation. This way, you can concentrate on the message while our designers take care of providing you with the right template for the situation.
Project Status Dashboard With Stages And Deliverables Ppt Icon Design Inspiration PDF
This slide shows dashboard with project status based on stages and tasks. It provides information such as project cost performance, actual cost, budget, timeline, resource capacity, etc. Showcasing this set of slides titled Project Status Dashboard With Stages And Deliverables Ppt Icon Design Inspiration PDF. The topics addressed in these templates are Project Cost Performance, Actual Cost, Total Budget. All the content presented in this PPT design is completely editable. Download it and make adjustments in color, background, font etc. as per your unique business setting.
Enhancing Logistics Customer Service Supply Chain Activity Tracking Dashboard Sample PDF
This slide shows the dashboard that depicts supply chain management which includes retailer and warehouse capacity, delivery status from supplier to warehouse, time to reach there, etc. Deliver and pitch your topic in the best possible manner with this Enhancing Logistics Customer Service Supply Chain Activity Tracking Dashboard Sample PDF. Use them to share invaluable insights on Retailer One Capacity, Warehouse Capacity Time, Retailer Two Capacity, Supplier To Warehouse and impress your audience. This template can be altered and modified as per your expectations. So, grab it now.
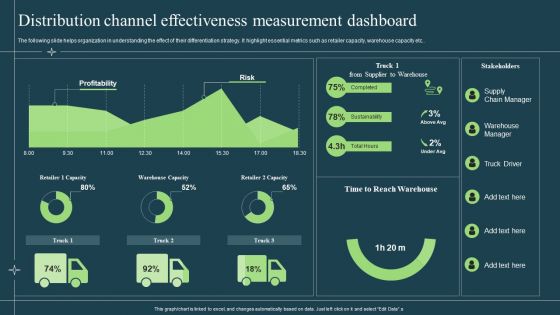
Differentiation Techniques Ways To Surpass Competitors Distribution Channel Effectiveness Measurement Dashboard Ideas PDF
The following slide helps organization in understanding the effect of their differentiation strategy. It highlight essential metrics such as retailer capacity, warehouse capacity etc. Deliver an awe inspiring pitch with this creative Differentiation Techniques Ways To Surpass Competitors Distribution Channel Effectiveness Measurement Dashboard Ideas PDF bundle. Topics like Profitability, Risk, Retailer can be discussed with this completely editable template. It is available for immediate download depending on the needs and requirements of the user.
Data Project Lifecycle Management Dashboard To Ensure Better Decision Making Icons PDF
This slide covers data lifecycle management dashboard to ensure better decision making. It involves details such as capacity based on department, classification of files and email audit.Showcasing this set of slides titled Data Project Lifecycle Management Dashboard To Ensure Better Decision Making Icons PDF. The topics addressed in these templates are Redudant Content, Abandoned Files, Capacity Department. All the content presented in this PPT design is completely editable. Download it and make adjustments in color, background, font etc. as per your unique business setting.
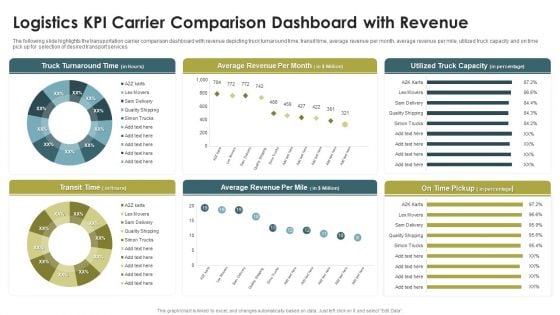
Logistics KPI Carrier Comparison Dashboard With Revenue Ppt Infographics Portfolio PDF
The following slide highlights the transportation carrier comparison dashboard with revenue depicting truck turnaround time, transit time, average revenue per month, average revenue per mile, utilized truck capacity and on time pick up for selection of desired transport services. Pitch your topic with ease and precision using this Logistics KPI Carrier Comparison Dashboard With Revenue Ppt Infographics Portfolio PDF. This layout presents information on Truck Turnaround Time, Average Revenue, Per Month, Transit Time. It is also available for immediate download and adjustment. So, changes can be made in the color, design, graphics or any other component to create a unique layout.
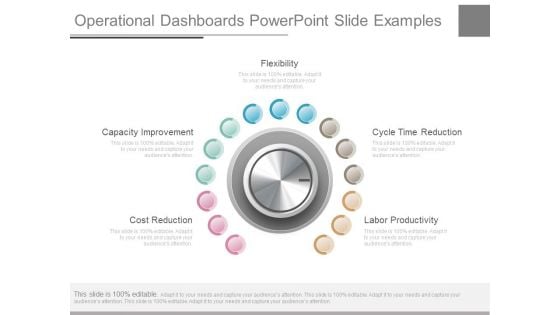
Operational Dashboards Powerpoint Slide Examples
This is a operational dashboards powerpoint slide examples. This is a five stage process. The stages in this process are cost reduction, capacity improvement, flexibility, cycle time reduction, labor productivity.
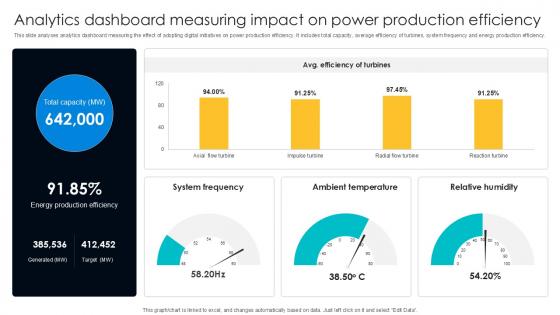
Analytics Dashboard Measuring Digital Transformation Journey PPT Slide DT SS V
This slide analyses analytics dashboard measuring the effect of adopting digital initiatives on power production efficiency. It includes total capacity, average efficiency of turbines, system frequency and energy production efficiency. Do you have to make sure that everyone on your team knows about any specific topic I yes, then you should give Analytics Dashboard Measuring Digital Transformation Journey PPT Slide DT SS V a try. Our experts have put a lot of knowledge and effort into creating this impeccable Analytics Dashboard Measuring Digital Transformation Journey PPT Slide DT SS V. You can use this template for your upcoming presentations, as the slides are perfect to represent even the tiniest detail. You can download these templates from the Slidegeeks website and these are easy to edit. So grab these today This slide analyses analytics dashboard measuring the effect of adopting digital initiatives on power production efficiency. It includes total capacity, average efficiency of turbines, system frequency and energy production efficiency.
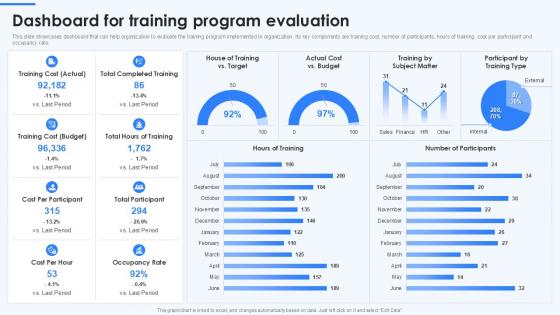
Dashboard For Training Program Evaluation On Job Employee Training Program For Skills
The Dashboard For Training Program Evaluation On Job Employee Training Program For Skills is a compilation of the most recent design trends as a series of slides. It is suitable for any subject or industry presentation, containing attractive visuals and photo spots for businesses to clearly express their messages. This template contains a variety of slides for the user to input data, such as structures to contrast two elements, bullet points, and slides for written information. Slidegeeks is prepared to create an impression. Our Dashboard for Training Program Evaluation on Job Employee Training Program for Skills shall offer a graphical representation providing insights to measure the effectiveness of an organizations training initiatives. This particular slide captures such important performance metrics such as the cost associated with training, number of participants, total hours undertaken in the training program, per participant cost, and occupation rate that help evaluate the entire program conducted.
New Hires Data Tracker Dashboard Employee Attraction And Competency Ppt Slide
This slide shows dashboard including date related to new hires for recruitment. It include data related to new hires per month, new hires for various departments and by sources, etc. Coming up with a presentation necessitates that the majority of the effort goes into the content and the message you intend to convey. The visuals of a PowerPoint presentation can only be effective if it supplements and supports the story that is being told. Keeping this in mind our experts created New Hires Data Tracker Dashboard Employee Attraction And Competency Ppt Slide to reduce the time that goes into designing the presentation. This way, you can concentrate on the message while our designers take care of providing you with the right template for the situation. This slide shows dashboard including date related to new hires for recruitment. It include data related to new hires per month, new hires for various departments and by sources, etc.
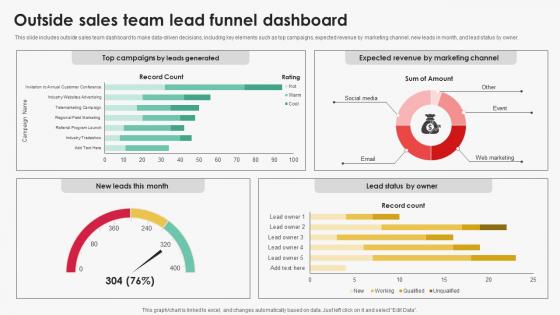
Outside Sales Team Lead Funnel Dashboard Efficient Sales Territory Management To Build SA SS V
This slide includes outside sales team dashboard to make data-driven decisions, including key elements such as top campaigns, expected revenue by marketing channel, new leads in month, and lead status by owner. Retrieve professionally designed Outside Sales Team Lead Funnel Dashboard Efficient Sales Territory Management To Build SA SS V to effectively convey your message and captivate your listeners. Save time by selecting pre-made slideshows that are appropriate for various topics, from business to educational purposes. These themes come in many different styles, from creative to corporate, and all of them are easily adjustable and can be edited quickly. Access them as PowerPoint templates or as Google Slides themes. You do not have to go on a hunt for the perfect presentation because Slidegeeks got you covered from everywhere. This slide includes outside sales team dashboard to make data-driven decisions, including key elements such as top campaigns, expected revenue by marketing channel, new leads in month, and lead status by owner.
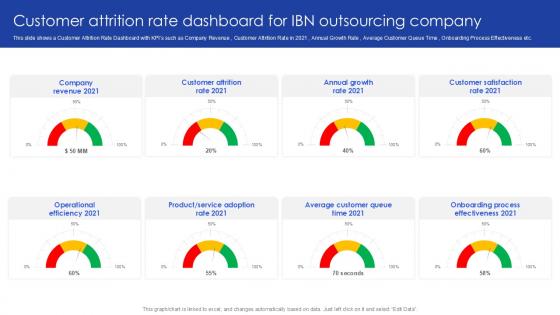
Customer Attrition Rate Dashboard For IBN Outsourcing Company PPT Template SS
This slide shows a Customer Attrition Rate Dashboard with KPIs such as Company Revenue , Customer Attrition Rate in 2021 , Annual Growth Rate , Average Customer Queue Time , Onboarding Process Effectiveness etc. There are so many reasons you need a Customer Attrition Rate Dashboard For IBN Outsourcing Company PPT Template SS. The first reason is you can not spend time making everything from scratch, Thus, Slidegeeks has made presentation templates for you too. You can easily download these templates from our website easily. This slide shows a Customer Attrition Rate Dashboard with KPIs such as Company Revenue , Customer Attrition Rate in 2021 , Annual Growth Rate , Average Customer Queue Time , Onboarding Process Effectiveness etc.
Cybersecurity Risk Assessment Program Dashboard For Tracking Cyber Attack Risk Levels
Explore a selection of the finest Cybersecurity Risk Assessment Program Dashboard For Tracking Cyber Attack Risk Levels here. With a plethora of professionally designed and pre-made slide templates, you can quickly and easily find the right one for your upcoming presentation. You can use our Cybersecurity Risk Assessment Program Dashboard For Tracking Cyber Attack Risk Levels to effectively convey your message to a wider audience. Slidegeeks has done a lot of research before preparing these presentation templates. The content can be personalized and the slides are highly editable. Grab templates today from Slidegeeks. This slide represents Cybersecurity Risk Assessment Program Dashboard to effectively track cyber security risk levels. This will provide a structured approach for organizations to review and mitigate cyber threats. It includes multiple threat agents, attack methods, and preventive controls implemented with detailed insights, and it shows critical metrics including risk scores, the number of infected systems, and detected vulnerabilities.
Administering Logistics Activities In SCM Supply Chain Activity Tracking Dashboard Elements PDF
This slide shows the dashboard that depicts supply chain management which includes retailer and warehouse capacity, delivery status from supplier to warehouse, time to reach there, etc. Deliver and pitch your topic in the best possible manner with this Administering Logistics Activities In SCM Supply Chain Activity Tracking Dashboard Elements PDF. Use them to share invaluable insights on Warehouse Capacity, Profitability, Sustainability and impress your audience. This template can be altered and modified as per your expectations. So, grab it now.
Developing Excellence In Logistics Operations Supply Chain Activity Tracking Dashboard Elements PDF
This slide shows the dashboard that depicts supply chain management which includes retailer and warehouse capacity, delivery status from supplier to warehouse, time to reach there, etc.Deliver and pitch your topic in the best possible manner with this Developing Excellence In Logistics Operations Supply Chain Activity Tracking Dashboard Elements PDF Use them to share invaluable insights on Reach Warehouse, Warehouse Capacity, Supplier To Warehouse and impress your audience. This template can be altered and modified as per your expectations. So, grab it now.

Actual And Planned Partner Executive Performance Dashboard Ppt Show Outline PDF
This slide covers the partner executive dashboard that focuses on revenues, pipeline, capability scoreboard, along with actual and planned values quarterly. Deliver an awe inspiring pitch with this creative actual and planned partner executive performance dashboard ppt show outline pdf bundle. Topics like actual and planned partner executive performance dashboard can be discussed with this completely editable template. It is available for immediate download depending on the needs and requirements of the user.
Unlocking Potential IoTs Application Dashboard For Tracking IoT Devices Performance IoT SS V
This slide provides a dashboard for monitoring IoT devices that enhance agricultural practices. It incorporates IoT sensors to measure water tank capacity, Live crop monitoring, temperature and humidity measurements, control sprinklers, etc. Make sure to capture your audiences attention in your business displays with our gratis customizable Unlocking Potential IoTs Application Dashboard For Tracking IoT Devices Performance IoT SS V. These are great for business strategies, office conferences, capital raising or task suggestions. If you desire to acquire more customers for your tech business and ensure they stay satisfied, create your own sales presentation with these plain slides. This slide provides a dashboard for monitoring IoT devices that enhance agricultural practices. It incorporates IoT sensors to measure water tank capacity, Live crop monitoring, temperature and humidity measurements, control sprinklers, etc.
Automating Supply Chain Dashboard For Tracking Impact Of Supply Chain Automation Pictures PDF
This slide covers the dashboard for back-end tracking of overall impact automation. It include KPIs such as retailer capacity, warehouse capacity, truck efficiency, time to reach warehouse, sustainability, etc. Deliver and pitch your topic in the best possible manner with this Automating Supply Chain Dashboard For Tracking Impact Of Supply Chain Automation Pictures PDF. Use them to share invaluable insights on Supply Chain Manager, Warehouse Manager, Truck Driver and impress your audience. This template can be altered and modified as per your expectations. So, grab it now.
Streamlining Operations With Supply Chain Automation Dashboard For Tracking Impact Of Supply Chain Automation Slides PDF
This slide covers the dashboard for back end tracking of overall impact automation. It include KPIs such as retailer capacity, warehouse capacity, truck efficiency, time to reach warehouse, sustainability, etc. There are so many reasons you need a Streamlining Operations With Supply Chain Automation Dashboard For Tracking Impact Of Supply Chain Automation Slides PDF. The first reason is you can not spend time making everything from scratch, Thus, Slidegeeks has made presentation templates for you too. You can easily download these templates from our website easily.
Optimizing Logistics Management Process Supply Chain Activity Tracking Dashboard Introduction PDF
This slide shows the dashboard that depicts supply chain management which includes retailer and warehouse capacity, delivery status from supplier to warehouse, time to reach there, etc. Deliver an awe inspiring pitch with this creative optimizing logistics management process supply chain activity tracking dashboard introduction pdf bundle. Topics like supply chain activity tracking dashboard can be discussed with this completely editable template. It is available for immediate download depending on the needs and requirements of the user.
Continual Improvement Procedure In Supply Chain Supply Chain Activity Tracking Dashboard Background PDF
This slide shows the dashboard that depicts supply chain management which includes retailer and warehouse capacity, delivery status from supplier to warehouse, time to reach there, etc.Deliver and pitch your topic in the best possible manner with this Continual Improvement Procedure In Supply Chain Supply Chain Activity Tracking Dashboard Background PDF. Use them to share invaluable insights on Segregating Products, Ensuring Optimized, Additional Responsibilities and impress your audience. This template can be altered and modified as per your expectations. So, grab it now.
Integrating AI To Enhance Dashboard For Tracking Impact Of Supply Chain Automation Themes PDF
This slide covers the dashboard for back-end tracking of overall impact automation. It include KPIs such as retailer capacity, warehouse capacity, truck efficiency, time to reach warehouse, sustainability, etc. Do you have an important presentation coming up Are you looking for something that will make your presentation stand out from the rest Look no further than Integrating AI To Enhance Dashboard For Tracking Impact Of Supply Chain Automation Themes PDF. With our professional designs, you can trust that your presentation will pop and make delivering it a smooth process. And with Slidegeeks, you can trust that your presentation will be unique and memorable. So why wait Grab Integrating AI To Enhance Dashboard For Tracking Impact Of Supply Chain Automation Themes PDF today and make your presentation stand out from the rest.
Automating Supply Chain Dashboard For Tracking Impact Of Transport Automation Themes PDF
This slide covers the dashboard for tracking vehicle efficiency after transport automation. It include KPIs such as truck turnaround time, average revenue per hour, truckload capacity, transit time, on-time pickup, and average revenue per mile. Deliver an awe inspiring pitch with this creative Automating Supply Chain Dashboard For Tracking Impact Of Transport Automation Themes PDF bundle. Topics like Average Revenue, Per Mile, Truck Turnaround can be discussed with this completely editable template. It is available for immediate download depending on the needs and requirements of the user.
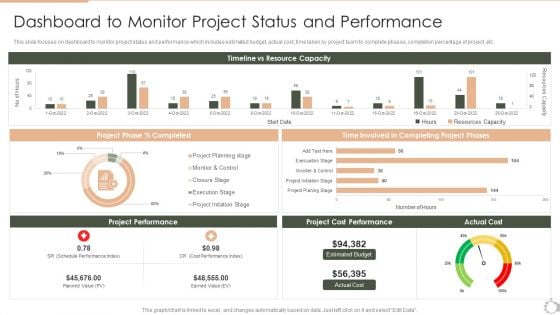
Techniques For Timely Project Dashboard To Monitor Project Status And Performance Microsoft PDF
This slide focuses on dashboard to monitor project status and performance which includes estimated budget, actual cost, time taken by project team to complete phases, completion percentage of project, etc. Deliver and pitch your topic in the best possible manner with this Techniques For Timely Project Dashboard To Monitor Project Status And Performance Microsoft PDF. Use them to share invaluable insights on Timeline vs, Resource Capacity, Project Phase, Time Involved and impress your audience. This template can be altered and modified as per your expectations. So, grab it now.

Internal And External Logistics Management Procedure Warehouse Management System WMS Dashboard Grid Slides PDF
The purpose of this slide is to provide a glimpse of the problems faced by our logistic company at present such as fuel costs, lack of technology, government regulations, inventory management etc. Deliver an awe inspiring pitch with this creative internal and external logistics management procedure warehouse management system wms dashboard grid slides pdf bundle. Topics like order status graph, warehouse capacity, transactions today can be discussed with this completely editable template. It is available for immediate download depending on the needs and requirements of the user.
Dashboard For Tracking Impact Of Transport Automation Optimizing Automated Supply Chain And Logistics Inspiration PDF
This slide covers the dashboard for tracking vehicle efficiency after transport automation. It include KPIs such as truck turnaround time, average revenue per hour, truckload capacity, transit time, on-time pickup, and average revenue per mile. Whether you have daily or monthly meetings, a brilliant presentation is necessary. Dashboard For Tracking Impact Of Transport Automation Optimizing Automated Supply Chain And Logistics Inspiration PDF can be your best option for delivering a presentation. Represent everything in detail using Dashboard For Tracking Impact Of Transport Automation Optimizing Automated Supply Chain And Logistics Inspiration PDF and make yourself stand out in meetings. The template is versatile and follows a structure that will cater to your requirements. All the templates prepared by Slidegeeks are easy to download and edit. Our research experts have taken care of the corporate themes as well. So, give it a try and see the results.
Integrating AI To Enhance Dashboard For Tracking Impact Of Transport Automation Template PDF
This slide covers the dashboard for tracking vehicle efficiency after transport automation. It include KPIs such as truck turnaround time, average revenue per hour, truckload capacity, transit time, on-time pickup, and average revenue per mile. Whether you have daily or monthly meetings, a brilliant presentation is necessary. Integrating AI To Enhance Dashboard For Tracking Impact Of Transport Automation Template PDF can be your best option for delivering a presentation. Represent everything in detail using Integrating AI To Enhance Dashboard For Tracking Impact Of Transport Automation Template PDF and make yourself stand out in meetings. The template is versatile and follows a structure that will cater to your requirements. All the templates prepared by Slidegeeks are easy to download and edit. Our research experts have taken care of the corporate themes as well. So, give it a try and see the results.
Streamlining Operations With Supply Chain Automation Dashboard For Tracking Impact Of Transport Automation Demonstration PDF
This slide covers the dashboard for tracking vehicle efficiency after transport automation. It include KPIs such as truck turnaround time, average revenue per hour, truckload capacity, transit time, on-time pickup, and average revenue per mile. Do you have to make sure that everyone on your team knows about any specific topic I yes, then you should give Streamlining Operations With Supply Chain Automation Dashboard For Tracking Impact Of Transport Automation Demonstration PDF a try. Our experts have put a lot of knowledge and effort into creating this impeccable Streamlining Operations With Supply Chain Automation Dashboard For Tracking Impact Of Transport Automation Demonstration PDF. You can use this template for your upcoming presentations, as the slides are perfect to represent even the tiniest detail. You can download these templates from the Slidegeeks website and these are easy to edit. So grab these today.
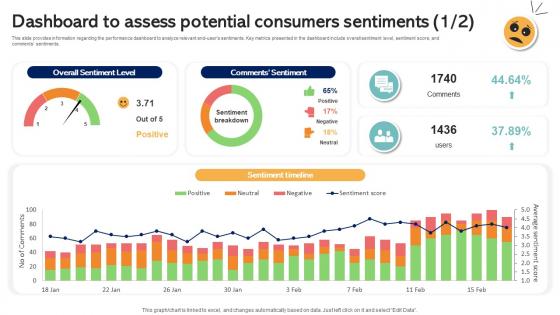
Dashboard To Assess Potential Consumers Sentiments Emotionally Intelligent Insights Leveraging AI SS V
This slide provides information regarding the performance dashboard to analyze relevant end-users sentiments. Key metrics presented in the dashboard include overall sentiment level, sentiment score, and comments sentiments. Do you have an important presentation coming up Are you looking for something that will make your presentation stand out from the rest Look no further than Dashboard To Assess Potential Consumers Sentiments Emotionally Intelligent Insights Leveraging AI SS V. With our professional designs, you can trust that your presentation will pop and make delivering it a smooth process. And with Slidegeeks, you can trust that your presentation will be unique and memorable. So why wait Grab Dashboard To Assess Potential Consumers Sentiments Emotionally Intelligent Insights Leveraging AI SS V today and make your presentation stand out from the rest This slide provides information regarding the performance dashboard to analyze relevant end-users sentiments. Key metrics presented in the dashboard include overall sentiment level, sentiment score, and comments sentiments.
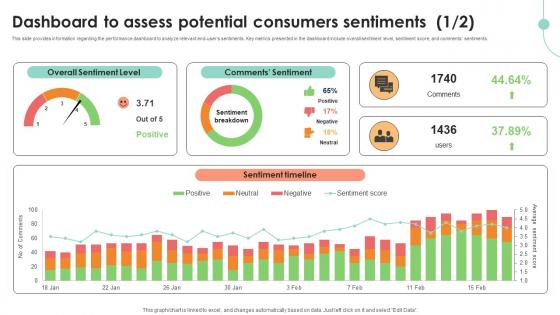
Dashboard To Assess Potential Consumers Decoding User Emotions In Depth Exploration AI SS V
This slide provides information regarding the performance dashboard to analyze relevant end-users sentiments. Key metrics presented in the dashboard include overall sentiment level, sentiment score, and comments sentiments. Do you have an important presentation coming up Are you looking for something that will make your presentation stand out from the rest Look no further than Dashboard To Assess Potential Consumers Decoding User Emotions In Depth Exploration AI SS V. With our professional designs, you can trust that your presentation will pop and make delivering it a smooth process. And with Slidegeeks, you can trust that your presentation will be unique and memorable. So why wait Grab Dashboard To Assess Potential Consumers Decoding User Emotions In Depth Exploration AI SS V today and make your presentation stand out from the rest This slide provides information regarding the performance dashboard to analyze relevant end-users sentiments. Key metrics presented in the dashboard include overall sentiment level, sentiment score, and comments sentiments.
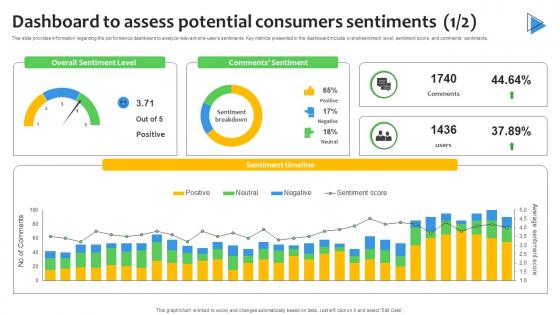
Dashboard To Assess Potential Consumers Sentiment Analysis Demystified Understanding AI SS V
This slide provides information regarding the performance dashboard to analyze relevant end-users sentiments. Key metrics presented in the dashboard include overall sentiment level, sentiment score, and comments sentiments. Do you have an important presentation coming up Are you looking for something that will make your presentation stand out from the rest Look no further than Dashboard To Assess Potential Consumers Sentiment Analysis Demystified Understanding AI SS V. With our professional designs, you can trust that your presentation will pop and make delivering it a smooth process. And with Slidegeeks, you can trust that your presentation will be unique and memorable. So why wait Grab Dashboard To Assess Potential Consumers Sentiment Analysis Demystified Understanding AI SS V today and make your presentation stand out from the rest This slide provides information regarding the performance dashboard to analyze relevant end-users sentiments. Key metrics presented in the dashboard include overall sentiment level, sentiment score, and comments sentiments.
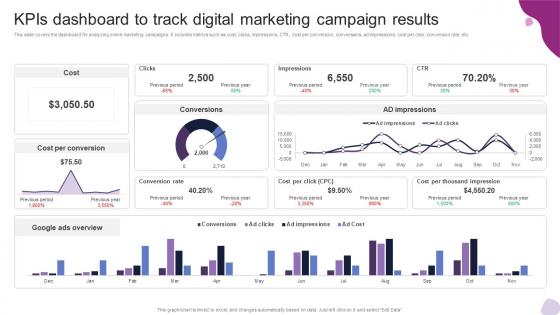
Kpis Dashboard To Track Digital Marketing Campaign Powerful Marketing Techniques Strategy SS V
This slide covers the dashboard for analyzing online marketing campaigns. It includes metrics such as cost, clicks, impressions, CTR, cost per conversion, conversions, ad impressions, cost per click, conversion rate, etc. Take your projects to the next level with our ultimate collection of Kpis Dashboard To Track Digital Marketing Campaign Powerful Marketing Techniques Strategy SS V. Slidegeeks has designed a range of layouts that are perfect for representing task or activity duration, keeping track of all your deadlines at a glance. Tailor these designs to your exact needs and give them a truly corporate look with your own brand colors they will make your projects stand out from the rest This slide covers the dashboard for analyzing online marketing campaigns. It includes metrics such as cost, clicks, impressions, CTR, cost per conversion, conversions, ad impressions, cost per click, conversion rate, etc.
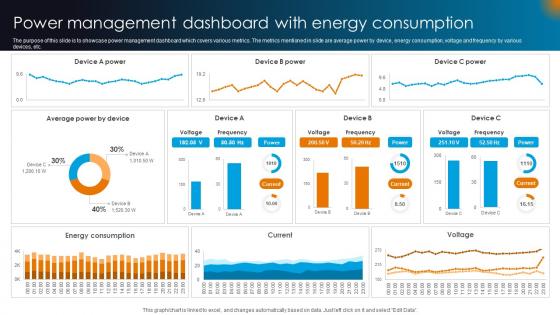
Integrating AI With IoT Power Management Dashboard With Energy Consumption IoT SS V
The purpose of this slide is to showcase power management dashboard which covers various metrics. The metrics mentioned in slide are average power by device, energy consumption, voltage and frequency by various devices, etc. Want to ace your presentation in front of a live audience Our Integrating AI With IoT Power Management Dashboard With Energy Consumption IoT SS V can help you do that by engaging all the users towards you. Slidegeeks experts have put their efforts and expertise into creating these impeccable powerpoint presentations so that you can communicate your ideas clearly. Moreover, all the templates are customizable, and easy-to-edit and downloadable. Use these for both personal and commercial use. The purpose of this slide is to showcase power management dashboard which covers various metrics. The metrics mentioned in slide are average power by device, energy consumption, voltage and frequency by various devices, etc.

Dashboard To Measure Company Effective Strategies To Succeed At Virtual Ppt Template SA SS V
This slide showcases dashboard that help company to track performance of inside sales strategies such as calls and emails. If your project calls for a presentation, then Slidegeeks is your go-to partner because we have professionally designed, easy-to-edit templates that are perfect for any presentation. After downloading, you can easily edit Dashboard To Measure Company Effective Strategies To Succeed At Virtual Ppt Template SA SS V and make the changes accordingly. You can rearrange slides or fill them with different images. Check out all the handy templates This slide showcases dashboard that help company to track performance of inside sales strategies such as calls and emails.

Power Management Dashboard With Energy Consumption AIOT Applications For Various Industries IoT SS V
The purpose of this slide is to showcase power management dashboard which covers various metrics. The metrics mentioned in slide are average power by device, energy consumption, voltage and frequency by various devices, etc. Do you have to make sure that everyone on your team knows about any specific topic I yes, then you should give Power Management Dashboard With Energy Consumption AIOT Applications For Various Industries IoT SS V a try. Our experts have put a lot of knowledge and effort into creating this impeccable Power Management Dashboard With Energy Consumption AIOT Applications For Various Industries IoT SS V. You can use this template for your upcoming presentations, as the slides are perfect to represent even the tiniest detail. You can download these templates from the Slidegeeks website and these are easy to edit. So grab these today The purpose of this slide is to showcase power management dashboard which covers various metrics. The metrics mentioned in slide are average power by device, energy consumption, voltage and frequency by various devices, etc.
Analytics Dashboard Tracking Effective Digital Transformation Journey PPT Presentation DT SS V
This slide represents an analytics dashboard for effective energy monitoring and management. It tracks KPIs such as energy production, solar energy production, savings, energy produced, carbon savings, and financial savings. Get a simple yet stunning designed Analytics Dashboard Tracking Effective Digital Transformation Journey PPT Presentation DT SS V. It is the best one to establish the tone in your meetings. It is an excellent way to make your presentations highly effective. So, download this PPT today from Slidegeeks and see the positive impacts. Our easy-to-edit Analytics Dashboard Tracking Effective Digital Transformation Journey PPT Presentation DT SS V can be your go-to option for all upcoming conferences and meetings. So, what are you waiting for Grab this template today. This slide represents an analytics dashboard for effective energy monitoring and management. It tracks KPIs such as energy production, solar energy production, savings, energy produced, carbon savings, and financial savings.


 Continue with Email

 Home
Home


