Cash Flow Kpi
Cryptocurrency Portfolio Tracking Dashboard Summary Cryptocurrency Management With Blockchain
This slide represents the cryptocurrency performance indicators for the individual. The key components include invested money, profit and loss, rate of investment ROI, current valuation of money, etc.Formulating a presentation can take up a lot of effort and time, so the content and message should always be the primary focus. The visuals of the PowerPoint can enhance the presenters message, so our Cryptocurrency Portfolio Tracking Dashboard Summary Cryptocurrency Management With Blockchain was created to help save time. Instead of worrying about the design, the presenter can concentrate on the message while our designers work on creating the ideal templates for whatever situation is needed. Slidegeeks has experts for everything from amazing designs to valuable content, we have put everything into Cryptocurrency Portfolio Tracking Dashboard Summary Cryptocurrency Management With Blockchain. This slide represents the cryptocurrency performance indicators for the individual. The key components include invested money, profit and loss, rate of investment ROI, current valuation of money, etc.
Ppt Red White And Blue PowerPoint Theme Table Listing Its Factors Components Templates
PPT red white and blue powerpoint theme table listing its factors components Templates-Use this Table diagram to show activities that are related to the business plan metrics and monitor the results to determine if the business plan is proceeding as planned. This Blue Table illustrates the concept of Tabular Method.-Can be used for presentations on advertise,amount, badge, banner, bill, blank, business, button, cart, checklist, column, costing, counting, currency, descriptive, design, discount, element, empty, gradient, grid, hosting, illustration, isolated, list, message, nobody, pricing, rectangle, red-PPT red white and blue powerpoint theme table listing its factors components Templates Connect the dots with our Ppt Red White And Blue PowerPoint Theme Table Listing Its Factors Components Templates. You will come out on top.
Ppt Pink PowerPoint Presentation Table Listing Its Factors Components Templates
PPT pink powerpoint presentation table listing its factors components Templates-Use this Table diagram to show activities that are related to the business plan metrics and monitor the results to determine if the business plan is proceeding as planned. This Pink Table illustrates the concept of Tabular Method.-Can be used for presentations on banner, bar, box, bullet, button, clean, cool, creative, design, editable, elements, empty, eps8, glossy, gradient, gray, green, hosting, interface, label, list, menu, metallic, modern, navigation, object, order, plan, price, red, select, shiny, sidebar, simple, site, sticker, style, support, tab, tariff, template, transparent, vector, web, webdesign, webpage, website, www, yellow-PPT pink powerpoint presentation table listing its factors components Templates Get enthusiastic with our Ppt Pink PowerPoint Presentation Table Listing Its Factors Components Templates. Encourage your team to better performances.
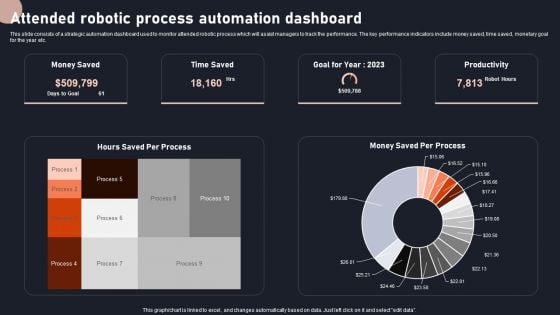
Attended Robotic Process Automation Dashboard Rules PDF
This slide consists of a strategic automation dashboard used to monitor attended robotic process which will assist managers to track the performance. The key performance indicators include money saved, time saved, monetary goal for the year etc. Showcasing this set of slides titled Attended Robotic Process Automation Dashboard Rules PDF. The topics addressed in these templates are Productivity, Goal, Process Automation Dashboard. All the content presented in this PPT design is completely editable. Download it and make adjustments in color, background, font etc. as per your unique business setting.
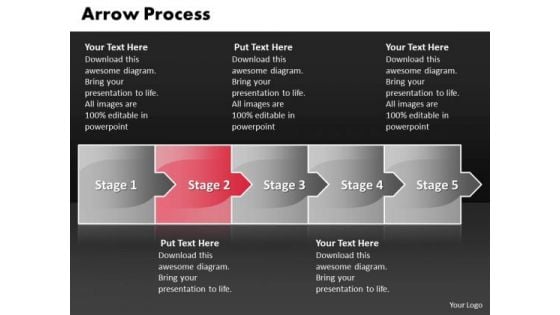
Marketing Ppt Template Arrow Process 5 Stages Business Strategy PowerPoint 3 Design
marketing PPT template arrow Process 5 stages business strategy powerpoint 3 design-This arrow process diagram allows managers to configure critical deviation alerts for any metric and provides real-time dashboards for a quick overview of the current situation. Organize your thoughts and Troubleshoot problems with our Marketing Ppt Template Arrow Process 5 Stages Business Strategy PowerPoint 3 Design. Download without worries with our money back guaranteee.
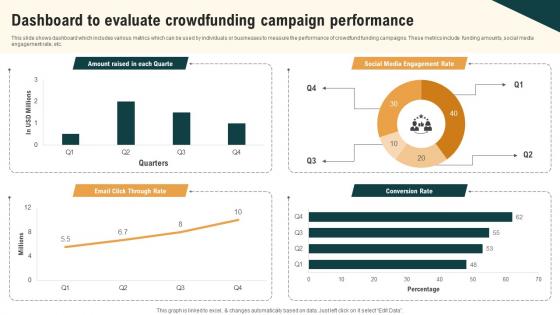
Dashboard To Evaluate Crowdfunding Campaign Real Estate Crowdfunding To Unlock Fin SS V
This slide shows dashboard which includes various metrics which can be used by individuals or businesses to measure the performance of crowdfund funding campaigns. These metrics include funding amounts, social media engagement rate, etc. Find highly impressive Dashboard To Evaluate Crowdfunding Campaign Real Estate Crowdfunding To Unlock Fin SS V on Slidegeeks to deliver a meaningful presentation. You can save an ample amount of time using these presentation templates. No need to worry to prepare everything from scratch because Slidegeeks experts have already done a huge research and work for you. You need to download Dashboard To Evaluate Crowdfunding Campaign Real Estate Crowdfunding To Unlock Fin SS V for your upcoming presentation. All the presentation templates are 100 percent editable and you can change the color and personalize the content accordingly. Download now This slide shows dashboard which includes various metrics which can be used by individuals or businesses to measure the performance of crowdfund funding campaigns. These metrics include funding amounts, social media engagement rate, etc.
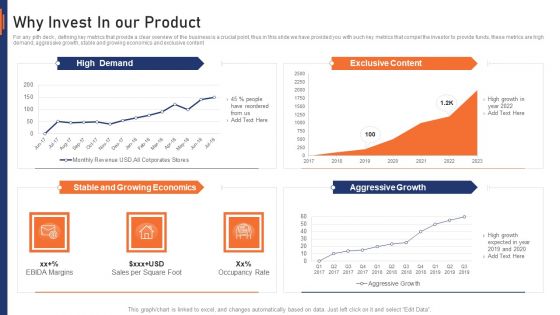
VR Market Capital Raising Elevator Pitch Deck Why Invest In Our Product Rules PDF
For any pith deck , defining key metrics that provide a clear overview of the business is a crucial point, thus in this slide we have provided you with such key metrics that compel the investor to provide funds, these metrics are high demand, aggressive growth, stable and growing economics and exclusive content. Deliver and pitch your topic in the best possible manner with this vr market capital raising elevator pitch deck why invest in our product rules pdf. Use them to share invaluable insights on high demand, stable and growing economics, aggressive growth, exclusive content and impress your audience. This template can be altered and modified as per your expectations. So, grab it now.
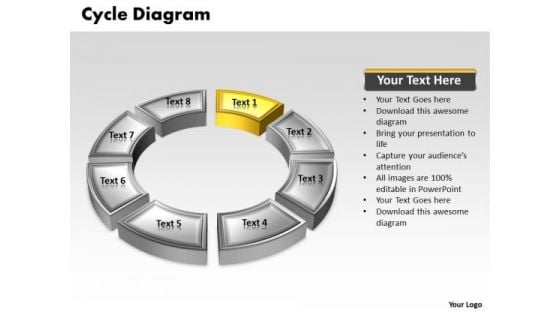
Ppt Yellow Animated Text Cycle Network Diagram PowerPoint Template Templates
PPT yellow animated text cycle network diagram powerpoint template Templates-Use this Circular diagram to show activities that are related to the business plan metrics and monitor the results to determine if the business plan is proceeding as planned.-PPT yellow animated text cycle network diagram powerpoint template Templates-Abstract, Blank, Business, Chart, Circular, Circulation, Cycle, Design, Diagram, Empty, Executive, Icon, Illustration, Management, Model, Numbers, Organization, Procedure, Process Recognize your calling with our Ppt Yellow Animated Text Cycle Network Diagram PowerPoint Template Templates. Download without worries with our money back guaranteee.
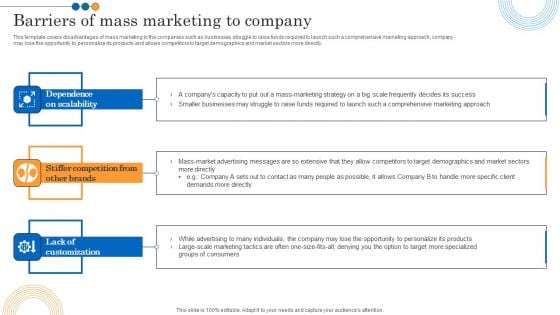
Implementing Marketing Strategies Barriers Of Mass Marketing To Company Mockup PDF
This template covers disadvantages of mass marketing to the companies such as businesses struggle to raise funds required to launch such a comprehensive marketing approach, company may lose the opportunity to personalize its products and allows competitors to target demographics and market sectors more directly. This template covers dashboard to measure and analyze target marketing campaign performance. It also helps in tracking and reporting online and offline marketing campaigns through KPIs such as traffic sources, lead generation metrics, offline product sales, store visitations, customer acquisition, and offline retention and advocacy. Want to ace your presentation in front of a live audience Our Implementing Marketing Strategies Barriers Of Mass Marketing To Company Mockup PDF can help you do that by engaging all the users towards you. Slidegeeks experts have put their efforts and expertise into creating these impeccable powerpoint presentations so that you can communicate your ideas clearly. Moreover, all the templates are customizable, and easy-to-edit and downloadable. Use these for both personal and commercial use.
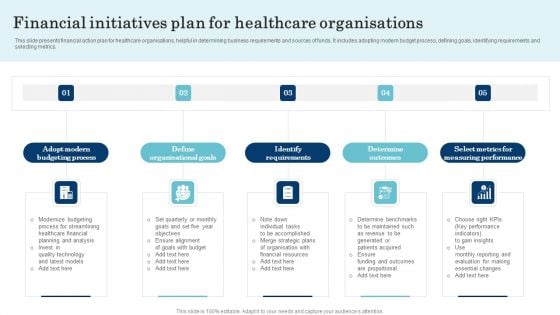
Financial Initiatives Plan For Healthcare Organisations Summary PDF
This slide presents financial action plan for healthcare organisations, helpful in determining business requirements and sources of funds. It includes adopting modern budget process, defining goals, identifying requirements and selecting metrics. Presenting Financial Initiatives Plan For Healthcare Organisations Summary PDF to dispense important information. This template comprises five stages. It also presents valuable insights into the topics including Adopt Modern Budgeting Process, Define Organisational Goals, Identify Requirements. This is a completely customizable PowerPoint theme that can be put to use immediately. So, download it and address the topic impactfully.
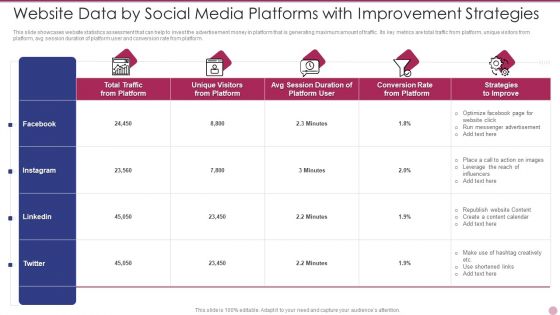
Website Data By Social Media Platforms With Improvement Strategies Diagrams PDF
This slide showcases website statistics assessment that can help to invest the advertisement money in platform that is generating maximum amount of traffic. Its key metrics are total traffic from platform, unique visitors from platform, avg session duration of platform user and conversion rate from platform. Showcasing this set of slides titled Website Data By Social Media Platforms With Improvement Strategies Diagrams PDF. The topics addressed in these templates are Strategies To Improve, Advertisement, Optimize. All the content presented in this PPT design is completely editable. Download it and make adjustments in color, background, font etc. as per your unique business setting.


 Continue with Email

 Home
Home


