Change Management Dashboard
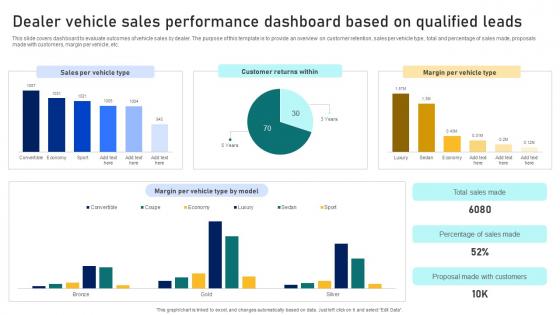
Guide To Building A Successful Dealer Vehicle Sales Performance Dashboard Based On Qualified Strategy SS V
This slide covers dashboard to evaluate outcomes of vehicle sales by dealer. The purpose of this template is to provide an overview on customer retention, sales per vehicle type, total and percentage of sales made, proposals made with customers, margin per vehicle, etc. Present like a pro with Guide To Building A Successful Dealer Vehicle Sales Performance Dashboard Based On Qualified Strategy SS V. Create beautiful presentations together with your team, using our easy-to-use presentation slides. Share your ideas in real-time and make changes on the fly by downloading our templates. So whether you are in the office, on the go, or in a remote location, you can stay in sync with your team and present your ideas with confidence. With Slidegeeks presentation got a whole lot easier. Grab these presentations today. This slide covers dashboard to evaluate outcomes of vehicle sales by dealer. The purpose of this template is to provide an overview on customer retention, sales per vehicle type, total and percentage of sales made, proposals made with customers, margin per vehicle, etc.
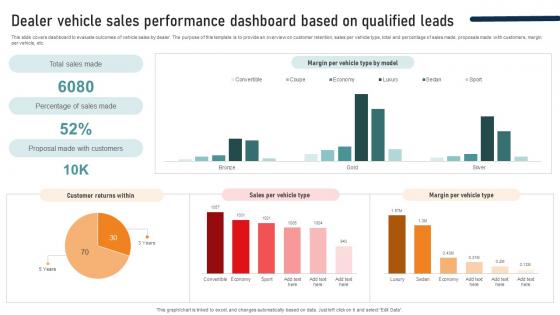
Ultimate Guide To Developing Dealer Vehicle Sales Performance Dashboard Based On Qualified Strategy SS V
This slide covers dashboard to evaluate outcomes of vehicle sales by dealer. The purpose of this template is to provide an overview on customer retention, sales per vehicle type, total and percentage of sales made, proposals made with customers, margin per vehicle, etc. Present like a pro with Ultimate Guide To Developing Dealer Vehicle Sales Performance Dashboard Based On Qualified Strategy SS V. Create beautiful presentations together with your team, using our easy-to-use presentation slides. Share your ideas in real-time and make changes on the fly by downloading our templates. So whether you are in the office, on the go, or in a remote location, you can stay in sync with your team and present your ideas with confidence. With Slidegeeks presentation got a whole lot easier. Grab these presentations today. This slide covers dashboard to evaluate outcomes of vehicle sales by dealer. The purpose of this template is to provide an overview on customer retention, sales per vehicle type, total and percentage of sales made, proposals made with customers, margin per vehicle, etc.
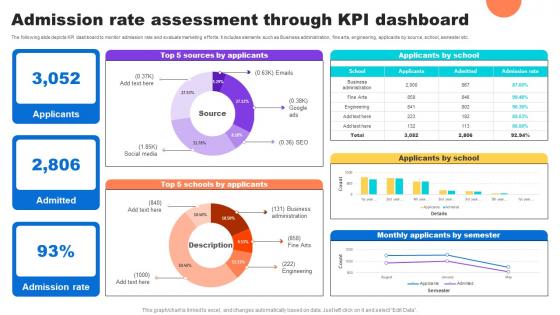
Admission Rate Assessment Through Kpi Dashboard Key Step To Implementation University Strategy SS V
The following slide depicts KPI dashboard to monitor admission rate and evaluate marketing efforts. It includes elements such as Business administration, fine arts, engineering, applicants by source, school, semester etc. Find a pre-designed and impeccable Admission Rate Assessment Through Kpi Dashboard Key Step To Implementation University Strategy SS V. The templates can ace your presentation without additional effort. You can download these easy-to-edit presentation templates to make your presentation stand out from others. So, what are you waiting for Download the template from Slidegeeks today and give a unique touch to your presentation. The following slide depicts KPI dashboard to monitor admission rate and evaluate marketing efforts. It includes elements such as Business administration, fine arts, engineering, applicants by source, school, semester etc.
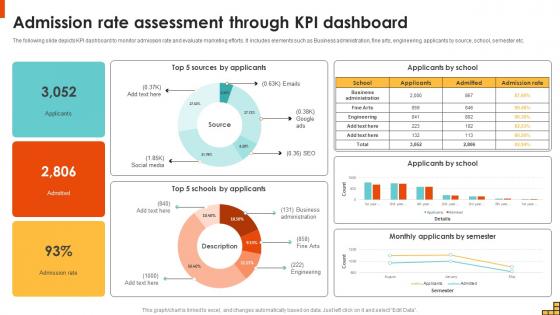
Admission Rate Assessment Through KPI Dashboard Running Marketing Campaigns Strategy SS V
The following slide depicts KPI dashboard to monitor admission rate and evaluate marketing efforts. It includes elements such as Business administration, fine arts, engineering, applicants by source, school, semester etc. Find a pre-designed and impeccable Admission Rate Assessment Through KPI Dashboard Running Marketing Campaigns Strategy SS V. The templates can ace your presentation without additional effort. You can download these easy-to-edit presentation templates to make your presentation stand out from others. So, what are you waiting for Download the template from Slidegeeks today and give a unique touch to your presentation. The following slide depicts KPI dashboard to monitor admission rate and evaluate marketing efforts. It includes elements such as Business administration, fine arts, engineering, applicants by source, school, semester etc.
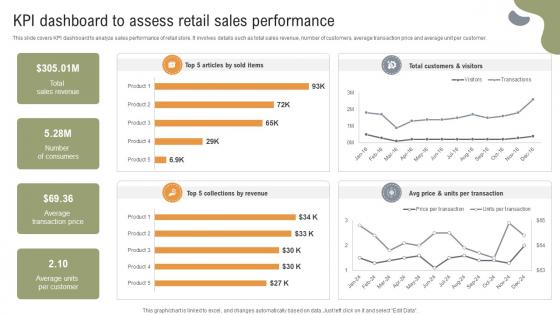
Implementing Strategies To Enhance KPI Dashboard To Assess Retail Sales Performance
This slide covers KPI dashboard to analyze sales performance of retail store. It involves details such as total sales revenue, number of customers, average transaction price and average unit per customer. The Implementing Strategies To Enhance KPI Dashboard To Assess Retail Sales Performance is a compilation of the most recent design trends as a series of slides. It is suitable for any subject or industry presentation, containing attractive visuals and photo spots for businesses to clearly express their messages. This template contains a variety of slides for the user to input data, such as structures to contrast two elements, bullet points, and slides for written information. Slidegeeks is prepared to create an impression. This slide covers KPI dashboard to analyze sales performance of retail store. It involves details such as total sales revenue, number of customers, average transaction price and average unit per customer.
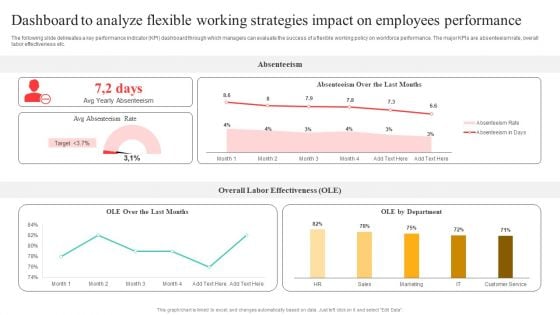
Flexible Working Policies And Guidelines Dashboard To Analyze Flexible Working Strategies Information PDF
The following slide delineates a key performance indicator KPI dashboard through which managers can evaluate the success of a flexible working policy on workforce performance. The major KPIs are absenteeism rate, overall labor effectiveness etc. Create an editable Flexible Working Policies And Guidelines Dashboard To Analyze Flexible Working Strategies Information PDF that communicates your idea and engages your audience. Whether youre presenting a business or an educational presentation, pre designed presentation templates help save time. Flexible Working Policies And Guidelines Dashboard To Analyze Flexible Working Strategies Information PDF is highly customizable and very easy to edit, covering many different styles from creative to business presentations. Slidegeeks has creative team members who have crafted amazing templates. So, go and get them without any delay.
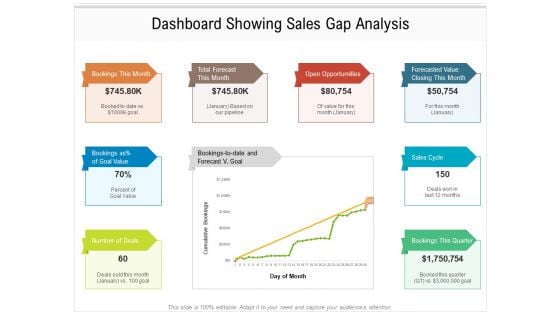
Dashboard Showing Sales Gap Analysis Ppt PowerPoint Presentation Infographic Template Graphics Pictures PDF
Presenting this set of slides with name dashboard showing sales gap analysis ppt powerpoint presentation infographic template graphics pictures pdf. The topics discussed in these slides are bookings month, total forecast month open opportumities, forecasted value closing number deals month, sales cycle, bookings this quarter, goal. This is a completely editable PowerPoint presentation and is available for immediate download. Download now and impress your audience.

Impact Of Digitalizing Project Management With KPIs Digital Transformation In Project Management
This slide represents details related to impact of effectively implementing structured approach for planning, implementing and sustaining changes in organizational projects with minimal disruptions. It includes impact of streamlining project management. Make sure to capture your audiences attention in your business displays with our gratis customizable Impact Of Digitalizing Project Management With KPIs Digital Transformation In Project Management. These are great for business strategies, office conferences, capital raising or task suggestions. If you desire to acquire more customers for your tech business and ensure they stay satisfied, create your own sales presentation with these plain slides. This slide represents details related to impact of effectively implementing structured approach for planning, implementing and sustaining changes in organizational projects with minimal disruptions. It includes impact of streamlining project management.
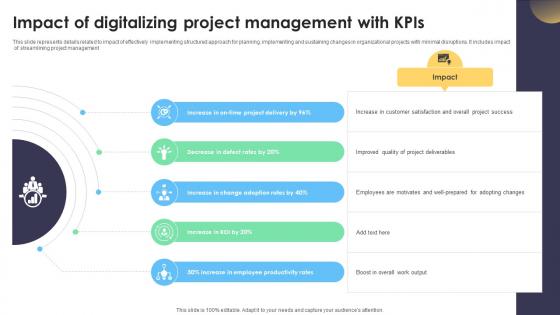
Digital Project Management Strategies Impact Of Digitalizing Project Management With Kpis
This slide represents details related to impact of effectively implementing structured approach for planning, implementing and sustaining changes in organizational projects with minimal disruptions. It includes impact of streamlining project management. Crafting an eye-catching presentation has never been more straightforward. Let your presentation shine with this tasteful yet straightforward Digital Project Management Strategies Impact Of Digitalizing Project Management With Kpis template. It offers a minimalistic and classy look that is great for making a statement. The colors have been employed intelligently to add a bit of playfulness while still remaining professional. Construct the ideal Digital Project Management Strategies Impact Of Digitalizing Project Management With Kpis that effortlessly grabs the attention of your audience Begin now and be certain to wow your customers This slide represents details related to impact of effectively implementing structured approach for planning, implementing and sustaining changes in organizational projects with minimal disruptions. It includes impact of streamlining project management.

Strategies For Dynamic Supply Chain Agility Supply Chain Kpi Dashboard For Effective Financial Analysis Demonstration PDF
Mentioned slide illustrates KPI dashboard that can be used by managers to assess financial health of supply chain business. KPIs covered are supply chain costs versus sales, cash to order cycle, warehouse operating cost distribution etc. The Strategies For Dynamic Supply Chain Agility Supply Chain Kpi Dashboard For Effective Financial Analysis Demonstration PDF is a compilation of the most recent design trends as a series of slides. It is suitable for any subject or industry presentation, containing attractive visuals and photo spots for businesses to clearly express their messages. This template contains a variety of slides for the user to input data, such as structures to contrast two elements, bullet points, and slides for written information. Slidegeeks is prepared to create an impression.
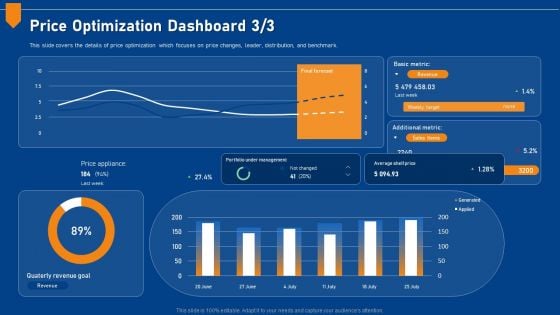
Evaluating Price Efficiency In Organization Price Optimization Dashboard Metric Designs PDF
This slide covers the details of price optimization which focuses on price changes, leader, distribution, and benchmark. Deliver and pitch your topic in the best possible manner with this evaluating price efficiency in organization price optimization dashboard metric designs pdf. Use them to share invaluable insights on portfolio, management, price, revenue, target and impress your audience. This template can be altered and modified as per your expectations. So, grab it now.
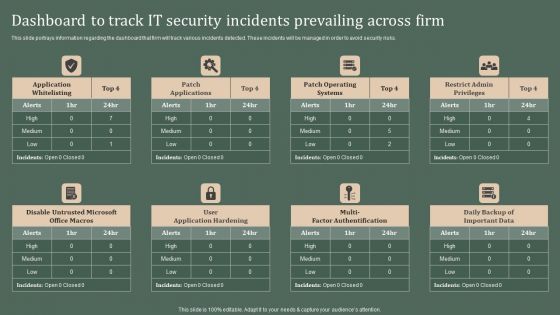
Deploying Corporate Aligned IT Strategy Dashboard To Track IT Security Incidents Prevailing Across Firm Designs PDF
This slide portrays information regarding the dashboard that firm will track various incidents detected. These incidents will be managed in order to avoid security risks. Coming up with a presentation necessitates that the majority of the effort goes into the content and the message you intend to convey. The visuals of a PowerPoint presentation can only be effective if it supplements and supports the story that is being told. Keeping this in mind our experts created Deploying Corporate Aligned IT Strategy Dashboard To Track IT Security Incidents Prevailing Across Firm Designs PDF to reduce the time that goes into designing the presentation. This way, you can concentrate on the message while our designers take care of providing you with the right template for the situation.
Quality Assurance Indicator Dashboard Ppt PowerPoint Presentation Complete Deck With Slides
Share a great deal of information on the topic by deploying this Quality Assurance Indicator Dashboard Ppt PowerPoint Presentation Complete Deck With Slides. Support your ideas and thought process with this prefabricated set. It includes a set of Fifteen slides, all fully modifiable and editable. Each slide can be restructured and induced with the information and content of your choice. You can add or remove large content boxes as well, to make this PPT slideshow more personalized. Its high-quality graphics and visuals help in presenting a well-coordinated pitch. This PPT template is also a resourceful tool to take visual cues from and implement the best ideas to help your business grow and expand. The main attraction of this well-formulated deck is that everything is editable, giving you the freedom to adjust it to your liking and choice. Changes can be made in the background and theme as well to deliver an outstanding pitch. Therefore, click on the download button now to gain full access to this multifunctional set.
Kpi Dashboard For Tracking Enhance Client Engagement With Interactive Advertising Background Pdf
This slide shows KPI dashboard for assessing performance of social media platforms. It provides information about followers, likes, clicks, shares, impressions, engaged users, new followers, etc. The Kpi Dashboard For Tracking Enhance Client Engagement With Interactive Advertising Background Pdf is a compilation of the most recent design trends as a series of slides. It is suitable for any subject or industry presentation, containing attractive visuals and photo spots for businesses to clearly express their messages. This template contains a variety of slides for the user to input data, such as structures to contrast two elements, bullet points, and slides for written information. Slidegeeks is prepared to create an impression. This slide shows KPI dashboard for assessing performance of social media platforms. It provides information about followers, likes, clicks, shares, impressions, engaged users, new followers, etc.
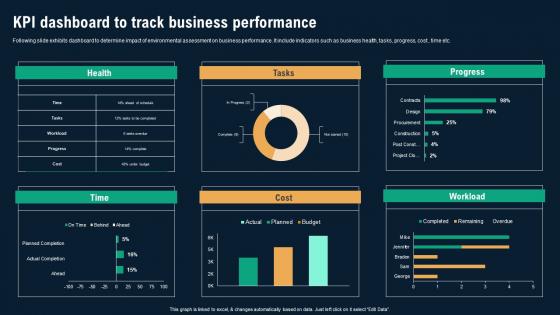
KPI Dashboard To Track Business Performance Business Environmental Analysis Formats Pdf
Following slide exhibits dashboard to determine impact of environmental assessment on business performance. It include indicators such as business health, tasks, progress, cost , time etc. The KPI Dashboard To Track Business Performance Business Environmental Analysis Formats Pdf is a compilation of the most recent design trends as a series of slides. It is suitable for any subject or industry presentation, containing attractive visuals and photo spots for businesses to clearly express their messages. This template contains a variety of slides for the user to input data, such as structures to contrast two elements, bullet points, and slides for written information. Slidegeeks is prepared to create an impression. Following slide exhibits dashboard to determine impact of environmental assessment on business performance. It include indicators such as business health, tasks, progress, cost , time etc.
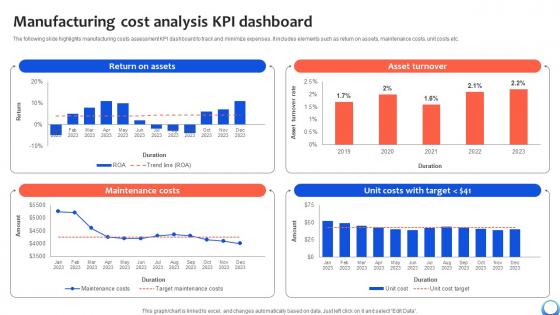
Manufacturing Cost Analysis KPI Dashboard Automating Production Process Strategy SS V
The following slide highlights manufacturing costs assessment KPI dashboard to track and minimize expenses. It includes elements such as return on assets, maintenance costs, unit costs etc. Make sure to capture your audiences attention in your business displays with our gratis customizable Manufacturing Cost Analysis KPI Dashboard Automating Production Process Strategy SS V. These are great for business strategies, office conferences, capital raising or task suggestions. If you desire to acquire more customers for your tech business and ensure they stay satisfied, create your own sales presentation with these plain slides. The following slide highlights manufacturing costs assessment KPI dashboard to track and minimize expenses. It includes elements such as return on assets, maintenance costs, unit costs etc.
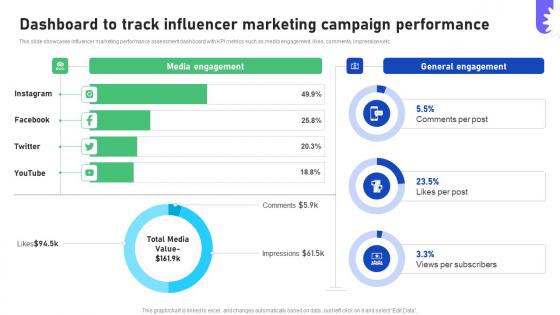
Improving Business Marketing Performance Dashboard To Track Influencer CRP DK SS V
This slide showcases influencer marketing performance assessment dashboard with KPI metrics such as media engagement, likes, comments, impressions etc. Are you in need of a template that can accommodate all of your creative concepts This one is crafted professionally and can be altered to fit any style. Use it with Google Slides or PowerPoint. Include striking photographs, symbols, depictions, and other visuals. Fill, move around, or remove text boxes as desired. Test out color palettes and font mixtures. Edit and save your work, or work with colleagues. Download Improving Business Marketing Performance Dashboard To Track Influencer CRP DK SS V and observe how to make your presentation outstanding. Give an impeccable presentation to your group and make your presentation unforgettable. This slide showcases influencer marketing performance assessment dashboard with KPI metrics such as media engagement, likes, comments, impressions etc.
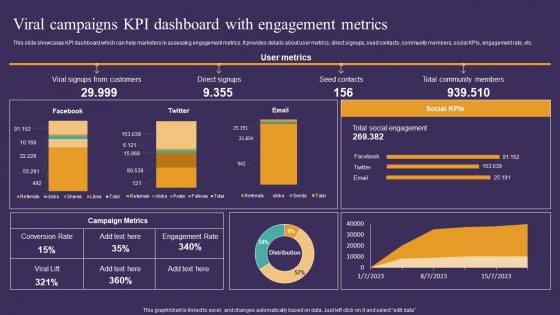
Strategic Guide To Attract Viral Campaigns KPI Dashboard With Engagement Metrics Summary Pdf
This slide showcases KPI dashboard which can help marketers in assessing engagement metrics. It provides details about user metrics, direct signups, seed contacts, community members, social KPIs, engagement rate, etc. Do you know about Slidesgeeks Strategic Guide To Attract Viral Campaigns KPI Dashboard With Engagement Metrics Summary Pdf These are perfect for delivering any kind od presentation. Using it, create PowerPoint presentations that communicate your ideas and engage audiences. Save time and effort by using our pre-designed presentation templates that are perfect for a wide range of topic. Our vast selection of designs covers a range of styles, from creative to business, and are all highly customizable and easy to edit. Download as a PowerPoint template or use them as Google Slides themes. This slide showcases KPI dashboard which can help marketers in assessing engagement metrics. It provides details about user metrics, direct signups, seed contacts, community members, social KPIs, engagement rate, etc.
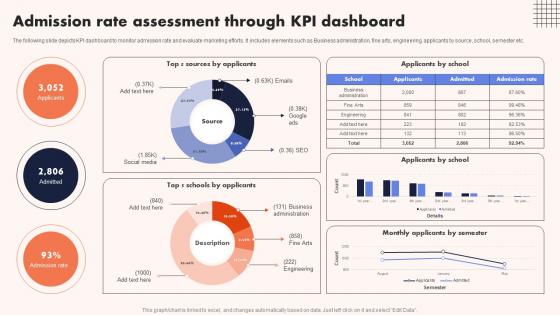
University Marketing Guide Admission Rate Assessment Through KPI Dashboard Strategy SS V
The following slide depicts KPI dashboard to monitor admission rate and evaluate marketing efforts. It includes elements such as Business administration, fine arts, engineering, applicants by source, school, semester etc. Get a simple yet stunning designed University Marketing Guide Admission Rate Assessment Through KPI Dashboard Strategy SS V. It is the best one to establish the tone in your meetings. It is an excellent way to make your presentations highly effective. So, download this PPT today from Slidegeeks and see the positive impacts. Our easy-to-edit University Marketing Guide Admission Rate Assessment Through KPI Dashboard Strategy SS V can be your go-to option for all upcoming conferences and meetings. So, what are you waiting for Grab this template today. The following slide depicts KPI dashboard to monitor admission rate and evaluate marketing efforts. It includes elements such as Business administration, fine arts, engineering, applicants by source, school, semester etc.
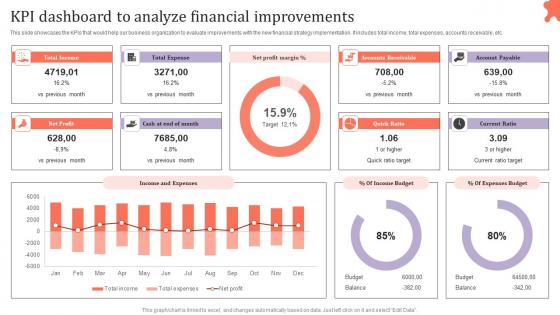
KPI Dashboard To Analyze Financial Assessing Corporate Financial Techniques Clipart Pdf
This slide showcases the KPIs that would help our business organization to evaluate improvements with the new financial strategy implementation. It includes total income, total expenses, accounts receivable, etc. Retrieve professionally designed KPI Dashboard To Analyze Financial Assessing Corporate Financial Techniques Clipart Pdf to effectively convey your message and captivate your listeners. Save time by selecting pre made slideshows that are appropriate for various topics, from business to educational purposes. These themes come in many different styles, from creative to corporate, and all of them are easily adjustable and can be edited quickly. Access them as PowerPoint templates or as Google Slides themes. You do not have to go on a hunt for the perfect presentation because Slidegeeks got you covered from everywhere. This slide showcases the KPIs that would help our business organization to evaluate improvements with the new financial strategy implementation. It includes total income, total expenses, accounts receivable, etc.
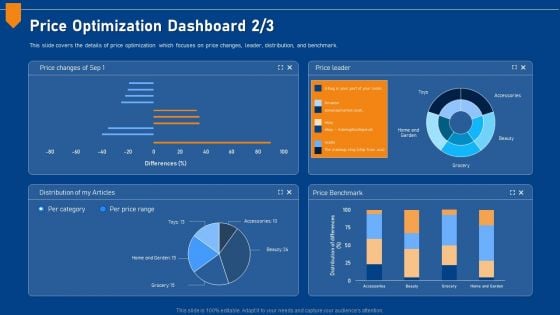
Evaluating Price Efficiency In Organization Price Optimization Dashboard Distribution Portrait PDF
This slide covers the details of price optimization which focuses on price changes, leader, distribution, and benchmark. Deliver an awe inspiring pitch with this creative evaluating price efficiency in organization price optimization dashboard distribution portrait pdf bundle. Topics like price changes, leader, distribution, benchmark can be discussed with this completely editable template. It is available for immediate download depending on the needs and requirements of the user.
Net Promoter Score Assessment Dashboard Ppt PowerPoint Presentation Gallery Icons PDF
Presenting this set of slides with name net promoter score assessment dashboard ppt powerpoint presentation gallery icons pdf. The topics discussed in these slide is net promoter score assessment dashboard. This is a completely editable PowerPoint presentation and is available for immediate download. Download now and impress your audience.
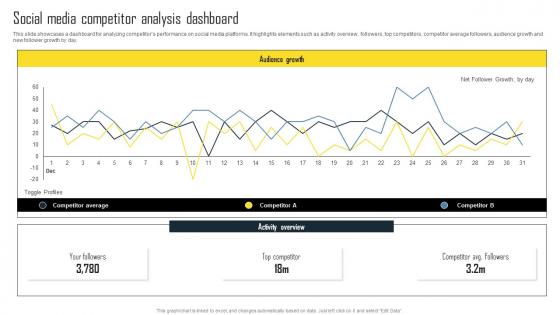
Social Media Competitor Analysis Dashboard Efficient Plan For Conducting Competitor Microsoft Pdf
This slide showcases a dashboard for analyzing competitors performance on social media platforms. It highlights elements such as activity overview, followers, top competitors, competitor average followers, audience growth and new follower growth by day. Are you in need of a template that can accommodate all of your creative concepts This one is crafted professionally and can be altered to fit any style. Use it with Google Slides or PowerPoint. Include striking photographs, symbols, depictions, and other visuals. Fill, move around, or remove text boxes as desired. Test out color palettes and font mixtures. Edit and save your work, or work with colleagues. Download Social Media Competitor Analysis Dashboard Efficient Plan For Conducting Competitor Microsoft Pdf and observe how to make your presentation outstanding. Give an impeccable presentation to your group and make your presentation unforgettable. This slide showcases a dashboard for analyzing competitors performance on social media platforms. It highlights elements such as activity overview, followers, top competitors, competitor average followers, audience growth and new follower growth by day.
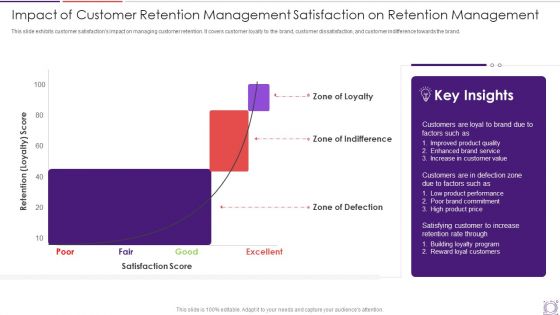
Impact Of Customer Retention Management Satisfaction On Retention Management Infographics PDF
This slide exhibits customer satisfactions impact on managing customer retention. It covers customer loyalty to the brand, customer dissatisfaction, and customer indifference towards the brand. Pitch your topic with ease and precision using this impact of customer retention management satisfaction on retention management infographics pdf. This layout presents information on customers, performance, price. It is also available for immediate download and adjustment. So, changes can be made in the color, design, graphics or any other component to create a unique layout.
Business Performance Assessment Dashboard Of Business Ppt PowerPoint Presentation Icon Influencers PDF
Presenting this set of slides with name business performance assessment dashboard of business ppt powerpoint presentation icon influencers pdf. This is a three stage process. The stages in this process are business performance assessment dashboard of business. This is a completely editable PowerPoint presentation and is available for immediate download. Download now and impress your audience.
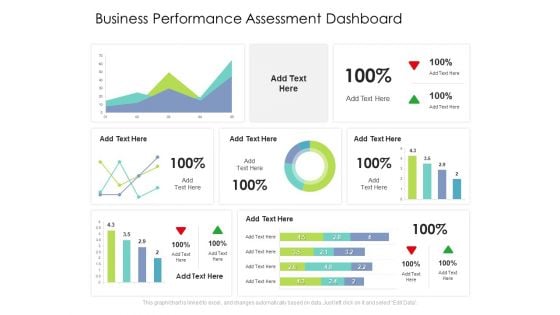
Business Performance Assessment Dashboard Ppt PowerPoint Presentation Gallery Slide Download PDF
Presenting this set of slides with name business performance assessment dashboard ppt powerpoint presentation gallery slide download pdf. The topics discussed in these slide is business performance assessment dashboard. This is a completely editable PowerPoint presentation and is available for immediate download. Download now and impress your audience.
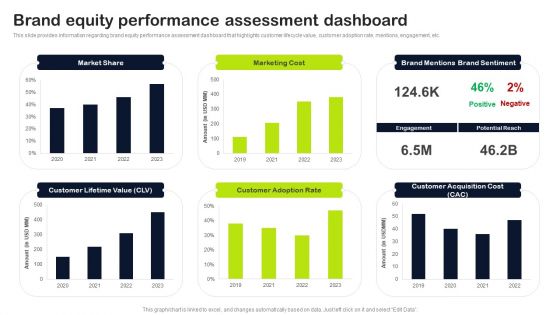
Key Elements Of Strategic Brand Administration Brand Equity Performance Assessment Dashboard Elements PDF
This slide provides information regarding brand equity performance assessment dashboard that highlights customer lifecycle value, customer adoption rate, mentions, engagement, etc. Get a simple yet stunning designed Key Elements Of Strategic Brand Administration Brand Equity Performance Assessment Dashboard Elements PDF. It is the best one to establish the tone in your meetings. It is an excellent way to make your presentations highly effective. So, download this PPT today from Slidegeeks and see the positive impacts. Our easy-to-edit Key Elements Of Strategic Brand Administration Brand Equity Performance Assessment Dashboard Elements PDF can be your go-to option for all upcoming conferences and meetings. So, what are you waiting for Grab this template today.
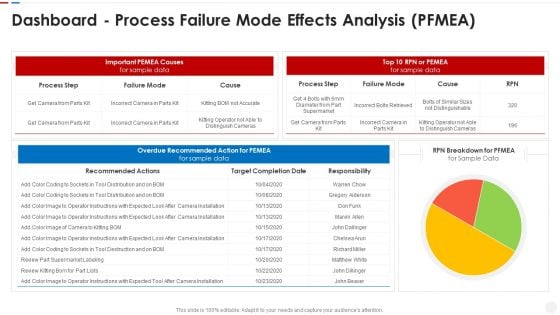
Failure Methods And Effects Assessments FMEA Dashboard Process Failure Mode Effects Analysis PFMEA Designs PDF
Deliver an awe inspiring pitch with this creative failure methods and effects assessments fmea dashboard process failure mode effects analysis pfmea designs pdf bundle. Topics like dashboard process failure mode effects analysis pfmea can be discussed with this completely editable template. It is available for immediate download depending on the needs and requirements of the user.
Online Competitors Assessment Dashboard Vector Icon Ppt PowerPoint Presentation Outline Layout Ideas PDF
Presenting this set of slides with name online competitors assessment dashboard vector icon ppt powerpoint presentation outline layout ideas pdf. This is a three stage process. The stages in this process are online competitors assessment dashboard vector icon. This is a completely editable PowerPoint presentation and is available for immediate download. Download now and impress your audience.
Sales Planning And Trends Assessment Dashboard Ppt Powerpoint Presentation Icon Good Pdf
Showcasing this set of slides titled sales planning and trends assessment dashboard ppt powerpoint presentation icon good pdf. The topics addressed in these templates are sales planning and trends assessment dashboard. All the content presented in this PPT design is completely editable. Download it and make adjustments in color, background, font etc. as per your unique business setting.
Social Media Tracking Dashboard With Web Traffic Assessment Ppt Portfolio Demonstration PDF
Showcasing this set of slides titled Social Media Tracking Dashboard With Web Traffic Assessment Ppt Portfolio Demonstration PDF. The topics addressed in these templates are Web Traffic Assessment, Tracking Dashboard, Social Media. All the content presented in this PPT design is completely editable. Download it and make adjustments in color, background, font etc. as per your unique business setting.
Market Share Assessment Dashboard With Percentage Ratios Ppt PowerPoint Presentation File Icon PDF
Presenting this set of slides with name market share assessment dashboard with percentage ratios ppt powerpoint presentation file icon pdf. The topics discussed in these slide is market share assessment dashboard with percentage ratios. This is a completely editable PowerPoint presentation and is available for immediate download. Download now and impress your audience.
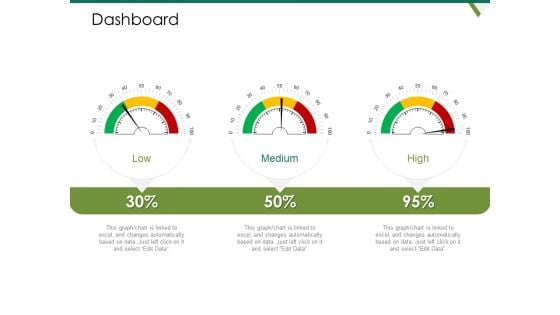
Value Chain Assessment Of Strategic Leadership Dashboard Ppt PowerPoint Presentation Infographic Template Rules PDF
Deliver an awe inspiring pitch with this creative value chain assessment of strategic leadership dashboard ppt powerpoint presentation infographic template rules pdf bundle. Topics like dashboard can be discussed with this completely editable template. It is available for immediate download depending on the needs and requirements of the user.
Client Specific Progress Assessment Loyalty Program Performance Dashboard Ppt Icon Example File PDF
Presenting this set of slides with name client specific progress assessment loyalty program performance dashboard ppt icon example file pdf. The topics discussed in these slides are loyalty program performance dashboard. This is a completely editable PowerPoint presentation and is available for immediate download. Download now and impress your audience.
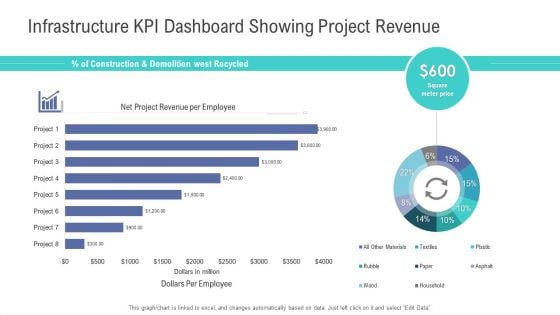
Financial Functional Assessment Infrastructure KPI Dashboard Showing Project Revenue Pictures PDF
Deliver and pitch your topic in the best possible manner with this financial functional assessment infrastructure kpi dashboard showing project revenue pictures pdf. Use them to share invaluable insights on infrastructure kpi dashboard showing project revenue and impress your audience. This template can be altered and modified as per your expectations. So, grab it now.
Dashboard For Digital Risk Assessment Real Time Monitoring Ppt Summary Model PDF
Presenting Dashboard For Digital Risk Assessment Real Time Monitoring Ppt Summary Model PDF to dispense important information. This template comprises three stages. It also presents valuable insights into the topics including Dashboard, Digital Risk Assessment, Real Time Monitoring. This is a completely customizable PowerPoint theme that can be put to use immediately. So, download it and address the topic impactfully.
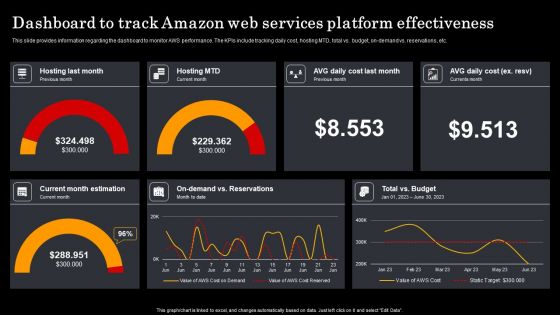
Assessment Of Amazon Brand Performance Dashboard To Track Amazon Web Guidelines PDF
This slide provides information regarding the dashboard to monitor AWS performance. The KPIs include tracking daily cost, hosting MTD, total vs. budget, on-demand vs. reservations, etc. Create an editable Assessment Of Amazon Brand Performance Dashboard To Track Amazon Web Guidelines PDF that communicates your idea and engages your audience. Whether you are presenting a business or an educational presentation, pre-designed presentation templates help save time. Assessment Of Amazon Brand Performance Dashboard To Track Amazon Web Guidelines PDF is highly customizable and very easy to edit, covering many different styles from creative to business presentations. Slidegeeks has creative team members who have crafted amazing templates. So, go and get them without any delay.
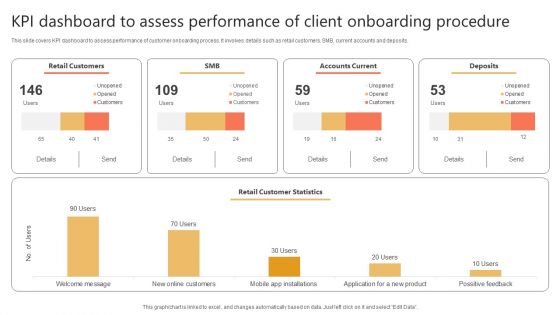
Kpi Dashboard To Assess Performance Of Client Onboarding Procedure Designs PDF
This slide covers KPI dashboard to assess performance of customer onboarding process. It involves details such as retail customers, SMB, current accounts and deposits. Showcasing this set of slides titled Kpi Dashboard To Assess Performance Of Client Onboarding Procedure Designs PDF. The topics addressed in these templates are Retail Customers, Accounts Current, Deposits. All the content presented in this PPT design is completely editable. Download it and make adjustments in color, background, font etc. as per your unique business setting.
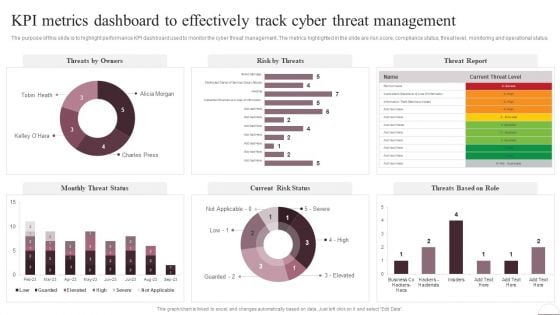
Prevention Of Information KPI Metrics Dashboard To Effectively Track Cyber Guidelines PDF
The purpose of this slide is to highlight performance KPI dashboard used to monitor the cyber threat management. The metrics highlighted in the slide are risk score, compliance status, threat level, monitoring and operational status. Welcome to our selection of the Prevention Of Information KPI Metrics Dashboard To Effectively Track Cyber Guidelines PDF. These are designed to help you showcase your creativity and bring your sphere to life. Planning and Innovation are essential for any business that is just starting out. This collection contains the designs that you need for your everyday presentations. All of our PowerPoints are 100 percent editable, so you can customize them to suit your needs. This multi-purpose template can be used in various situations. Grab these presentation templates today
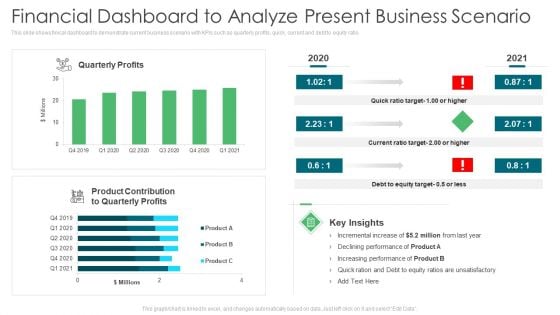
Environmental Assessment Financial Dashboard To Analyze Present Business Scenario Ppt Infographics Ideas PDF
This slide shows finical dashboard to demonstrate current business scenario with KPIs such as quarterly profits, quick, current and debt to equity ratio. Deliver an awe inspiring pitch with this creative environmental assessment financial dashboard to analyze present business scenario ppt infographics ideas pdf bundle. Topics like product contribution, increasing performance, equity target can be discussed with this completely editable template. It is available for immediate download depending on the needs and requirements of the user.
Environmental Assessment Financial Dashboard For Business Impact Tracking Ppt Layouts Guidelines PDF
This slide shows financial dashboard for business impact tracking with key performance indicators like quick ratio, current ratio, monthly cash flow etc Deliver and pitch your topic in the best possible manner with this environmental assessment financial dashboard for business impact tracking ppt layouts guidelines pdf. Use them to share invaluable insights on sales outstanding, cash balance, accounts payable and impress your audience. This template can be altered and modified as per your expectations. So, grab it now.
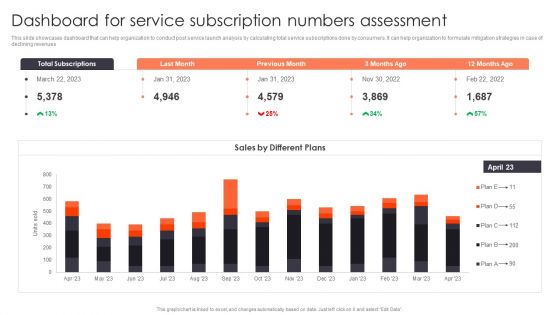
Promotion Strategies For New Service Launch Dashboard For Service Subscription Numbers Assessment Slides PDF
This slide showcases dashboard that can help organization to conduct post service launch analysis by calculating total service subscriptions done by consumers. It can help organization to formulate mitigation strategies in case of declining revenues. Presenting this PowerPoint presentation, titled Promotion Strategies For New Service Launch Dashboard For Service Subscription Numbers Assessment Slides PDF, with topics curated by our researchers after extensive research. This editable presentation is available for immediate download and provides attractive features when used. Download now and captivate your audience. Presenting this Promotion Strategies For New Service Launch Dashboard For Service Subscription Numbers Assessment Slides PDF. Our researchers have carefully researched and created these slides with all aspects taken into consideration. This is a completely customizable Promotion Strategies For New Service Launch Dashboard For Service Subscription Numbers Assessment Slides PDF that is available for immediate downloading. Download now and make an impact on your audience. Highlight the attractive features available with our PPTs.
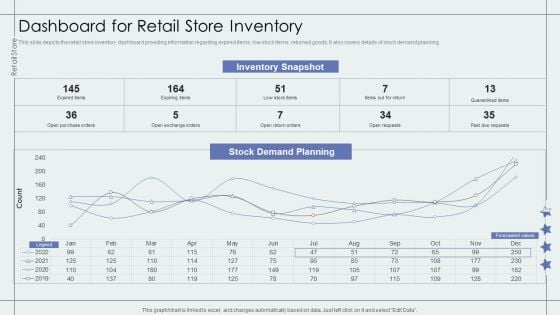
Dashboard For Retail Store Inventory Retail Outlet Performance Assessment Clipart PDF
This slide depicts the retail store inventory dashboard providing information regarding expired items, low stock items, returned goods. It also covers details of stock demand planning.Deliver an awe inspiring pitch with this creative Dashboard For Retail Store Inventory Retail Outlet Performance Assessment Clipart PDF bundle. Topics like Expired Items, Inventory Snapshot, Demand Planning can be discussed with this completely editable template. It is available for immediate download depending on the needs and requirements of the user.
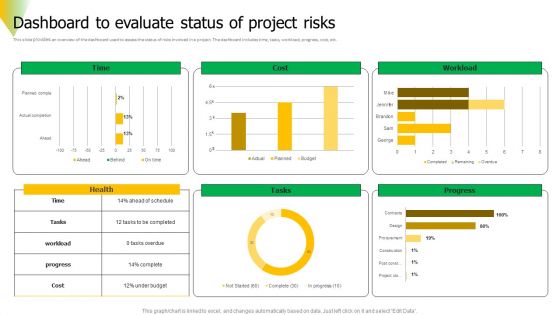
Risk Assessment Dashboard To Evaluate Status Of Project Risks Diagrams PDF
This slide provides an overview of the dashboard used to assess the status of risks involved in a project. The dashboard includes time, tasks, workload, progress, cost, etc. Get a simple yet stunning designed Risk Assessment Dashboard To Evaluate Status Of Project Risks Diagrams PDF. It is the best one to establish the tone in your meetings. It is an excellent way to make your presentations highly effective. So, download this PPT today from Slidegeeks and see the positive impacts. Our easy to edit Risk Assessment Dashboard To Evaluate Status Of Project Risks Diagrams PDF can be your go to option for all upcoming conferences and meetings. So, what are you waiting for Grab this template today.
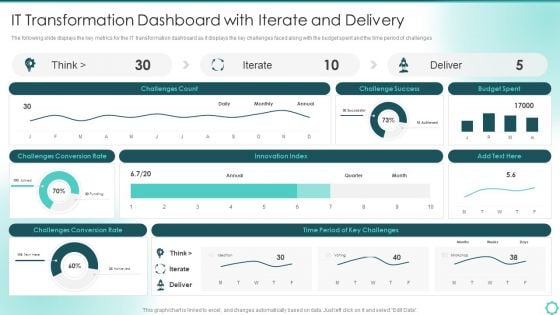
Digitalization Of Transportation Enterprise IT Transformation Dashboard With Iterate And Delivery Designs PDF
The following slide displays the key metrics for the IT transformation dashboard as it displays the key challenges faced along with the budget spent and the time period of challenges. Deliver and pitch your topic in the best possible manner with this Digitalization Of Transportation Enterprise IT Transformation Dashboard With Iterate And Delivery Designs PDF. Use them to share invaluable insights on Innovation Index, Budget Spent, Conversion Rate and impress your audience. This template can be altered and modified as per your expectations. So, grab it now.

Asset Assessment Dashboard With Cash Flow And Market Value Summary PDF
This slide illustrates asset valuation dashboard with key financial metrics. It provides information about cash flow, market value, intrinsic value, assumptions, market cap, discount rate, etc.Showcasing this set of slides titled Asset Assessment Dashboard With Cash Flow And Market Value Summary PDF. The topics addressed in these templates are Discount Rate, Capital Expenditure, Market Capitalization. All the content presented in this PPT design is completely editable. Download it and make adjustments in color, background, font etc. as per your unique business setting.
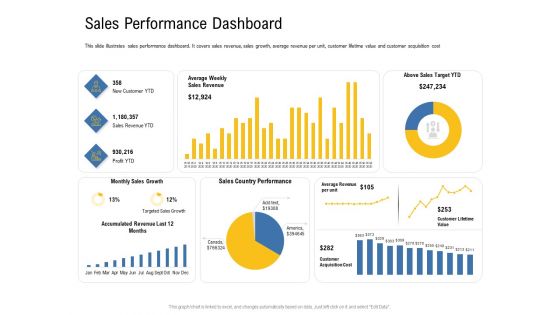
IOT Industry Assessment Sales Performance Dashboard Ppt Model Layout Ideas PDF
This slide illustrates sales performance dashboard. It covers sales revenue, sales growth, average revenue per unit, customer lifetime value and customer acquisition cost. Deliver and pitch your topic in the best possible manner with this iot industry assessment sales performance dashboard ppt model layout ideas pdf. Use them to share invaluable insights on sales, revenue, performance, growth and impress your audience. This template can be altered and modified as per your expectations. So, grab it now.
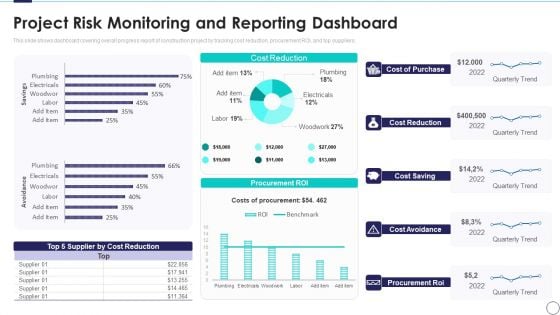
Risk Assessment And Mitigation Plan Project Risk Monitoring And Reporting Dashboard Ppt Inspiration PDF
This slide shows dashboard covering overall progress report of construction project by tracking cost reduction, procurement ROI, and top suppliers. Deliver an awe inspiring pitch with this creative risk assessment and mitigation plan project risk monitoring and reporting dashboard ppt inspiration pdf bundle. Topics like cost reduction, cost saving, cost avoidance, procurement roi can be discussed with this completely editable template. It is available for immediate download depending on the needs and requirements of the user.
Employees Performance Assessment And Appraisal Determine Employee Performance Tracker Dashboard Diagrams PDF
This slide provides information about employee performance tracker dashboard which covers details in context to employee training, etc.Deliver and pitch your topic in the best possible manner with this Employees Performance Assessment And Appraisal Determine Employee Performance Tracker Dashboard Diagrams PDF Use them to share invaluable insights on Needs Improvement, Current Quarterly, Outstanding and impress your audience. This template can be altered and modified as per your expectations. So, grab it now.
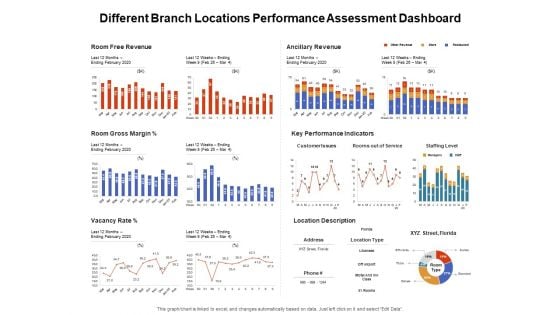
Venture Capitalist Control Board Different Branch Locations Performance Assessment Dashboard Graphics PDF
Presenting this set of slides with name venture capitalist control board different branch locations performance assessment dashboard graphics pdf. The topics discussed in these slides are room free revenue, ancillary revenue, key performance indicators, room gross margin, location description, vacancy rate. This is a completely editable PowerPoint presentation and is available for immediate download. Download now and impress your audience.
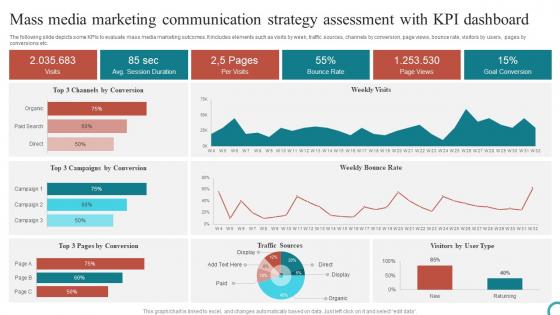
Mass Media Marketing Communication Strategy Assessment With KPI Dashboard Elements Pdf
The following slide depicts some KPIs to evaluate mass media marketing outcomes. It includes elements such as visits by week, traffic sources, channels by conversion, page views, bounce rate, visitors by users, pages by conversions etc. Showcasing this set of slides titled Mass Media Marketing Communication Strategy Assessment With KPI Dashboard Elements Pdf. The topics addressed in these templates are Dashboard, Goal Conversion, Bounce Rate. All the content presented in this PPT design is completely editable. Download it and make adjustments in color, background, font etc. as per your unique business setting. The following slide depicts some KPIs to evaluate mass media marketing outcomes. It includes elements such as visits by week, traffic sources, channels by conversion, page views, bounce rate, visitors by users, pages by conversions etc.
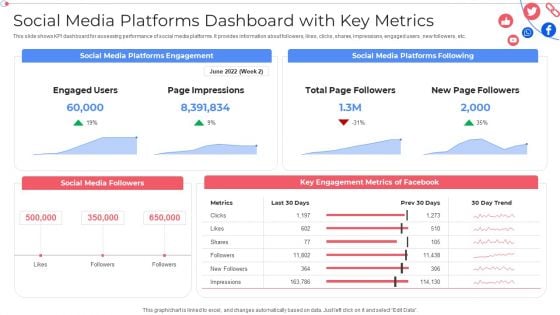
Social Media Platforms Dashboard With Key Metrics Customer Group Engagement Through Social Media Channels Infographics PDF
This slide shows KPI dashboard for assessing performance of social media platforms. It provides information about followers, likes, clicks, shares, impressions, engaged users , new followers, etc. Deliver an awe inspiring pitch with this creative Social Media Platforms Dashboard With Key Metrics Customer Group Engagement Through Social Media Channels Infographics PDF bundle. Topics like Social Media Followers, Key Engagement Metrics can be discussed with this completely editable template. It is available for immediate download depending on the needs and requirements of the user.
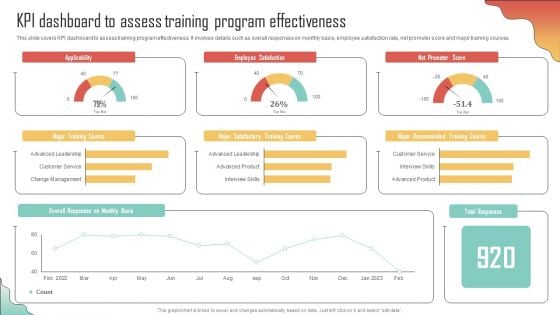
KPI Dashboard Assess Training Program Effectiveness Enhancing Organization Productivity By Implementing Graphics PDF
This slide covers KPI dashboard to assess training program effectiveness. It involves details such as overall responses on monthly basis, employee satisfaction rate, net promoter score and major training courses. If you are looking for a format to display your unique thoughts, then the professionally designed KPI Dashboard Assess Training Program Effectiveness Enhancing Organization Productivity By Implementing Graphics PDF is the one for you. You can use it as a Google Slides template or a PowerPoint template. Incorporate impressive visuals, symbols, images, and other charts. Modify or reorganize the text boxes as you desire. Experiment with shade schemes and font pairings. Alter, share or cooperate with other people on your work. Download KPI Dashboard Assess Training Program Effectiveness Enhancing Organization Productivity By Implementing Graphics PDF and find out how to give a successful presentation. Present a perfect display to your team and make your presentation unforgettable.
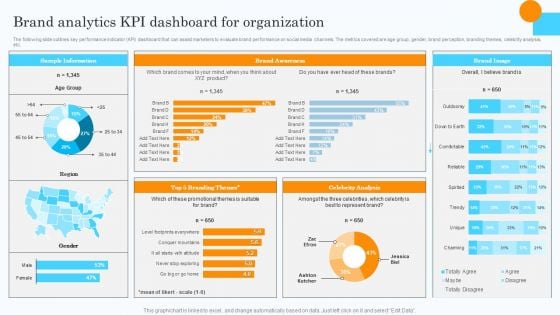
Market Research Assessment Of Target Market Requirements Brand Analytics Kpi Dashboard For Organization Clipart PDF
The following slide outlines key performance indicator KPI dashboard that can assist marketers to evaluate brand performance on social media channels. The metrics covered are age group, gender, brand perception, branding themes, celebrity analysis, etc. Do you have an important presentation coming up Are you looking for something that will make your presentation stand out from the rest Look no further than Market Research Assessment Of Target Market Requirements Brand Analytics Kpi Dashboard For Organization Clipart PDF. With our professional designs, you can trust that your presentation will pop and make delivering it a smooth process. And with Slidegeeks, you can trust that your presentation will be unique and memorable. So why wait Grab Market Research Assessment Of Target Market Requirements Brand Analytics Kpi Dashboard For Organization Clipart PDF today and make your presentation stand out from the rest.
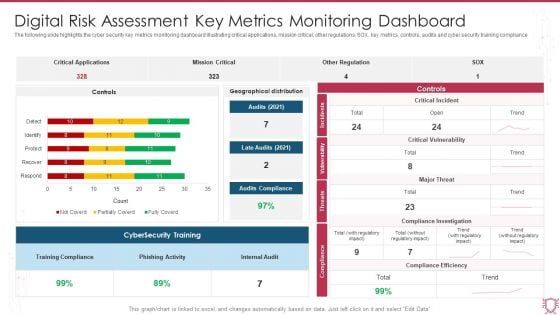
Digital Risk Assessment Key Metrics Monitoring Dashboard Ppt Ideas Diagrams PDF
The following slide highlights the cyber security key metrics monitoring dashboard illustrating critical applications, mission critical, other regulations, SOX, key metrics, controls, audits and cyber security training compliance. Showcasing this set of slides titled Digital Risk Assessment Key Metrics Monitoring Dashboard Ppt Ideas Diagrams PDF. The topics addressed in these templates are Critical Applications, Mission Critical, Other Regulation. All the content presented in this PPT design is completely editable. Download it and make adjustments in color, background, font etc. as per your unique business setting.
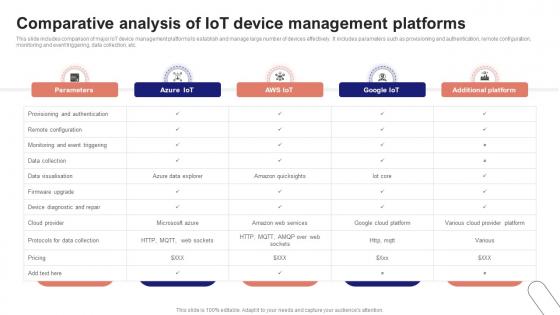
IoT Device Management Fundamentals Comparative Analysis Of IoT Device Management Platforms IoT Ss V
This slide includes comparison of major IoT device management platforms to establish and manage large number of devices effectively. It includes parameters such as provisioning and authentication, remote configuration, monitoring and event triggering, data collection, etc. If your project calls for a presentation, then Slidegeeks is your go-to partner because we have professionally designed, easy-to-edit templates that are perfect for any presentation. After downloading, you can easily edit IoT Device Management Fundamentals Comparative Analysis Of IoT Device Management Platforms IoT SS V and make the changes accordingly. You can rearrange slides or fill them with different images. Check out all the handy templates This slide includes comparison of major IoT device management platforms to establish and manage large number of devices effectively. It includes parameters such as provisioning and authentication, remote configuration, monitoring and event triggering, data collection, etc.
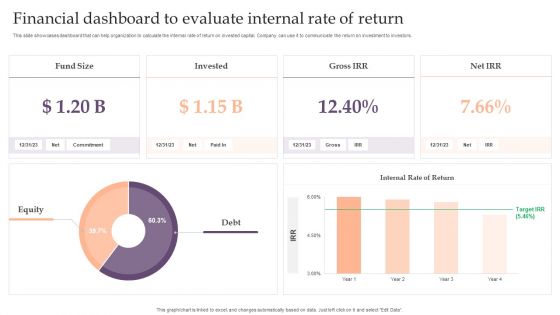
Assessing Debt And Equity Fundraising Alternatives For Business Growth Financial Dashboard To Evaluate Internal Designs PDF
This slide showcases dashboard that can help organization to calculate the internal rate of return on invested capital. Company can use it to communicate the return on investment to investors. Create an editable Assessing Debt And Equity Fundraising Alternatives For Business Growth Financial Dashboard To Evaluate Internal Designs PDF that communicates your idea and engages your audience. Whether you are presenting a business or an educational presentation, pre designed presentation templates help save time.Assessing Debt And Equity Fundraising Alternatives For Business Growth Financial Dashboard To Evaluate Internal Designs PDF is highly customizable and very easy to edit, covering many different styles from creative to business presentations. Slidegeeks has creative team members who have crafted amazing templates. So, go and get them without any delay.
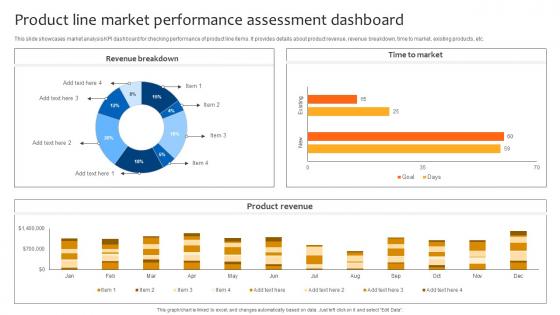
Deploying Strategies For Business Product Line Market Performance Assessment Dashboard Strategy SS V
This slide showcases market analysis KPI dashboard for checking performance of product line items. It provides details about product revenue, revenue breakdown, time to market, existing products, etc. Take your projects to the next level with our ultimate collection of Deploying Strategies For Business Product Line Market Performance Assessment Dashboard Strategy SS V. Slidegeeks has designed a range of layouts that are perfect for representing task or activity duration, keeping track of all your deadlines at a glance. Tailor these designs to your exact needs and give them a truly corporate look with your own brand colors they will make your projects stand out from the rest This slide showcases market analysis KPI dashboard for checking performance of product line items. It provides details about product revenue, revenue breakdown, time to market, existing products, etc.
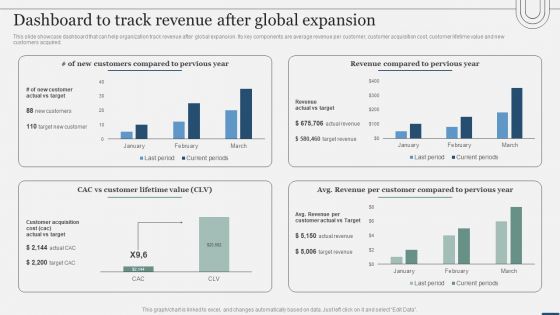
Assessing International Market Dashboard To Track Revenue After Global Expansion Template PDF
This slide showcase dashboard that can help organization track revenue after global expansion. Its key components are average revenue per customer, customer acquisition cost, customer lifetime value and new customers acquired. Crafting an eye-catching presentation has never been more straightforward. Let your presentation shine with this tasteful yet straightforward Assessing International Market Dashboard To Track Revenue After Global Expansion Template PDF template. It offers a minimalistic and classy look that is great for making a statement. The colors have been employed intelligently to add a bit of playfulness while still remaining professional. Construct the ideal Assessing International Market Dashboard To Track Revenue After Global Expansion Template PDF that effortlessly grabs the attention of your audience Begin now and be certain to wow your customers.
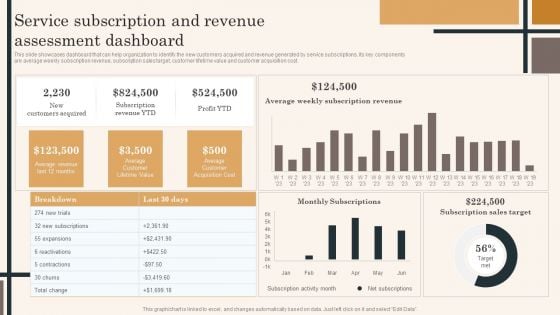
Edtech Service Launch And Promotion Plan Service Subscription And Revenue Assessment Dashboard Topics PDF
This slide showcases dashboard that can help organization to identify the new customers acquired and revenue generated by service subscriptions. Its key components are average weekly subscription revenue, subscription sales target, customer lifetime value and customer acquisition cost. Whether you have daily or monthly meetings, a brilliant presentation is necessary. Edtech Service Launch And Promotion Plan Service Subscription And Revenue Assessment Dashboard Topics PDF can be your best option for delivering a presentation. Represent everything in detail using Edtech Service Launch And Promotion Plan Service Subscription And Revenue Assessment Dashboard Topics PDF and make yourself stand out in meetings. The template is versatile and follows a structure that will cater to your requirements. All the templates prepared by Slidegeeks are easy to download and edit. Our research experts have taken care of the corporate themes as well. So, give it a try and see the results.


 Continue with Email

 Home
Home


