Change Management Dashboard
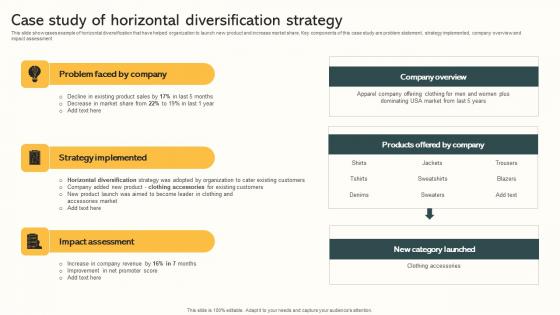
Case Study Of Horizontal Diversification Strategy Market Expansion Through Portrait Pdf
This slide showcases example of horizontal diversification that have helped organization to launch new product and increase market share. Key components of this case study are problem statement, strategy implemented, company overview and impact assessment. The Case Study Of Horizontal Diversification Strategy Market Expansion Through Portrait Pdf is a compilation of the most recent design trends as a series of slides. It is suitable for any subject or industry presentation, containing attractive visuals and photo spots for businesses to clearly express their messages. This template contains a variety of slides for the user to input data, such as structures to contrast two elements, bullet points, and slides for written information. Slidegeeks is prepared to create an impression. This slide showcases example of horizontal diversification that have helped organization to launch new product and increase market share. Key components of this case study are problem statement, strategy implemented, company overview and impact assessment.
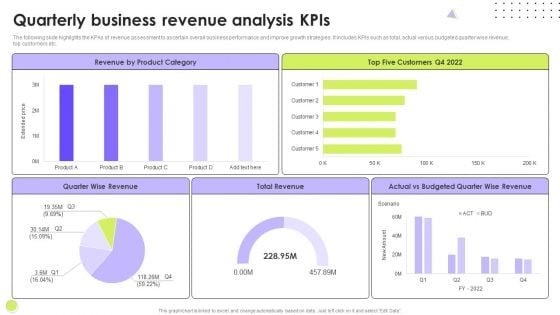
Quarterly Business Revenue Analysis Kpis Slides PDF
The following slide highlights the KPAs of revenue assessment to ascertain overall business performance and improve growth strategies. It includes KPIs such as total, actual versus budgeted quarter wise revenue, top customers etc. Showcasing this set of slides titled Quarterly Business Revenue Analysis Kpis Slides PDF. The topics addressed in these templates are Quarter Wise Revenue, Customers, Budgeted Quarter. All the content presented in this PPT design is completely editable. Download it and make adjustments in color, background, font etc. as per your unique business setting.
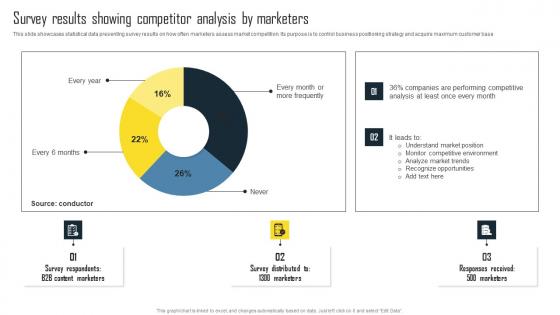
Survey Results Showing Competitor Analysis Efficient Plan For Conducting Competitor Elements Pdf
This slide showcases statistical data presenting survey results on how often marketers assess market competition. Its purpose is to control business positioning strategy and acquire maximum customer base Coming up with a presentation necessitates that the majority of the effort goes into the content and the message you intend to convey. The visuals of a PowerPoint presentation can only be effective if it supplements and supports the story that is being told. Keeping this in mind our experts created Survey Results Showing Competitor Analysis Efficient Plan For Conducting Competitor Elements Pdf to reduce the time that goes into designing the presentation. This way, you can concentrate on the message while our designers take care of providing you with the right template for the situation. This slide showcases statistical data presenting survey results on how often marketers assess market competition. Its purpose is to control business positioning strategy and acquire maximum customer base
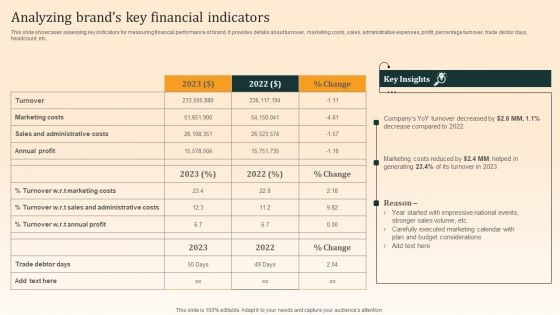
Nike Emotional Branding Strategy Analyzing Brands Key Financial Indicators Summary PDF
This slide showcases assessing key indicators for measuring financial performance of brand. It provides details about turnover, marketing costs, sales, administrative expenses, profit, percentage turnover, trade debtor days, headcount, etc. Create an editable Nike Emotional Branding Strategy Analyzing Brands Key Financial Indicators Summary PDF that communicates your idea and engages your audience. Whether youre presenting a business or an educational presentation, pre designed presentation templates help save time. Nike Emotional Branding Strategy Analyzing Brands Key Financial Indicators Summary PDF is highly customizable and very easy to edit, covering many different styles from creative to business presentations. Slidegeeks has creative team members who have crafted amazing templates. So, go and get them without any delay.
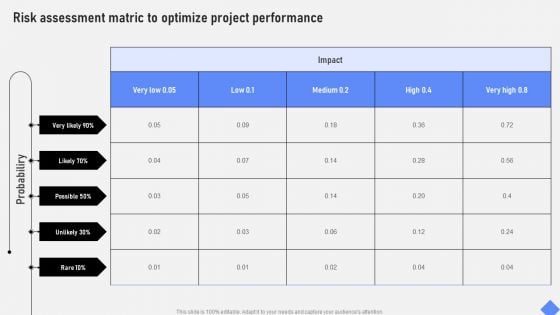
Risk Assessment Matric To Optimize Project Performance Infographics PDF
Slidegeeks has constructed Risk Assessment Matric To Optimize Project Performance Infographics PDF after conducting extensive research and examination. These presentation templates are constantly being generated and modified based on user preferences and critiques from editors. Here, you will find the most attractive templates for a range of purposes while taking into account ratings and remarks from users regarding the content. This is an excellent jumping off point to explore our content and will give new users an insight into our top notch PowerPoint Templates.
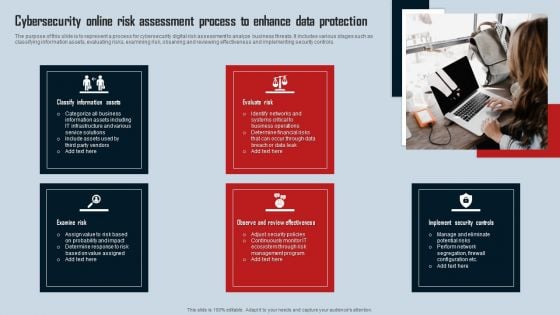
Cybersecurity Online Risk Assessment Process To Enhance Data Protection Introduction PDF
The purpose of this slide is to represent a process for cybersecurity digital risk assessment to analyze business threats. It includes various stages such as classifying information assets, evaluating risks, examining risk, observing and reviewing effectiveness and implementing security controls. Presenting Cybersecurity Online Risk Assessment Process To Enhance Data Protection Introduction PDF to dispense important information. This template comprises four stages. It also presents valuable insights into the topics including Classify Information Assets, Evaluate Risk, Examine Risk. This is a completely customizable PowerPoint theme that can be put to use immediately. So, download it and address the topic impactfully.
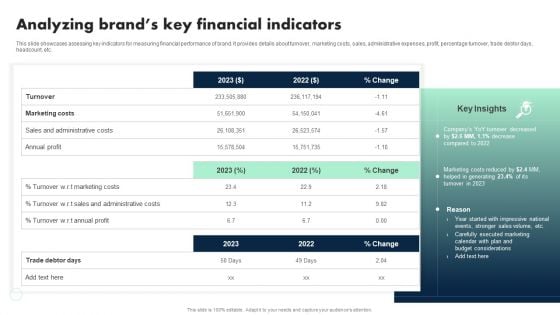
Apple Emotional Marketing Strategy Analyzing Brands Key Financial Indicators Rules PDF
This slide showcases assessing key indicators for measuring financial performance of brand. It provides details about turnover, marketing costs, sales, administrative expenses, profit, percentage turnover, trade debtor days, headcount, etc. Here you can discover an assortment of the finest PowerPoint and Google Slides templates. With these templates, you can create presentations for a variety of purposes while simultaneously providing your audience with an eye catching visual experience. Download Apple Emotional Marketing Strategy Analyzing Brands Key Financial Indicators Rules PDF to deliver an impeccable presentation. These templates will make your job of preparing presentations much quicker, yet still, maintain a high level of quality. Slidegeeks has experienced researchers who prepare these templates and write high quality content for you. Later on, you can personalize the content by editing the Apple Emotional Marketing Strategy Analyzing Brands Key Financial Indicators Rules PDF.
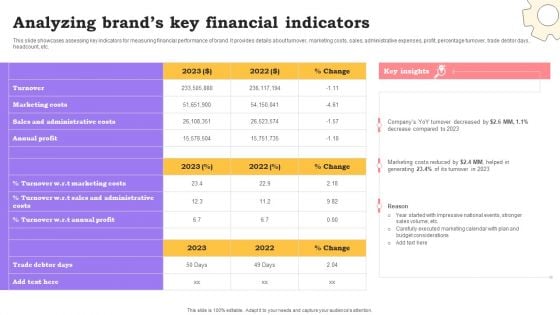
Marketing Commodities And Offerings Analyzing Brands Key Financial Indicators Demonstration PDF
This slide showcases assessing key indicators for measuring financial performance of brand. It provides details about turnover, marketing costs, sales, administrative expenses, profit, percentage turnover, trade debtor days, headcount, etc. Here you can discover an assortment of the finest PowerPoint and Google Slides templates. With these templates, you can create presentations for a variety of purposes while simultaneously providing your audience with an eye catching visual experience. Download Marketing Commodities And Offerings Analyzing Brands Key Financial Indicators Demonstration PDF to deliver an impeccable presentation. These templates will make your job of preparing presentations much quicker, yet still, maintain a high level of quality. Slidegeeks has experienced researchers who prepare these templates and write high quality content for you. Later on, you can personalize the content by editing the Marketing Commodities And Offerings Analyzing Brands Key Financial Indicators Demonstration PDF.
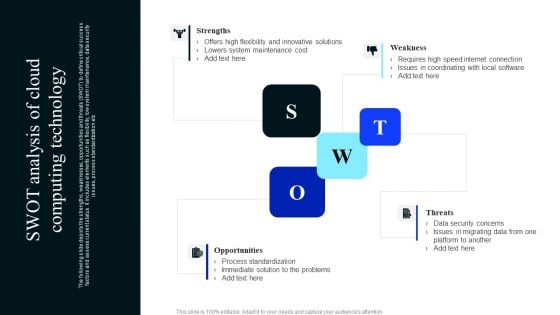
SWOT Analysis Of Cloud Computing Technology Download PDF
The following slide depicts the strengths, weaknesses, opportunities and threats SWOT to define critical success factors and assess current status. It includes elements such as flexibility, low system maintenance, data security issues, process standardization etc. Presenting SWOT Analysis Of Cloud Computing Technology Download PDF to dispense important information. This template comprises four stages. It also presents valuable insights into the topics including Strengths, Weakness, Threats, Opportunities. This is a completely customizable PowerPoint theme that can be put to use immediately. So, download it and address the topic impactfully.

Income Assessment Document Performance Bonuses Ppt Infographic Template Guide PDF
Presenting Income Assessment Document Performance Bonuses Ppt Infographic Template Guide PDF to provide visual cues and insights. Share and navigate important information on four stages that need your due attention. This template can be used to pitch topics like Policy Elements, Lump Sum Bonus, Incentive Plans. In addtion, this PPT design contains high resolution images, graphics, etc, that are easily editable and available for immediate download.

Thank You Staff Work Performance Assessment Ppt PowerPoint Presentation Infographics Gridlines
Presenting this set of slides with name thank you staff work performance assessment ppt powerpoint presentation infographics gridlines. This is a one stage process. The stages in this process are thank you. This is a completely editable PowerPoint presentation and is available for immediate download. Download now and impress your audience.
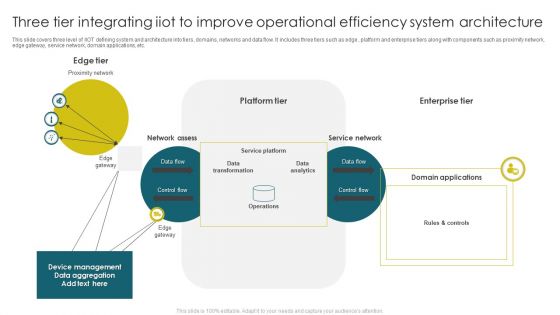
Three Tier Integrating Iiot To Improve Operational Efficiency System Architecture Microsoft PDF
This slide covers three level of IIOT defining system and architecture into tiers, domains, networks and data flow. It includes three tiers such as edge , platform and enterprise tiers along with components such as proximity network, edge gateway, service network, domain applications, etc. Showcasing this set of slides titled Three Tier Integrating Iiot To Improve Operational Efficiency System Architecture Microsoft PDF. The topics addressed in these templates are Data Transformation, Service Platform, Data Analytics. All the content presented in this PPT design is completely editable. Download it and make adjustments in color, background, font etc. as per your unique business setting.
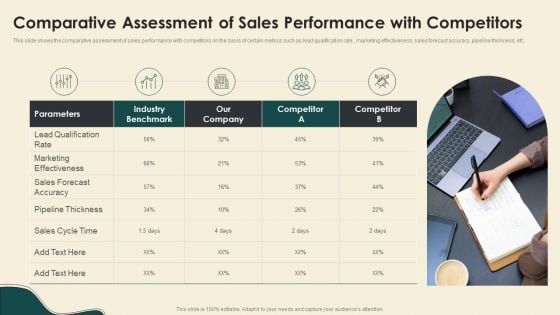
Comparative Assessment Of Sales Performance With Competitors Infographics PDF
This slide shows the comparative assessment of sales performance with competitors on the basis of certain metrics such as lead qualification rate, marketing effectiveness, sales forecast accuracy, pipeline thickness, etc. Presenting Comparative Assessment Of Sales Performance With Competitors Infographics PDF to provide visual cues and insights. Share and navigate important information on five stages that need your due attention. This template can be used to pitch topics like Industry Benchmark, Marketing Effectiveness, Sales Forecast Accuracy. In addtion, this PPT design contains high resolution images, graphics, etc, that are easily editable and available for immediate download.
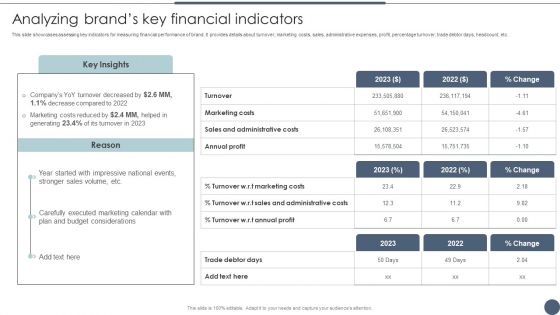
Analyzing Brands Key Financial Indicators Utilizing Emotional And Rational Branding For Improved Consumer Outreach Template PDF
This slide showcases assessing key indicators for measuring financial performance of brand. It provides details about turnover, marketing costs, sales, administrative expenses, profit, percentage turnover, trade debtor days, headcount, etc. Slidegeeks is one of the best resources for PowerPoint templates. You can download easily and regulate Analyzing Brands Key Financial Indicators Utilizing Emotional And Rational Branding For Improved Consumer Outreach Template PDF for your personal presentations from our wonderful collection. A few clicks is all it takes to discover and get the most relevant and appropriate templates. Use our Templates to add a unique zing and appeal to your presentation and meetings. All the slides are easy to edit and you can use them even for advertisement purposes.
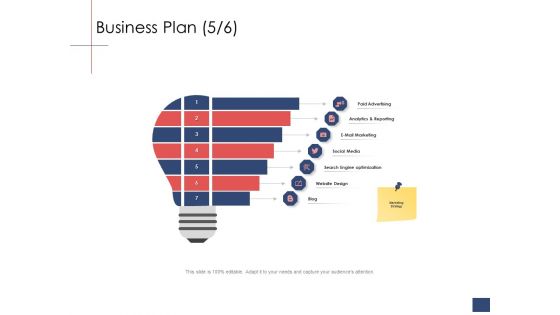
Business Assessment Outline Business Plan Marketing Ppt Portfolio Themes PDF
Presenting business assessment outline business plan marketing ppt portfolio themes pdf to provide visual cues and insights. Share and navigate important information on seven stages that need your due attention. This template can be used to pitch topics like paid advertising, analytics and reporting, e mail marketing, social media, search engine optimization, website design, blog. In addition, this PPT design contains high-resolution images, graphics, etc, that are easily editable and available for immediate download.

Departments Of Visualization Research Different Types Of Analysis For Data Visualization Summary PDF
This slide describes the different types of analysis for data visualization, such as univariate analysis, bivariate analysis, and multivariate analysis.This is a Departments Of Visualization Research Different Types Of Analysis For Data Visualization Summary PDF template with various stages. Focus and dispense information on five stages using this creative set, that comes with editable features. It contains large content boxes to add your information on topics like Multivariate Analysis, Assess Practically, Univariate Analysis You can also showcase facts, figures, and other relevant content using this PPT layout. Grab it now.

Person Assessing Financial Trends For Business Ppt PowerPoint Presentation Show Layout PDF
Persuade your audience using this person assessing financial trends for business ppt powerpoint presentation show layout pdf. This PPT design covers one stages, thus making it a great tool to use. It also caters to a variety of topics including person assessing financial trends for business. Download this PPT design now to present a convincing pitch that not only emphasizes the topic but also showcases your presentation skills.
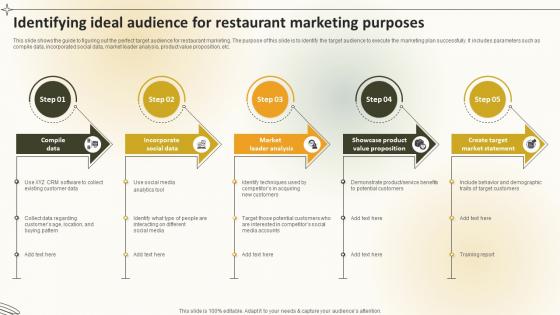
Identifying Ideal Audience For Restaurant Marketing Purposes Create An Effective Restaurant
This slide shows the guide to figuring out the perfect target audience for restaurant marketing. The purpose of this slide is to identify the target audience to execute the marketing plan successfully. It includes parameters such as compile data, incorporated social data, market leader analysis, product value proposition, etc. Are you in need of a template that can accommodate all of your creative concepts This one is crafted professionally and can be altered to fit any style. Use it with Google Slides or PowerPoint. Include striking photographs, symbols, depictions, and other visuals. Fill, move around, or remove text boxes as desired. Test out color palettes and font mixtures. Edit and save your work, or work with colleagues. Download Identifying Ideal Audience For Restaurant Marketing Purposes Create An Effective Restaurant and observe how to make your presentation outstanding. Give an impeccable presentation to your group and make your presentation unforgettable. This slide shows the guide to figuring out the perfect target audience for restaurant marketing. The purpose of this slide is to identify the target audience to execute the marketing plan successfully. It includes parameters such as compile data, incorporated social data, market leader analysis, product value proposition, etc.
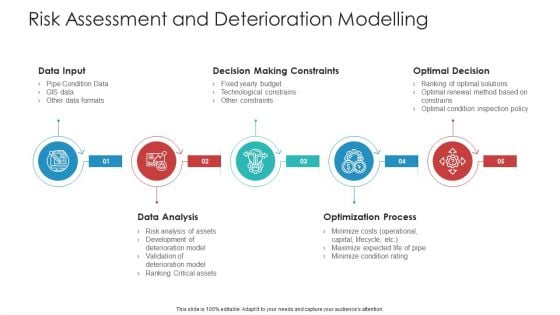
Risk Assessment And Deterioration Modelling Infographics PDF
This is a risk assessment and deterioration modelling infographics pdf template with various stages. Focus and dispense information on five stages using this creative set, that comes with editable features. It contains large content boxes to add your information on topics like data input, data analysis, optimization process, decision making constraints, optimal decision. You can also showcase facts, figures, and other relevant content using this PPT layout. Grab it now.
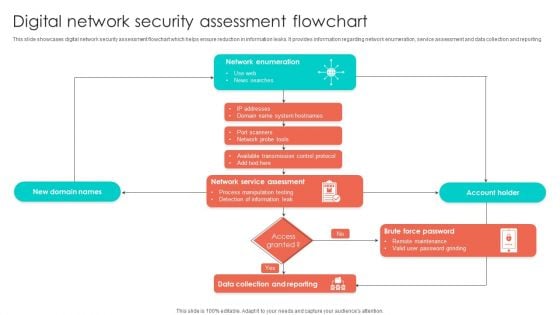
Digital Network Security Assessment Flowchart Structure PDF
This slide showcases digital network security assessment flowchart which helps ensure reduction in information leaks. It provides information regarding network enumeration, service assessment and data collection and reporting. Showcasing this set of slides titled Digital Network Security Assessment Flowchart Structure PDF. The topics addressed in these templates are Account Holder, Information Leak, Network Service Assessment. All the content presented in this PPT design is completely editable. Download it and make adjustments in color, background, font etc. as per your unique business setting.

5 Kpis To Monitor And Track Network Service Assessment Information PDF
Mentioned slide outlines various kpis which can be used by IT reps to monitor network performance. The kpis mentioned in the template are latency, network jitter, packet loss, throughput and mean opinion score. It also covers information about objective, strategies implemented and actual performance of each kpis. Showcasing this set of slides titled 5 Kpis To Monitor And Track Network Service Assessment Information PDF. The topics addressed in these templates are Strategies Implemented, Network Security, Quality. All the content presented in this PPT design is completely editable. Download it and make adjustments in color, background, font etc. as per your unique business setting.
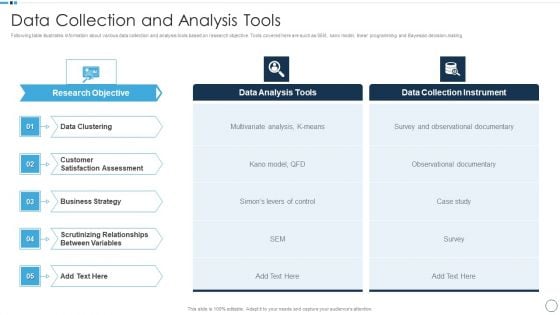
QA Plan Set 1 Data Collection And Analysis Tools Infographics PDF
Presenting QA Plan Set 1 Data Collection And Analysis Tools Infographics PDF to provide visual cues and insights. Share and navigate important information on five stages that need your due attention. This template can be used to pitch topics like Data Clustering, Business Strategy, Customer Satisfaction Assessment. In addtion, this PPT design contains high resolution images, graphics, etc, that are easily editable and available for immediate download.
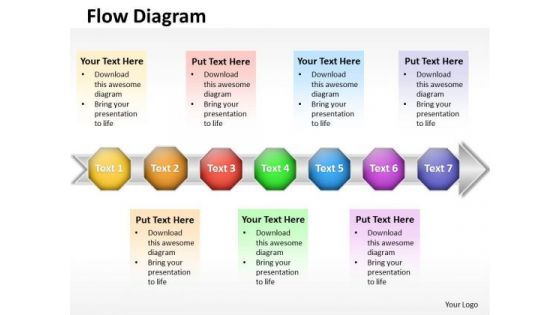
Ppt 7 Sequential Stages New Business PowerPoint Presentation Data Flow Diagram Templates
PPT 7 sequential stages new business PowerPoint presentation data flow diagram Templates-This PowerPoint Diagram shows you the Homogeneous Abstraction of seven approaches on the Arrow. It shows the successive concepts used in a procedure. This diagram will fit for Business Presentations. -PPT 7 sequential stages new business PowerPoint presentation data flow diagram Templates-arrow, art, assess, blue, business, chart, chevron, clip, clipart, colorful, compliance, corporate, design, development, diagram, flow, glossy, graphic, hierarchy, icon, illustration, implement, info graphic, levels, marketing, modern, plan, process, shape, shiny, square, stages, vector Compel your team with our Ppt 7 Sequential Stages New Business PowerPoint Presentation Data Flow Diagram Templates. Download without worries with our money back guaranteee.

Strawman Project Action Plan Ensuring Quality Standards Maintenance At Organization Infographics PDF
Deliver an awe inspiring pitch with this creative strawman project action plan ensuring quality standards maintenance at organization infographics pdf bundle. Topics like performance standards, assessment activities, quality standard parameters can be discussed with this completely editable template. It is available for immediate download depending on the needs and requirements of the user.
Risk Based Data Quality Improvement Model Ppt PowerPoint Presentation Icon Layout PDF
Showcasing this set of slides titled risk based data quality improvement model ppt powerpoint presentation icon layout pdf. The topics addressed in these templates are data exploration and profiling, organizational maturity assessment, data quality assessment . All the content presented in this PPT design is completely editable. Download it and make adjustments in color, background, font etc. as per your unique business setting.
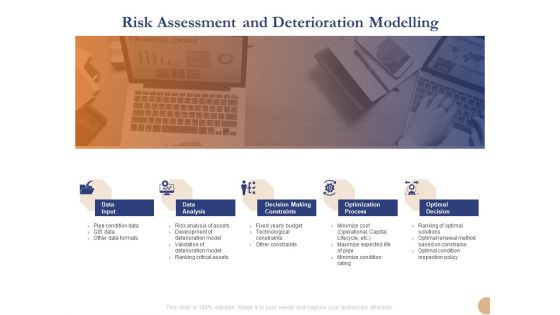
Substructure Segment Analysis Risk Assessment And Deterioration Modelling Ppt Professional Layouts PDF
Presenting substructure segment analysis risk assessment and deterioration modelling ppt professional layouts pdf to provide visual cues and insights. Share and navigate important information on five stages that need your due attention. This template can be used to pitch topics like data input, data analysis, optimal decision, optimization process, decision making constraints. In addition, this PPT design contains high-resolution images, graphics, etc, that are easily editable and available for immediate download.

Improving Customer Satisfaction Success Factor Of Implementing Digital Insurance System
The slide outlines various factors affecting success of digital transformation in insurance sector to adopt advance technology solutions. Key success factors consists of customer focus, agility, data driven decision making and collaboration. Are you in need of a template that can accommodate all of your creative concepts This one is crafted professionally and can be altered to fit any style. Use it with Google Slides or PowerPoint. Include striking photographs, symbols, depictions, and other visuals. Fill, move around, or remove text boxes as desired. Test out color palettes and font mixtures. Edit and save your work, or work with colleagues. Download Improving Customer Satisfaction Success Factor Of Implementing Digital Insurance System and observe how to make your presentation outstanding. Give an impeccable presentation to your group and make your presentation unforgettable. The slide outlines various factors affecting success of digital transformation in insurance sector to adopt advance technology solutions. Key success factors consists of customer focus, agility, data driven decision making and collaboration.
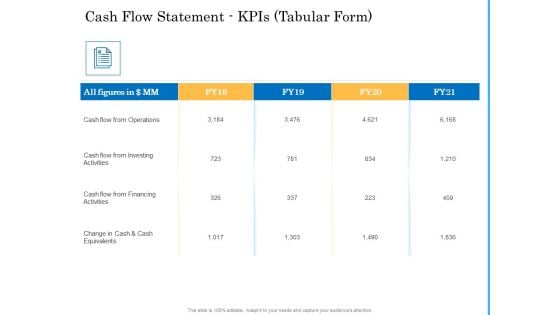
Deal Assessment Audit Process Cash Flow Statement Kpis Tabular Form Diagrams PDF
Deliver and pitch your topic in the best possible manner with this deal assessment audit process cash flow statement kpis tabular form diagrams pdf. Use them to share invaluable insights on cash flow from operations, cash flow from investing activities, cash flow from financing activities and impress your audience. This template can be altered and modified as per your expectations. So, grab it now.
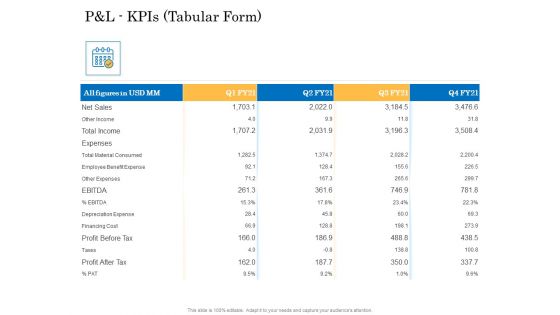
Deal Assessment Audit Process P And L Kpis Tabular Form Designs PDF
Deliver an awe-inspiring pitch with this creative deal assessment audit process p and l kpis tabular form designs pdf bundle. Topics like net sales, expenses, financing cost, total income, profit before tax can be discussed with this completely editable template. It is available for immediate download depending on the needs and requirements of the user.
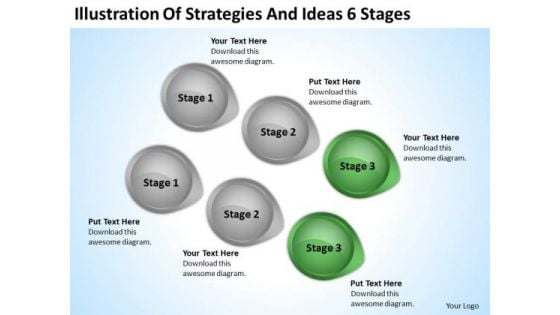
PowerPoint Arrow Shapes Illustration Of Strategies And Ideas 6 Stages Slide
We present our powerpoint arrow shapes illustration of strategies and ideas 6 stages Slide.Use our Circle Charts PowerPoint Templates because Our PowerPoint Templates and Slides ensures Effective communication. They help you put across your views with precision and clarity. Present our Process and Flows PowerPoint Templates because Our PowerPoint Templates and Slides will provide you the cutting edge. Slice through the doubts in the minds of your listeners. Present our Flow Charts PowerPoint Templates because Our PowerPoint Templates and Slides have the Brilliant backdrops. Guaranteed to illuminate the minds of your audience. Present our Success PowerPoint Templates because Our PowerPoint Templates and Slides will steer your racing mind. Hit the right buttons and spur on your audience. Download and present our Shapes PowerPoint Templates because They will Put the wind in your sails. Skim smoothly over the choppy waters of the market.Use these PowerPoint slides for presentations relating to Abstract, access, brochure, business, catalog, chart, circle,color, colorful, concept, conceptual,connection, corporate, creative, cycle,dark, design, diagram, different, vector, five, frame, graphic, group, idea,illustration, information, item,management, marketing, model,navigation, options, parts, piece, plan,presentation, report, round, shape,solution, speech, strategy, structure. The prominent colors used in the PowerPoint template are Green, Gray, White. PowerPoint presentation experts tell us our powerpoint arrow shapes illustration of strategies and ideas 6 stages Slide are second to none. Presenters tell us our catalog PowerPoint templates and PPT Slides are effectively colour coded to prioritise your plans They automatically highlight the sequence of events you desire. Use our powerpoint arrow shapes illustration of strategies and ideas 6 stages Slide will impress their bosses and teams. People tell us our chart PowerPoint templates and PPT Slides will make the presenter look like a pro even if they are not computer savvy. Presenters tell us our powerpoint arrow shapes illustration of strategies and ideas 6 stages Slide are the best it can get when it comes to presenting. Presenters tell us our colorful PowerPoint templates and PPT Slides will help them to explain complicated concepts. Entertain your audience to the hilt. They will stay enthralled with our PowerPoint Arrow Shapes Illustration Of Strategies And Ideas 6 Stages Slide.
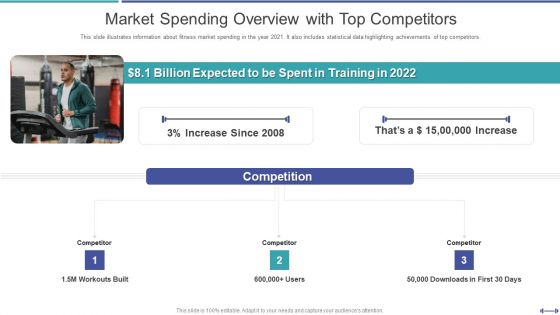
Fundraising Pitch Deck For Gym Startup Market Spending Overview With Top Competitors Structure PDF
This slide illustrates information about fitness market spending in the year 2021. It also includes statistical data highlighting achievements of top competitors.Deliver an awe inspiring pitch with this creative Fundraising Pitch Deck For Gym Startup Market Spending Overview With Top Competitors Structure PDF bundle. Topics like Billion Expected, Competition, Increase can be discussed with this completely editable template. It is available for immediate download depending on the needs and requirements of the user.
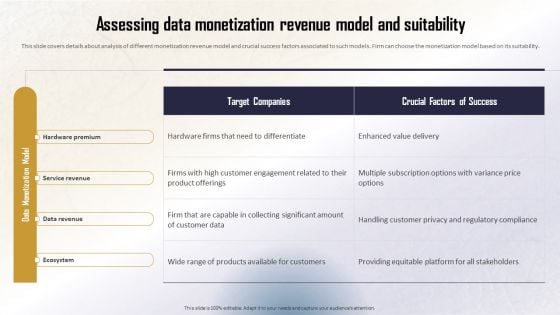
Identifying Direct And Indirect Assessing Data Monetization Revenue Model Designs PDF
This slide covers details about analysis of different monetization revenue model and crucial success factors associated to such models. Firm can choose the monetization model based on its suitability. Create an editable Identifying Direct And Indirect Assessing Data Monetization Revenue Model Designs PDF that communicates your idea and engages your audience. Whether youre presenting a business or an educational presentation, pre-designed presentation templates help save time. Identifying Direct And Indirect Assessing Data Monetization Revenue Model Designs PDF is highly customizable and very easy to edit, covering many different styles from creative to business presentations. Slidegeeks has creative team members who have crafted amazing templates. So, go and get them without any delay.
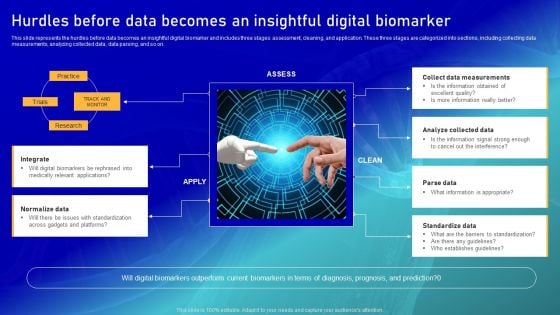
Biomarker Categorization Hurdles Before Data Becomes An Insightful Digital Biomarker Pictures PDF
This slide represents the hurdles before data becomes an insightful digital biomarker and includes three stages assessment, cleaning, and application. These three stages are categorized into sections, including collecting data measurements, analyzing collected data, data parsing, and so on. Make sure to capture your audiences attention in your business displays with our gratis customizable Biomarker Categorization Hurdles Before Data Becomes An Insightful Digital Biomarker Pictures PDF. These are great for business strategies, office conferences, capital raising or task suggestions. If you desire to acquire more customers for your tech business and ensure they stay satisfied, create your own sales presentation with these plain slides.
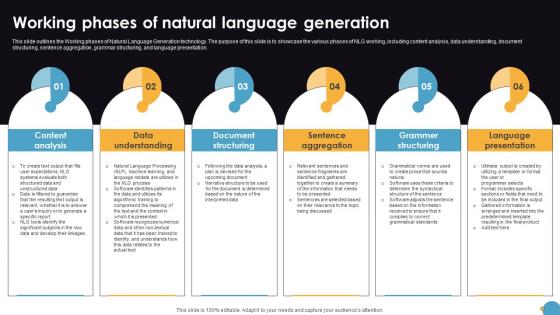
Working Phases Of Natural Language Generation Natural Language Automation
This slide outlines the Working phases of Natural Language Generation technology. The purpose of this slide is to showcase the various phases of NLG working, including content analysis, data understanding, document structuring, sentence aggregation, grammar structuring, and language presentation. Are you in need of a template that can accommodate all of your creative concepts This one is crafted professionally and can be altered to fit any style. Use it with Google Slides or PowerPoint. Include striking photographs, symbols, depictions, and other visuals. Fill, move around, or remove text boxes as desired. Test out color palettes and font mixtures. Edit and save your work, or work with colleagues. Download Working Phases Of Natural Language Generation Natural Language Automation and observe how to make your presentation outstanding. Give an impeccable presentation to your group and make your presentation unforgettable. This slide outlines the Working phases of Natural Language Generation technology. The purpose of this slide is to showcase the various phases of NLG working, including content analysis, data understanding, document structuring, sentence aggregation, grammar structuring, and language presentation.

Assessment Of Amazon Brand Performance Major Threats That Creates Obstacles Brochure PDF
This slide provides information regarding SWOT analysis technique utilized by Amazon to evaluate its competitive positioning. The slide highlighting threats faced by Amazon causing potential issues in terms of data and online privacy risk, aggressive pricing strategies, etc. Want to ace your presentation in front of a live audience Our Assessment Of Amazon Brand Performance Major Threats That Creates Obstacles Brochure PDF can help you do that by engaging all the users towards you. Slidegeeks experts have put their efforts and expertise into creating these impeccable powerpoint presentations so that you can communicate your ideas clearly. Moreover, all the templates are customizable, and easy-to-edit and downloadable. Use these for both personal and commercial use.
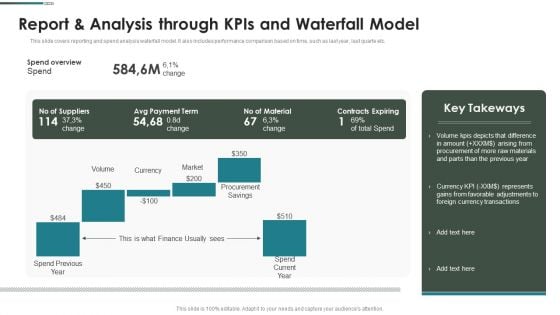
Purchase Assessment Process Report And Analysis Through Kpis And Waterfall Model Graphics PDF
This slide covers reporting and spend analysis waterfall model. It also includes performance comparison based on time, such as last year, last quarte etc. Deliver and pitch your topic in the best possible manner with this Purchase Assessment Process Report And Analysis Through Kpis And Waterfall Model Graphics PDF Use them to share invaluable insights on Contracts Expiring, Currency Transactions, Favorable Adjustments and impress your audience. This template can be altered and modified as per your expectations. So, grab it now.
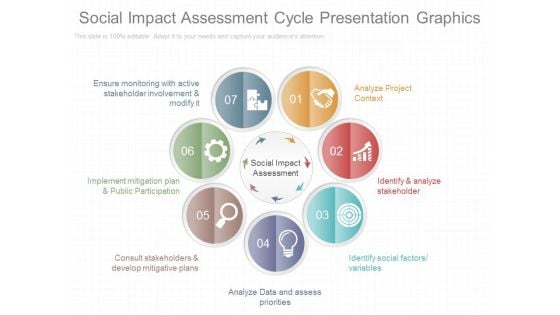
Social Impact Assessment Cycle Presentation Graphics
This is a social impact assessment cycle presentation graphics. This is a seven stage process. The stages in this process are social impact assessment, ensure monitoring with active stakeholder involvement and modify it, analyze project context, implement mitigation plan and public participation, identify and analyze stakeholder, consult stakeholders and develop mitigative plans, identify social factors variables, analyze data and assess priorities.
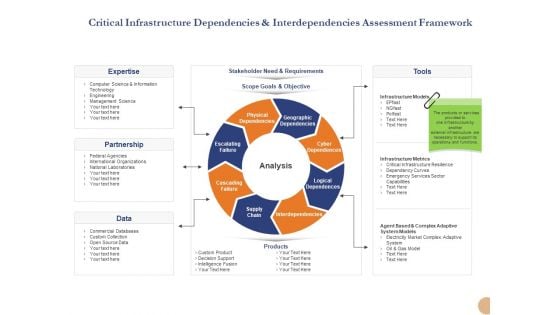
Substructure Segment Analysis Critical Infrastructure Dependencies And Interdependencies Assessment Framework Demonstration PDF
Presenting substructure segment analysis critical infrastructure dependencies and interdependencies assessment framework demonstration pdf to provide visual cues and insights. Share and navigate important information on eight stages that need your due attention. This template can be used to pitch topics like expertise, partnership, data, products and objective. In addition, this PPT design contains high-resolution images, graphics, etc, that are easily editable and available for immediate download.
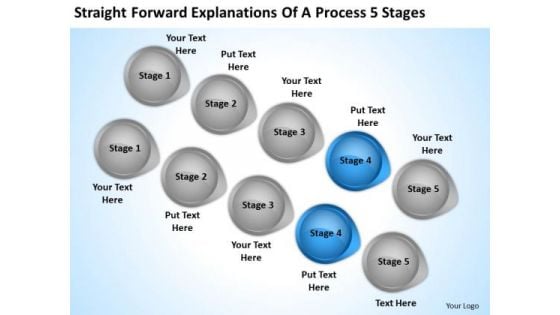
PowerPoint Arrow Straight Forward Explanations Of Process 5 Stages Template
We present our powerpoint arrow straight forward explanations of process 5 stages template.Download and present our Process and Flows PowerPoint Templates because It will mark the footprints of your journey. Illustrate how they will lead you to your desired destination. Download and present our Success PowerPoint Templates because They will bring a lot to the table. Their alluring flavours will make your audience salivate. Present our Flow Charts PowerPoint Templates because You aspire to touch the sky with glory. Let our PowerPoint Templates and Slides provide the fuel for your ascent. Download and present our Shapes PowerPoint Templates because Our PowerPoint Templates and Slides will let your words and thoughts hit bullseye everytime. Use our Target PowerPoint Templates because Our PowerPoint Templates and Slides are the chords of your song. String them along and provide the lilt to your views.Use these PowerPoint slides for presentations relating to Abstract, access, brochure, business, circle,color, colorful, concept, conceptual,connection, corporate, creative, cycle,dark, design, diagram, different, vector, five, frame, graphic, group, idea,illustration, information, item,management, marketing, model,navigation, options, parts, piece, plan,presentation, report, round, shape,solution, speech, strategy, structure. The prominent colors used in the PowerPoint template are Blue, White, Gray. PowerPoint presentation experts tell us our powerpoint arrow straight forward explanations of process 5 stages template are designed to make your presentations professional. Presenters tell us our conceptual PowerPoint templates and PPT Slides are designed to make your presentations professional. Use our powerpoint arrow straight forward explanations of process 5 stages template are designed to make your presentations professional. People tell us our conceptual PowerPoint templates and PPT Slides effectively help you save your valuable time. Presenters tell us our powerpoint arrow straight forward explanations of process 5 stages template provide great value for your money. Be assured of finding the best projection to highlight your words. Presenters tell us our brochure PowerPoint templates and PPT Slides will help you be quick off the draw. Just enter your specific text and see your points hit home. Decorate your thoughts with our PowerPoint Arrow Straight Forward Explanations Of Process 5 Stages Template. Take full advantage of their colourful appearance.
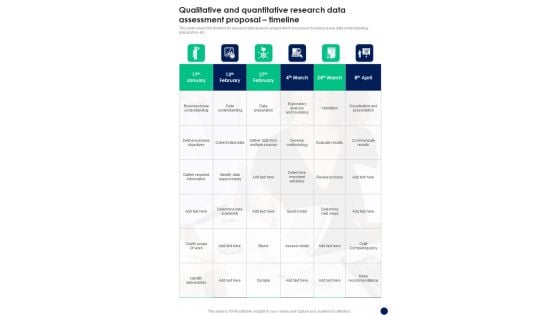
Qualitative And Quantitative Research Data Assessment Proposal Timeline One Pager Sample Example Document
This slide covers the timeline for research data analysis project which focuses on business issue, data understanding, preparation, etc. Presenting you an exemplary Qualitative And Quantitative Research Data Assessment Proposal Timeline One Pager Sample Example Document. Our one pager comprises all the must have essentials of an inclusive document. You can edit it with ease, as its layout is completely editable. With such freedom, you can tweak its design and other elements to your requirements. Download this Qualitative And Quantitative Research Data Assessment Proposal Timeline One Pager Sample Example Document brilliant piece now.
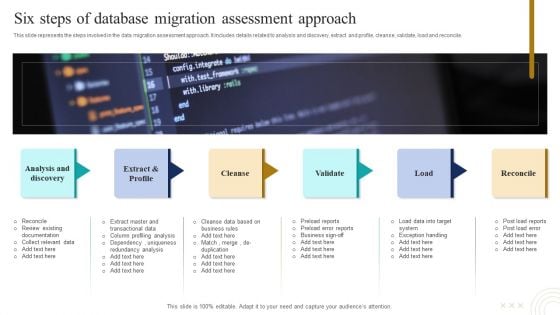
Six Steps Of Database Migration Assessment Approach Download PDF
This slide represents the steps involved in the data migration assessment approach. It includes details related to analysis and discovery, extract and profile, cleanse, validate, load and reconcile. Presenting Six Steps Of Database Migration Assessment Approach Download PDF to dispense important information. This template comprises Six stages. It also presents valuable insights into the topics including Analysis And Discovery, Cleanse, Reconcile. This is a completely customizable PowerPoint theme that can be put to use immediately. So, download it and address the topic impactfully.
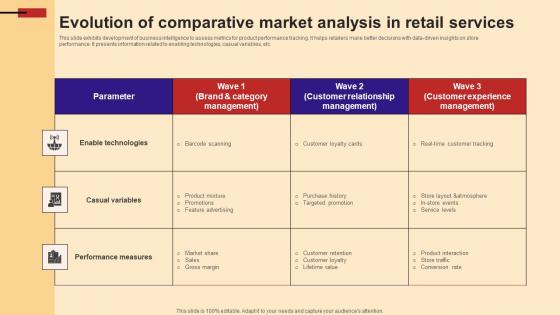
Evolution Of Comparative Market Analysis In Retail Services Information Pdf
This slide exhibits development of business intelligence to assess metrics for product performance tracking. It helps retailers make better decisions with data driven insights on store performance. It presents information related to enabling technologies, casual variables, etc.Showcasing this set of slides titled Evolution Of Comparative Market Analysis In Retail Services Information Pdf The topics addressed in these templates are Enable Technologies, Performance Measures, Casual Variables All the content presented in this PPT design is completely editable. Download it and make adjustments in color, background, font etc. as per your unique business setting. This slide exhibits development of business intelligence to assess metrics for product performance tracking. It helps retailers make better decisions with data driven insights on store performance. It presents information related to enabling technologies, casual variables, etc.
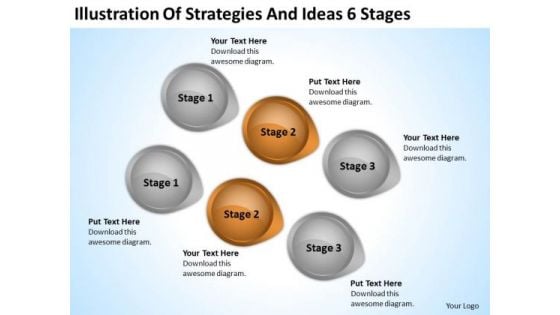
PowerPoint Arrow Shapes Illustration Of Strategies And Ideas 6 Stages Ppt Slide
We present our powerpoint arrow shapes illustration of strategies and ideas 6 stages ppt Slide.Download our Circle Charts PowerPoint Templates because You can Be the star of the show with our PowerPoint Templates and Slides. Rock the stage with your ideas. Use our Ring Charts PowerPoint Templates because Our PowerPoint Templates and Slides offer you the needful to organise your thoughts. Use them to list out your views in a logical sequence. Use our Process and Flows PowerPoint Templates because Our PowerPoint Templates and Slides are effectively colour coded to prioritise your plans They automatically highlight the sequence of events you desire. Download and present our Success PowerPoint Templates because Our PowerPoint Templates and Slides will steer your racing mind. Hit the right buttons and spur on your audience. Download our Shapes PowerPoint Templates because Our PowerPoint Templates and Slides are like the strings of a tennis racquet. Well strung to help you serve aces.Use these PowerPoint slides for presentations relating to Abstract, access, brochure, business, catalog, chart, circle,color, colorful, concept, conceptual,connection, corporate, creative, cycle,dark, design, diagram, different, vector, five, frame, graphic, group, idea,illustration, information, item,management, marketing, model,navigation, options, parts, piece, plan,presentation, report, round, shape,solution, speech, strategy, structure. The prominent colors used in the PowerPoint template are Brown, Gray, Black. PowerPoint presentation experts tell us our powerpoint arrow shapes illustration of strategies and ideas 6 stages ppt Slide will make the presenter successul in his career/life. Presenters tell us our business PowerPoint templates and PPT Slides will make the presenter successul in his career/life. Use our powerpoint arrow shapes illustration of strategies and ideas 6 stages ppt Slide are second to none. People tell us our catalog PowerPoint templates and PPT Slides provide great value for your money. Be assured of finding the best projection to highlight your words. Presenters tell us our powerpoint arrow shapes illustration of strategies and ideas 6 stages ppt Slide are readymade to fit into any presentation structure. Presenters tell us our color PowerPoint templates and PPT Slides help you meet deadlines which are an element of today's workplace. Just browse and pick the slides that appeal to your intuitive senses. You've found a treasure for presentations. Get goingwith our PowerPoint Arrow Shapes Illustration Of Strategies And Ideas 6 Stages Ppt Slide. You'll deliver your best presentation yet.
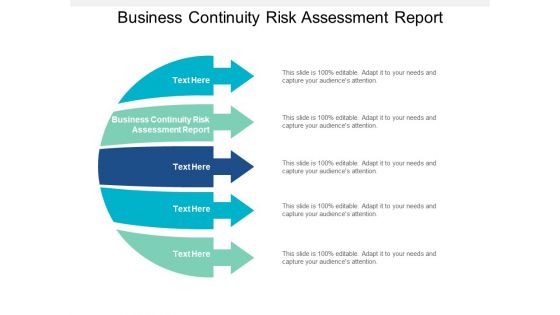
Business Continuity Risk Assessment Report Ppt PowerPoint Presentation Infographics Ideas Cpb
This is a business continuity risk assessment report ppt powerpoint presentation infographics ideas cpb. This is a five stage process. The stages in this process are business continuity risk assessment report.

Performance Assessment Sales Initiative Report Financial Ppt Styles Portfolio PDF
Presenting this set of slides with name performance assessment sales initiative report financial ppt styles portfolio pdf. This is a three stage process. The stages in this process are minimum, medium, maximum. This is a completely editable PowerPoint presentation and is available for immediate download. Download now and impress your audience.

Leveraging Big Data Monitoring For Enhancing Cybersecurity Structure pdf
This slide highlights the benefits of leveraging big data analytics for improving cybersecurity within firm. The purpose of this slide is to help the company capitalize on the positive influence of big data analytics in improving cybersecurity. Showcasing this set of slides titled Leveraging Big Data Monitoring For Enhancing Cybersecurity Structure pdf. The topics addressed in these templates are Identifying And Preventing, Assessing Risks, Preventing Employee Breaches. All the content presented in this PPT design is completely editable. Download it and make adjustments in color, background, font etc. as per your unique business setting. This slide highlights the benefits of leveraging big data analytics for improving cybersecurity within firm. The purpose of this slide is to help the company capitalize on the positive influence of big data analytics in improving cybersecurity.
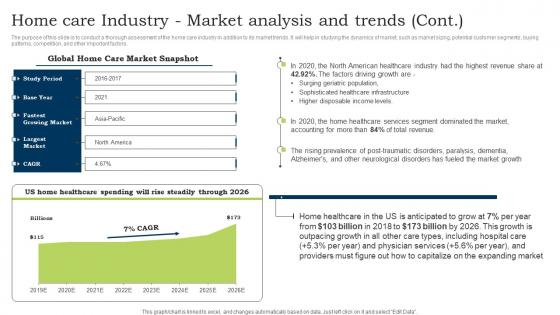
Go To Market Strategy Home Care Industry Market Analysis And Trends Cont Download Pdf
The purpose of this slide is to conduct a thorough assessment of the home care industry in addition to its market trends. It will help in studying the dynamics of market, such as market sizing, potential customer segments, buying patterns, competition, and other important factors. Are you in need of a template that can accommodate all of your creative concepts This one is crafted professionally and can be altered to fit any style. Use it with Google Slides or PowerPoint. Include striking photographs, symbols, depictions, and other visuals. Fill, move around, or remove text boxes as desired. Test out color palettes and font mixtures. Edit and save your work, or work with colleagues. Download Go To Market Strategy Home Care Industry Market Analysis And Trends Cont Download Pdf and observe how to make your presentation outstanding. Give an impeccable presentation to your group and make your presentation unforgettable. The purpose of this slide is to conduct a thorough assessment of the home care industry in addition to its market trends. It will help in studying the dynamics of market, such as market sizing, potential customer segments, buying patterns, competition, and other important factors.
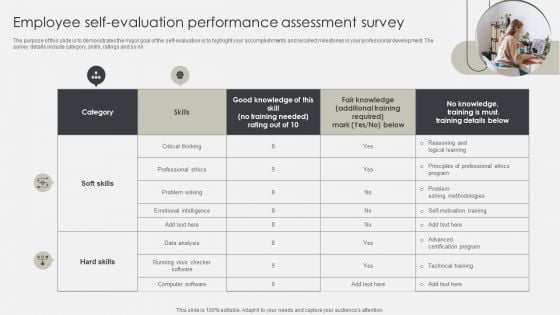
Employee Self Evaluation Performance Assessment Survey Clipart PDF
The purpose of this slide is to demonstrates the major goal of the self evaluation is to highlight your accomplishments and recollect milestones in your professional development. The survey details include category, skills, ratings and so on. Showcasing this set of slides titled Employee Self Evaluation Performance Assessment Survey Clipart PDF. The topics addressed in these templates are Data Analysis, Methodologies, Technical Training. All the content presented in this PPT design is completely editable. Download it and make adjustments in color, background, font etc. as per your unique business setting.
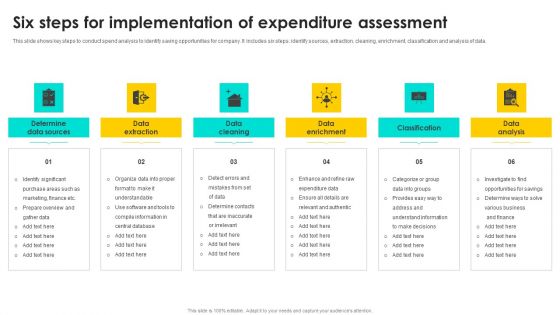
Six Steps For Implementation Of Expenditure Assessment Structure PDF
This slide shows key steps to conduct spend analysis to identify saving opportunities for company. It includes six steps identify sources, extraction, cleaning, enrichment, classification and analysis of data. Persuade your audience using this Six Steps For Implementation Of Expenditure Assessment Structure PDF. This PPT design covers Six stages, thus making it a great tool to use. It also caters to a variety of topics including Determine Data Sources, Data Extraction, Data Cleaning. Download this PPT design now to present a convincing pitch that not only emphasizes the topic but also showcases your presentation skills.
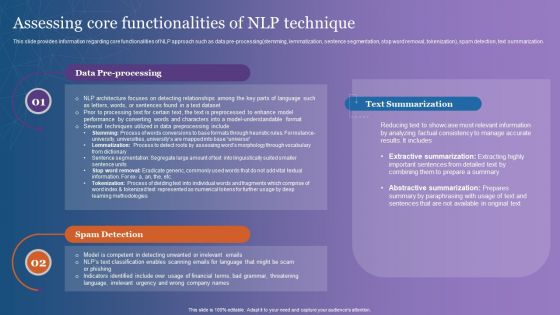
Assessing Core Functionalities Of NLP Technique Background PDF
This slide provides information regarding core functionalities of NLP approach such as data pre-processing stemming, lemmatization, sentence segmentation, stop word removal, tokenization, spam detection, text summarization. The best PPT templates are a great way to save time, energy, and resources. Slidegeeks have 100 percent editable powerpoint slides making them incredibly versatile. With these quality presentation templates, you can create a captivating and memorable presentation by combining visually appealing slides and effectively communicating your message. Download Assessing Core Functionalities Of NLP Technique Background PDF from Slidegeeks and deliver a wonderful presentation.
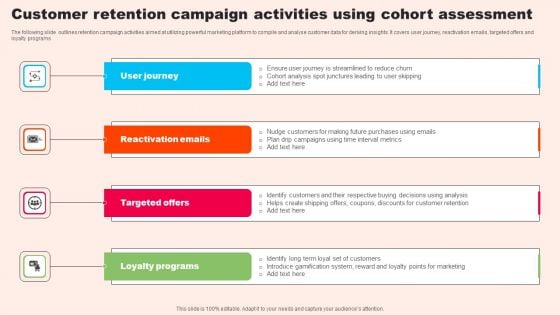
Customer Retention Campaign Activities Using Cohort Assessment Slides PDF
The following slide outlines retention campaign activities aimed at utilizing powerful marketing platform to compile and analyse customer data for deriving insights. It covers user journey, reactivation emails, targeted offers and loyalty programs. Presenting Customer Retention Campaign Activities Using Cohort Assessment Slides PDF to dispense important information. This template comprises four stages. It also presents valuable insights into the topics including Reactivation Emails, Targeted Offers, Loyalty Programs. This is a completely customizable PowerPoint theme that can be put to use immediately. So, download it and address the topic impactfully.
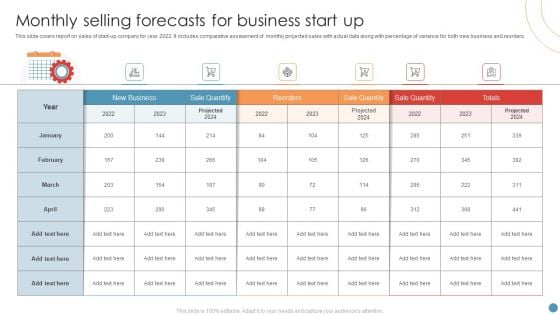
Monthly Selling Forecasts For Business Start Up Pictures PDF
This slide covers report on sales of start up company for year 2022. It includes comparative assessment of monthly projected sales with actual data along with percentage of variance for both new business and reorders. Showcasing this set of slides titled Monthly Selling Forecasts For Business Start Up Pictures PDF. The topics addressed in these templates are Sale Quantify, Business. All the content presented in this PPT design is completely editable. Download it and make adjustments in color, background, font etc. as per your unique business setting.
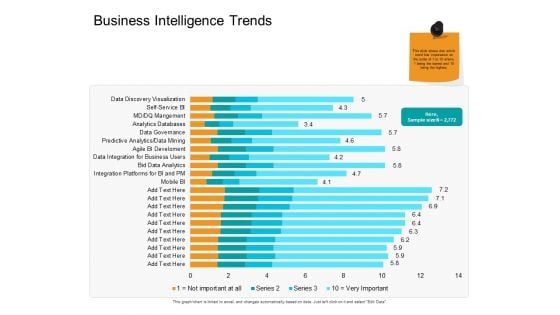
Facts Assessment Business Intelligence Trends Ppt PowerPoint Presentation Infographics Examples PDF
Presenting this set of slides with name facts assessment business intelligence trends ppt powerpoint presentation infographics examples pdf. The topics discussed in these slides are mobile bi, integration platforms bi and pm, bid data analytics, data integration for business users, agile bi development, predictive analytics, data mining, data governance, analytics databases. This is a completely editable PowerPoint presentation and is available for immediate download. Download now and impress your audience.
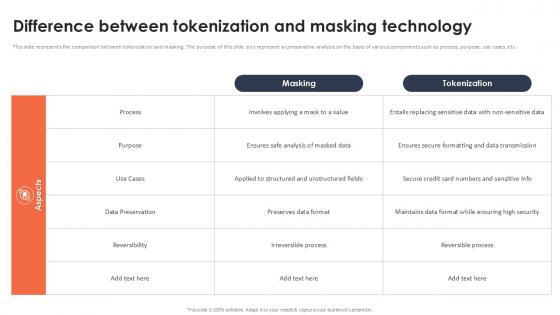
Difference Between Tokenization And Masking Technology Securing Your Data Ppt Powerpoint
This slide represents the comparison between tokenization and masking. The purpose of this slide is to represent a comparative analysis on the basis of various components such as process, purpose, use cases, etc. Are you in need of a template that can accommodate all of your creative concepts This one is crafted professionally and can be altered to fit any style. Use it with Google Slides or PowerPoint. Include striking photographs, symbols, depictions, and other visuals. Fill, move around, or remove text boxes as desired. Test out color palettes and font mixtures. Edit and save your work, or work with colleagues. Download Difference Between Tokenization And Masking Technology Securing Your Data Ppt Powerpoint and observe how to make your presentation outstanding. Give an impeccable presentation to your group and make your presentation unforgettable. This slide represents the comparison between tokenization and masking. The purpose of this slide is to represent a comparative analysis on the basis of various components such as process, purpose, use cases, etc.
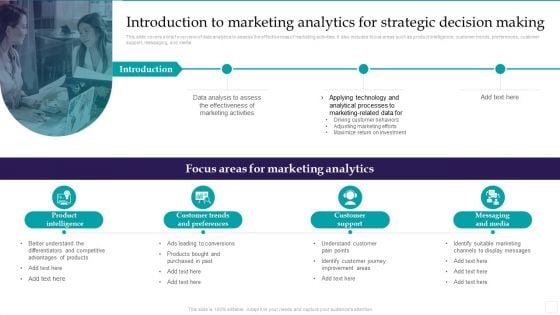
Introduction To Marketing Analytics For Strategic Decision Making Ideas PDF
This slide covers a brief overview of data analytics to assess the effectiveness of marketing activities. It also includes focus areas such as product intelligence, customer trends, preferences, customer support, messaging, and media. Do you have to make sure that everyone on your team knows about any specific topic I yes, then you should give Introduction To Marketing Analytics For Strategic Decision Making Ideas PDF a try. Our experts have put a lot of knowledge and effort into creating this impeccable Introduction To Marketing Analytics For Strategic Decision Making Ideas PDF. You can use this template for your upcoming presentations, as the slides are perfect to represent even the tiniest detail. You can download these templates from the Slidegeeks website and these are easy to edit. So grab these today.
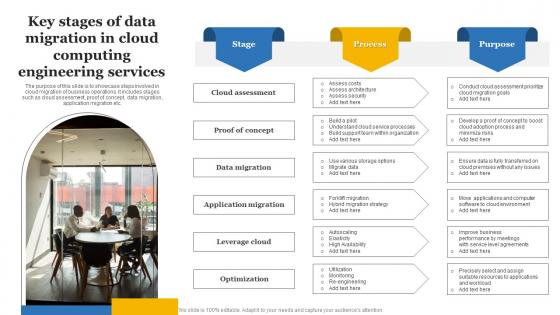
Key Stages Of Data Migration In Cloud Computing Engineering Services Summary Pdf
The purpose of this slide is to showcase steps involved in cloud migration of business operations. It includes stages such as cloud assessment, proof of concept, data migration, application migration etc. Showcasing this set of slides titled Key Stages Of Data Migration In Cloud Computing Engineering Services Summary Pdf The topics addressed in these templates are Cloud Assessment, Proof Of Concept, Data Migration All the content presented in this PPT design is completely editable. Download it and make adjustments in color, background, font etc. as per your unique business setting. The purpose of this slide is to showcase steps involved in cloud migration of business operations. It includes stages such as cloud assessment, proof of concept, data migration, application migration etc.
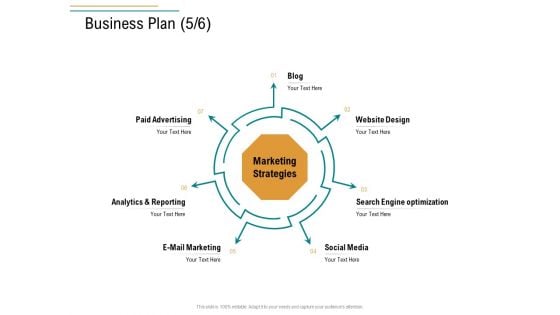
Business Operations Assessment Business Plan Advertising Ppt Ideas Graphics PDF
Presenting business operations assessment business plan advertising ppt ideas graphics pdf to provide visual cues and insights. Share and navigate important information on seven stages that need your due attention. This template can be used to pitch topics like paid advertising, analytics and reporting, e mail marketing, social media, search engine optimization, website design, blog. In addition, this PPT design contains high-resolution images, graphics, etc, that are easily editable and available for immediate download.

Statistical Technique And Tools Lean Six Sigma In Manufacturing Ppt Template
This slide shows main tools that are used in analysing phase for checking reliability of data. It include tools such as hypothesis testing, regression analysis and analysis of variance, etc. Are you in need of a template that can accommodate all of your creative concepts This one is crafted professionally and can be altered to fit any style. Use it with Google Slides or PowerPoint. Include striking photographs, symbols, depictions, and other visuals. Fill, move around, or remove text boxes as desired. Test out color palettes and font mixtures. Edit and save your work, or work with colleagues. Download Statistical Technique And Tools Lean Six Sigma In Manufacturing Ppt Template and observe how to make your presentation outstanding. Give an impeccable presentation to your group and make your presentation unforgettable. This slide shows main tools that are used in analysing phase for checking reliability of data. It include tools such as hypothesis testing, regression analysis and analysis of variance, etc.
Incident Assessment Report Icon For Automotive Sector Formats PDF
Persuade your audience using this incident assessment report icon for automotive sector formats pdf. This PPT design covers three stages, thus making it a great tool to use. It also caters to a variety of topics including incident assessment report icon for automotive sector. Download this PPT design now to present a convincing pitch that not only emphasizes the topic but also showcases your presentation skills.

Auto Industry Trends Increasing Online Car Buying Market Global Automotive Manufacturing Market Analysis Formats PDF
This slide covers a graphical representation of worldwide online vehicle sales. It also includes key insights about projected market reach and CAGR by 2030, major identified players in the online car buying market, etc. Are you in need of a template that can accommodate all of your creative concepts This one is crafted professionally and can be altered to fit any style. Use it with Google Slides or PowerPoint. Include striking photographs, symbols, depictions, and other visuals. Fill, move around, or remove text boxes as desired. Test out color palettes and font mixtures. Edit and save your work, or work with colleagues. Download Auto Industry Trends Increasing Online Car Buying Market Global Automotive Manufacturing Market Analysis Formats PDF and observe how to make your presentation outstanding. Give an impeccable presentation to your group and make your presentation unforgettable.


 Continue with Email

 Home
Home


