Change Management Dashboard
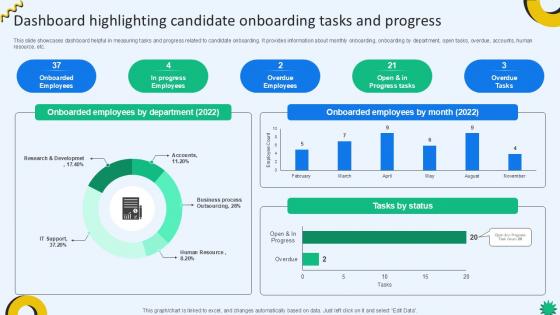
Dashboard Highlighting Candidate Cloud Recruiting Technologies PPT Sample
This slide showcases dashboard helpful in measuring tasks and progress related to candidate onboarding. It provides information about monthly onboarding, onboarding by department, open tasks, overdue, accounts, human resource, etc. Present like a pro with Dashboard Highlighting Candidate Cloud Recruiting Technologies PPT Sample. Create beautiful presentations together with your team, using our easy-to-use presentation slides. Share your ideas in real-time and make changes on the fly by downloading our templates. So whether you are in the office, on the go, or in a remote location, you can stay in sync with your team and present your ideas with confidence. With Slidegeeks presentation got a whole lot easier. Grab these presentations today. This slide showcases dashboard helpful in measuring tasks and progress related to candidate onboarding. It provides information about monthly onboarding, onboarding by department, open tasks, overdue, accounts, human resource, etc.
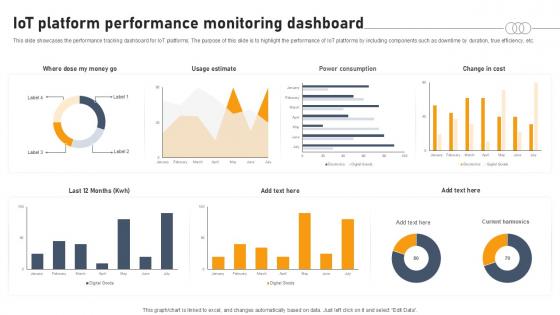
IOT Platform Performance Monitoring Dashboard Aws IOT Platform Ppt Example
This slide showcases the performance tracking dashboard for IoT platforms. The purpose of this slide is to highlight the performance of IoT platforms by including components such as downtime by duration, true efficiency, etc. Present like a pro with IOT Platform Performance Monitoring Dashboard Aws IOT Platform Ppt Example Create beautiful presentations together with your team, using our easy-to-use presentation slides. Share your ideas in real-time and make changes on the fly by downloading our templates. So whether you are in the office, on the go, or in a remote location, you can stay in sync with your team and present your ideas with confidence. With Slidegeeks presentation got a whole lot easier. Grab these presentations today. This slide showcases the performance tracking dashboard for IoT platforms. The purpose of this slide is to highlight the performance of IoT platforms by including components such as downtime by duration, true efficiency, etc.
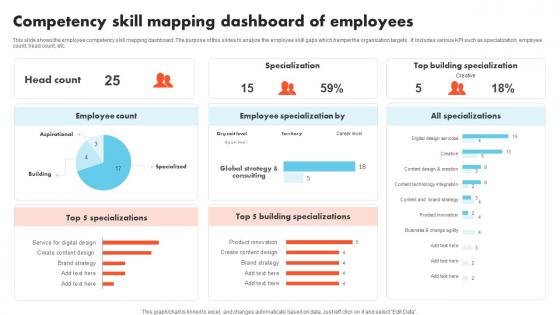
Competency Skill Mapping Dashboard Of Employees Formats Pdf
This slide shows the employee competency skill mapping dashboard .The purpose of this slides to analyze the employee skill gaps which hamper the organization targets .It includes various KPI such as specialization, employee count, head count, etc. Pitch your topic with ease and precision using this Competency Skill Mapping Dashboard Of Employees Formats Pdf This layout presents information on Employee Specialization, Building Specializations, Specialization It is also available for immediate download and adjustment. So, changes can be made in the color, design, graphics or any other component to create a unique layout. This slide shows the employee competency skill mapping dashboard .The purpose of this slides to analyze the employee skill gaps which hamper the organization targets .It includes various KPI such as specialization, employee count, head count, etc.
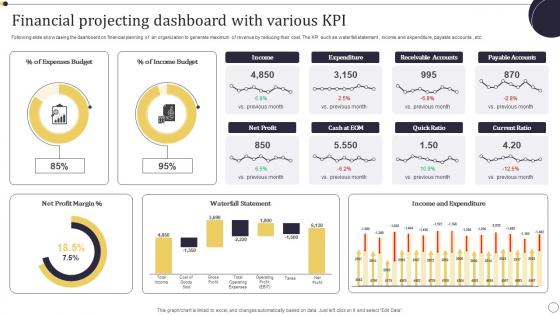
Financial Projecting Dashboard With Various KPI Themes Pdf
Following slide showcasing the dashboard on financial planning of an organization to generate maximum of revenue by reducing their cost. The KPI such as waterfall statement , income and expenditure, payable accounts , etc . Pitch your topic with ease and precision using this Financial Projecting Dashboard With Various KPI Themes Pdf. This layout presents information on Income Budget, Expenses Budget, Net Profit Margin. It is also available for immediate download and adjustment. So, changes can be made in the color, design, graphics or any other component to create a unique layout. Following slide showcasing the dashboard on financial planning of an organization to generate maximum of revenue by reducing their cost. The KPI such as waterfall statement , income and expenditure, payable accounts , etc .
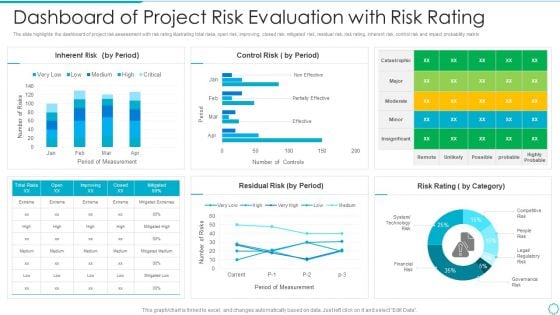
Dashboard Of Project Risk Evaluation With Risk Rating Pictures PDF
The slide highlights the dashboard of project risk assessment with risk rating illustrating total risks, open risk, improving, closed risk, mitigated risk, residual risk, risk rating, inherent risk, control risk and impact probability matrixPitch your topic with ease and precision using this dashboard of project risk evaluation with risk rating pictures pdf This layout presents information on dashboard of project risk evaluation with risk rating It is also available for immediate download and adjustment. So, changes can be made in the color, design, graphics or any other component to create a unique layout.
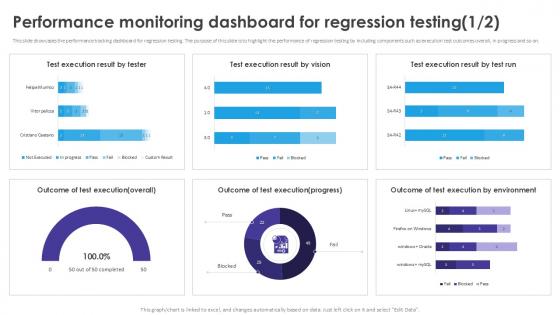
Performance Monitoring Dashboard Automated Regression Testing And Achieving PPT Example
This slide showcases the performance tracking dashboard for regression testing. The purpose of this slide is to highlight the performance of regression testing by including components such as execution test outcomes overall, in progress and so on. If your project calls for a presentation, then Slidegeeks is your go-to partner because we have professionally designed, easy-to-edit templates that are perfect for any presentation. After downloading, you can easily edit Performance Monitoring Dashboard Automated Regression Testing And Achieving PPT Example and make the changes accordingly. You can rearrange slides or fill them with different images. Check out all the handy templates This slide showcases the performance tracking dashboard for regression testing. The purpose of this slide is to highlight the performance of regression testing by including components such as execution test outcomes overall, in progress and so on.
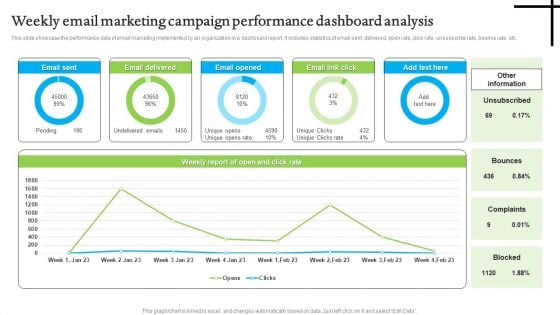
Weekly Email Marketing Campaign Performance Dashboard Analysis Structure PDF
This slide showcase the performance data of email marketing implemented by an organization in a dashboard report. It includes statistics of email sent, delivered, open rate, click rate, unsubscribe rate, bounce rate, etc. Pitch your topic with ease and precision using this Weekly Email Marketing Campaign Performance Dashboard Analysis Structure PDF. This layout presents information on Weekly Email Marketing, Campaign Performance Dashboard Analysis. It is also available for immediate download and adjustment. So, changes can be made in the color, design, graphics or any other component to create a unique layout.
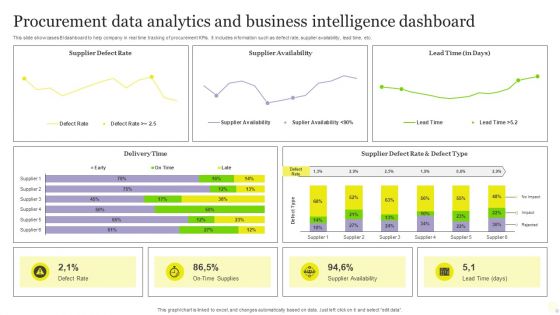
Procurement Data Analytics And Business Intelligence Dashboard Pictures PDF
This slide showcases BI dashboard to help company in real time tracking of procurement KPIs. It includes information such as defect rate, supplier availability, lead time, etc. Pitch your topic with ease and precision using this Procurement Data Analytics And Business Intelligence Dashboard Pictures PDF. This layout presents information on Procurement Data Analytics, Business Intelligence Dashboard. It is also available for immediate download and adjustment. So, changes can be made in the color, design, graphics or any other component to create a unique layout.
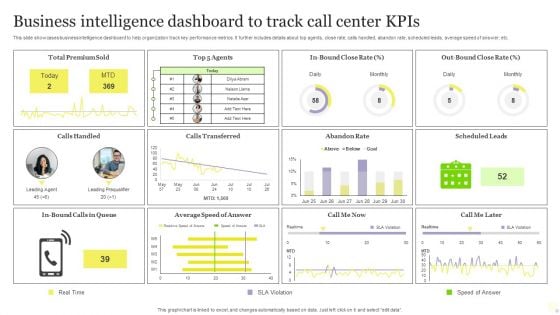
Business Intelligence Dashboard To Track Call Center Kpis Download PDF
This slide showcases business intelligence dashboard to help organization track key performance metrics. It further includes details about top agents, close rate, calls handled, abandon rate, scheduled leads, average speed of answer, etc. Pitch your topic with ease and precision using this Business Intelligence Dashboard To Track Call Center Kpis Download PDF. This layout presents information on Business Intelligence Dashboard, Track Call Center Kpis. It is also available for immediate download and adjustment. So, changes can be made in the color, design, graphics or any other component to create a unique layout.
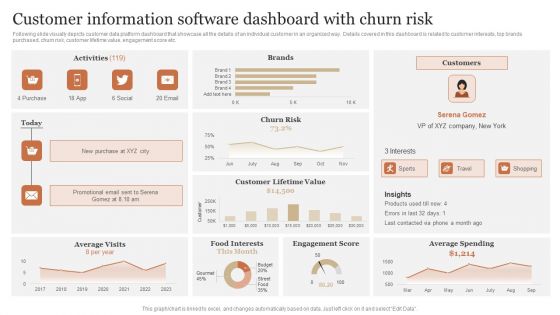
Customer Information Software Dashboard With Churn Risk Information PDF
Following slide visually depicts customer data platform dashboard that showcase all the details of an individual customer in an organized way. Details covered in this dashboard is related to customer interests, top brands purchased, churn risk, customer lifetime value, engagement score etc. Pitch your topic with ease and precision using this Customer Information Software Dashboard With Churn Risk Information PDF. This layout presents information on Customer Lifetime, Engagement Score, Average Spending. It is also available for immediate download and adjustment. So, changes can be made in the color, design, graphics or any other component to create a unique layout.
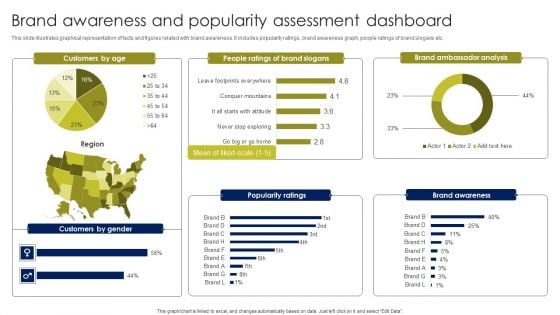
Brand Awareness And Popularity Assessment Dashboard Topics PDF
This slide illustrates graphical representation of facts and figures related with brand awareness. It includes popularity ratings, brand awareness graph, people ratings of brand slogans etc. Pitch your topic with ease and precision using thisBrand Awareness And Popularity Assessment Dashboard Topics PDF. This layout presents information on Customers By Age, Brand Ambassador Analysis, Brand Awareness. It is also available for immediate download and adjustment. So, changes can be made in the color, design, graphics or any other component to create a unique layout.
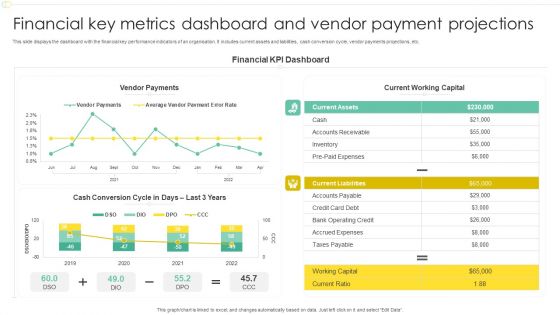
Financial Key Metrics Dashboard And Vendor Payment Projections Professional PDF
This slide displays the dashboard with the financial key performance indicators of an organisation. It includes current assets and liabilities, cash conversion cycle, vendor payments projections, etc. Pitch your topic with ease and precision using this Financial Key Metrics Dashboard And Vendor Payment Projections Professional PDF. This layout presents information on Financial KPI Dashboard, Current Working Capital, Vendor Payments. It is also available for immediate download and adjustment. So, changes can be made in the color, design, graphics or any other component to create a unique layout.
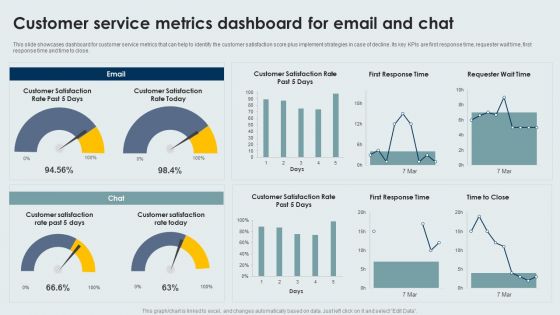
Customer Service Metrics Dashboard For Email And Chat Infographics PDF
This slide showcases dashboard for customer service metrics that can help to identify the customer satisfaction score plus implement strategies in case of decline. Its key KPIs are first response time, requester wait time, first response time and time to close. Pitch your topic with ease and precision using this Customer Service Metrics Dashboard For Email And Chat Infographics PDF. This layout presents information on Customer Service, Metrics Dashboard, Email And Chat. It is also available for immediate download and adjustment. So, changes can be made in the color, design, graphics or any other component to create a unique layout.
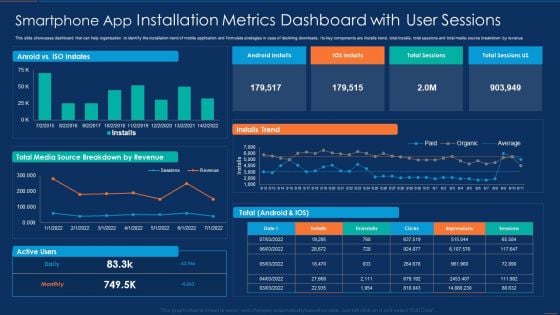
Smartphone App Installation Metrics Dashboard With User Sessions Microsoft PDF
This slide showcases dashboard that can help organization to identify the installation trend of mobile application and formulate strategies in case of declining downloads. Its key components are installs trend, total installs, total sessions and total media source breakdown by revenue. Pitch your topic with ease and precision using this Smartphone App Installation Metrics Dashboard With User Sessions Microsoft PDF. This layout presents information on Smartphone App Installation Metrics Dashboard With User Sessions. It is also available for immediate download and adjustment. So, changes can be made in the color, design, graphics or any other component to create a unique layout.
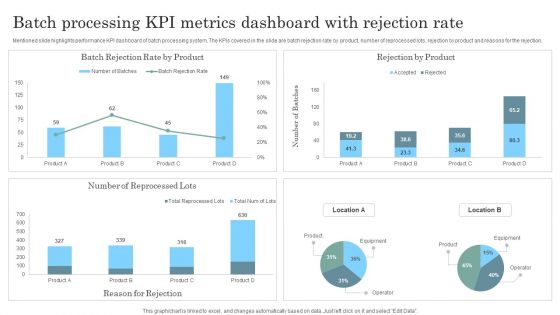
Batch Processing KPI Metrics Dashboard With Rejection Rate Topics PDF
Mentioned slide highlights performance KPI dashboard of batch processing system. The KPIs covered in the slide are batch rejection rate by product, number of reprocessed lots, rejection by product and reasons for the rejection. Pitch your topic with ease and precision using this Batch Processing KPI Metrics Dashboard With Rejection Rate Topics PDF. This layout presents information on Batch Processing KPI Metrics, Dashboard Rejection Rate. It is also available for immediate download and adjustment. So, changes can be made in the color, design, graphics or any other component to create a unique layout.
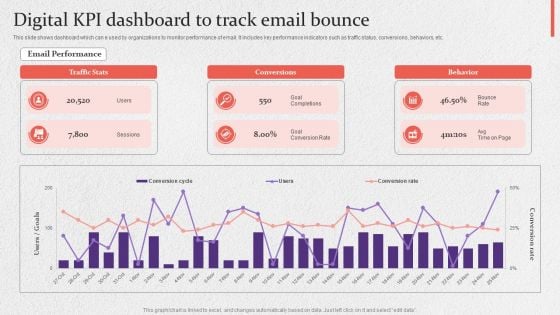
Digital KPI Dashboard To Track Email Bounce Slides PDF
This slide shows dashboard which can e used by organizations to monitor performance of email. It includes key performance indicators such as traffic status, conversions, behaviors, etc. Pitch your topic with ease and precision using this Digital KPI Dashboard To Track Email Bounce Slides PDF. This layout presents information on Digital Kpi Dashboard, Track Email Bounce. It is also available for immediate download and adjustment. So, changes can be made in the color, design, graphics or any other component to create a unique layout.
Supplier Compensation Due Tracking Dashboard With Paid Invoices Topics PDF
This slide showcases dashboard that can help organization to track the outstanding payment of different vendors and take timely action in case of delay. Its key elements are due by age summary, top 5 vendor by purchases, top 5 vendors by amount due and total invoice vs paid invoices. Pitch your topic with ease and precision using this supplier compensation due tracking dashboard with paid invoices topics pdf. This layout presents information on supplier compensation due tracking dashboard with paid invoices. It is also available for immediate download and adjustment. So, changes can be made in the color, design, graphics or any other component to create a unique layout.

Supplier Performance Dashboard With Compensation Status Themes PDF
This slide showcases payment performance dashboard that can help organization to analyze the outstanding amount by different vendors and impose necessary restrictions in case of any delay. Its key components are amount paid early, total money paid, paid on time and paid late. Pitch your topic with ease and precision using this supplier performance dashboard with compensation status themes pdf. This layout presents information on supplier performance dashboard with compensation status. It is also available for immediate download and adjustment. So, changes can be made in the color, design, graphics or any other component to create a unique layout.
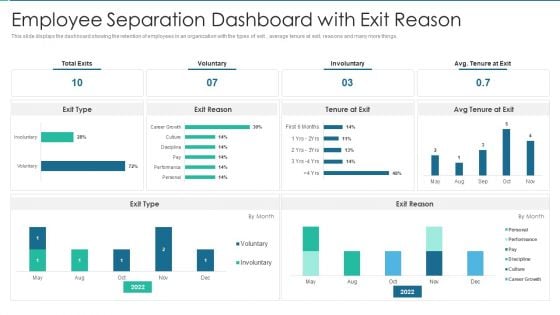
Employee Separation Dashboard With Exit Reason Rules PDF
This slide displays the dashboard showing the retention of employees in an organization with the types of exit , average tenure at exit, reasons and many more things. Pitch your topic with ease and precision using this Employee Separation Dashboard With Exit Reason Rules PDF This layout presents information on Employee Separation Dashboard With Exit Reason It is also available for immediate download and adjustment. So, changes can be made in the color, design, graphics or any other component to create a unique layout.
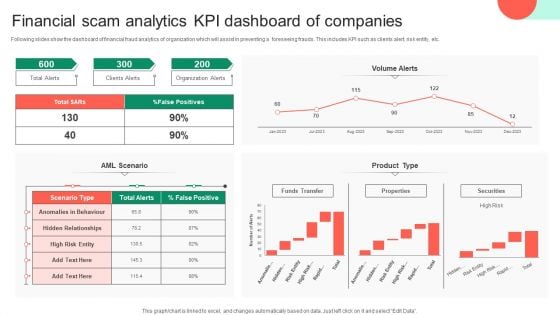
Financial Scam Analytics KPI Dashboard Of Companies Clipart PDF
Following slides show the dashboard of financial fraud analytics of organization which will assist in preventing a foreseeing frauds. This includes KPI such as clients alert, risk entity, etc. Pitch your topic with ease and precision using this Financial Scam Analytics KPI Dashboard Of Companies Clipart PDF. This layout presents information on Financial Scam Analytics, Kpi Dashboard Of Companies. It is also available for immediate download and adjustment. So, changes can be made in the color, design, graphics or any other component to create a unique layout.
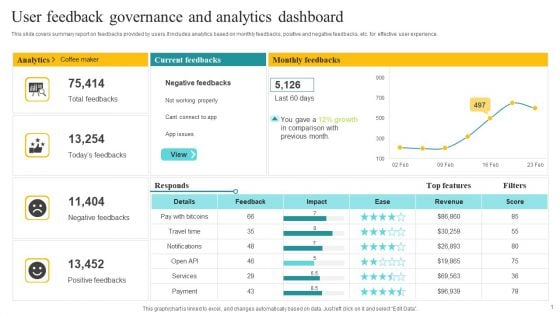
User Feedback Governance And Analytics Dashboard Ppt Professional Rules PDF
This slide covers summary report on feedbacks provided by users.It includes analytics based on monthly feedbacks, positive and negative feedbacks, etc. for effective user experience. Pitch your topic with ease and precision using this User Feedback Governance And Analytics Dashboard Ppt Professional Rules PDF. This layout presents information on Current Feedbacks, Monthly Feedbacks, Analytics. It is also available for immediate download and adjustment. So, changes can be made in the color, design, graphics or any other component to create a unique layout.

Team Mentoring Dashboard With Client And Training Details Sample PDF
This slide covers all the information related to the clients to whom coaching has been provided and in certain number of hours how many sessions they attended. It also includes the total earnings , coaching hours and the name of top clients.Pitch your topic with ease and precision using this Team Mentoring Dashboard With Client And Training Details Sample PDF This layout presents information on Team Mentoring Dashboard With Client And Training Details It is also available for immediate download and adjustment. So, changes can be made in the color, design, graphics or any other component to create a unique layout.
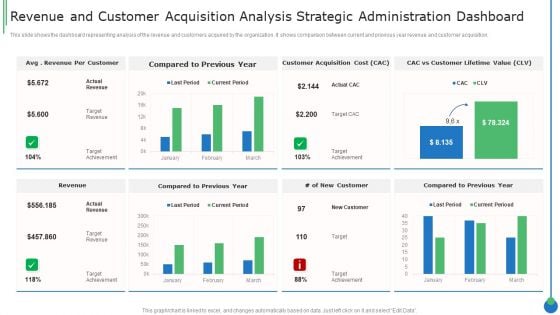
Revenue And Customer Acquisition Analysis Strategic Administration Dashboard Clipart PDF
This slide shows the dashboard representing analysis of the revenue and customers acquired by the organization. It shows comparison between current and previous year revenue and customer acquisition.Pitch your topic with ease and precision using this Revenue And Customer Acquisition Analysis Strategic Administration Dashboard Clipart PDF This layout presents information on Revenue Customer, Compared Previous, Customer Acquisition It is also available for immediate download and adjustment. So, changes can be made in the color, design, graphics or any other component to create a unique layout.
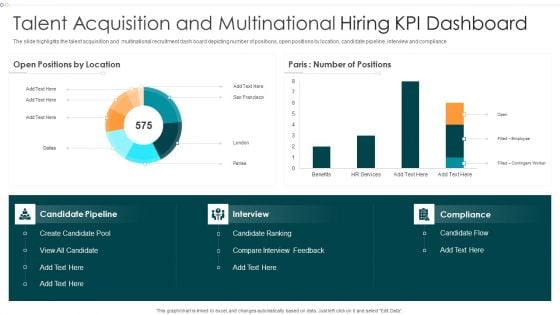
Talent Acquisition And Multinational Hiring KPI Dashboard Mockup PDF
The slide highlights the talent acquisition and multinational recruitment dash board depicting number of positions, open positions by location, candidate pipeline, interview and compliance.Pitch your topic with ease and precision using this Talent Acquisition And Multinational Hiring KPI Dashboard Mockup PDF This layout presents information on Candidate Ranking, Positions, Contingent It is also available for immediate download and adjustment. So, changes can be made in the color, design, graphics or any other component to create a unique layout.
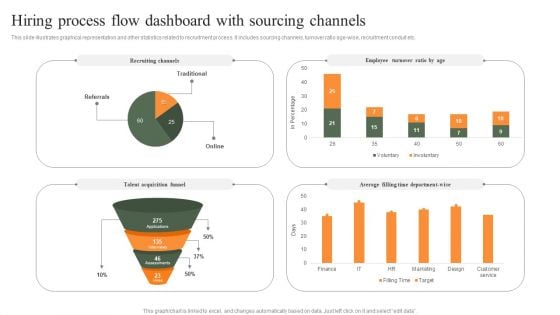
Hiring Process Flow Dashboard With Sourcing Channels Professional PDF
This slide illustrates graphical representation and other statistics related to recruitment process. It includes sourcing channels, turnover ratio age-wise, recruitment conduit etc. Pitch your topic with ease and precision using this Hiring Process Flow Dashboard With Sourcing Channels Professional PDF. This layout presents information on Employee Turnover Ratio, Recruiting Channels, Average. It is also available for immediate download and adjustment. So, changes can be made in the color, design, graphics or any other component to create a unique layout.
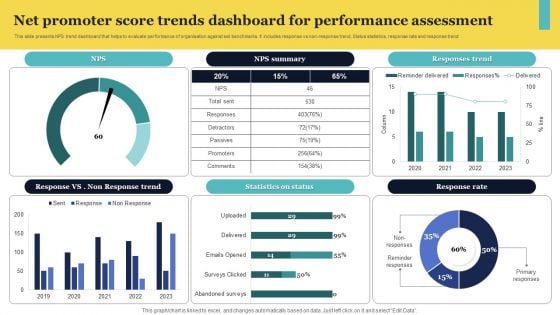
Net Promoter Score Trends Dashboard For Performance Assessment Elements PDF
This slide presents NPS trend dashboard that helps to evaluate performance of organisation against set benchmarks. It includes response vs non-response trend, Status statistics, response rate and response trend Pitch your topic with ease and precision using this Net Promoter Score Trends Dashboard For Performance Assessment Elements PDF. This layout presents information on Response Trend, Summary, Status. It is also available for immediate download and adjustment. So, changes can be made in the color, design, graphics or any other component to create a unique layout.
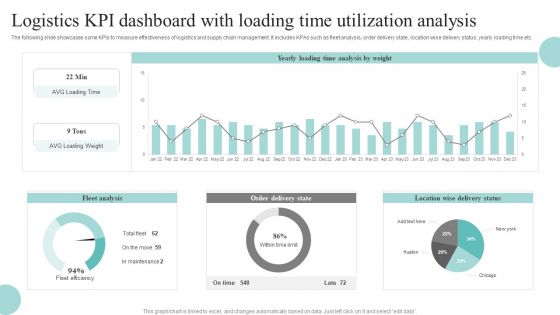
Logistics KPI Dashboard With Loading Time Utilization Analysis Download PDF
The following slide showcases some KPIs to measure effectiveness of logistics and supply chain management. It includes KPAs such as fleet analysis, order delivery state, location wise delivery status, yearly loading time etc. Pitch your topic with ease and precision using this Logistics KPI Dashboard With Loading Time Utilization Analysis Download PDF. This layout presents information on Fleet Analysis, Order Delivery State, Location Wise Delivery Status. It is also available for immediate download and adjustment. So, changes can be made in the color, design, graphics or any other component to create a unique layout.
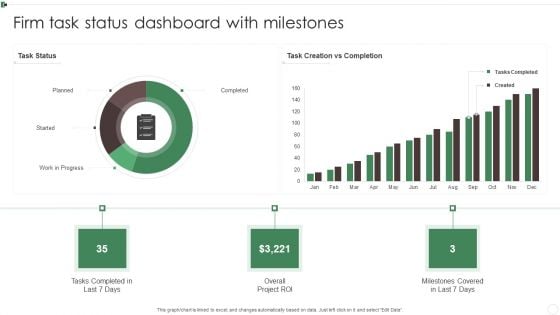
Firm Task Status Dashboard With Milestones Ppt Show Sample PDF
This graph or chart is linked to excel, and changes automatically based on data. Just left click on it and select Edit Data. Showcasing this set of slides titled Firm Task Status Dashboard With Milestones Ppt Show Sample PDF. The topics addressed in these templates are Tasks Completed, Planned, Work Progress, Overall Project ROI. All the content presented in this PPT design is completely editable. Download it and make adjustments in color, background, font etc. as per your unique business setting.
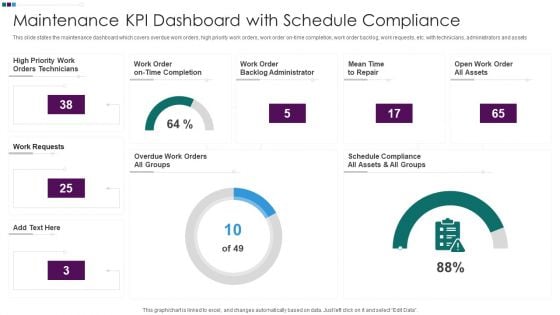
Maintenance KPI Dashboard With Schedule Compliance Ppt Styles Demonstration PDF
This slide states the maintenance dashboard which covers overdue work orders, high priority work orders, work order on-time completion, work order backlog, work requests, etc. with technicians, administrators and assets. Pitch your topic with ease and precision using this Maintenance KPI Dashboard With Schedule Compliance Ppt Styles Demonstration PDF. This layout presents information on High Priority Work, Work Order Backlog, Mean Time Repair, Open Work Order. It is also available for immediate download and adjustment. So, changes can be made in the color, design, graphics or any other component to create a unique layout.
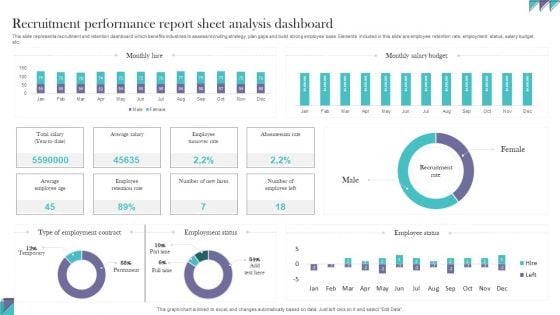
Recruitment Performance Report Sheet Analysis Dashboard Information PDF
This slide represents recruitment and retention dashboard which benefits industries to assess recruiting strategy, plan gaps and build strong employee base. Elements included in this slide are employee retention rate, employment status, salary budget, etc. Pitch your topic with ease and precision using this Recruitment Performance Report Sheet Analysis Dashboard Information PDF. This layout presents information onRecruitment Performance, Report Sheet Analysis. It is also available for immediate download and adjustment. So, changes can be made in the color, design, graphics or any other component to create a unique layout.
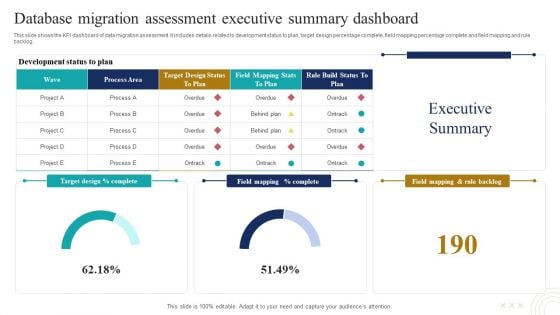
Database Migration Assessment Executive Summary Dashboard Mockup PDF
This slide shows the KPI dashboard of data migration assessment. It includes details related to development status to plan, target design percentage complete, field mapping percentage complete and field mapping and rule backlog. Pitch your topic with ease and precision using this Database Migration Assessment Executive Summary Dashboard Mockup PDF. This layout presents information on Wave, Process Area, Rule Build Status Plan. It is also available for immediate download and adjustment. So, changes can be made in the color, design, graphics or any other component to create a unique layout
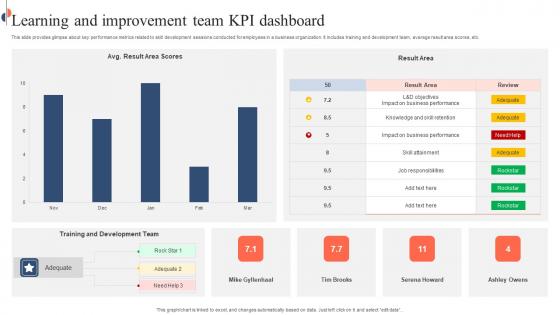
Learning And Improvement Team KPI Dashboard Slides Pdf
This slide provides glimpse about key performance metrics related to skill development sessions conducted for employees in a business organization. It includes training and development team, average result area scores, etc. Pitch your topic with ease and precision using this Learning And Improvement Team KPI Dashboard Slides Pdf. This layout presents information on Learning And Improvement Team, KPI Dashboard, Development Team. It is also available for immediate download and adjustment. So, changes can be made in the color, design, graphics or any other component to create a unique layout. This slide provides glimpse about key performance metrics related to skill development sessions conducted for employees in a business organization. It includes training and development team, average result area scores, etc.
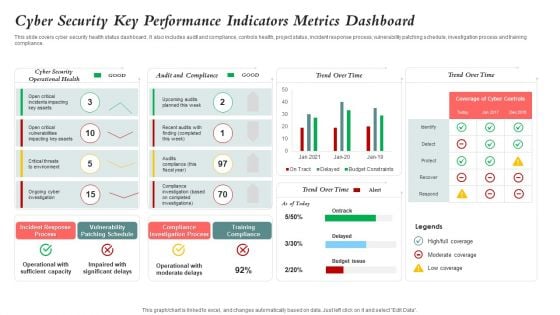
Cyber Security Key Performance Indicators Metrics Dashboard Mockup PDF
This slide covers cyber security health status dashboard . It also includes audit and compliance, controls health, project status, incident response process, vulnerability patching schedule, investigation process and training compliance. Pitch your topic with ease and precision using this Cyber Security Key Performance Indicators Metrics Dashboard Mockup PDF. This layout presents information on Cyber Security, Vulnerability Patching Schedule, Compliance Investigation Process. It is also available for immediate download and adjustment. So, changes can be made in the color, design, graphics or any other component to create a unique layout.
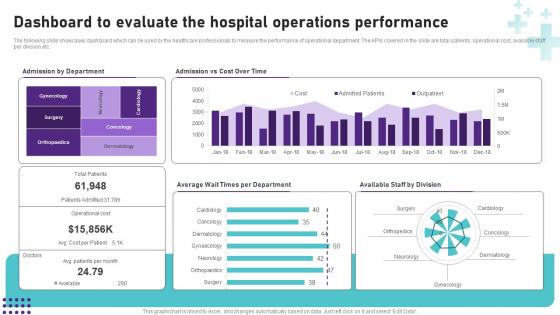
Dashboard To Evaluate The Hospital Operational Areas Healthcare Professional PDF
Present like a pro with Dashboard To Evaluate The Hospital Operational Areas Healthcare Professional PDF Create beautiful presentations together with your team, using our easy-to-use presentation slides. Share your ideas in real-time and make changes on the fly by downloading our templates. So whether you are in the office, on the go, or in a remote location, you can stay in sync with your team and present your ideas with confidence. With Slidegeeks presentation got a whole lot easier. Grab these presentations today. The following slide showcases dashboard which can be used by the healthcare professionals to measure the performance of operational department. The KPIs covered in the slide are total patients, operational cost, available staff per division etc.
Dashboard For Tracking Leadership Growth And Development Program Ideas PDF
This slide exhibits a dashboard for tracking the development of leadership programs for team growth. It covers executive training programs, supervisor competency heatmap, leadership training, etc. Pitch your topic with ease and precision using this dashboard for tracking leadership growth and development program ideas pdf This layout presents information on executive training program, leadership training, completion v or s success It is also available for immediate download and adjustment. So, changes can be made in the color, design, graphics or any other component to create a unique layout.
Dashboard For Tracking Leadership Growth And Development Program Topics PDF
This slide exhibits a dashboard for tracking the development of leadership programs for team growth. It covers executive training programs, supervisor competency heatmap, leadership training, etc. Pitch your topic with ease and precision using this dashboard for tracking leadership growth and development program topics pdf This layout presents information on executive training program, leadership training, completion v or s success It is also available for immediate download and adjustment. So, changes can be made in the color, design, graphics or any other component to create a unique layout.
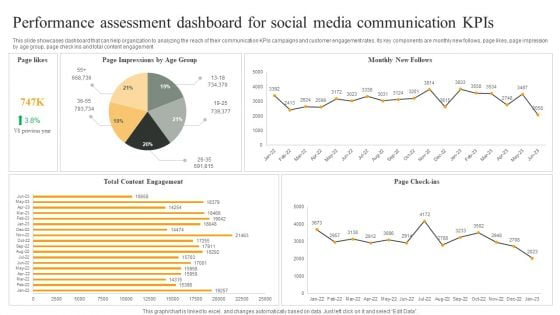
Performance Assessment Dashboard For Social Media Communication Kpis Graphics PDF
This slide showcases dashboard that can help organization to analyzing the reach of their communication KPIs campaigns and customer engagement rates. Its key components are monthly new follows, page likes, page impression by age group, page check ins and total content engagement. Pitch your topic with ease and precision using this Performance Assessment Dashboard For Social Media Communication Kpis Graphics PDF. This layout presents information on Monthly New Follows, Page Check ins, Total Content Engagement. It is also available for immediate download and adjustment. So, changes can be made in the color, design, graphics or any other component to create a unique layout.
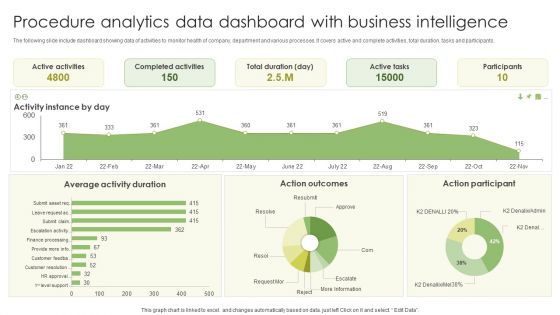
Procedure Analytics Data Dashboard With Business Intelligence Slides PDF
The following slide include dashboard showing data of activities to monitor health of company, department and various processes. It covers active and complete activities, total duration, tasks and participants. Pitch your topic with ease and precision using this Procedure Analytics Data Dashboard With Business Intelligence Slides PDF. This layout presents information on Active Activities, Completed Activities, Active Tasks . It is also available for immediate download and adjustment. So, changes can be made in the color, design, graphics or any other component to create a unique layout.
Leads Tracking Dashboard With Conversion Funnel Ideas PDF
This slide showcases dashboard that can help organization to identify the total number of customers acquired from the sales and marketing qualified lead. It also showcases financial KPIs that are cost per lead, cost per customer, customer lifetine value and return on marketing investment. Pitch your topic with ease and precision using this Leads Tracking Dashboard With Conversion Funnel Ideas PDF. This layout presents information on Audience, Prospects, Conversion Funnel. It is also available for immediate download and adjustment. So, changes can be made in the color, design, graphics or any other component to create a unique layout.
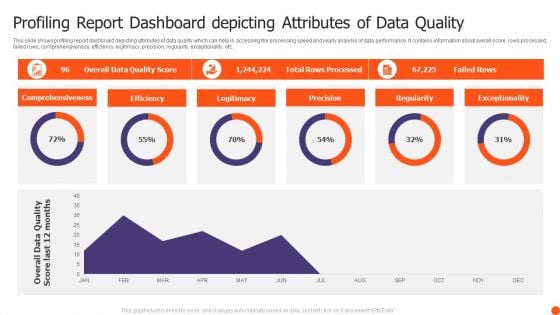
Profiling Report Dashboard Depicting Attributes Of Data Quality Themes PDF
This slide shows profiling report dashboard depicting attributes of data quality which can help in accessing the processing speed and yearly analysis of data performance. It contains information about overall score, rows processed, failed rows, comprehensiveness, efficiency, legitimacy, precision, regularity, exceptionality, etc. Pitch your topic with ease and precision using this Profiling Report Dashboard Depicting Attributes Of Data Quality Themes PDF. This layout presents information on Comprehensiveness, Efficiency, Legitimacy, Precision. It is also available for immediate download and adjustment. So, changes can be made in the color, design, graphics or any other component to create a unique layout.
Monthly Comparison Dashboard For Lead Tracking Sample PDF
This slide showcases dashboard that can help organization to compare the leads converted in different months and make changes in sales and marketing campaigns . Its key components lead generated by country, by industry type and lead sources by month. Showcasing this set of slides titled Monthly Comparison Dashboard For Lead Tracking Sample PDF. The topics addressed in these templates are Leads Received, Industry Type, Lead Generated. All the content presented in this PPT design is completely editable. Download it and make adjustments in color, background, font etc. as per your unique business setting.
Lead Tracking Dashboard With Metric Comparison Brochure PDF
This slide showcases dashboard of lead pipeline that can help to identify total number of leads generated and expenses incurred to acquire the audience. It also showcases other key performance metrics like lead breakdown by status and number of leads per month. Pitch your topic with ease and precision using this Lead Tracking Dashboard With Metric Comparison Brochure PDF. This layout presents information on Metric Comparison, Lead Pipeline, Lead Breakdown Status. It is also available for immediate download and adjustment. So, changes can be made in the color, design, graphics or any other component to create a unique layout.
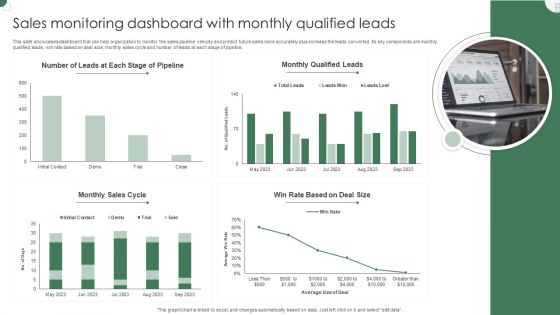
Sales Monitoring Dashboard With Monthly Qualified Leads Guidelines PDF
This slide showcases dashboard that can help organization to monitor the sales pipeline velocity and predict future sales more accurately plus increase the leads converted. Its key components are monthly qualified leads, win rate based on deal size, monthly sales cycle and number of leads at each stage of pipeline. Pitch your topic with ease and precision using this Sales Monitoring Dashboard With Monthly Qualified Leads Guidelines PDF. This layout presents information on Monthly Qualified, Monthly Sales Cycle, Deal Size. It is also available for immediate download and adjustment. So, changes can be made in the color, design, graphics or any other component to create a unique layout.
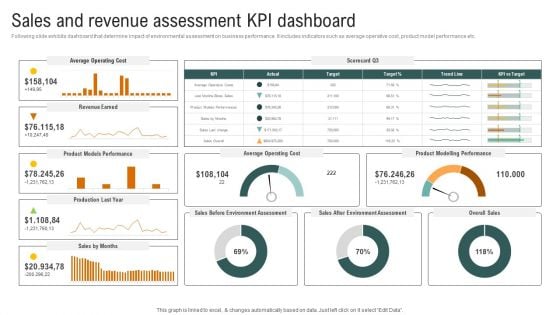
Sales And Revenue Assessment Kpi Dashboard Brochure PDF
Following slide exhibits dashboard that determine impact of environmental assessment on business performance. It includes indicators such as average operative cost, product model performance etc. If your project calls for a presentation, then Slidegeeks is your go-to partner because we have professionally designed, easy-to-edit templates that are perfect for any presentation. After downloading, you can easily edit Sales And Revenue Assessment Kpi Dashboard Brochure PDF and make the changes accordingly. You can rearrange slides or fill them with different images. Check out all the handy templates
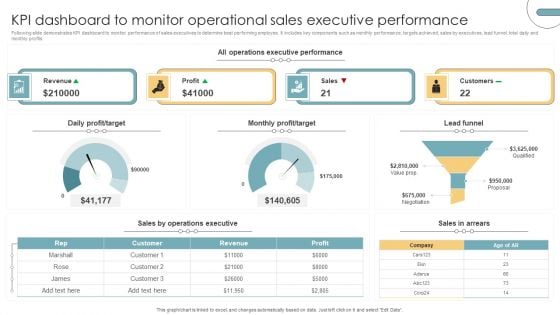
KPI Dashboard To Monitor Operational Sales Executive Performance Portrait PDF
Following slide demonstrates KPI dashboard to monitor performance of sales executives to determine best performing employee. It includes key components such as monthly performance, targets achieved, sales by executives, lead funnel, total daily and monthly profits. Pitch your topic with ease and precision using this KPI Dashboard To Monitor Operational Sales Executive Performance Portrait PDF. This layout presents information on Revenue, Profit, Sales, Customers. It is also available for immediate download and adjustment. So, changes can be made in the color, design, graphics or any other component to create a unique layout.
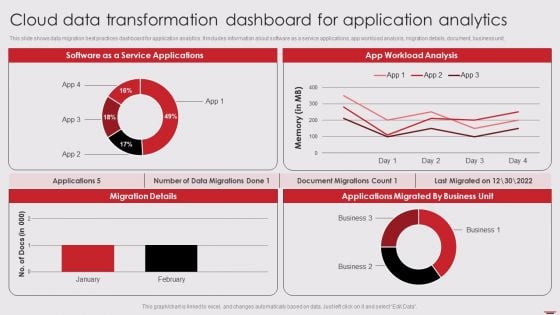
Cloud Data Transformation Dashboard For Application Analytics Information PDF
This slide shows data migration best practices dashboard for application analytics. It includes information about software as a service applications, app workload analysis, migration details, document, business unit. Pitch your topic with ease and precision using this Cloud Data Transformation Dashboard For Application Analytics Information PDF. This layout presents information on Software Service Applications, App Workload Analysis, Migration Details. It is also available for immediate download and adjustment. So, changes can be made in the color, design, graphics or any other component to create a unique layout.
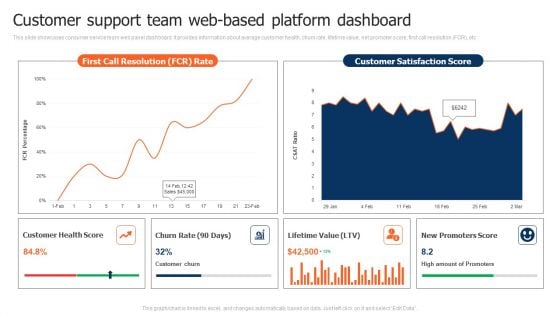
Customer Support Team Web Based Platform Dashboard Demonstration PDF
This slide showcases consumer service team web panel dashboard. It provides information about average customer health, churn rate, lifetime value, net promoter score, first call resolution FCR, etc. Pitch your topic with ease and precision using this Customer Support Team Web Based Platform Dashboard Demonstration PDF. This layout presents information on Churn Rate, Lifetime Value, Customer Health Score. It is also available for immediate download and adjustment. So, changes can be made in the color, design, graphics or any other component to create a unique layout.
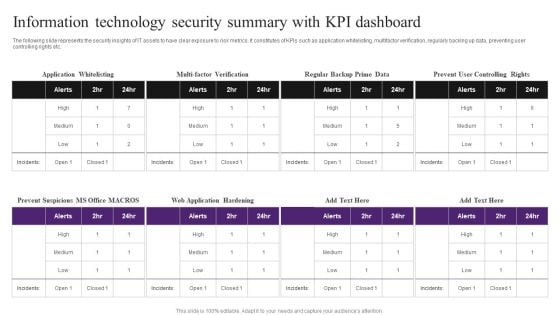
Information Technology Security Summary With KPI Dashboard Inspiration PDF
The following slide represents the security insights of IT assets to have clear exposure to risk metrics. It constitutes of KPIs such as application whitelisting, multifactor verification, regularly backing up data, preventing user controlling rights etc. Pitch your topic with ease and precision using this Information Technology Security Summary With KPI Dashboard Inspiration PDF. This layout presents information on Information Technology Security, Summary With KPI Dashboard. It is also available for immediate download and adjustment. So, changes can be made in the color, design, graphics or any other component to create a unique layout.
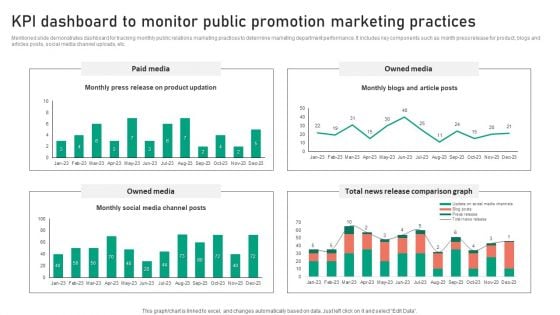
KPI Dashboard To Monitor Public Promotion Marketing Practices Template PDF
Mentioned slide demonstrates dashboard for tracking monthly public relations marketing practices to determine marketing department performance. It includes key components such as month press release for product, blogs and articles posts, social media channel uploads, etc. Pitch your topic with ease and precision using this KPI Dashboard To Monitor Public Promotion Marketing Practices Template PDF. This layout presents information on Paid Media, Owned Media, Total News Release, Comparison Graph. It is also available for immediate download and adjustment. So, changes can be made in the color, design, graphics or any other component to create a unique layout.
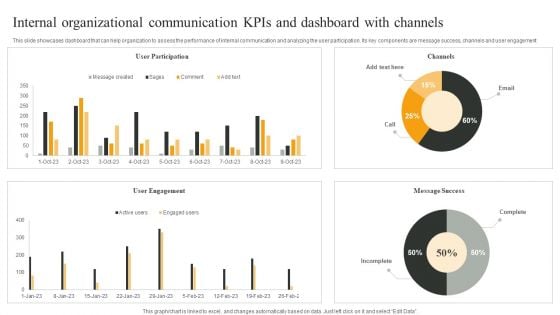
Internal Organizational Communication Kpis And Dashboard With Channels Infographics PDF
This slide showcases dashboard that can help organization to assess the performance of internal communication and analyzing the user participation. Its key components are message success, channels and user engagement. Pitch your topic with ease and precision using this Internal Organizational Communication Kpis And Dashboard With Channels Infographics PDF. This layout presents information on User Participation, User Engagement, Message Success. It is also available for immediate download and adjustment. So, changes can be made in the color, design, graphics or any other component to create a unique layout.
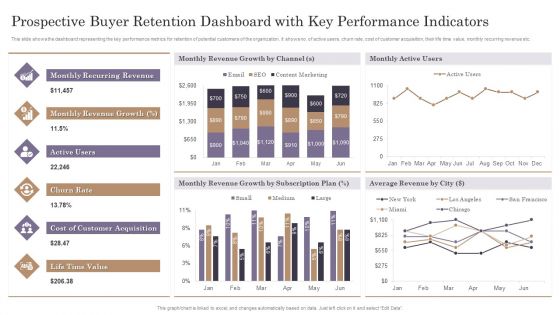
Prospective Buyer Retention Dashboard With Key Performance Indicators Themes PDF
This slide shows the dashboard representing the key performance metrics for retention of potential customers of the organization. It shows no. of active users, churn rate, cost of customer acquisition, their life time value, monthly recurring revenue etc.Pitch your topic with ease and precision using this Prospective Buyer Retention Dashboard With Key Performance Indicators Themes PDF. This layout presents information on Recurring Revenue, Revenue Growth, Customer Acquisition. It is also available for immediate download and adjustment. So, changes can be made in the color, design, graphics or any other component to create a unique layout.
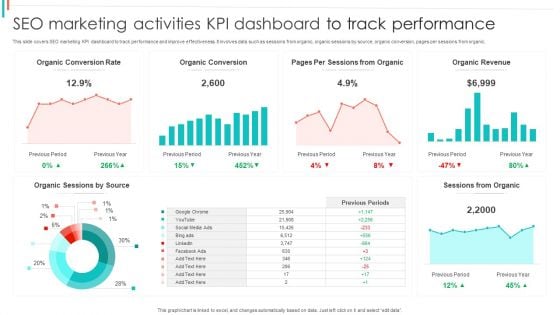
SEO Marketing Activities KPI Dashboard To Track Performance Brochure PDF
This slide covers SEO marketing KPI dashboard to track performance and improve effectiveness. It involves data such as sessions from organic, organic sessions by source, organic conversion, pages per sessions from organic.Pitch your topic with ease and precision using this SEO Marketing Activities KPI Dashboard To Track Performance Brochure PDF. This layout presents information on Organic Conversion, Sessions Organic, Organic Revenue. It is also available for immediate download and adjustment. So, changes can be made in the color, design, graphics or any other component to create a unique layout.
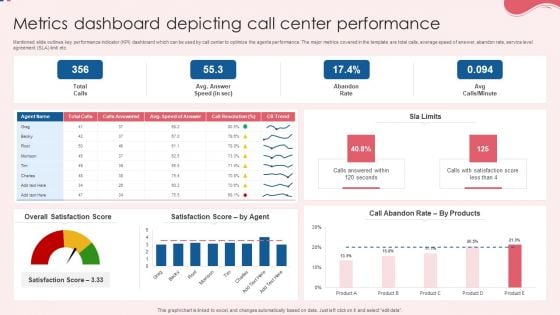
Metrics Dashboard Depicting Call Center Performance Pictures PDF
Mentioned slide outlines key performance indicator KPI dashboard which can be used by call center to optimize the agents performance. The major metrics covered in the template are total calls, average speed of answer, abandon rate, service level agreement SLA limit etc. Pitch your topic with ease and precision using this Metrics Dashboard Depicting Call Center Performance Pictures PDF. This layout presents information on Overall Satisfaction Score, Satisfaction Score, Performance. It is also available for immediate download and adjustment. So, changes can be made in the color, design, graphics or any other component to create a unique layout.
Maintenance Software Dashboard With Charts Ppt Icon Slide Download PDF
This slide shows the dashboard of maintenance software which covers tasks per subsystem, highest maintenance time, task count, mean time to repair per level with motherboard, camera, propeller assembly, ground controller, motor , etc. Pitch your topic with ease and precision using this Maintenance Software Dashboard With Charts Ppt Icon Slide Download PDF. This layout presents information on 10 Highest Mean, Time To Repair, 10 Highest Task, Task Per Subsystem, 10 Highest Maintenance. It is also available for immediate download and adjustment. So, changes can be made in the color, design, graphics or any other component to create a unique layout.
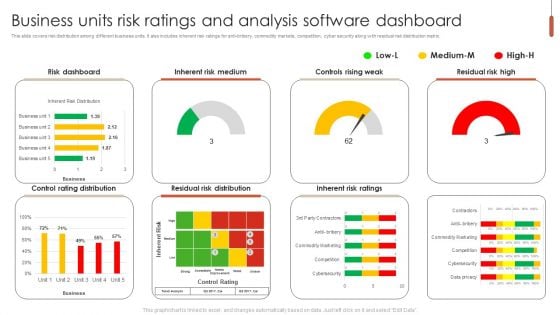
Business Units Risk Ratings And Analysis Software Dashboard Ideas PDF
This slide covers risk distribution among different business units. It also includes inherent risk ratings for anti-bribery, commodity markets, competition, cyber security along with residual risk distribution matrix. Pitch your topic with ease and precision using this Business Units Risk Ratings And Analysis Software Dashboard Ideas PDF. This layout presents information on Risk Dashboard, Inherent Risk Medium, Controls Rising Weak. It is also available for immediate download and adjustment. So, changes can be made in the color, design, graphics or any other component to create a unique layout.
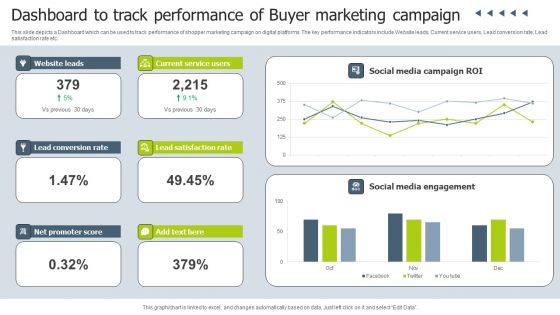
Dashboard To Track Performance Of Buyer Marketing Campaign Infographics PDF
This slide depicts a Dashboard which can be used to track performance of shopper marketing campaign on digital platforms. The key performance indicators include Website leads, Current service users, Lead conversion rate, Lead satisfaction rate etc. Pitch your topic with ease and precision using this Dashboard To Track Performance Of Buyer Marketing Campaign Infographics PDF. This layout presents information on Social Media Campaign, Social Media Engagement, Current Service Users. It is also available for immediate download and adjustment. So, changes can be made in the color, design, graphics or any other component to create a unique layout.
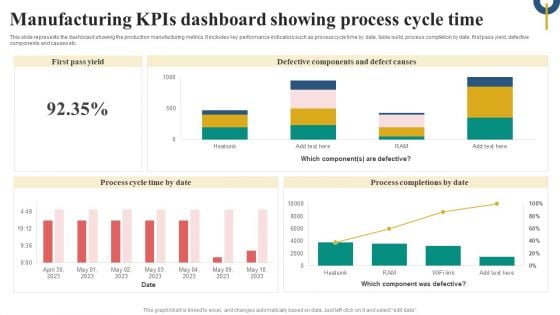
Manufacturing Kpis Dashboard Showing Process Cycle Time Microsoft PDF
This slide represents the dashboard showing the production manufacturing metrics. It includes key performance indicators such as process cycle time by date, table build, process completion by date, first pass yield, defective components and causes etc. Pitch your topic with ease and precision using this Manufacturing Kpis Dashboard Showing Process Cycle Time Microsoft PDF. This layout presents information on Defective Components Defect Causes, Process Cycle, Time By Date, Process Completions By Date. It is also available for immediate download and adjustment. So, changes can be made in the color, design, graphics or any other component to create a unique layout.
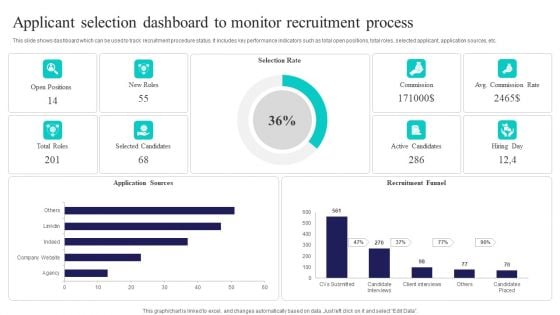
Applicant Selection Dashboard To Monitor Recruitment Process Sample PDF
This slide shows dashboard which can be used to track recruitment procedure status. It includes key performance indicators such as total open positions, total roles, selected applicant, application sources, etc. Pitch your topic with ease and precision using this Applicant Selection Dashboard To Monitor Recruitment Process Sample PDF. This layout presents information on Selection Rate, Recruitment Funnel, Application Sources. It is also available for immediate download and adjustment. So, changes can be made in the color, design, graphics or any other component to create a unique layout.
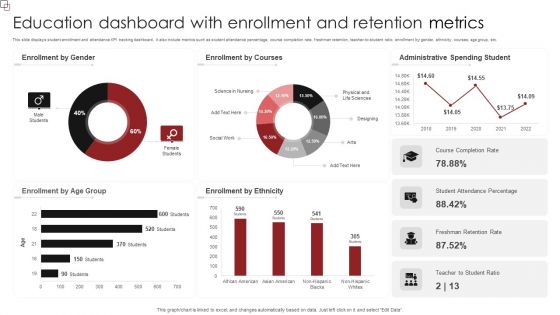
Education Dashboard With Enrollment And Retention Metrics Sample PDF
This slide displays student enrollment and attendance KPI tracking dashboard. It also include metrics such as student attendance percentage, course completion rate, freshman retention, teacher-to-student ratio, enrollment by gender, ethnicity, courses, age group, etc. Pitch your topic with ease and precision using this Education Dashboard With Enrollment And Retention Metrics Sample PDF. This layout presents information on Enrollment Gender, Enrollment Courses, Administrative Spending Student. It is also available for immediate download and adjustment. So, changes can be made in the color, design, graphics or any other component to create a unique layout.
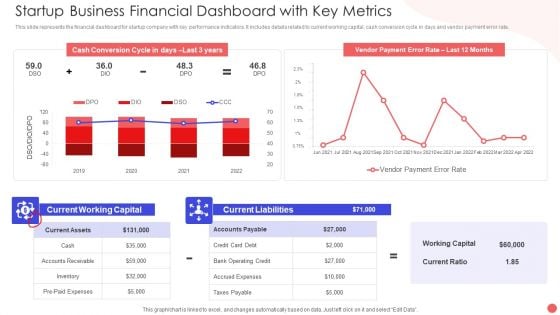
Startup Business Financial Dashboard With Key Metrics Sample PDF
This slide represents the financial dashboard for startup company with key performance indicators. It includes details related to current working capital, cash conversion cycle in days and vendor payment error rate. Pitch your topic with ease and precision using this Startup Business Financial Dashboard With Key Metrics Sample PDF. This layout presents information on Cash Conversion Cycle, Current Working Capital, Current Liabilities Debt. It is also available for immediate download and adjustment. So, changes can be made in the color, design, graphics or any other component to create a unique layout.


 Continue with Email

 Home
Home


