Change Management Icons
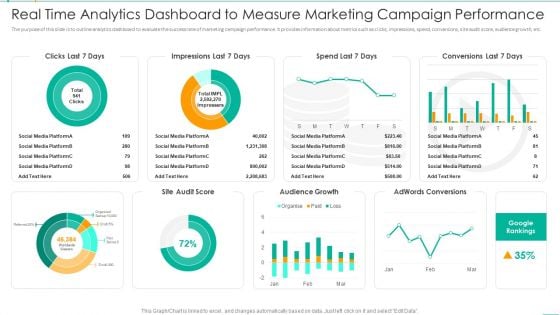
Real Time Analytics Dashboard To Measure Marketing Campaign Performance Information PDF
The purpose of this slide is to outline analytics dashboard to evaluate the success rate of marketing campaign performance. It provides information about metrics such as clicks, impressions, spend, conversions, site audit score, audience growth, etc. Pitch your topic with ease and precision using this Real Time Analytics Dashboard To Measure Marketing Campaign Performance Information PDF. This layout presents information on Real Time Analytics Dashboard To Measure Marketing Campaign Performance. It is also available for immediate download and adjustment. So, changes can be made in the color, design, graphics or any other component to create a unique layout.
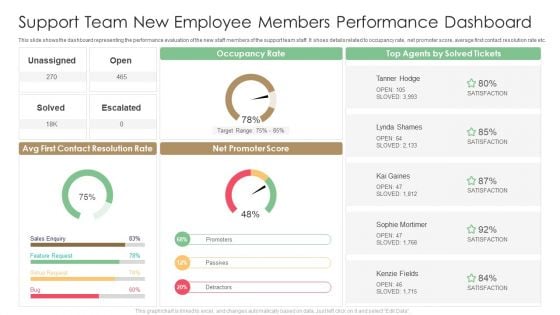
Support Team New Employee Members Performance Dashboard Designs PDF
This slide shows the dashboard representing the performance evaluation of the new staff members of the support team staff. It shoes details related to occupancy rate, net promoter score, average first contact resolution rate etc. Pitch your topic with ease and precision using this Support Team New Employee Members Performance Dashboard Designs PDF. This layout presents information on Target Range, Occupancy Rate, Contact Resolution Rate. It is also available for immediate download and adjustment. So, changes can be made in the color, design, graphics or any other component to create a unique layout.
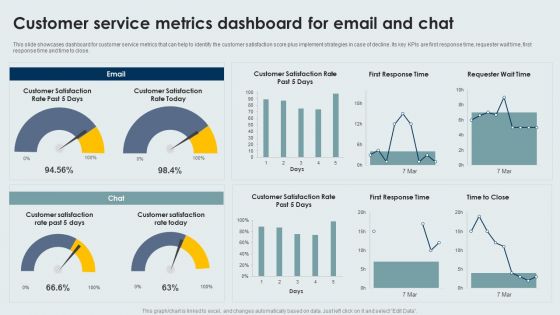
Customer Service Metrics Dashboard For Email And Chat Infographics PDF
This slide showcases dashboard for customer service metrics that can help to identify the customer satisfaction score plus implement strategies in case of decline. Its key KPIs are first response time, requester wait time, first response time and time to close. Pitch your topic with ease and precision using this Customer Service Metrics Dashboard For Email And Chat Infographics PDF. This layout presents information on Customer Service, Metrics Dashboard, Email And Chat. It is also available for immediate download and adjustment. So, changes can be made in the color, design, graphics or any other component to create a unique layout.
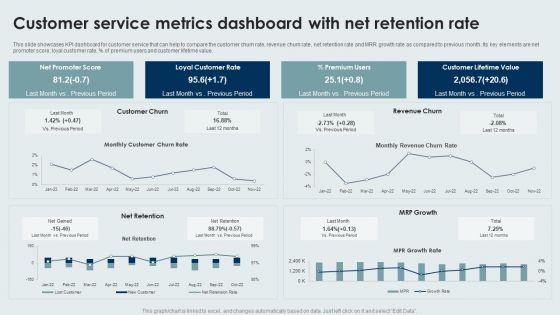
Customer Service Metrics Dashboard With Net Retention Rate Sample PDF
This slide showcases KPI dashboard for customer service that can help to compare the customer churn rate, revenue churn rate, net retention rate and MRR growth rate as compared to previous month. Its key elements are net promoter score, loyal customer rate, percentage of premium users and customer lifetime value. Pitch your topic with ease and precision using this Customer Service Metrics Dashboard With Net Retention Rate Sample PDF. This layout presents information on Loyal Customer Rate, Premium Users, Customer Lifetime Value. It is also available for immediate download and adjustment. So, changes can be made in the color, design, graphics or any other component to create a unique layout.
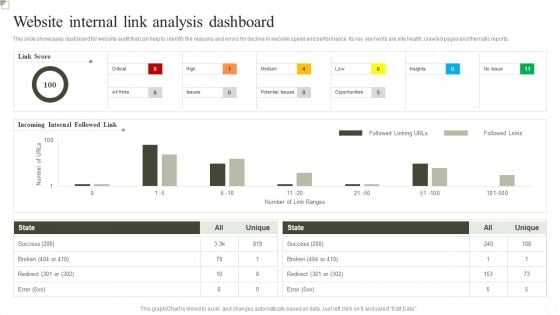
Website Internal Link Analysis Dashboard Ppt Inspiration Outline PDF
This slide showcases dashboard for website Analysis that can help to identify the reasons and errors for decline in website speed and performance. Its key elements are site health, crawled pages and thematic reports. Pitch your topic with ease and precision using this Website Internal Link Analysis Dashboard Ppt Inspiration Outline PDF. This layout presents information on Success, Incoming Internal Followed Link, Link Score. It is also available for immediate download and adjustment. So, changes can be made in the color, design, graphics or any other component to create a unique layout.
Staff Productivity And Attrition Tracking Rate Statistical Report Ideas PDF
This slide covers dashboard for employees productivity stats. It further includes stats for absence rates, cost incurred, benefits derived, satisfaction index, net promoter score, turnover and promotion rates. Pitch your topic with ease and precision using this Staff Productivity And Attrition Tracking Rate Statistical Report Ideas PDF. This layout presents information on Absence Cost, Benefits Satisfaction, Productivity Rate. It is also available for immediate download and adjustment. So, changes can be made in the color, design, graphics or any other component to create a unique layout.
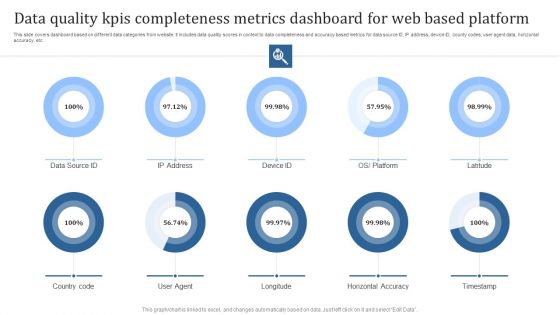
Data Quality Kpis Completeness Metrics Dashboard For Web Based Platform Graphics PDF
This slide covers dashboard based on different data categories from website. It includes data quality scores in context to data completeness and accuracy based metrics for data source ID, IP address, device ID, county codes, user agent data, horizontal accuracy, etc. Pitch your topic with ease and precision using this Data Quality Kpis Completeness Metrics Dashboard For Web Based Platform Graphics PDF. This layout presents information on Country Code, User Agent, Longitude. It is also available for immediate download and adjustment. So, changes can be made in the color, design, graphics or any other component to create a unique layout.
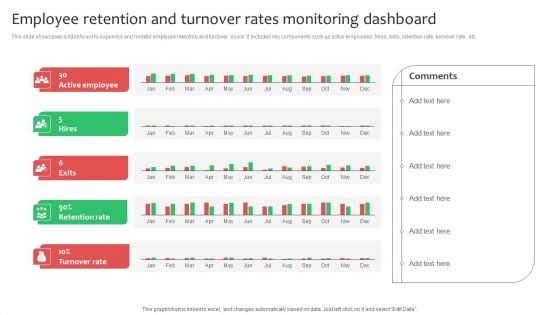
Employee Retention And Turnover Rates Monitoring Dashboard Mockup PDF
This slide showcases a dashboard to supervise and monitor employee retention and turnover score. It includes key components such as active employees, hires, exits, retention rate, turnover rate, etc. If your project calls for a presentation, then Slidegeeks is your go to partner because we have professionally designed, easy to edit templates that are perfect for any presentation. After downloading, you can easily edit Employee Retention And Turnover Rates Monitoring Dashboard Mockup PDF and make the changes accordingly. You can rearrange slides or fill them with different images. Check out all the handy templates
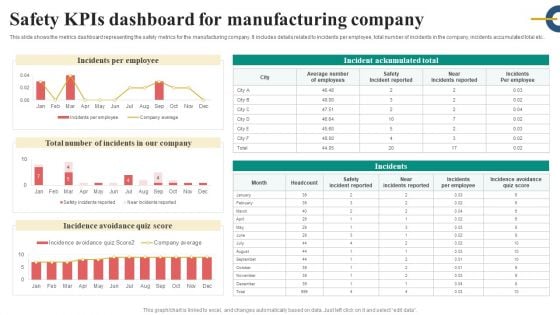
Safety Kpis Dashboard For Manufacturing Company Slides PDF
This slide shows the metrics dashboard representing the safety metrics for the manufacturing company. It includes details related to incidents per employee, total number of incidents in the company, incidents accumulated total etc.. Pitch your topic with ease and precision using this Safety Kpis Dashboard For Manufacturing Company Slides PDF. This layout presents information on Incidents Per Employee, Safety Incident Reported, Incidence Avoidance Quiz Score. It is also available for immediate download and adjustment. So, changes can be made in the color, design, graphics or any other component to create a unique layout.
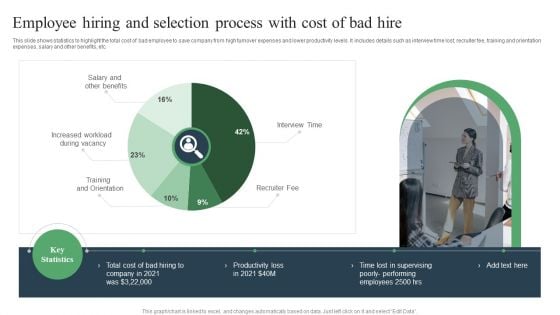
Employee Hiring And Selection Process With Cost Of Bad Hire Ppt PowerPoint Presentation Outline Skills PDF
This slide shows statistics to highlight the total cost of bad employee to save company from high turnover expenses and lower productivity levels. It includes details such as interview time lost, recruiter fee, training and orientation expenses, salary and other benefits, etc. Pitch your topic with ease and precision using this Employee Hiring And Selection Process With Cost Of Bad Hire Ppt PowerPoint Presentation Outline Skills PDF. This layout presents information on Employee Hiring, Selection Process, Candidate Screening. It is also available for immediate download and adjustment. So, changes can be made in the color, design, graphics or any other component to create a unique layout.
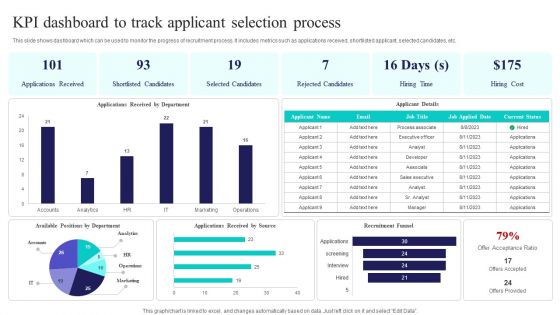
Kpi Dashboard To Track Applicant Selection Process Ppt PowerPoint Presentation File Graphics Template PDF
This slide shows dashboard which can be used to monitor the progress of recruitment process. It includes metrics such as applications received, shortlisted applicant, selected candidates, etc. Pitch your topic with ease and precision using this Kpi Dashboard To Track Applicant Selection Process Ppt PowerPoint Presentation File Graphics Template PDF. This layout presents information on Applications Received, Shortlisted Candidates, Selected Candidates. It is also available for immediate download and adjustment. So, changes can be made in the color, design, graphics or any other component to create a unique layout.

KPI Dashboard To Track Sales And Operations Process Of Manufacturing Enterprise Brochure PDF
This slide depicts a dashboard to track the key performance metrics in sales and operations process of a manufacturing enterprise to analyze deviations in the actual and planned output. The key performing indicators are percentage deviation, dollar deviation, inventory in hand etc.Pitch your topic with ease and precision using this KPI Dashboard To Track Sales And Operations Process Of Manufacturing Enterprise Brochure PDF. This layout presents information on Planned Output, Yearly Growth, Inventory Hand. It is also available for immediate download and adjustment. So, changes can be made in the color, design, graphics or any other component to create a unique layout.
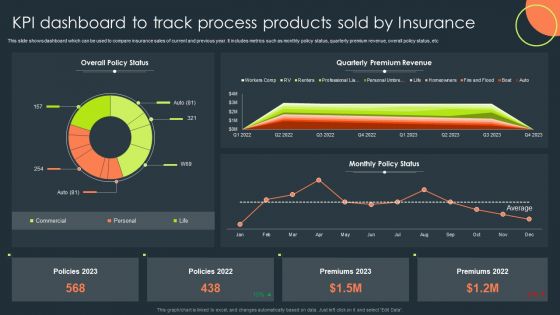
KPI Dashboard To Track Process Products Sold By Insurance Topics PDF
This slide shows dashboard which can be used to compare insurance sales of current and previous year. It includes metrics such as monthly policy status, quarterly premium revenue, overall policy status, etc. Pitch your topic with ease and precision using this KPI Dashboard To Track Process Products Sold By Insurance Topics PDF. This layout presents information on Overall Policy Status, Quarterly Premium Revenue, Monthly Policy Status. It is also available for immediate download and adjustment. So, changes can be made in the color, design, graphics or any other component to create a unique layout.
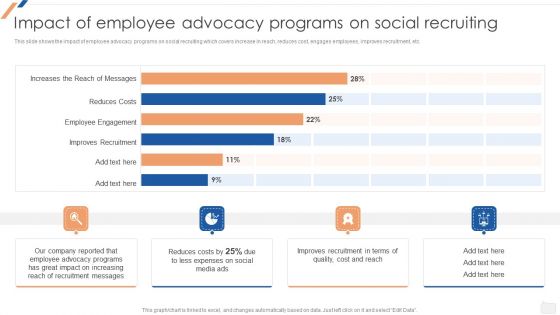
Impact Of Employee Advocacy Programs On Social Recruiting Enhancing Social Media Recruitment Process Elements PDF
This slide shows the impact of employee advocacy programs on social recruiting which covers increase in reach, reduces cost, engages employees, improves recruitment, etc.If your project calls for a presentation, then Slidegeeks is your go-to partner because we have professionally designed, easy-to-edit templates that are perfect for any presentation. After downloading, you can easily edit Impact Of Employee Advocacy Programs On Social Recruiting Enhancing Social Media Recruitment Process Elements PDF and make the changes accordingly. You can rearrange slides or fill them with different images. Check out all the handy templates.
Robotic Process Automation Shipping And Logistics Tracking Dashboard With Shipments Clipart PDF
This slide covers Key performance indicators to track the automation system of the company. This dashboard includes Logistics Efficiency Status, delivery time accuracy etc. If your project calls for a presentation, then Slidegeeks is your go-to partner because we have professionally designed, easy-to-edit templates that are perfect for any presentation. After downloading, you can easily edit Robotic Process Automation Shipping And Logistics Tracking Dashboard With Shipments Clipart PDF and make the changes accordingly. You can rearrange slides or fill them with different images. Check out all the handy templates
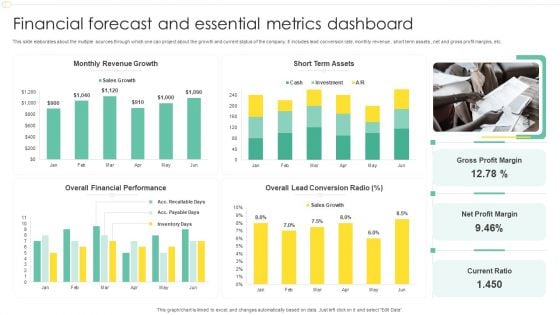
Financial Forecast And Essential Metrics Dashboard Ppt File Show PDF
This slide elaborates about the multiple sources through which one can project about the growth and current status of the company. It includes lead conversion rate, monthly revenue , short term assets , net and gross profit margins, etc. Pitch your topic with ease and precision using this Financial Forecast And Essential Metrics Dashboard Ppt File Show PDF. This layout presents information on Monthly Revenue Growth, Short Term Assets, Overall Financial Performance, Net Profit Margin. It is also available for immediate download and adjustment. So, changes can be made in the color, design, graphics or any other component to create a unique layout.
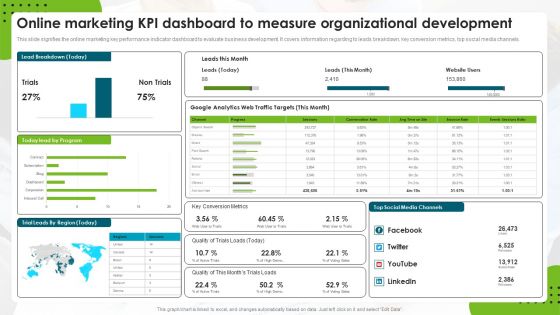
Online Marketing Kpi Dashboard To Measure Organizational Development Rules PDF
This slide signifies the online marketing key performance indicator dashboard to evaluate business development. It covers information regarding to leads breakdown, key conversion metrics, top social media channels. Pitch your topic with ease and precision using this Online Marketing Kpi Dashboard To Measure Organizational Development Rules PDF. This layout presents information on Web Traffic Targets, Google Analytics, Social Media Channels. It is also available for immediate download and adjustment. So, changes can be made in the color, design, graphics or any other component to create a unique layout.
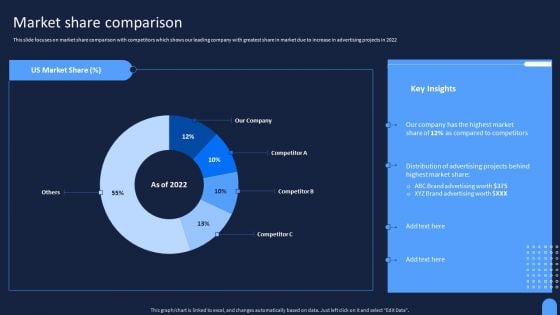
Ad And Media Agency Company Profile Market Share Comparison Infographics PDF
This slide focuses on market share comparison with competitors which shows our leading company with greatest share in market due to increase in advertising projects in 2022. If your project calls for a presentation, then Slidegeeks is your go-to partner because we have professionally designed, easy-to-edit templates that are perfect for any presentation. After downloading, you can easily edit Ad And Media Agency Company Profile Market Share Comparison Infographics PDF and make the changes accordingly. You can rearrange slides or fill them with different images. Check out all the handy templates.
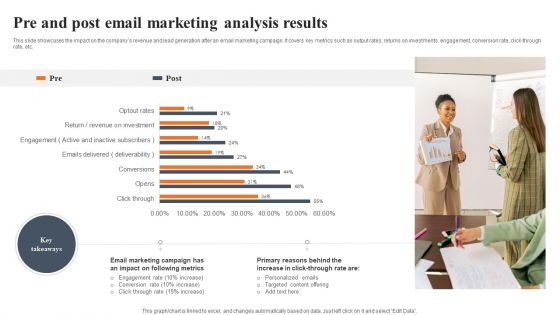
Pre And Post Email Marketing Analysis Results Slides PDF
This slide showcases the impact on the companys revenue and lead generation after an email marketing campaign. It covers key metrics such as output rates, returns on investments, engagement, conversion rate, click through rate, etc. Pitch your topic with ease and precision using this Pre And Post Email Marketing Analysis Results Slides PDF. This layout presents information on Email Marketing Campaign, Following Metrics, Targeted Content Offering. It is also available for immediate download and adjustment. So, changes can be made in the color, design, graphics or any other component to create a unique layout.
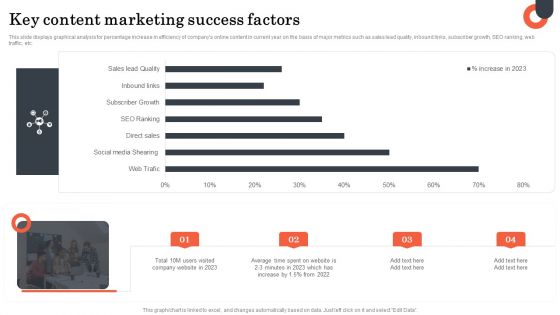
Key Content Marketing Success Factors Microsoft PDF
This slide displays graphical analysis for percentage increase in efficiency of companys online content in current year on the basis of major metrics such as sales lead quality, inbound links, subscriber growth, SEO ranking, web traffic, etc. Pitch your topic with ease and precision using this Key Content Marketing Success Factors Microsoft PDF. This layout presents information on Key Content, Marketing Success Factors. It is also available for immediate download and adjustment. So, changes can be made in the color, design, graphics or any other component to create a unique layout.
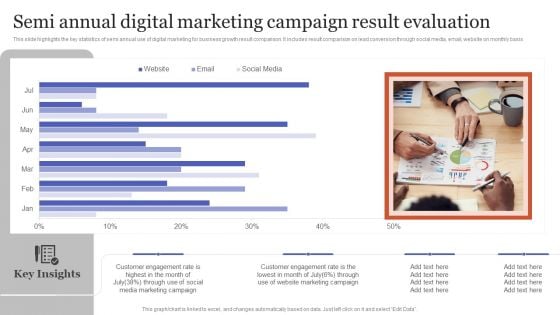
Semi Annual Digital Marketing Campaign Result Evaluation Topics PDF
This slide highlights the key statistics of semi annual use of digital marketing for business growth result comparison. It includes result comparison on lead conversion through social media, email, website on monthly basis. Pitch your topic with ease and precision using this Semi Annual Digital Marketing Campaign Result Evaluation Topics PDF. This layout presents information on Customer Engagement, Marketing Campaign, Through Social. It is also available for immediate download and adjustment. So, changes can be made in the color, design, graphics or any other component to create a unique layout.
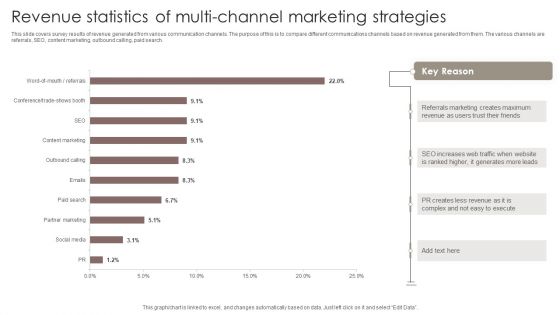
Revenue Statistics Of Multi Channel Marketing Strategies Microsoft PDF
This slide covers survey results of revenue generated from various communication channels. The purpose of this is to compare different communications channels based on revenue generated from them. The various channels are referrals, SEO, content marketing, outbound calling, paid search.Pitch your topic with ease and precision using this Revenue Statistics Of Multi Channel Marketing Strategies Microsoft PDF. This layout presents information on Referrals Marketing, Creates Maximum, Generates Leads. It is also available for immediate download and adjustment. So, changes can be made in the color, design, graphics or any other component to create a unique layout.
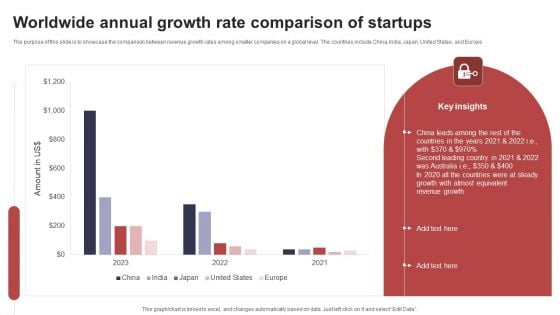
Worldwide Annual Growth Rate Comparison Of Startups Template PDF
The purpose of this slide is to showcase the comparison between revenue growth rates among smaller companies on a global level. The countries include China, India, Japan, United States, and Europe. Pitch your topic with ease and precision using this Worldwide Annual Growth Rate Comparison Of Startups Template PDF. This layout presents information on China Leads Among, Almost Equivalent, Revenue Growth. It is also available for immediate download and adjustment. So, changes can be made in the color, design, graphics or any other component to create a unique layout.
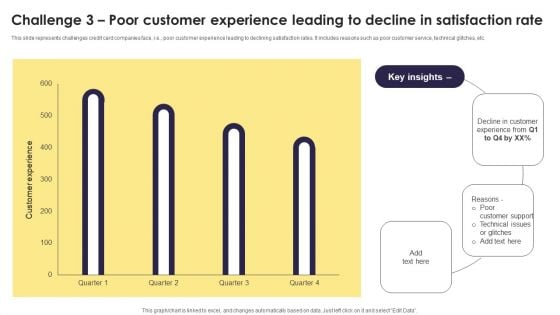
Implementation Of An Efficient Credit Card Promotion Plan Challenge 3 Poor Customer Designs PDF
This slide represents challenges credit card companies face, i.e., poor customer experience leading to declining satisfaction rates. It includes reasons such as poor customer service, technical glitches, etc. If your project calls for a presentation, then Slidegeeks is your go to partner because we have professionally designed, easy to edit templates that are perfect for any presentation. After downloading, you can easily edit Implementation Of An Efficient Credit Card Promotion Plan Challenge 3 Poor Customer Designs PDF and make the changes accordingly. You can rearrange slides or fill them with different images. Check out all the handy templates
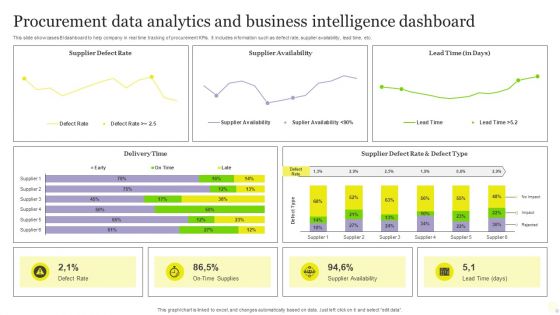
Procurement Data Analytics And Business Intelligence Dashboard Pictures PDF
This slide showcases BI dashboard to help company in real time tracking of procurement KPIs. It includes information such as defect rate, supplier availability, lead time, etc. Pitch your topic with ease and precision using this Procurement Data Analytics And Business Intelligence Dashboard Pictures PDF. This layout presents information on Procurement Data Analytics, Business Intelligence Dashboard. It is also available for immediate download and adjustment. So, changes can be made in the color, design, graphics or any other component to create a unique layout.
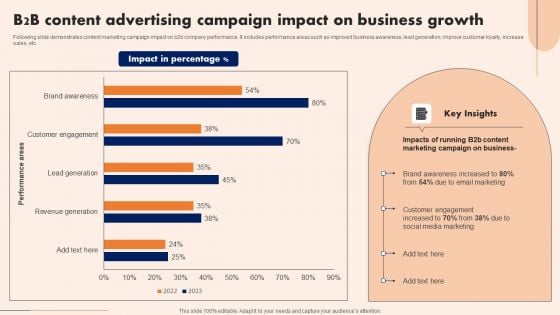
B2B Content Advertising Campaign Impact On Business Growth Sample PDF
Following slide demonstrates content marketing campaign impact on b2b company performance. It includes performance areas such as improved business awareness, lead generation, improve customer loyalty, increase sales, etc. Pitch your topic with ease and precision using this B2B Content Advertising Campaign Impact On Business Growth Sample PDF. This layout presents information on Key Insights, Growth, Marketing . It is also available for immediate download and adjustment. So, changes can be made in the color, design, graphics or any other component to create a unique layout.
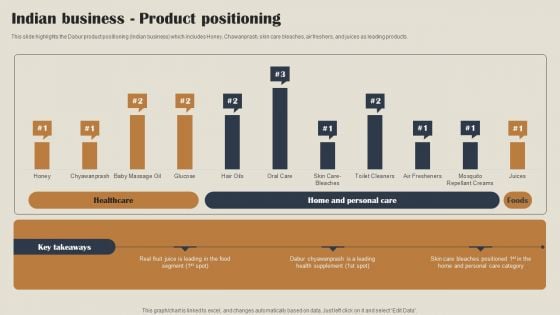
Self Care Products Company Outline Indian Business Product Positioning Slides PDF
This slide highlights the Dabur product positioning Indian business which includes Honey, Chawanprash, skin care bleaches, air freshers, and juices as leading products. If your project calls for a presentation, then Slidegeeks is your go to partner because we have professionally designed, easy to edit templates that are perfect for any presentation. After downloading, you can easily edit Self Care Products Company Outline Indian Business Product Positioning Slides PDF and make the changes accordingly. You can rearrange slides or fill them with different images. Check out all the handy templates
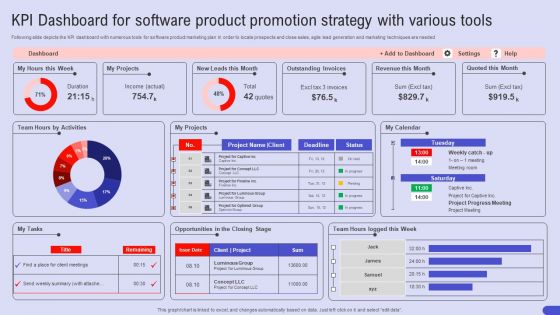
KPI Dashboard For Software Product Promotion Strategy With Various Tools Portrait PDF
Following slide depicts the KPI dashboard with numerous tools for software product marketing plan In order to locate prospects and close sales, agile lead generation and marketing techniques are needed. Pitch your topic with ease and precision using this KPI Dashboard For Software Product Promotion Strategy With Various Tools Portrait PDF. This layout presents information on KPI Dashboard, Software Product Promotion, Strategy With Various Tools. It is also available for immediate download and adjustment. So, changes can be made in the color, design, graphics or any other component to create a unique layout.
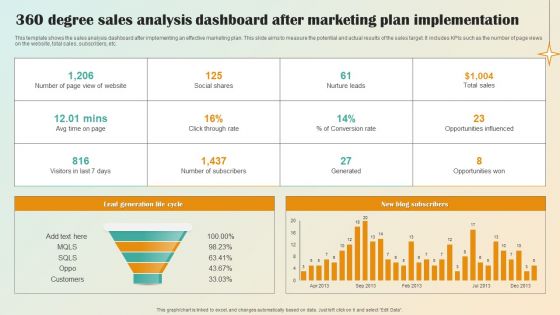
360 Degree Sales Analysis Dashboard After Marketing Plan Implementation Pictures PDF
This template shows the sales analysis dashboard after implementing an effective marketing plan. This slide aims to measure the potential and actual results of the sales target. It includes KPIs such as the number of page views on the website, total sales, subscribers, etc.Pitch your topic with ease and precision using this 360 Degree Sales Analysis Dashboard After Marketing Plan Implementation Pictures PDF. This layout presents information on Lead Generation Life, Conversion Rate. It is also available for immediate download and adjustment. So, changes can be made in the color, design, graphics or any other component to create a unique layout.
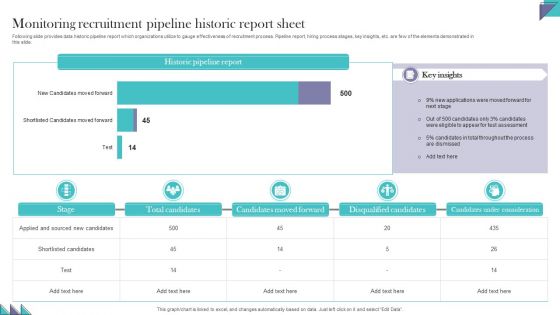
Monitoring Recruitment Pipeline Historic Report Sheet Pictures PDF
Following slide provides data historic pipeline report which organizations utilize to gauge effectiveness of recruitment process. Pipeline report, hiring process stages, key insights, etc. are few of the elements demonstrated in this slide. Pitch your topic with ease and precision using this Monitoring Recruitment Pipeline Historic Report Sheet Pictures PDF. This layout presents information on Candidates Moved Forward, Disqualified Candidates, Candidates Under Consideration. It is also available for immediate download and adjustment. So, changes can be made in the color, design, graphics or any other component to create a unique layout
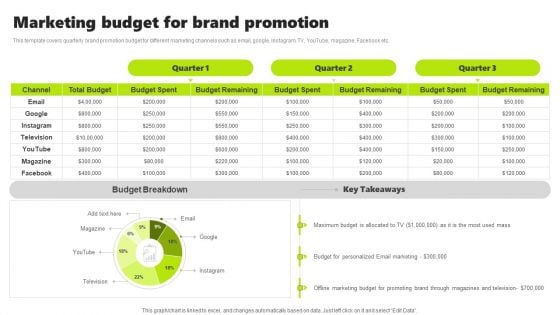
Rebrand Kick Off Plan Marketing Budget For Brand Promotion Graphics PDF
This template covers quarterly brand promotion budget for different marketing channels such as email, google, Instagram, TV, YouTube, magazine, Facebook etc. Present like a pro with Rebrand Kick Off Plan Marketing Budget For Brand Promotion Graphics PDF Create beautiful presentations together with your team, using our easy to use presentation slides. Share your ideas in real time and make changes on the fly by downloading our templates. So whether you are in the office, on the go, or in a remote location, you can stay in sync with your team and present your ideas with confidence. With Slidegeeks presentation got a whole lot easier. Grab these presentations today.
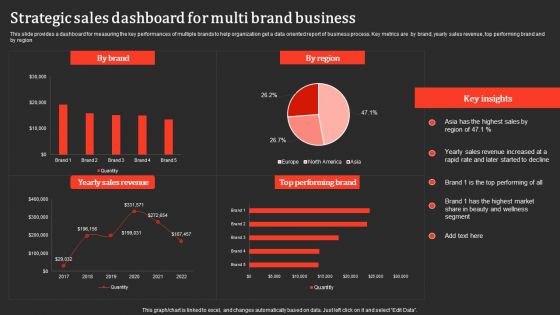
Strategic Sales Dashboard For Multi Brand Business Professional PDF
This slide provides a dashboard for measuring the key performances of multiple brands to help organization get a data oriented report of business process. Key metrics are by brand, yearly sales revenue, top performing brand and by region. Pitch your topic with ease and precision using this Strategic Sales Dashboard For Multi Brand Business Professional PDF. This layout presents information on Yearly Sales Revenue, Performing Brand. It is also available for immediate download and adjustment. So, changes can be made in the color, design, graphics or any other component to create a unique layout.

Enterprise Recruitment Dashboard With Cost Per Hire Graphics PDF
The following slide showcases KPI dashboard to get real- time insights about efficiency of corporate staffing process in the organization. It includes elements such as hired, days to fill, sources contribution, etc. Pitch your topic with ease and precision using this Enterprise Recruitment Dashboard With Cost Per Hire Graphics PDF. This layout presents information on Enterprise, Contribution, Cost. It is also available for immediate download and adjustment. So, changes can be made in the color, design, graphics or any other component to create a unique layout.

IT Cyber Threat Prevention Technology Market Topics PDF
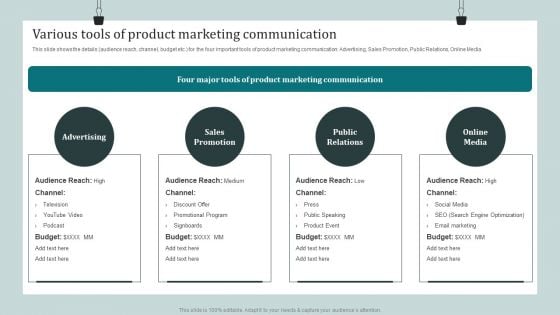
Product Awareness Strategies To Raise Demand Various Tools Of Product Marketing Communication Diagrams PDF
This slide shows the details audience reach, channel, budget etc. for the four important tools of product marketing communication Advertising, Sales Promotion, Public Relations, Online Media. If your project calls for a presentation, then Slidegeeks is your go to partner because we have professionally designed, easy to edit templates that are perfect for any presentation. After downloading, you can easily edit Product Awareness Strategies To Raise Demand Various Tools Of Product Marketing Communication Diagrams PDF and make the changes accordingly. You can rearrange slides or fill them with different images. Check out all the handy templates.
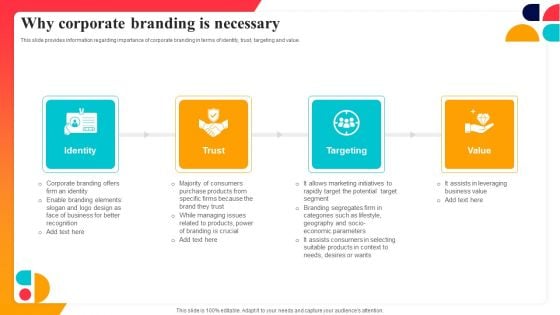
Why Corporate Branding Is Necessary Corporate Branding Strategy To Revitalize Business Identity Diagrams PDF
This slide provides information regarding importance of corporate branding in terms of identity, trust, targeting and value. If your project calls for a presentation, then Slidegeeks is your go to partner because we have professionally designed, easy to edit templates that are perfect for any presentation. After downloading, you can easily edit Why Corporate Branding Is Necessary Corporate Branding Strategy To Revitalize Business Identity Diagrams PDF and make the changes accordingly. You can rearrange slides or fill them with different images. Check out all the handy templates.
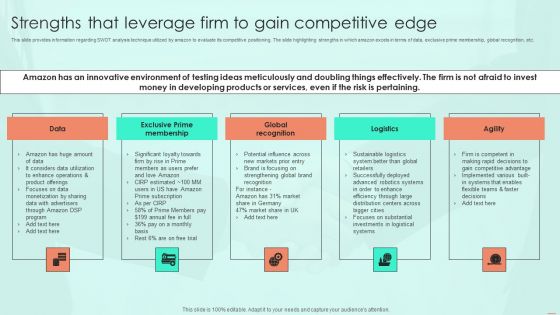
Strengths That Leverage Firm To Gain Competitive Edge Ppt PowerPoint Presentation Diagram PDF
This slide provides information regarding SWOT analysis technique utilized by amazon to evaluate its competitive positioning. The slide highlighting strengths in which amazon excels in terms of data, exclusive prime membership, global recognition, etc. If your project calls for a presentation, then Slidegeeks is your go to partner because we have professionally designed, easy to edit templates that are perfect for any presentation. After downloading, you can easily edit Strengths That Leverage Firm To Gain Competitive Edge Ppt PowerPoint Presentation Diagram PDF and make the changes accordingly. You can rearrange slides or fill them with different images. Check out all the handy templates
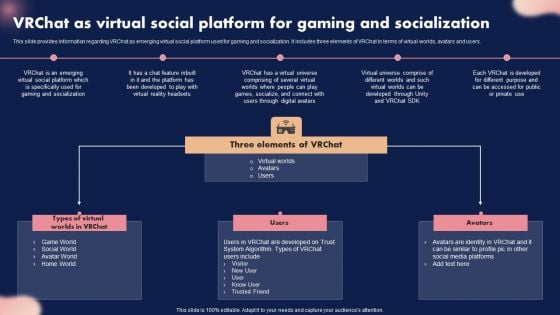
Vrchat As Virtual Social Platform For Gaming And Socialization Diagrams PDF
This slide provides information regarding VRChat as emerging virtual social platform used for gaming and socialization. It includes three elements of VRChat in terms of virtual worlds, avatars and users. If your project calls for a presentation, then Slidegeeks is your go to partner because we have professionally designed, easy to edit templates that are perfect for any presentation. After downloading, you can easily edit Vrchat As Virtual Social Platform For Gaming And Socialization Diagrams PDF and make the changes accordingly. You can rearrange slides or fill them with different images. Check out all the handy templates.
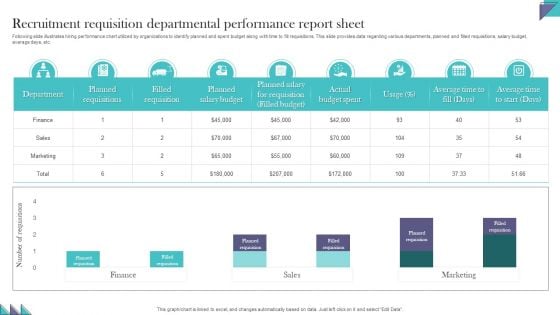
Recruitment Requisition Departmental Performance Report Sheet Demonstration PDF
Following slide illustrates hiring performance chart utilized by organizations to identify planned and spent budget along with time to fill requisitions. This slide provides data regarding various departments, planned and filled requisitions, salary budget, average days, etc. Pitch your topic with ease and precision using this Recruitment Requisition Departmental Performance Report Sheet Demonstration PDF. This layout presents information on Recruitment Requisition, Departmental Performance, Report Sheet. It is also available for immediate download and adjustment. So, changes can be made in the color, design, graphics or any other component to create a unique layout.
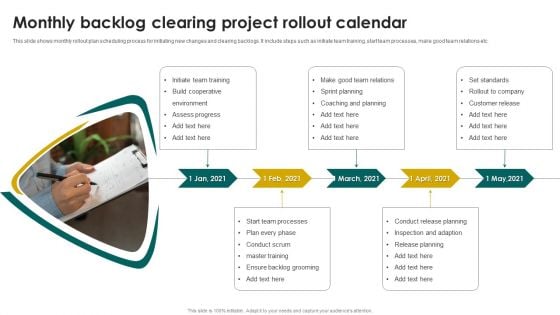
Monthly Backlog Clearing Project Rollout Calendar Introduction PDF
This slide shows monthly rollout plan scheduling process for initiating new changes and clearing backlogs. It include steps such as initiate team training, start team processes, make good team relations etc. Presenting Monthly Backlog Clearing Project Rollout Calendar Introduction PDF to dispense important information. This template comprises Five stages. It also presents valuable insights into the topics including Build Cooperative, Assess Progress, Coaching And Planning. This is a completely customizable PowerPoint theme that can be put to use immediately. So, download it and address the topic impactfully.
Tracking Sheet To Planning Multiple Projects With Task Status Diagrams PDF
Mentioned slide outlines a comprehensive tracking sheet used to plan different projects undertaken by the organization. The template covers information about the project name, status, task progress, dates, priority, and owner. Pitch your topic with ease and precision using this Tracking Sheet To Planning Multiple Projects With Task Status Diagrams PDF. This layout presents information on Types Projects, Task Progress, Priority. It is also available for immediate download and adjustment. So, changes can be made in the color, design, graphics or any other component to create a unique layout.
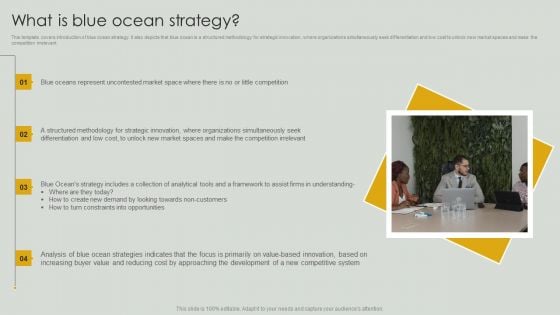
What Is Blue Ocean Strategy Ppt PowerPoint Presentation Diagram Templates PDF
This template covers introduction of blue ocean strategy. It also depicts that blue ocean is a structured methodology for strategic innovation, where organizations simultaneously seek differentiation and low cost to unlock new market spaces and make the competition irrelevant. If your project calls for a presentation, then Slidegeeks is your go to partner because we have professionally designed, easy to edit templates that are perfect for any presentation. After downloading, you can easily edit What Is Blue Ocean Strategy Ppt PowerPoint Presentation Diagram Templates PDF and make the changes accordingly. You can rearrange slides or fill them with different images. Check out all the handy templates.
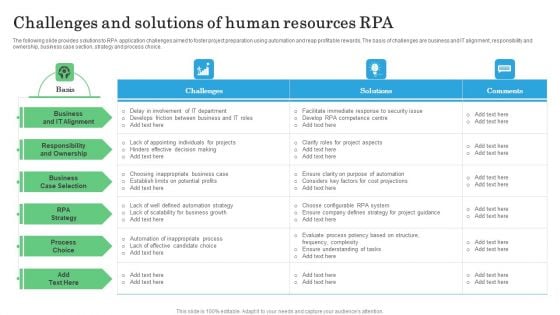
Challenges And Solutions Of Human Resources RPA Diagrams PDF
The following slide provides solutions to RPA application challenges aimed to foster project preparation using automation and reap profitable rewards. The basis of challenges are business and IT alignment, responsibility and ownership, business case section, strategy and process choice. Pitch your topic with ease and precision using this Challenges And Solutions Of Human Resources RPA Diagrams PDF. This layout presents information on Basis, Challenges, Solutions . It is also available for immediate download and adjustment. So, changes can be made in the color, design, graphics or any other component to create a unique layout.
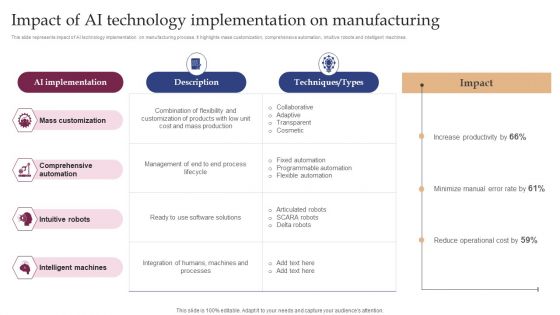
Impact Of AI Technology Implementation On Manufacturing Diagrams PDF
This slide represents impact of AI technology implementation on manufacturing process. It highlights mass customization, comprehensive automation, intuitive robots and intelligent machines. If your project calls for a presentation, then Slidegeeks is your go-to partner because we have professionally designed, easy-to-edit templates that are perfect for any presentation. After downloading, you can easily edit Impact Of AI Technology Implementation On Manufacturing Diagrams PDF and make the changes accordingly. You can rearrange slides or fill them with different images. Check out all the handy templates
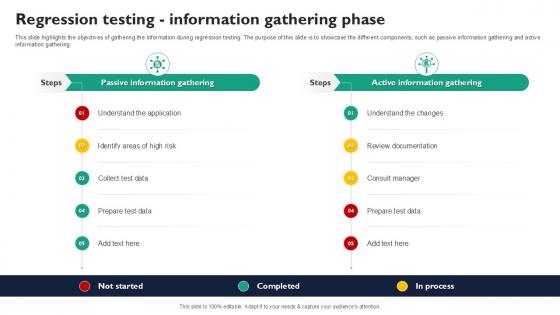
Regression Testing Information Gathering Phase Corrective Regression Testing Ppt Template
This slide highlights the objectives of gathering the information during regression testing. The purpose of this slide is to showcase the different components, such as passive information gathering and active information gathering. Present like a pro with Regression Testing Information Gathering Phase Corrective Regression Testing Ppt Template. Create beautiful presentations together with your team, using our easy-to-use presentation slides. Share your ideas in real-time and make changes on the fly by downloading our templates. So whether you are in the office, on the go, or in a remote location, you can stay in sync with your team and present your ideas with confidence. With Slidegeeks presentation got a whole lot easier. Grab these presentations today. This slide highlights the objectives of gathering the information during regression testing. The purpose of this slide is to showcase the different components, such as passive information gathering and active information gathering.
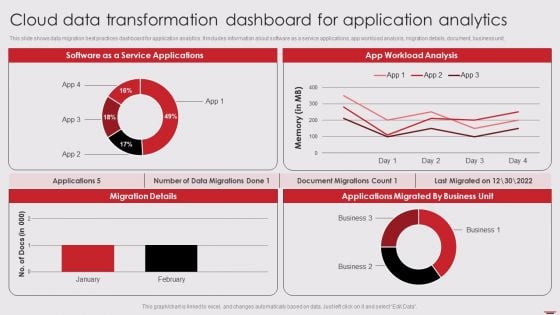
Cloud Data Transformation Dashboard For Application Analytics Information PDF
This slide shows data migration best practices dashboard for application analytics. It includes information about software as a service applications, app workload analysis, migration details, document, business unit. Pitch your topic with ease and precision using this Cloud Data Transformation Dashboard For Application Analytics Information PDF. This layout presents information on Software Service Applications, App Workload Analysis, Migration Details. It is also available for immediate download and adjustment. So, changes can be made in the color, design, graphics or any other component to create a unique layout.
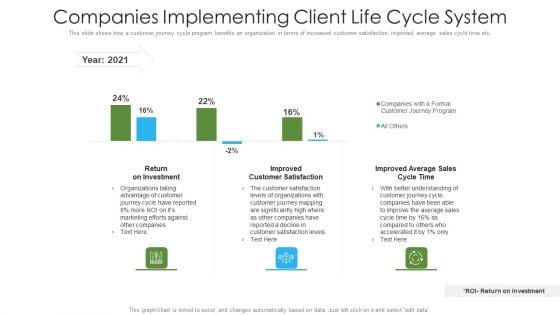
Companies Implementing Client Life Cycle System Ppt Inspiration Introduction PDF
This slide shows how a customer journey cycle program benefits an organization in terms of increased customer satisfaction, improved average sales cycle time etc. Pitch your topic with ease and precision using this companies implementing client life cycle system ppt inspiration introduction pdf. This layout presents information on return on investment, improved customer satisfaction, average sales cycle. It is also available for immediate download and adjustment. So, changes can be made in the color, design, graphics or any other component to create a unique layout.
Supplier Compensation Due Tracking Dashboard With Paid Invoices Topics PDF
This slide showcases dashboard that can help organization to track the outstanding payment of different vendors and take timely action in case of delay. Its key elements are due by age summary, top 5 vendor by purchases, top 5 vendors by amount due and total invoice vs paid invoices. Pitch your topic with ease and precision using this supplier compensation due tracking dashboard with paid invoices topics pdf. This layout presents information on supplier compensation due tracking dashboard with paid invoices. It is also available for immediate download and adjustment. So, changes can be made in the color, design, graphics or any other component to create a unique layout.
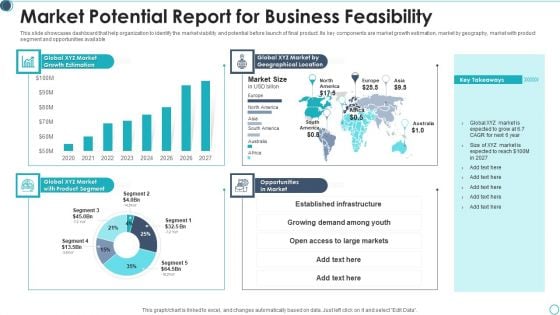
Market Potential Report For Business Feasibility Pictures PDF
This slide showcases dashboard that help organization to identify the market viability and potential before launch of final product. Its key components are market growth estimation, market by geography, market with product segment and opportunities available Pitch your topic with ease and precision using this market potential report for business feasibility pictures pdf This layout presents information on geographical location, opportunities in market, growth estimation It is also available for immediate download and adjustment. So, changes can be made in the color, design, graphics or any other component to create a unique layout.
OEM Spare Parts Sales Tracking Dashboard Ppt PowerPoint Presentation Gallery Inspiration PDF
This slide showcases dashboard that can help organization to keep track of aftermarket components sales. Its key elements are sold quantity per spare part and deviation of sold units. Pitch your topic with ease and precision using this oem spare parts sales tracking dashboard ppt powerpoint presentation gallery inspiration pdf. This layout presents information on sold quantity, budgeted quantity, quantity ytd ly. It is also available for immediate download and adjustment. So, changes can be made in the color, design, graphics or any other component to create a unique layout.
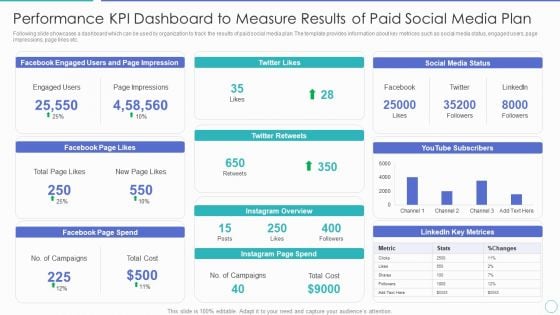
Performance KPI Dashboard To Measure Results Of Paid Social Media Plan Ppt PowerPoint Presentation Gallery Format Ideas PDF
Following slide showcases a dashboard which can be used by organization to track the results of paid social media plan. The template provides information about key metrices such as social media status, engaged users, page impressions, page likes etc. Pitch your topic with ease and precision using this performance kpi dashboard to measure results of paid social media plan ppt powerpoint presentation gallery format ideas pdf. This layout presents information on social media status, instagram page spend, facebook page spend, facebook page likes. It is also available for immediate download and adjustment. So, changes can be made in the color, design, graphics or any other component to create a unique layout.

Cyber Phishing Scams And Attacks Dashboard With Improvement Curve Sample PDF
Mentioned slide showcases a comprehensive dashboard used to measure the cyber phishing attacks. Information covered in this slide is related to organization health risk, attack vendors, most vulnerable employees to attacks, improvement curve. Pitch your topic with ease and precision using this cyber phishing scams and attacks dashboard with improvement curve sample pdf. This layout presents information on cyber phishing scams and attacks dashboard with improvement curve. It is also available for immediate download and adjustment. So, changes can be made in the color, design, graphics or any other component to create a unique layout.
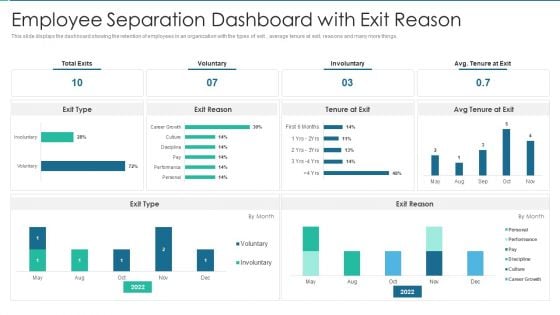
Employee Separation Dashboard With Exit Reason Rules PDF
This slide displays the dashboard showing the retention of employees in an organization with the types of exit , average tenure at exit, reasons and many more things. Pitch your topic with ease and precision using this Employee Separation Dashboard With Exit Reason Rules PDF This layout presents information on Employee Separation Dashboard With Exit Reason It is also available for immediate download and adjustment. So, changes can be made in the color, design, graphics or any other component to create a unique layout.
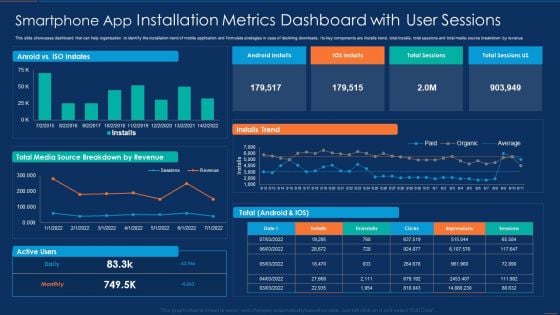
Smartphone App Installation Metrics Dashboard With User Sessions Microsoft PDF
This slide showcases dashboard that can help organization to identify the installation trend of mobile application and formulate strategies in case of declining downloads. Its key components are installs trend, total installs, total sessions and total media source breakdown by revenue. Pitch your topic with ease and precision using this Smartphone App Installation Metrics Dashboard With User Sessions Microsoft PDF. This layout presents information on Smartphone App Installation Metrics Dashboard With User Sessions. It is also available for immediate download and adjustment. So, changes can be made in the color, design, graphics or any other component to create a unique layout.
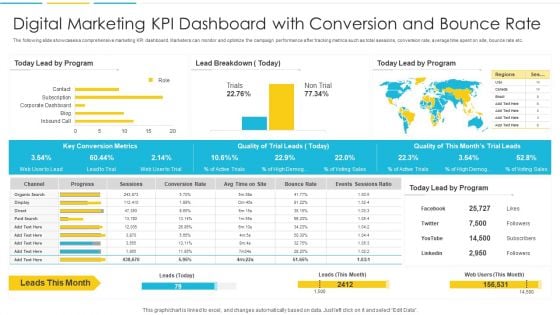
Digital Marketing KPI Dashboard With Conversion And Bounce Rate Introduction PDF
The following slide showcases a comprehensive marketing KPI dashboard. Marketers can monitor and optimize the campaign performance after tracking metrics such as total sessions, conversion rate, average time spent on site, bounce rate etc. Pitch your topic with ease and precision using this Digital Marketing KPI Dashboard With Conversion And Bounce Rate Introduction PDF. This layout presents information on Organic, Progress, Conversion Rate. It is also available for immediate download and adjustment. So, changes can be made in the color, design, graphics or any other component to create a unique layout
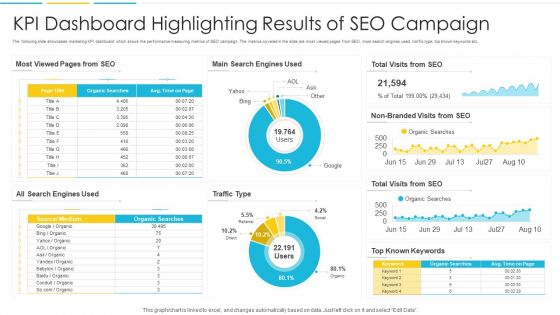
KPI Dashboard Highlighting Results Of SEO Campaign Topics PDF
The following slide showcases marketing KPI dashboard which shows the performance measuring metrics of SEO campaign. The metrics covered in the slide are most viewed pages from SEO, most search engines used, traffic type, top known keywords etc. Pitch your topic with ease and precision using this KPI Dashboard Highlighting Results Of SEO Campaign Topics PDF. This layout presents information on Search Engines, Traffic, Organic. It is also available for immediate download and adjustment. So, changes can be made in the color, design, graphics or any other component to create a unique layout.
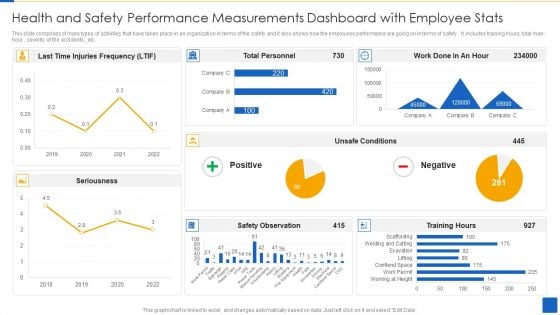
Health And Safety Performance Measurements Dashboard With Employee Stats Template PDF
This slide comprises of many types of activities that have taken place in an organization in terms of the safety and it also shows how the employees performance are going on in terms of safety . It includes training hours, total man-hour , severity of the accidents , etc.Pitch your topic with ease and precision using this Health And Safety Performance Measurements Dashboard With Employee Stats Template PDF This layout presents information on Safety Observation, Injuries Frequency, Unsafe Conditions It is also available for immediate download and adjustment. So, changes can be made in the color, design, graphics or any other component to create a unique layout.
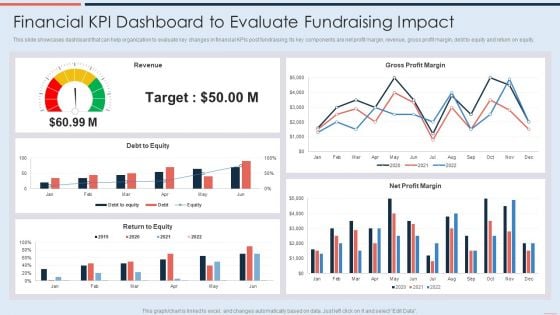
Financial Kpi Dashboard To Evaluate Fundraising Impact Demonstration PDF
This slide showcases dashboard that can help organization to evaluate key changes in financial KPIs post fundraising. Its key components are net profit margin, revenue, gross profit margin, debt to equity and return on equity. Deliver and pitch your topic in the best possible manner with this Financial Kpi Dashboard To Evaluate Fundraising Impact Demonstration PDF. Use them to share invaluable insights on Debt To Equity, Revenue, Gross Profit Margin and impress your audience. This template can be altered and modified as per your expectations. So, grab it now.
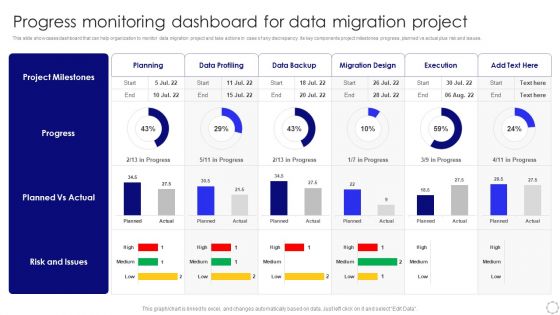
Progress Monitoring Dashboard For Data Migration Project Sample PDF
This slide showcases dashboard that can help organization to monitor data migration project and take actions in case of any discrepancy. Its key components project milestones progress, planned vs actual plus risk and issues. Pitch your topic with ease and precision using this Progress Monitoring Dashboard For Data Migration Project Sample PDF. This layout presents information on Planned Vs Actual, Risk And Issues, Project Milestones. It is also available for immediate download and adjustment. So, changes can be made in the color, design, graphics or any other component to create a unique layout.
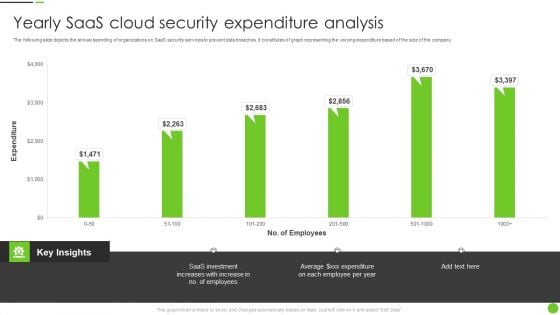
Yearly Saas Cloud Security Expenditure Analysis Ppt PowerPoint Presentation File Deck PDF
The following slide depicts the annual spending of organizations on SaaS security services to prevent data breaches. It constitutes of graph representing the varying expenditure based of the size of the company. Pitch your topic with ease and precision using this Yearly Saas Cloud Security Expenditure Analysis Ppt PowerPoint Presentation File Deck PDF. This layout presents information on Saas Investment, Employees. It is also available for immediate download and adjustment. So, changes can be made in the color, design, graphics or any other component to create a unique layout.
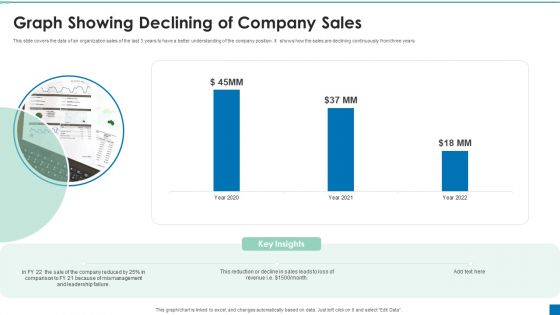
Graph Showing Declining Of Company Sales Ppt PowerPoint Presentation Portfolio Graphics Example PDF
This slide covers the data of an organization sales of the last 3 years to have a better understanding of the company position. It shows how the sales are declining continuously from three years.Pitch your topic with ease and precision using this Graph Showing Declining Of Company Sales Ppt PowerPoint Presentation Portfolio Graphics Example PDF. This layout presents information on Reduction Decline, Comparison, Mismanagement. It is also available for immediate download and adjustment. So, changes can be made in the color, design, graphics or any other component to create a unique layout.
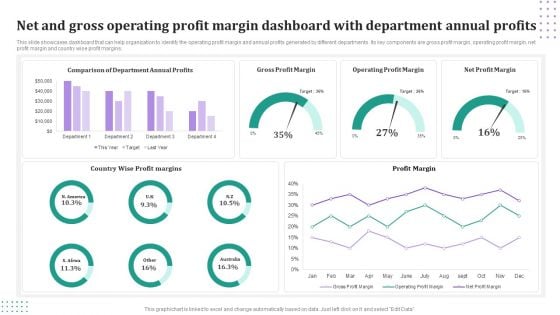
Net And Gross Operating Profit Margin Dashboard With Department Annual Profits Mockup PDF
This slide showcases dashboard that can help organization to identify the operating profit margin and annual profits generated by different departments. Its key components are gross profit margin, operating profit margin, net profit margin and country wise profit margins. Pitch your topic with ease and precision using this Net And Gross Operating Profit Margin Dashboard With Department Annual Profits Mockup PDF. This layout presents information on Gross Profit Margin, Operating Profit Margin, Net Profit Margin. It is also available for immediate download and adjustment. So, changes can be made in the color, design, graphics or any other component to create a unique layout.
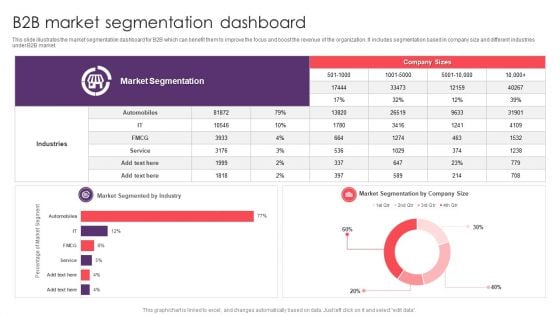
B2B Market Segmentation Dashboard Microsoft PDF
This slide illustrates the market segmentation dashboard for B2B which can benefit them to improve the focus and boost the revenue of the organization. It includes segmentation based in company size and different industries under B2B market. Pitch your topic with ease and precision using this B2B Market Segmentation Dashboard Microsoft PDF. This layout presents information on Industries, Market Segmentation, Service. It is also available for immediate download and adjustment. So, changes can be made in the color, design, graphics or any other component to create a unique layout.
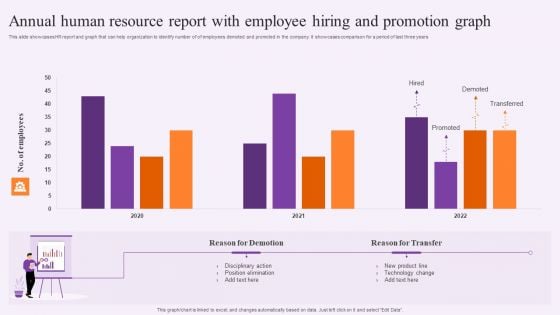
Annual Human Resource Report With Employee Hiring And Promotion Graph Mockup PDF
This slide showcases HR report and graph that can help organization to identify number of of employees demoted and promoted in the company. It showcases comparison for a period of last three years. Pitch your topic with ease and precision using this Annual Human Resource Report With Employee Hiring And Promotion Graph Mockup PDF. This layout presents information on Technology, Product, Employees. It is also available for immediate download and adjustment. So, changes can be made in the color, design, graphics or any other component to create a unique layout.
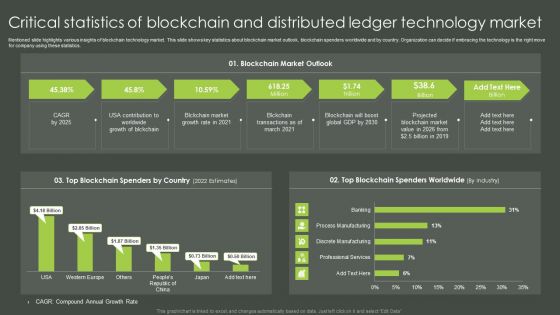
Critical Statistics Of Blockchain And Distributed Ledger Technology Market Structure PDF
Mentioned slide highlights various insights of blockchain technology market. This slide shows key statistics about blockchain market outlook, blockchain spenders worldwide and by country. Organization can decide if embracing the technology is the right move for company using these statistics. Pitch your topic with ease and precision using this Critical Statistics Of Blockchain And Distributed Ledger Technology Market Structure PDF. This layout presents information on USA Contribution, Projected Blockchain, Market Value. It is also available for immediate download and adjustment. So, changes can be made in the color, design, graphics or any other component to create a unique layout.
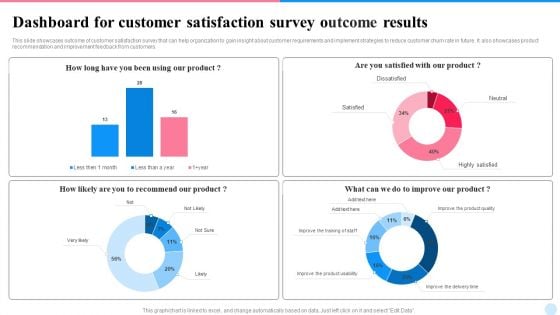
Dashboard For Customer Satisfaction Survey Outcome Results Topics PDF
This slide showcases outcome of customer satisfaction survey that can help organization to gain insight about customer requirements and implement strategies to reduce customer churn rate in future. It also showcases product recommendation and improvement feedback from customers. Pitch your topic with ease and precision using this Dashboard For Customer Satisfaction Survey Outcome Results Topics PDF. This layout presents information on Dashboard, Customer Satisfaction, Survey Outcome Results. It is also available for immediate download and adjustment. So, changes can be made in the color, design, graphics or any other component to create a unique layout.
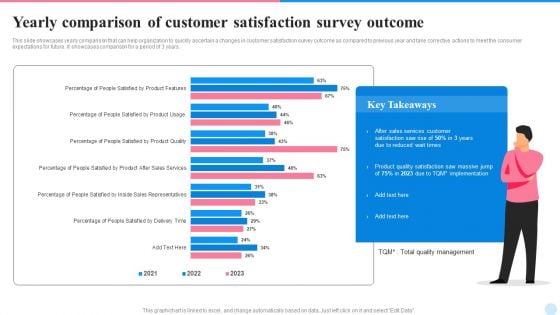
Yearly Comparison Of Customer Satisfaction Survey Outcome Demonstration PDF
This slide showcases yearly comparison that can help organization to quickly ascertain a changes in customer satisfaction survey outcome as compared to previous year and take corrective actions to meet the consumer expectations for future. It showcases comparison for a period of 3 years. Showcasing this set of slides titled Yearly Comparison Of Customer Satisfaction Survey Outcome Demonstration PDF. The topics addressed in these templates are Sales Services Customer, Implementation, Product Quality Satisfaction. All the content presented in this PPT design is completely editable. Download it and make adjustments in color, background, font etc. as per your unique business setting.
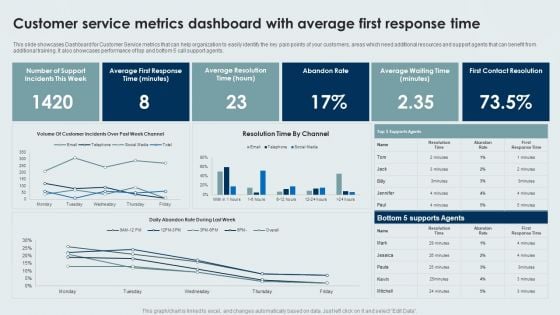
Customer Service Metrics Dashboard With Average First Response Time Background PDF
This slide showcases Dashboard for Customer Service metrics that can help organization to easily identify the key pain points of your customers, areas which need additional resources and support agents that can benefit from additional training. It also showcases performance of top and bottom 5 call support agents. Pitch your topic with ease and precision using this Customer Service Metrics Dashboard With Average First Response Time Background PDF. This layout presents information on Average, Abandon Rate, Contact Resolution. It is also available for immediate download and adjustment. So, changes can be made in the color, design, graphics or any other component to create a unique layout.
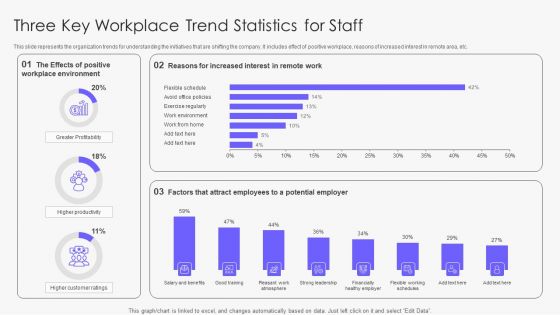
Three Key Workplace Trend Statistics For Staff Slides PDF
This slide represents the organization trends for understanding the initiatives that are shifting the company. It includes effect of positive workplace, reasons of increased interest in remote area, etc. Pitch your topic with ease and precision using this Three Key Workplace Trend Statistics For Staff Slides PDF. This layout presents information on Workplace Environment, Greater Profitability, Customer. It is also available for immediate download and adjustment. So, changes can be made in the color, design, graphics or any other component to create a unique layout.
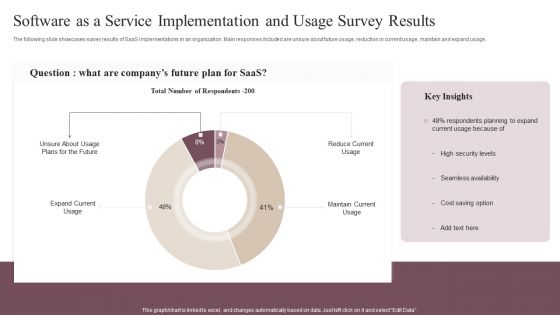
Software As A Service Implementation And Usage Survey Results Clipart PDF
The following slide showcases survey results of SaaS implementations in an organization. Main responses included are unsure about future usage, reduction in current usage, maintain and expand usage. Pitch your topic with ease and precision using this Software As A Service Implementation And Usage Survey Results Clipart PDF. This layout presents information on Reduce Current Usage, Maintain Current Usage, Expand Current Usage . It is also available for immediate download and adjustment. So, changes can be made in the color, design, graphics or any other component to create a unique layout.
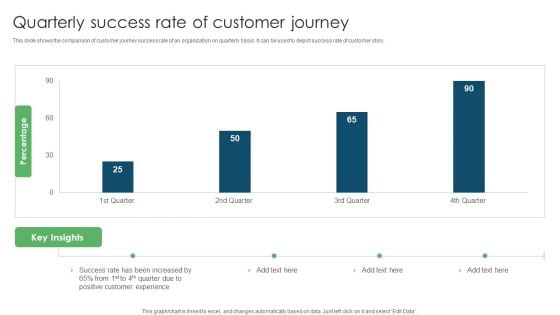
Quarterly Success Rate Of Customer Journey Ppt PowerPoint Presentation Outline Mockup PDF
This slide shows the comparison of customer journey success rate of an organization on quarterly basis. It can be used to depict success rate of customer story. Pitch your topic with ease and precision using this Quarterly Success Rate Of Customer Journey Ppt PowerPoint Presentation Outline Mockup PDF. This layout presents information on Success Rate, Increased Positive, Customer Experience. It is also available for immediate download and adjustment. So, changes can be made in the color, design, graphics or any other component to create a unique layout.
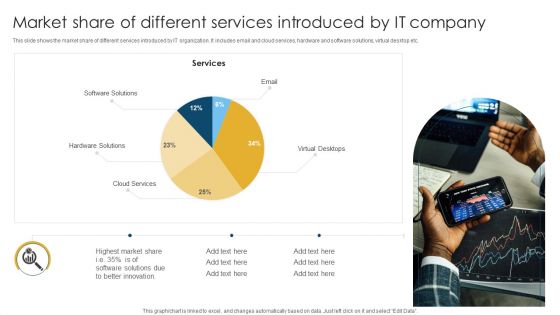
Market Share Of Different Services Introduced By IT Company Download PDF
This slide shows the market share of different services introduced by IT organization. It includes email and cloud services, hardware and software solutions, virtual desktop etc. Pitch your topic with ease and precision using this Market Share Of Different Services Introduced By IT Company Download PDF. This layout presents information on Software Solutions, Hardware Solutions, Highest Market. It is also available for immediate download and adjustment. So, changes can be made in the color, design, graphics or any other component to create a unique layout.
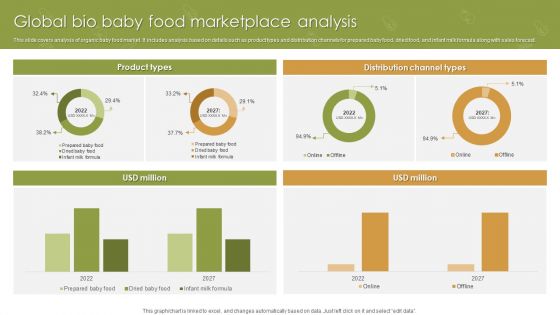
Global Bio Baby Food Marketplace Analysis Ppt Ideas Gallery PDF
This slide covers analysis of organic baby food market. It includes analysis based on details such as product types and distribution channels for prepared baby food, dried food, and infant milk formula along with sales forecast. Pitch your topic with ease and precision using this Global Bio Baby Food Marketplace Analysis Ppt Ideas Gallery PDF. This layout presents information on Product Types, Distribution Channel Types, USD Million. It is also available for immediate download and adjustment. So, changes can be made in the color, design, graphics or any other component to create a unique layout.
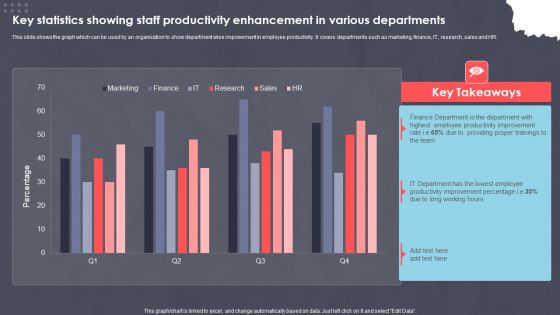
Key Statistics Showing Staff Productivity Enhancement In Various Departments Ppt PowerPoint Presentation Slides Portrait PDF
This slide shows the graph which can be used by an organization to show department wise improvement in employee productivity. It covers departments such as marketing, finance, IT, research, sales and HR. Pitch your topic with ease and precision using this Key Statistics Showing Staff Productivity Enhancement In Various Departments Ppt PowerPoint Presentation Slides Portrait PDF. This layout presents information on XXXXXXXXXXXXXXXXXXXXXXXXX. It is also available for immediate download and adjustment. So, changes can be made in the color, design, graphics or any other component to create a unique layout.
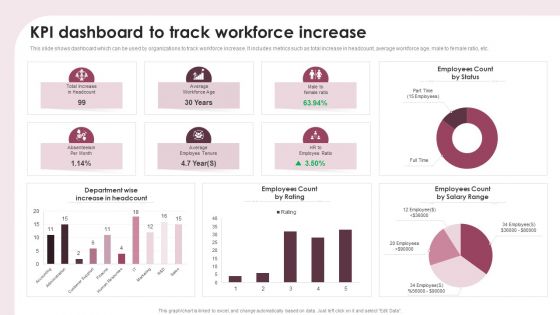
KPI Dashboard To Track Workforce Increase Ppt Show Portfolio PDF
This slide shows dashboard which can be used by organizations to track workforce increase. It includes metrics such as total increase in headcount, average workforce age, male to female ratio, etc. Pitch your topic with ease and precision using this KPI Dashboard To Track Workforce Increase Ppt Show Portfolio PDF. This layout presents information on Department Wise, Increase Headcount, Employees Count Rating. It is also available for immediate download and adjustment. So, changes can be made in the color, design, graphics or any other component to create a unique layout.
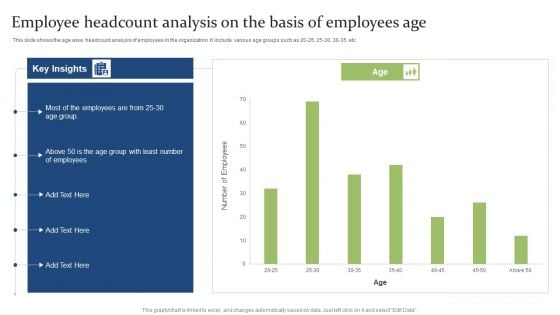
Employee Headcount Analysis On The Basis Of Employees Age Ppt PowerPoint Presentation Model Ideas PDF
This slide shows the age wise headcount analysis of employees in the organization. It include various age groups such as 20 25, 25 30, 30 35, etc.Pitch your topic with ease and precision using this Employee Headcount Analysis On The Basis Of Employees Age Ppt PowerPoint Presentation Model Ideas PDF. This layout presents information on Employee Headcount, Analysis Basis, Employees Age. It is also available for immediate download and adjustment. So, changes can be made in the color, design, graphics or any other component to create a unique layout.
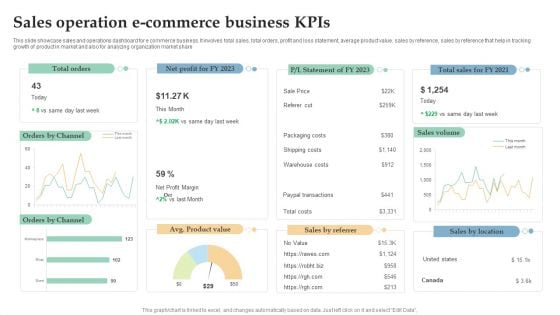
Sales Operation E Commerce Business Kpis Ppt Infographics Design Templates PDF
This slide showcase sales and operations dashboard for e commerce business. It involves total sales, total orders, profit and loss statement, average product value, sales by reference, sales by reference that help in tracking growth of product in market and also for analyzing organization market share. Pitch your topic with ease and precision using this Sales Operation E Commerce Business Kpis Ppt Infographics Design Templates PDF. This layout presents information on Total Orders, Sales Volume, Orders Channel. It is also available for immediate download and adjustment. So, changes can be made in the color, design, graphics or any other component to create a unique layout.
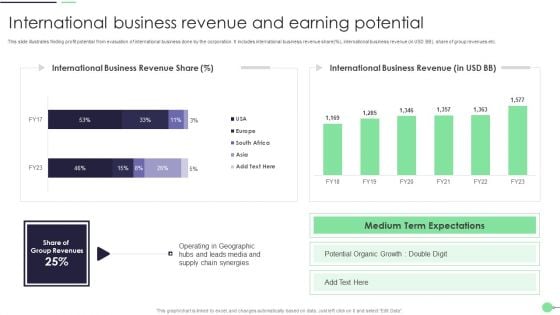
International Business Revenue And Earning Potential Guidelines PDF
This slide illustrates finding profit potential from evaluation of international business done by the corporation. It includes international business revenue share percent, international business revenue in USD BB, share of group revenues etc. Pitch your topic with ease and precision using this International Business Revenue And Earning Potential Guidelines PDF. This layout presents information on Potential Organic Growth, Supply Chain. It is also available for immediate download and adjustment. So, changes can be made in the color, design, graphics or any other component to create a unique layout.
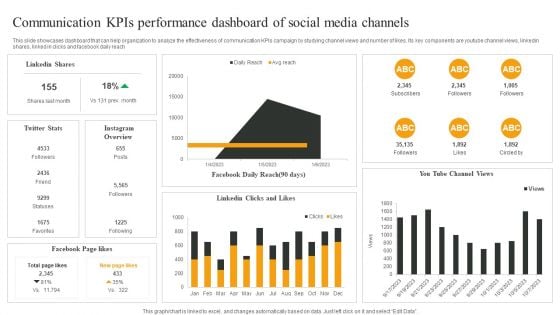
Communication Kpis Performance Dashboard Of Social Media Channels Mockup PDF
This slide showcases dashboard that can help organization to analyze the effectiveness of communication KPIs campaign by studying channel views and number of likes. Its key components are youtube channel views, linkedin shares, linked in clicks and facebook daily reach. Pitch your topic with ease and precision using this Communication Kpis Performance Dashboard Of Social Media Channels Mockup PDF. This layout presents information on Linkedin Shares, Facebook Page likes, Facebook Daily Reach. It is also available for immediate download and adjustment. So, changes can be made in the color, design, graphics or any other component to create a unique layout.
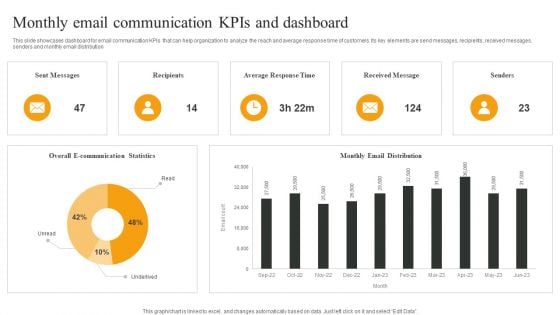
Monthly Email Communication Kpis And Dashboard Download PDF
This slide showcases dashboard for email communication KPIs that can help organization to analyze the reach and average response time of customers. Its key elements are send messages, recipients, received messages, senders and monthly email distribution. Pitch your topic with ease and precision using this Monthly Email Communication Kpis And Dashboard Download PDF. This layout presents information on Sent Messages, Recipients, Average Response Time, Received Message. It is also available for immediate download and adjustment. So, changes can be made in the color, design, graphics or any other component to create a unique layout.
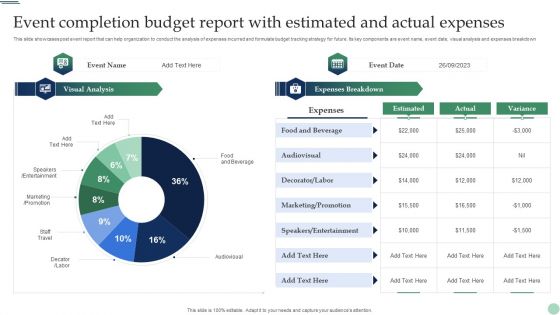
Event Completion Budget Report With Estimated And Actual Expenses Pictures PDF
This slide showcases post event report that can help organization to conduct the analysis of expenses incurred and formulate budget tracking strategy for future. Its key components are event name, event date, visual analysis and expenses breakdown. Pitch your topic with ease and precision using this Event Completion Budget Report With Estimated And Actual Expenses Pictures PDF. This layout presents information on Food And Beverage, Audiovisual, Marketing, Entertainment. It is also available for immediate download and adjustment. So, changes can be made in the color, design, graphics or any other component to create a unique layout.
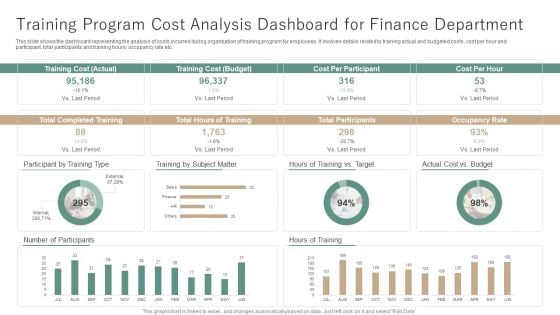
Training Program Cost Analysis Dashboard For Finance Department Ppt Example PDF
This slide shows the dashboard representing the analysis of costs incurred during organization of training program for employees. It involves details related to training actual and budgeted costs, cost per hour and participant, total participants and training hours, occupancy rate etc. Pitch your topic with ease and precision using this Training Program Cost Analysis Dashboard For Finance Department Ppt Example PDF. This layout presents information on Training Cost, Number Participants, Hours Of Training. It is also available for immediate download and adjustment. So, changes can be made in the color, design, graphics or any other component to create a unique layout.
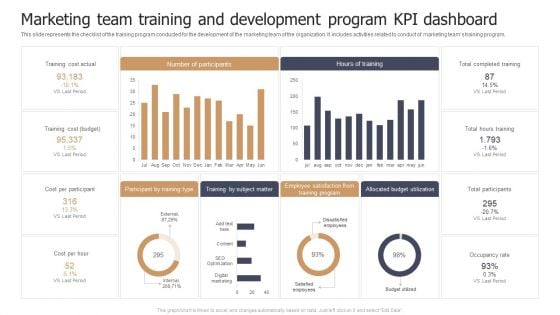
Marketing Team Training And Development Program KPI Dashboard Designs PDF
This slide represents the checklist of the training program conducted for the development of the marketing team of the organization. It includes activities related to conduct of marketing teams training program. Pitch your topic with ease and precision using this Marketing Team Training And Development Program KPI Dashboard Designs PDF. This layout presents information on Training Cost Actual, Cost Per Participant, Cost Per Hour. It is also available for immediate download and adjustment. So, changes can be made in the color, design, graphics or any other component to create a unique layout.

Financial Highlights For Construction Company Yearly Report Template PDF
This slide showcases report for construction company annual financial highlights that can help in analyzing the financial health of organization and help investors to make informed decisions. It outlines information about turnover, profit before tax, profit after, equity capital and reserves. Pitch your topic with ease and precision using this Financial Highlights For Construction Company Yearly Report Template PDF. This layout presents information on Reserve And Surplus, Profit, Turnover. It is also available for immediate download and adjustment. So, changes can be made in the color, design, graphics or any other component to create a unique layout.
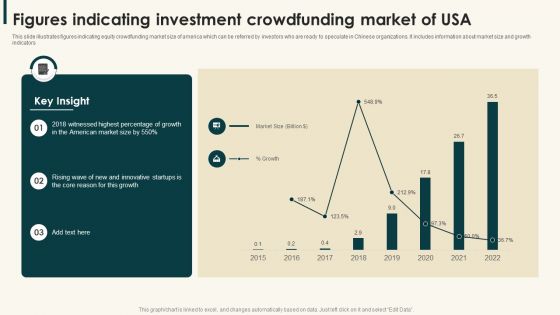
Figures Indicating Investment Crowdfunding Market Of Usa Information PDF
This slide illustrates figures indicating equity crowdfunding market size of america which can be referred by investors who are ready to speculate in Chinese organizations. It includes information about market size and growth indicators,Pitch your topic with ease and precision using this Figures Indicating Investment Crowdfunding Market Of Usa Information PDF. This layout presents information on Witnessed Highest, American Market, Innovative Startups. It is also available for immediate download and adjustment. So, changes can be made in the color, design, graphics or any other component to create a unique layout.
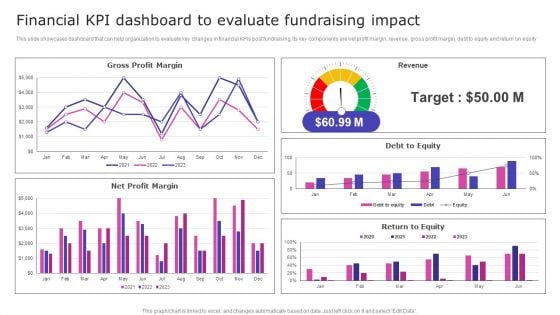
Strategic Fund Acquisition Plan For Business Opertions Expansion Financial KPI Dashboard To Evaluate Fundraising Impact Guidelines PDF
This slide showcases dashboard that can help organization to evaluate key changes in financial KPIs post fundraising. Its key components are net profit margin, revenue, gross profit margin, debt to equity and return on equity. There are so many reasons you need a Strategic Fund Acquisition Plan For Business Opertions Expansion Financial KPI Dashboard To Evaluate Fundraising Impact Guidelines PDF. The first reason is you can not spend time making everything from scratch, Thus, Slidegeeks has made presentation templates for you too. You can easily download these templates from our website easily.
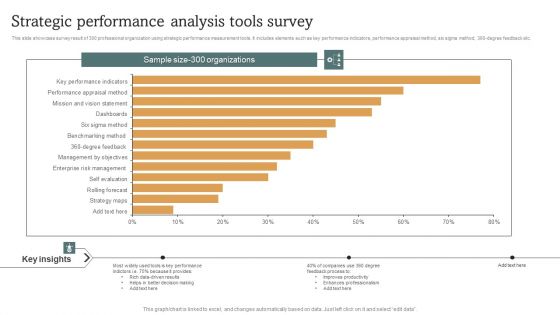
Strategic Performance Analysis Tools Survey Microsoft PDF
This slide showcase survey result of 300 professional organization using strategic performance measurement tools. It includes elements such as key performance indicators, performance appraisal method, six sigma method, 360 degree feedback etc. Pitch your topic with ease and precision using this Strategic Performance Analysis Tools Survey Microsoft PDF. This layout presents information on Strategic Performance, Analysis Tools Survey. It is also available for immediate download and adjustment. So, changes can be made in the color, design, graphics or any other component to create a unique layout.
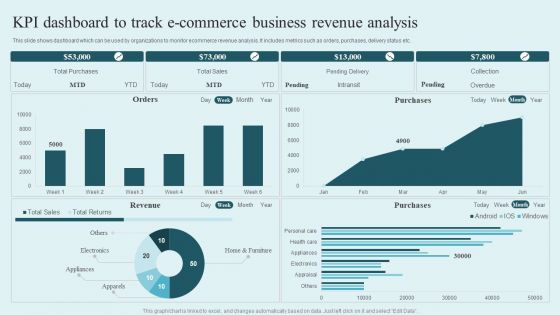
KPI Dashboard To Track E Commerce Business Revenue Analysis Rules PDF
This slide shows dashboard which can be used by organizations to monitor ecommerce revenue analysis. It includes metrics such as orders, purchases, delivery status etc. Pitch your topic with ease and precision using this KPI Dashboard To Track E Commerce Business Revenue Analysis Rules PDF. This layout presents information on Total Purchases, Total Sales, Pending Delivery, Collection. It is also available for immediate download and adjustment. So, changes can be made in the color, design, graphics or any other component to create a unique layout.
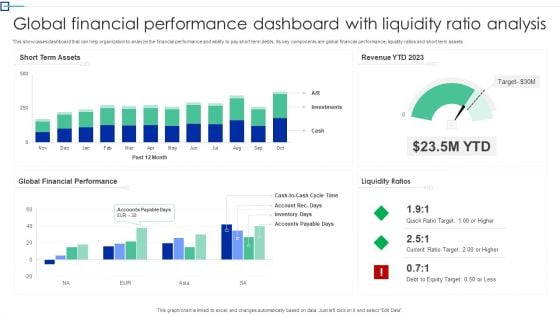
Global Financial Performance Dashboard With Liquidity Ratio Analysis Information PDF
This showcases dashboard that can help organization to analyze the financial performance and ability to pay short term debts. Its key components are global financial performance, liquidity ratios and short term assets. Pitch your topic with ease and precision using this Global Financial Performance Dashboard With Liquidity Ratio Analysis Information PDF. This layout presents information on Short Term Assets, Global Financial Performance, Liquidity Ratios. It is also available for immediate download and adjustment. So, changes can be made in the color, design, graphics or any other component to create a unique layout.
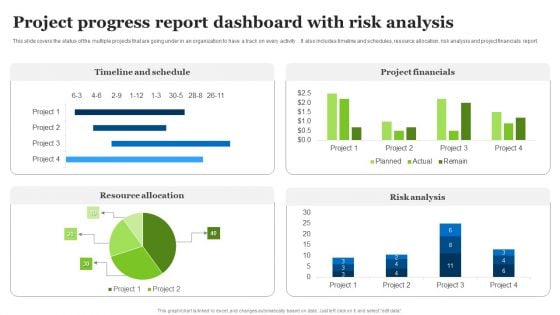
Project Progress Report Dashboard With Risk Analysis Ppt Examples PDF
This slide covers the status of the multiple projects that are going under in an organization to have a track on every activity . It also includes timeline and schedules, resource allocation, risk analysis and project financials report. Pitch your topic with ease and precision using this Project Progress Report Dashboard With Risk Analysis Ppt Examples PDF. This layout presents information on Timeline And Schedule, Project Financials, Risk Analysis. It is also available for immediate download and adjustment. So, changes can be made in the color, design, graphics or any other component to create a unique layout.
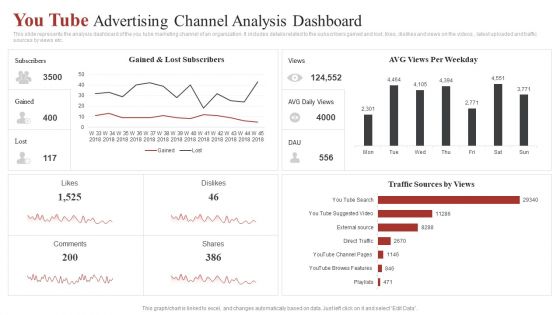
You Tube Advertising Channel Analysis Dashboard Ppt Gallery Clipart Images PDF
This slide represents the analysis dashboard of the you tube marketing channel of an organization. It includes details related to the subscribers gained and lost, likes, dislikes and views on the videos , latest uploaded and traffic sources by views etc. Pitch your topic with ease and precision using this You Tube Advertising Channel Analysis Dashboard Ppt Gallery Clipart Images PDF. This layout presents information on AVG Views, Per Weekday, Traffic Sources Views . It is also available for immediate download and adjustment. So, changes can be made in the color, design, graphics or any other component to create a unique layout.
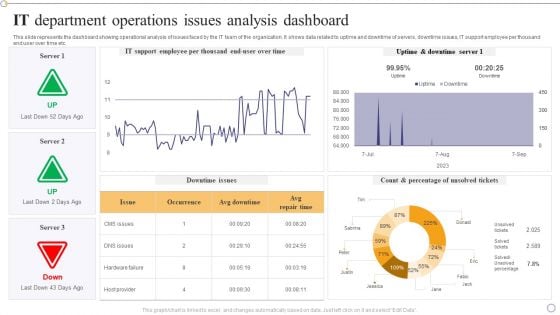
IT Department Operations Issues Analysis Dashboard Designs PDF
This slide represents the dashboard showing operational analysis of issues faced by the IT team of the organization. It shows data related to uptime and downtime of servers, downtime issues, IT support employee per thousand end user over time etc.Pitch your topic with ease and precision using this IT Department Operations Issues Analysis Dashboard Designs PDF. This layout presents information on Support Employee, Uptime Downtime, Percentage Unsolved. It is also available for immediate download and adjustment. So, changes can be made in the color, design, graphics or any other component to create a unique layout.

Manufactured Products Sales Performance Monitoring Dashboard Information PDF
This slide shows the dashboard the data related to the sales performance of the products manufactured by the organization in order to effectively measure and monitor the performance of the sales team. It shows details related to revenue generated and units sold etc.Pitch your topic with ease and precision using this Manufactured Products Sales Performance Monitoring Dashboard Information PDF. This layout presents information on Monthly Revenue, Manufactured Products, Sales Performance Monitoring. It is also available for immediate download and adjustment. So, changes can be made in the color, design, graphics or any other component to create a unique layout.
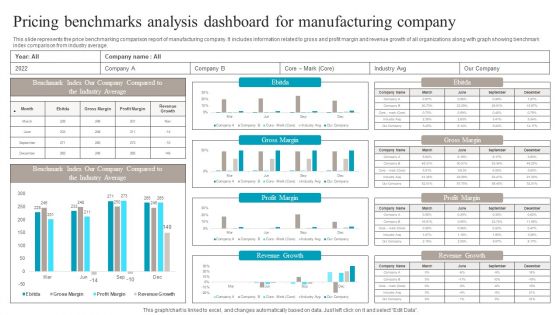
Pricing Benchmarks Analysis Dashboard For Manufacturing Company Structure PDF
This slide represents the price benchmarking comparison report of manufacturing company. It includes information related to gross and profit margin and revenue growth of all organizations along with graph showing benchmark index comparison from industry average. Pitch your topic with ease and precision using this Pricing Benchmarks Analysis Dashboard For Manufacturing Company Structure PDF. This layout presents information on Pricing Benchmarks Analysis, Dashboard For Manufacturing Company. It is also available for immediate download and adjustment. So, changes can be made in the color, design, graphics or any other component to create a unique layout.
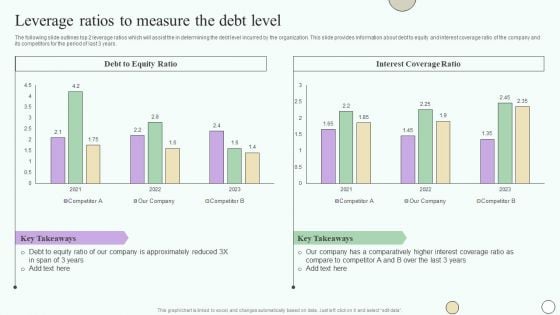
Estimating Business Overall Leverage Ratios To Measure The Debt Level Professional PDF
The following slide outlines top 2 leverage ratios which will assist the in determining the debt level incurred by the organization. This slide provides information about debt to equity and interest coverage ratio of the company and its competitors for the period of last 3 years. If your project calls for a presentation, then Slidegeeks is your go-to partner because we have professionally designed, easy-to-edit templates that are perfect for any presentation. After downloading, you can easily edit Estimating Business Overall Leverage Ratios To Measure The Debt Level Professional PDF and make the changes accordingly. You can rearrange slides or fill them with different images. Check out all the handy templates.
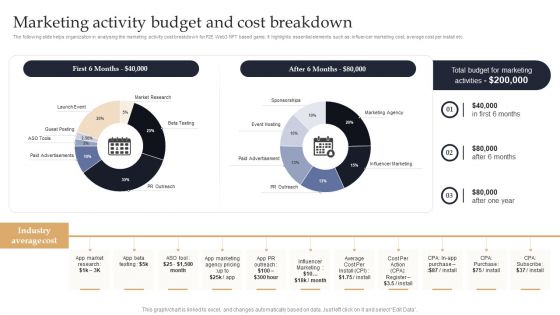
Web 3 0 Blockchain Based P2E Mobile Game Sector Report Promotional Plan Marketing Activity Budget And Cost Clipart PDF
The following slide helps organization in analysing the marketing activity cost breakdown for P2E Web3 NFT based game. It highlights essential elements such as influencer marketing cost, average cost per install etc. If your project calls for a presentation, then Slidegeeks is your go-to partner because we have professionally designed, easy-to-edit templates that are perfect for any presentation. After downloading, you can easily edit Web 3 0 Blockchain Based P2E Mobile Game Sector Report Promotional Plan Marketing Activity Budget And Cost Clipart PDF and make the changes accordingly. You can rearrange slides or fill them with different images. Check out all the handy templates
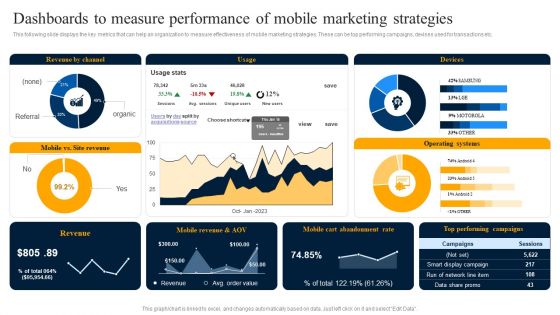
Dashboards To Measure Performance Of Mobile Marketing Strategies Rules PDF
This following slide displays the key metrics that can help an organization to measure effectiveness of mobile marketing strategies. These can be top performing campaigns, devises used for transactions etc. If your project calls for a presentation, then Slidegeeks is your go to partner because we have professionally designed, easy to edit templates that are perfect for any presentation. After downloading, you can easily edit Dashboards To Measure Performance Of Mobile Marketing Strategies Rules PDF and make the changes accordingly. You can rearrange slides or fill them with different images. Check out all the handy templates.
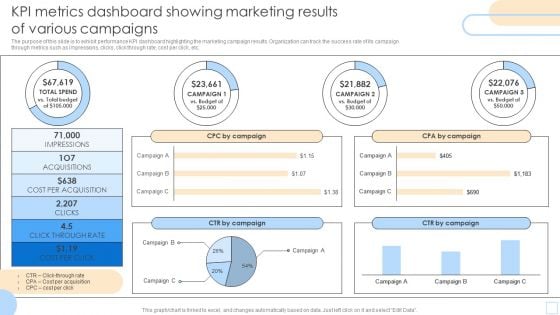
KPI Metrics Dashboard Showing Marketing Results Of Various Campaigns Pictures PDF
The purpose of this slide is to exhibit performance KPI dashboard highlighting the marketing campaign results. Organization can track the success rate of its campaign through metrics such as impressions, clicks, click through rate, cost per click, etc. Pitch your topic with ease and precision using this KPI Metrics Dashboard Showing Marketing Results Of Various Campaigns Pictures PDF. This layout presents information on Impressions, Acquisitions, CPA By Campaign. It is also available for immediate download and adjustment. So, changes can be made in the color, design, graphics or any other component to create a unique layout.
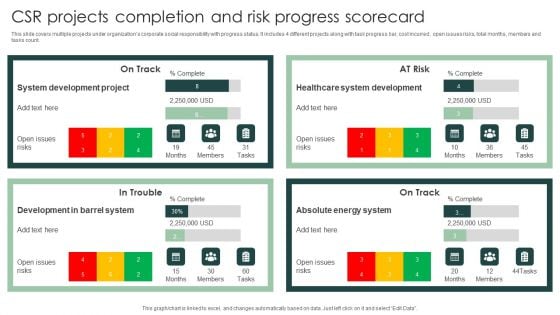
CSR Projects Completion And Risk Progress Scorecard Microsoft PDF
This slide covers multiple projects under organizations corporate social responsibility with progress status. It includes 4 different projects along with task progress bar, cost incurred , open issues risks, total months, members and tasks count.Pitch your topic with ease and precision using this CSR Projects Completion And Risk Progress Scorecard Microsoft PDF. This layout presents information on System Development, Development Barrel, System Development. It is also available for immediate download and adjustment. So, changes can be made in the color, design, graphics or any other component to create a unique layout.
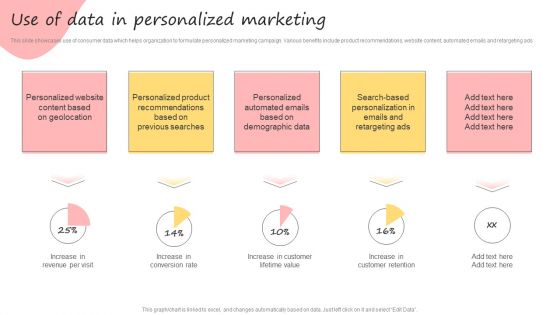
Developing Promotional Strategic Plan For Online Marketing Use Of Data In Personalized Marketing Inspiration PDF
This slide showcases use of consumer data which helps organization to formulate personalized marketing campaign. Various benefits include product recommendations, website content, automated emails and retargeting ads. If your project calls for a presentation, then Slidegeeks is your go-to partner because we have professionally designed, easy-to-edit templates that are perfect for any presentation. After downloading, you can easily edit Developing Promotional Strategic Plan For Online Marketing Use Of Data In Personalized Marketing Inspiration PDF and make the changes accordingly. You can rearrange slides or fill them with different images. Check out all the handy templates
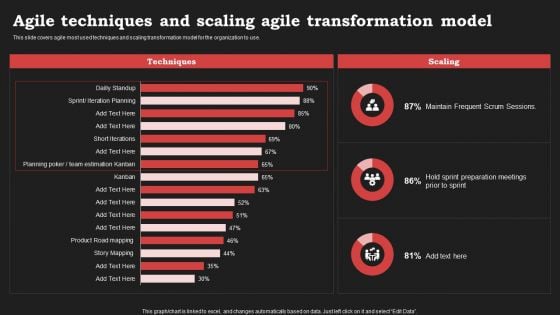
Agile Approach In Information Technology Projects Agile Techniques And Scaling Agile Transformation Model Elements PDF
This slide covers agile most used techniques and scaling transformation model for the organization to use. If your project calls for a presentation, then Slidegeeks is your go-to partner because we have professionally designed, easy-to-edit templates that are perfect for any presentation. After downloading, you can easily edit Agile Approach In Information Technology Projects Agile Techniques And Scaling Agile Transformation Model Elements PDF and make the changes accordingly. You can rearrange slides or fill them with different images. Check out all the handy templates
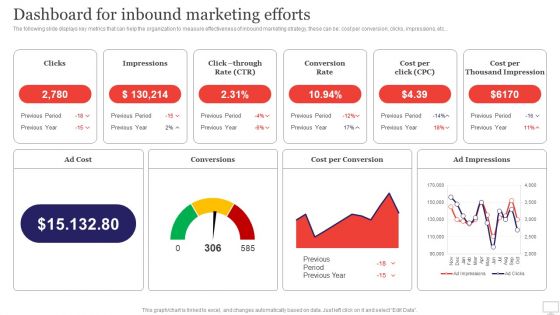
Target Audience Strategy For B2B And B2C Business Dashboard For Inbound Marketing Efforts Graphics PDF
The following slide displays key metrics that can help the organization to measure effectiveness of inbound marketing strategy, these can be cost per conversion, clicks, impressions, etc. If your project calls for a presentation, then Slidegeeks is your go-to partner because we have professionally designed, easy-to-edit templates that are perfect for any presentation. After downloading, you can easily edit Target Audience Strategy For B2B And B2C Business Dashboard For Inbound Marketing Efforts Graphics PDF and make the changes accordingly. You can rearrange slides or fill them with different images. Check out all the handy templates
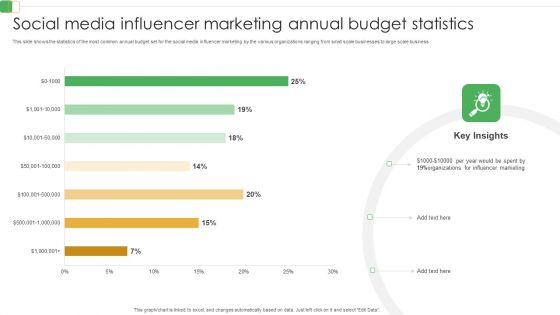
Social Media Influencer Marketing Annual Budget Statistics Ppt PowerPoint Presentation File Professional PDF
This slide shows the statistics of the most common annual budget set for the social media influencer marketing by the various organizations ranging from small scale businesses to large scale business. Pitch your topic with ease and precision using this Social Media Influencer Marketing Annual Budget Statistics Ppt PowerPoint Presentation File Professional PDF. This layout presents information on Social Media, Influencer Marketing, Annual Budget Statistics. It is also available for immediate download and adjustment. So, changes can be made in the color, design, graphics or any other component to create a unique layout.
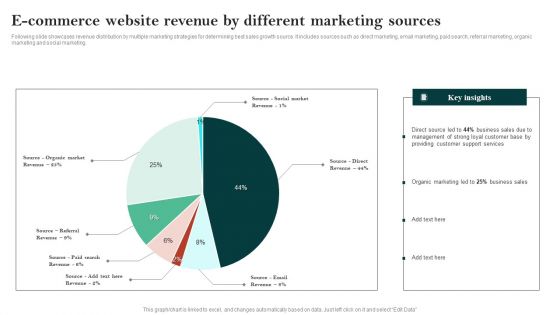
E Commerce Website Revenue By Different Marketing Sources Ppt Ideas PDF
Following slide showcases revenue distribution by multiple marketing strategies for determining best sales growth source. It includes sources such as direct marketing, email marketing, paid search, referral marketing, organic marketing and social marketing. Pitch your topic with ease and precision using this E Commerce Website Pre Launch Checklist Ppt Summary Backgrounds PDF. This layout presents information on Direct Source Led, Business Sales, Customer Base. It is also available for immediate download and adjustment. So, changes can be made in the color, design, graphics or any other component to create a unique layout.
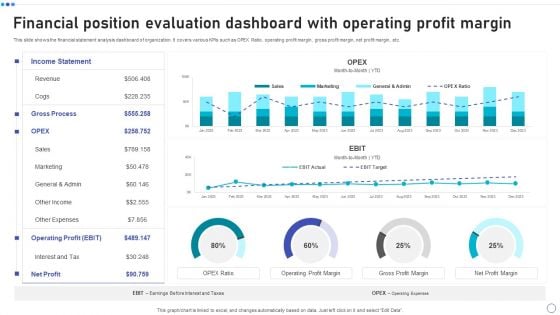
Financial Position Evaluation Dashboard With Operating Profit Margin Elements PDF
This slide shows the financial statement analysis dashboard of organization. It covers various KPIs such as OPEX Ratio, operating profit margin, gross profit margin, net profit margin, etc. Pitch your topic with ease and precision using this Financial Position Evaluation Dashboard With Operating Profit Margin Elements PDF. This layout presents information on Income Statement, Revenue, Operating Profit, Net Profit. It is also available for immediate download and adjustment. So, changes can be made in the color, design, graphics or any other component to create a unique layout.
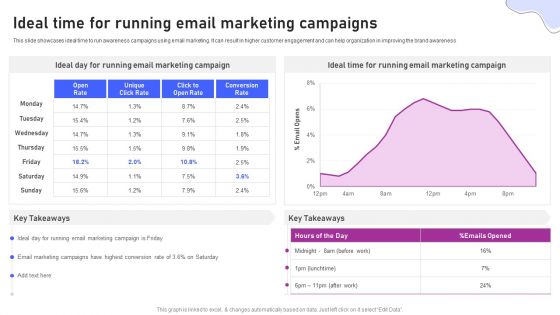
Strategies For Marketing Ideal Time For Running Email Marketing Campaigns Information PDF
This slide showcases ideal time to run awareness campaigns using email marketing. It can result in higher customer engagement and can help organization in improving the brand awareness. If your project calls for a presentation, then Slidegeeks is your go-to partner because we have professionally designed, easy-to-edit templates that are perfect for any presentation. After downloading, you can easily edit Strategies For Marketing Ideal Time For Running Email Marketing Campaigns Information PDF and make the changes accordingly. You can rearrange slides or fill them with different images. Check out all the handy templates
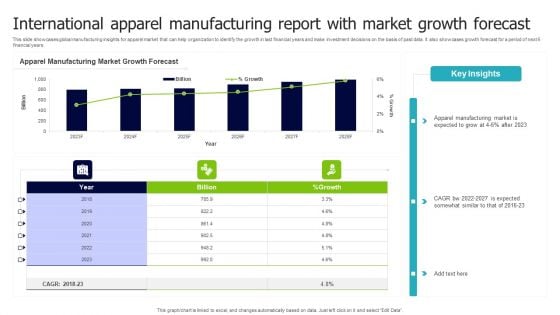
International Apparel Manufacturing Report With Market Growth Forecast Inspiration PDF
This slide showcases global manufacturing insights for apparel market that can help organization to identify the growth in last financial years and make investment decisions on the basis of past data. It also showcases growth forecast for a period of next 6 financial years. Pitch your topic with ease and precision using this International Apparel Manufacturing Report With Market Growth Forecast Inspiration PDF. This layout presents information on Apparel Manufacturing, Market Growth Forecast, Billion. It is also available for immediate download and adjustment. So, changes can be made in the color, design, graphics or any other component to create a unique layout.
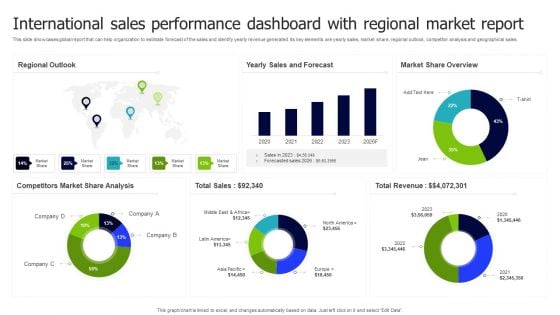
International Sales Performance Dashboard With Regional Market Report Inspiration PDF
This slide showcases global report that can help organization to estimate forecast of the sales and identify yearly revenue generated. Its key elements are yearly sales, market share, regional outlook, competitor analysis and geographical sales. Pitch your topic with ease and precision using this International Sales Performance Dashboard With Regional Market Report Inspiration PDF. This layout presents information on Regional Outlook, Sales And Forecast, Market Share Overview. It is also available for immediate download and adjustment. So, changes can be made in the color, design, graphics or any other component to create a unique layout.
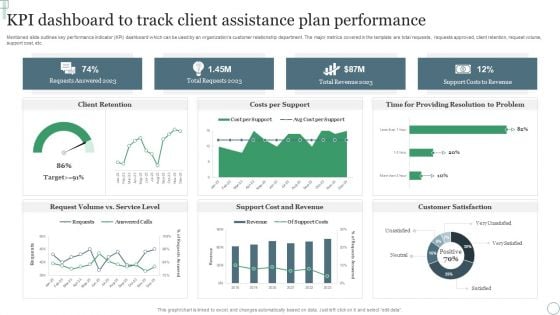
KPI Dashboard To Track Client Assistance Plan Performance Ppt Professional Outfit PDF
Mentioned slide outlines key performance indicator KPI dashboard which can be used by an organizations customer relationship department. The major metrics covered in the template are total requests, requests approved, client retention, request volume, support cost, etc. Pitch your topic with ease and precision using this KPI Dashboard To Track Client Assistance Plan Performance Ppt Professional Outfit PDF. This layout presents information on Requests Answered 2023, Total Requests 2023, Total Revenue 2023. It is also available for immediate download and adjustment. So, changes can be made in the color, design, graphics or any other component to create a unique layout.
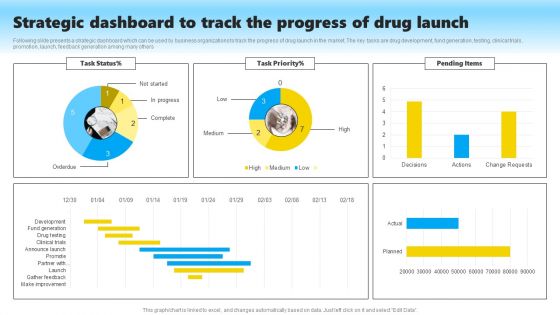
Strategic Dashboard To Track The Progress Of Drug Launch Structure PDF
Following slide presents a strategic dashboard which can be used by business organizations to track the progress of drug launch in the market. The key tasks are drug development, fund generation, testing, clinical trials, promotion, launch, feedback generation among many others. Pitch your topic with ease and precision using this Strategic Dashboard To Track The Progress Of Drug Launch Structure PDF. This layout presents information on Drug Development, Fund Generation, Testing, Clinical Trials, Promotion, Launch, Feedback Generation. It is also available for immediate download and adjustment. So, changes can be made in the color, design, graphics or any other component to create a unique layout.
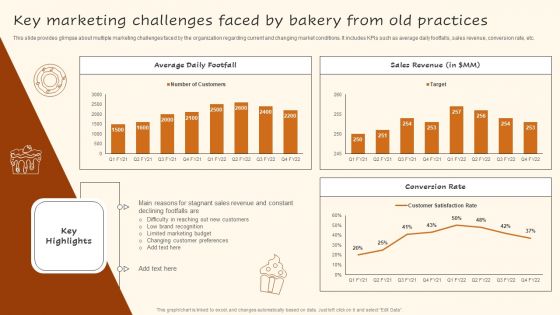
Digital Advertising Plan For Bakery Business Key Marketing Challenges Faced By Bakery Clipart PDF
This slide provides glimpse about multiple marketing challenges faced by the organization regarding current and changing market conditions. It includes KPIs such as average daily footfalls, sales revenue, conversion rate, etc. There are so many reasons you need a Digital Advertising Plan For Bakery Business Key Marketing Challenges Faced By Bakery Clipart PDF. The first reason is you can not spend time making everything from scratch, Thus, Slidegeeks has made presentation templates for you too. You can easily download these templates from our website easily.
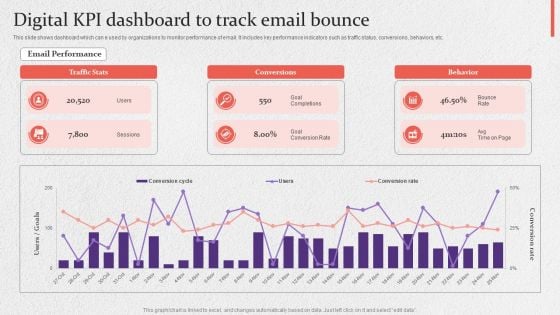
Digital KPI Dashboard To Track Email Bounce Slides PDF
This slide shows dashboard which can e used by organizations to monitor performance of email. It includes key performance indicators such as traffic status, conversions, behaviors, etc. Pitch your topic with ease and precision using this Digital KPI Dashboard To Track Email Bounce Slides PDF. This layout presents information on Digital Kpi Dashboard, Track Email Bounce. It is also available for immediate download and adjustment. So, changes can be made in the color, design, graphics or any other component to create a unique layout.
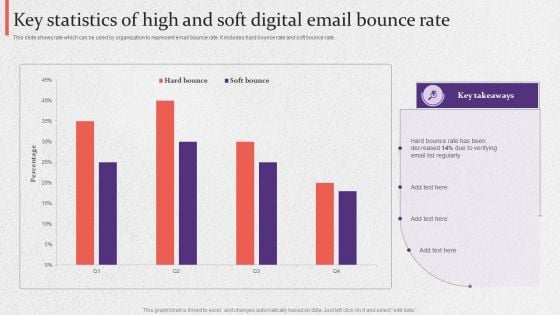
Key Statistics Of High And Soft Digital Email Bounce Rate Summary PDF
This slide shows rate which can be used by organization to represent email bounce rate. It includes hard bounce rate and soft bounce rate. Pitch your topic with ease and precision using this Key Statistics Of High And Soft Digital Email Bounce Rate Summary PDF. This layout presents information on Key Statistics, Soft Digital, Email Bounce Rate. It is also available for immediate download and adjustment. So, changes can be made in the color, design, graphics or any other component to create a unique layout.
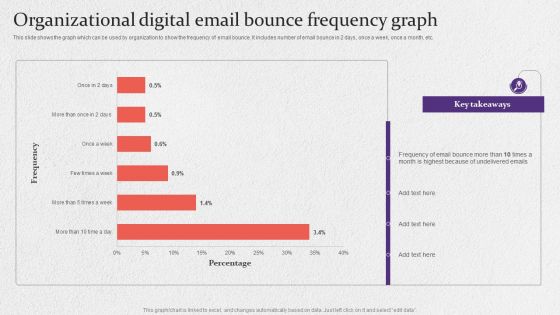
Organizational Digital Email Bounce Frequency Graph Formats PDF
This slide shows the graph which can be used by organization to show the frequency of email bounce. It includes number of email bounce in 2 days, once a week, once a month, etc. Pitch your topic with ease and precision using this Organizational Digital Email Bounce Frequency Graph Formats PDF. This layout presents information on Organizational Digital, Email Bounce Frequency Graph. It is also available for immediate download and adjustment. So, changes can be made in the color, design, graphics or any other component to create a unique layout.
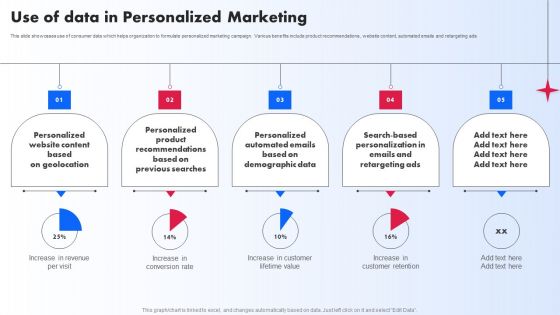
Use Of Data In Personalized Marketing Ppt PowerPoint Presentation File Professional PDF
This slide showcases use of consumer data which helps organization to formulate personalized marketing campaign. Various benefits include product recommendations, website content, automated emails and retargeting ads. If your project calls for a presentation, then Slidegeeks is your go to partner because we have professionally designed, easy to edit templates that are perfect for any presentation. After downloading, you can easily edit Use Of Data In Personalized Marketing Ppt PowerPoint Presentation File Professional PDF and make the changes accordingly. You can rearrange slides or fill them with different images. Check out all the handy templates
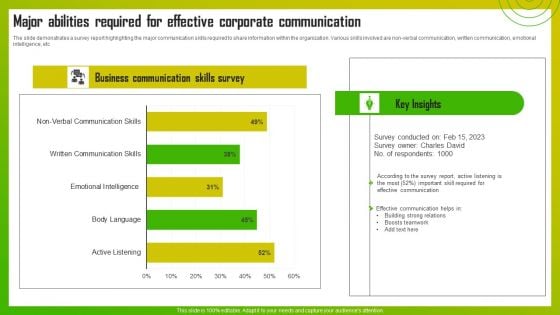
Major Abilities Required For Effective Corporate Communication Template PDF
The slide demonstrates a survey report highlighting the major communication skills required to share information within the organization. Various skills involved are non-verbal communication, written communication, emotional intelligence, etc. Pitch your topic with ease and precision using this Major Abilities Required For Effective Corporate Communication Template PDF. This layout presents information on Effective Communication, Skill Required, Boosts Teamwork. It is also available for immediate download and adjustment. So, changes can be made in the color, design, graphics or any other component to create a unique layout.
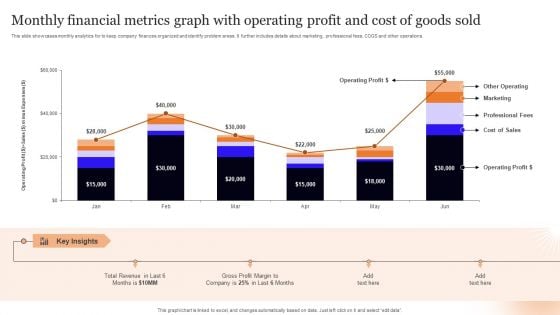
Monthly Financial Metrics Graph With Operating Profit And Cost Of Goods Sold Pictures PDF
This slide showcases monthly analytics for to keep company finances organized and identify problem areas. It further includes details about marketing, professional fees, COGS and other operations. Pitch your topic with ease and precision using this Monthly Financial Metrics Graph With Operating Profit And Cost Of Goods Sold Pictures PDF. This layout presents information on Key Insights, Operating Profit, Total Revenue. It is also available for immediate download and adjustment. So, changes can be made in the color, design, graphics or any other component to create a unique layout.
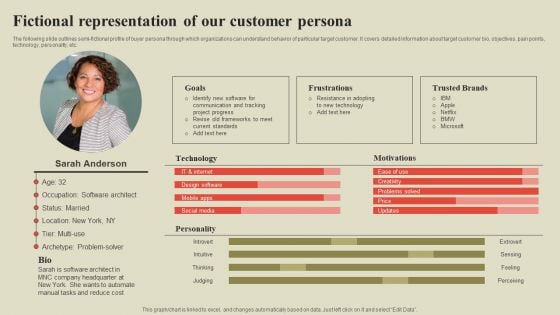
Steps To Effectively Conduct Market Research Fictional Representation Of Our Customer Persona Background PDF
The following slide outlines semi-fictional profile of buyer persona through which organizations can understand behavior of particular target customer. It covers detailed information about target customer bio, objectives, pain points, technology, personality, etc. If your project calls for a presentation, then Slidegeeks is your go to partner because we have professionally designed, easy to edit templates that are perfect for any presentation. After downloading, you can easily edit Steps To Effectively Conduct Market Research Fictional Representation Of Our Customer Persona Background PDF and make the changes accordingly. You can rearrange slides or fill them with different images. Check out all the handy templates
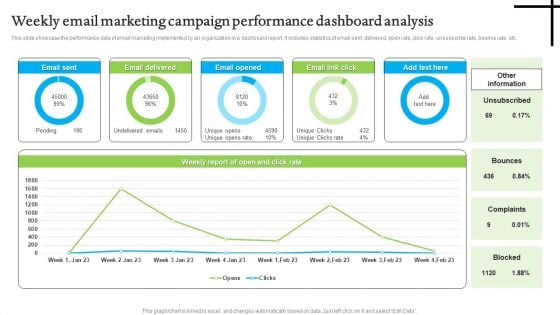
Weekly Email Marketing Campaign Performance Dashboard Analysis Structure PDF
This slide showcase the performance data of email marketing implemented by an organization in a dashboard report. It includes statistics of email sent, delivered, open rate, click rate, unsubscribe rate, bounce rate, etc. Pitch your topic with ease and precision using this Weekly Email Marketing Campaign Performance Dashboard Analysis Structure PDF. This layout presents information on Weekly Email Marketing, Campaign Performance Dashboard Analysis. It is also available for immediate download and adjustment. So, changes can be made in the color, design, graphics or any other component to create a unique layout.
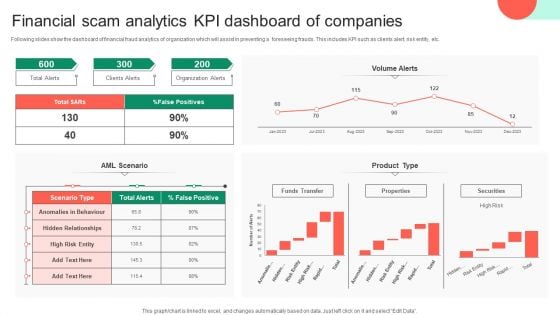
Financial Scam Analytics KPI Dashboard Of Companies Clipart PDF
Following slides show the dashboard of financial fraud analytics of organization which will assist in preventing a foreseeing frauds. This includes KPI such as clients alert, risk entity, etc. Pitch your topic with ease and precision using this Financial Scam Analytics KPI Dashboard Of Companies Clipart PDF. This layout presents information on Financial Scam Analytics, Kpi Dashboard Of Companies. It is also available for immediate download and adjustment. So, changes can be made in the color, design, graphics or any other component to create a unique layout.
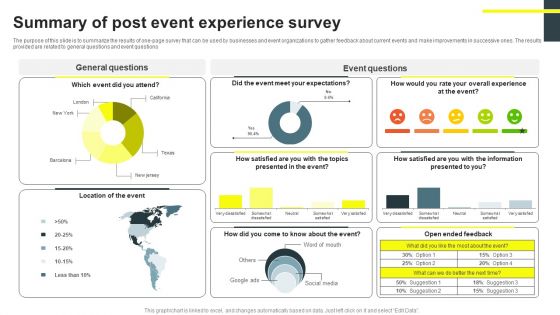
Summary Of Post Event Experience Survey Survey SS
The purpose of this slide is to summarize the results of one-page survey that can be used by businesses and event organizations to gather feedback about current events and make improvements in successive ones. The results provided are related to general questions and event questions. Pitch your topic with ease and precision using this Summary Of Post Event Experience Survey Survey SS. This layout presents information on General Questions, Event Questions, Location Of The Event, Social Media. It is also available for immediate download and adjustment. So, changes can be made in the color, design, graphics or any other component to create a unique layout.
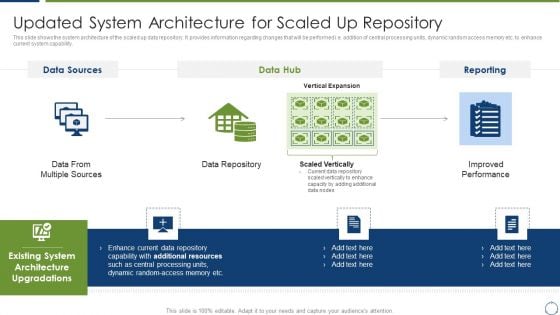
Horizontal Scaling Technique For Information Updated System Architecture For Scaled Up Repository Themes PDF
This slide shows the system architecture of the scaled up data repository. It provides information regarding changes that will be performed i.e. addition of central processing units, dynamic random access memory etc. to enhance current system capability. Deliver and pitch your topic in the best possible manner with this Horizontal Scaling Technique For Information Updated System Architecture For Scaled Up Repository Themes PDF Use them to share invaluable insights on Data From Multiple Sources, Data Repository, Improved Performance and impress your audience. This template can be altered and modified as per your expectations. So, grab it now.
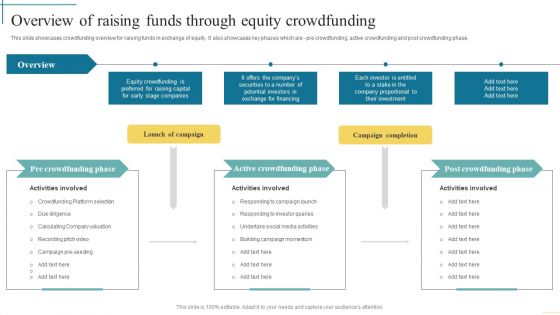
Overview Of Raising Funds Through Equity Crowdfunding Developing Fundraising Techniques Designs PDF
This slide showcases crowdfunding overview for raising funds in exchange of equity. It also showcases key phases which are pre crowdfunding, active crowdfunding and post crowdfunding phase.If your project calls for a presentation, then Slidegeeks is your go-to partner because we have professionally designed, easy-to-edit templates that are perfect for any presentation. After downloading, you can easily edit Overview Of Raising Funds Through Equity Crowdfunding Developing Fundraising Techniques Designs PDF and make the changes accordingly. You can rearrange slides or fill them with different images. Check out all the handy templates
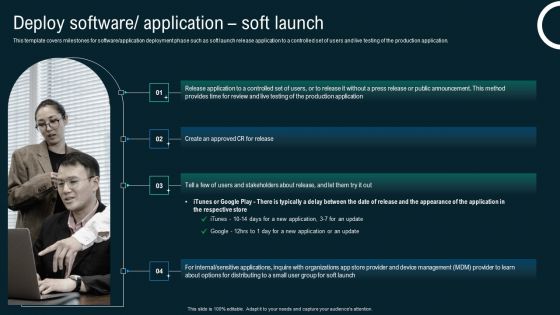
Deploy Software Application Soft Launch Business Application Development Playbook Portrait PDF
This template covers milestones for softwareorapplication deployment Phase such as deploy go live, announce of release.Present like a pro with Deploy Software Application Soft Launch Business Application Development Playbook Portrait PDF Create beautiful presentations together with your team, using our easy-to-use presentation slides. Share your ideas in real-time and make changes on the fly by downloading our templates. So whether you are in the office, on the go, or in a remote location, you can stay in sync with your team and present your ideas with confidence. With Slidegeeks presentation got a whole lot easier. Grab these presentations today.
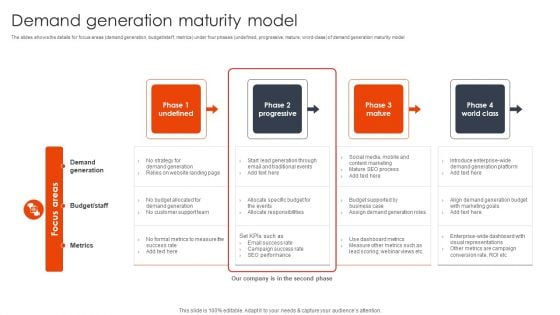
Demand Generation Maturity Model Client Acquisition Techniques To Boost Sales Information PDF
The slides shows the details for focus areas demand generation, budget or staff, metrics under four phases undefined, progressive, mature, word class of demand generation maturity model. Present like a pro with Demand Generation Maturity Model Client Acquisition Techniques To Boost Sales Information PDF Create beautiful presentations together with your team, using our easy-to-use presentation slides. Share your ideas in real-time and make changes on the fly by downloading our templates. So whether you are in the office, on the go, or in a remote location, you can stay in sync with your team and present your ideas with confidence. With Slidegeeks presentation got a whole lot easier. Grab these presentations today.
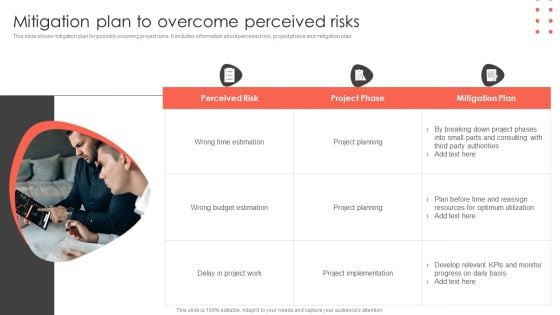
Mitigation Plan To Overcome Perceived Risks Construct Project Feasibility Analysis Report Graphics PDF
This slide shows mitigation plan for possibly occurring project risks. It includes information about perceived risk, project phase and mitigation plan. Present like a pro with Mitigation Plan To Overcome Perceived Risks Construct Project Feasibility Analysis Report Graphics PDF Create beautiful presentations together with your team, using our easy to use presentation slides. Share your ideas in real time and make changes on the fly by downloading our templates. So whether you are in the office, on the go, or in a remote location, you can stay in sync with your team and present your ideas with confidence. With Slidegeeks presentation got a whole lot easier. Grab these presentations today.
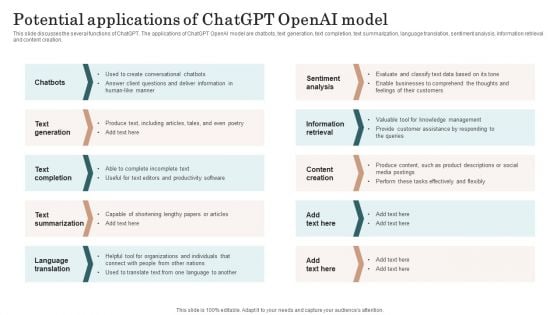
Chatgpt Incorporation Into Web Apps Potential Applications Of Chatgpt Openai Model Diagrams PDF
This slide discusses the several functions of ChatGPT. The applications of ChatGPT OpenAI model are chatbots, text generation, text completion, text summarization, language translation, sentiment analysis, information retrieval and content creation. If your project calls for a presentation, then Slidegeeks is your go to partner because we have professionally designed, easy to edit templates that are perfect for any presentation. After downloading, you can easily edit Chatgpt Incorporation Into Web Apps Potential Applications Of Chatgpt Openai Model Diagrams PDF and make the changes accordingly. You can rearrange slides or fill them with different images. Check out all the handy templates.
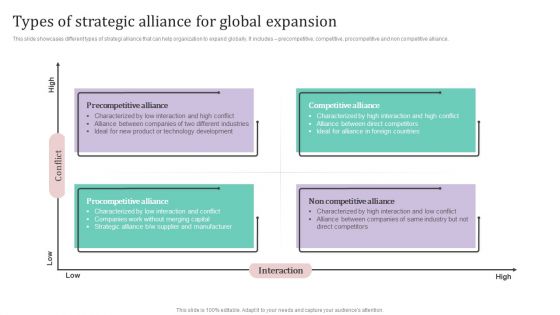
Types Of Strategic Alliance For Global Expansion Ppt PowerPoint Presentation File Files PDF
This slide showcases different types of strategi alliance that can help organization to expand globally. It includes precompetitive, competitive, procompetitive and non competitive alliance.If your project calls for a presentation, then Slidegeeks is your go-to partner because we have professionally designed, easy-to-edit templates that are perfect for any presentation. After downloading, you can easily edit Types Of Strategic Alliance For Global Expansion Ppt PowerPoint Presentation File Files PDF and make the changes accordingly. You can rearrange slides or fill them with different images. Check out all the handy templates
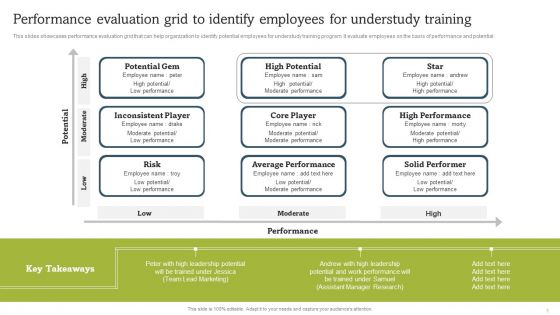
Performance Evaluation Grid To Identify Employees For Understudy Training Introduction PDF
This slides showcases performance evaluation grid that can help organization to identify potential employees for understudy training program. It evaluate employees on the basis of performance and potential. If your project calls for a presentation, then Slidegeeks is your go to partner because we have professionally designed, easy to edit templates that are perfect for any presentation. After downloading, you can easily edit Performance Evaluation Grid To Identify Employees For Understudy Training Introduction PDF and make the changes accordingly. You can rearrange slides or fill them with different images. Check out all the handy templates.
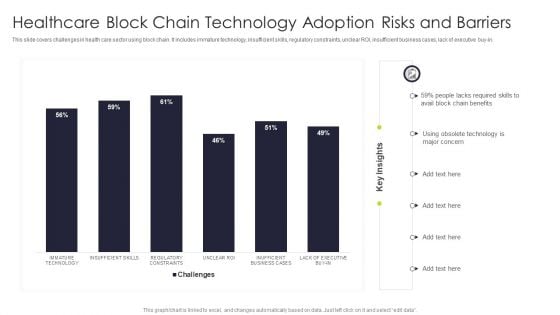
Healthcare Block Chain Technology Adoption Risks And Barriers Portrait PDF
This slide covers challenges in health care sector using block chain. It includes immature technology, insufficient skills, regulatory constraints, unclear ROI, insufficient business cases, lack of executive buy in. Pitch your topic with ease and precision using this Healthcare Block Chain Technology Adoption Risks And Barriers Portrait PDF This layout presents information on Immature Technology, Insufficient Skills, Regulatory Constraints It is also available for immediate download and adjustment. So, changes can be made in the color, design, graphics or any other component to create a unique layout.
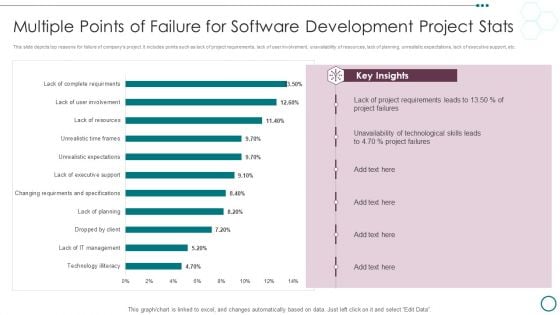
Multiple Points Of Failure For Software Development Project Stats Ppt PowerPoint Presentation Infographics Slides PDF
This slide depicts top reasons for failure of companys project. It includes points such as lack of project requirements, lack of user involvement, unavailability of resources, lack of planning, unrealistic expectations, lack of executive support, etc.Pitch your topic with ease and precision using this Multiple Points Of Failure For Software Development Project Stats Ppt PowerPoint Presentation Infographics Slides PDF. This layout presents information on Project Requirements, Unavailability Technological, Project Failures. It is also available for immediate download and adjustment. So, changes can be made in the color, design, graphics or any other component to create a unique layout.
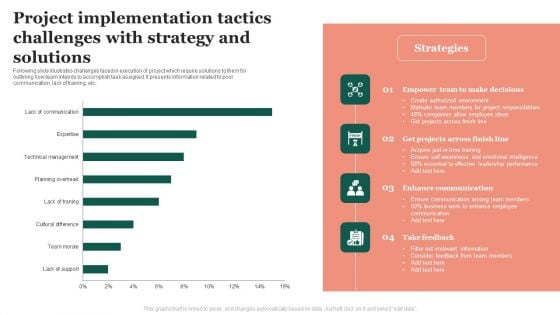
Project Implementation Tactics Challenges With Strategy And Solutions Microsoft PDF
Following slide illustrates challenges faced in execution of project which require solutions to them for outlining how team intends to accomplish task assigned. It presents information related to poor communication, lack of training, etc. Pitch your topic with ease and precision using this Project Implementation Tactics Challenges With Strategy And Solutions Microsoft PDF. This layout presents information on Enhance Communication, Empower Team, Leadership Performance. It is also available for immediate download and adjustment. So, changes can be made in the color, design, graphics or any other component to create a unique layout.
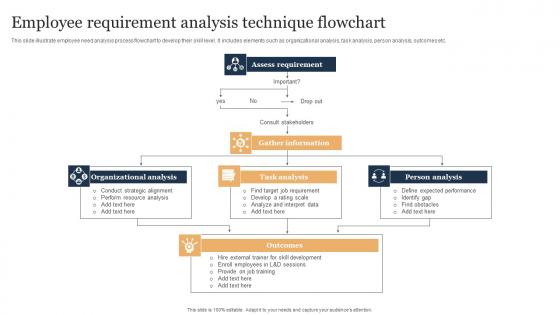
Employee Requirement Analysis Technique Flowchart Demonstration Pdf
This slide illustrate employee need analysis process flowchart to develop their skill level. It includes elements such as organizational analysis, task analysis, person analysis, outcomes etc. Pitch your topic with ease and precision using this Employee Requirement Analysis Technique Flowchart Demonstration Pdf. This layout presents information on Organizational Analysis, Task Analysis, Person Analysis, Assess Requirement. It is also available for immediate download and adjustment. So, changes can be made in the color, design, graphics or any other component to create a unique layout. This slide illustrate employee need analysis process flowchart to develop their skill level. It includes elements such as organizational analysis, task analysis, person analysis, outcomes etc.
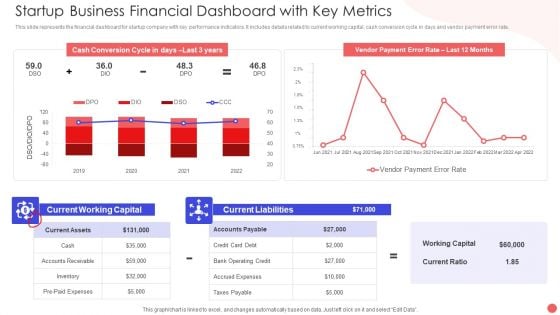
Startup Business Financial Dashboard With Key Metrics Sample PDF
This slide represents the financial dashboard for startup company with key performance indicators. It includes details related to current working capital, cash conversion cycle in days and vendor payment error rate. Pitch your topic with ease and precision using this Startup Business Financial Dashboard With Key Metrics Sample PDF. This layout presents information on Cash Conversion Cycle, Current Working Capital, Current Liabilities Debt. It is also available for immediate download and adjustment. So, changes can be made in the color, design, graphics or any other component to create a unique layout.

Marketing And Operations Dashboard To Drive Effective Productivity Background PDF
This slide covers sales and operations dashboard to drive effective productivity. It involves details such as number of account assigned, working accounts, engaged accounts and total account activity. Pitch your topic with ease and precision using this Marketing And Operations Dashboard To Drive Effective Productivity Background PDF. This layout presents information on Total Account Activity, Number Of Working Account, Engaged Account. It is also available for immediate download and adjustment. So, changes can be made in the color, design, graphics or any other component to create a unique layout.
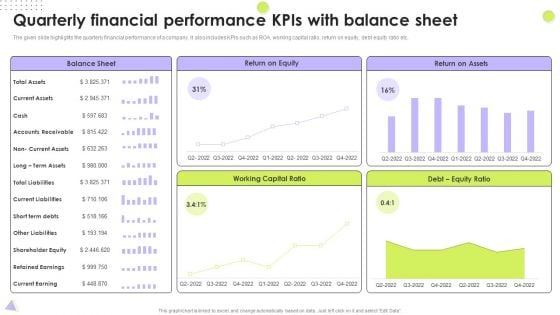
Quarterly Financial Performance Kpis With Balance Sheet Designs PDF
The given slide highlights the quarterly financial performance of a company. It also includes KPIs such as ROA, working capital ratio, return on equity, debt equity ratio etc. Pitch your topic with ease and precision using this Quarterly Financial Performance Kpis With Balance Sheet Designs PDF. This layout presents information on Total Liabilities, Return On Equity, Working Capital Ratio. It is also available for immediate download and adjustment. So, changes can be made in the color, design, graphics or any other component to create a unique layout.
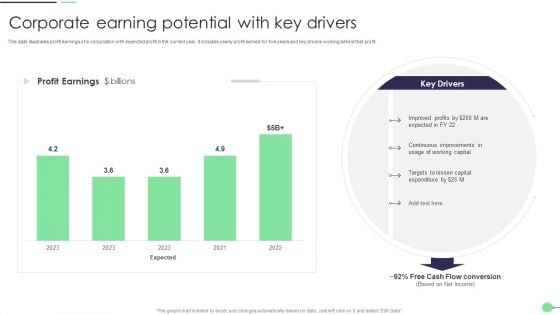
Corporate Earning Potential With Key Drivers Summary PDF
This slide illustrates profit earnings of a corporation with expected profit in the current year. It includes yearly profit earned for five years and key drivers working behind that profit. Pitch your topic with ease and precision using this Corporate Earning Potential With Key Drivers Summary PDF. This layout presents information on Working Capital, Improved Profits, Capital. It is also available for immediate download and adjustment. So, changes can be made in the color, design, graphics or any other component to create a unique layout.
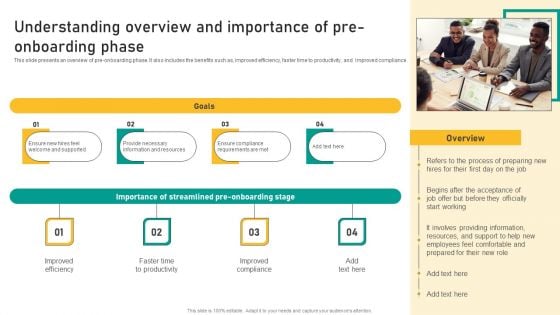
Talent Retention Initiatives For New Hire Onboarding Understanding Overview And Importance Introduction PDF
This slide presents an overview of pre-onboarding phase. It also includes the benefits such as, improved efficiency, faster time to productivity, and Improved compliance. If your project calls for a presentation, then Slidegeeks is your go to partner because we have professionally designed, easy to edit templates that are perfect for any presentation. After downloading, you can easily edit Talent Retention Initiatives For New Hire Onboarding Understanding Overview And Importance Introduction PDF and make the changes accordingly. You can rearrange slides or fill them with different images. Check out all the handy templates
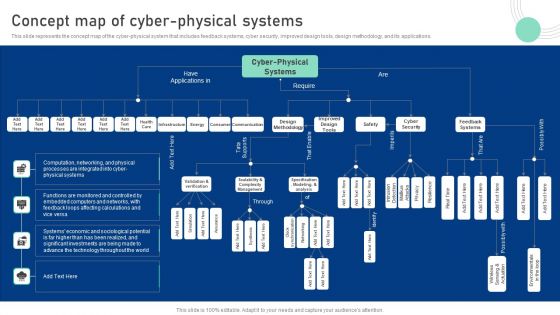
Cyber Physical System To Enhance Concept Map Of Cyber Physical Systems Topics PDF
This slide represents the concept map of the cyber-physical system that includes feedback systems, cyber security, improved design tools, design methodology, and its applications. Present like a pro with Cyber Physical System To Enhance Concept Map Of Cyber Physical Systems Topics PDF Create beautiful presentations together with your team, using our easy-to-use presentation slides. Share your ideas in real-time and make changes on the fly by downloading our templates. So whether youre in the office, on the go, or in a remote location, you can stay in sync with your team and present your ideas with confidence. With Slidegeeks presentation got a whole lot easier. Grab these presentations today.

Cost Breakdown For Executing Effective Advertising Plan Diagrams Pdf
This slide graphically provides information about the promotional plan budget allocation that outline money business intends to spend on marketing related activities. It includes online marketing, direct marketing, personal selling, etc. Pitch your topic with ease and precision using this Cost Breakdown For Executing Effective Advertising Plan Diagrams Pdf. This layout presents information on Online Marketing, Budget Allocation. It is also available for immediate download and adjustment. So, changes can be made in the color, design, graphics or any other component to create a unique layout. This slide graphically provides information about the promotional plan budget allocation that outline money business intends to spend on marketing related activities. It includes online marketing, direct marketing, personal selling, etc.
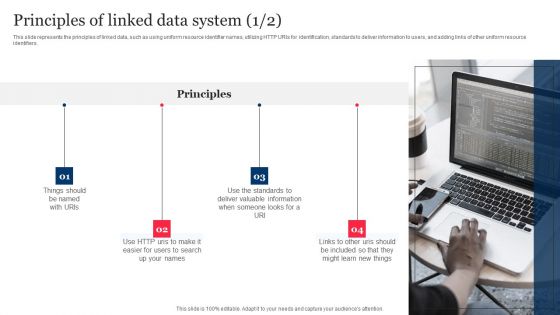
Principles Of Linked Data System Integrating Linked Data To Enhance Operational Effectiveness Diagrams PDF
This slide represents the principles of linked data, such as using uniform resource identifier names, utilizing HTTP URIs for identification, standards to deliver information to users, and adding links of other uniform resource identifiers.If your project calls for a presentation, then Slidegeeks is your go-to partner because we have professionally designed, easy-to-edit templates that are perfect for any presentation. After downloading, you can easily edit Principles Of Linked Data System Integrating Linked Data To Enhance Operational Effectiveness Diagrams PDF and make the changes accordingly. You can rearrange slides or fill them with different images. Check out all the handy templates.
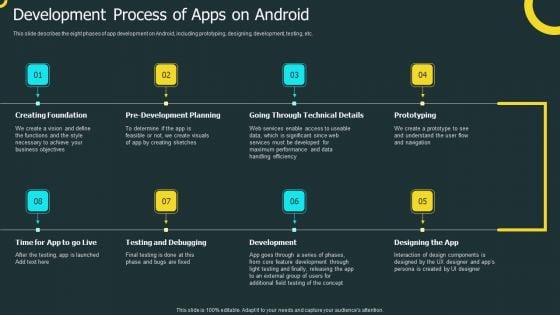
IOS Application Development Development Process Of Apps On Android Structure PDF
This slide describes the eight phases of app development on Android, including prototyping, designing, development, testing, etc. If your project calls for a presentation, then Slidegeeks is your go to partner because we have professionally designed, easy to edit templates that are perfect for any presentation. After downloading, you can easily edit IOS Application Development Development Process Of Apps On Android Structure PDF and make the changes accordingly. You can rearrange slides or fill them with different images. Check out all the handy templates.
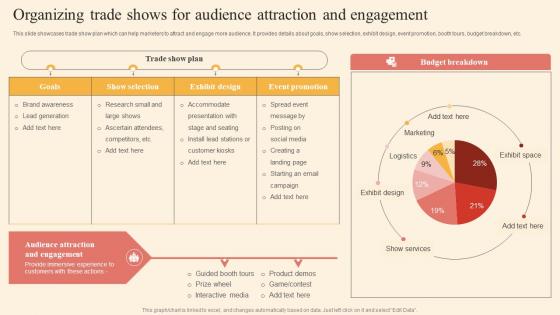
Organizing Trade Shows Driving Business Success By Hosting Experiential Background Pdf
This slide showcases trade show plan which can help marketers to attract and engage more audience. It provides details about goals, show selection, exhibit design, event promotion, booth tours, budget breakdown, etc. Present like a pro with Organizing Trade Shows Driving Business Success By Hosting Experiential Background Pdf Create beautiful presentations together with your team, using our easy to use presentation slides. Share your ideas in real time and make changes on the fly by downloading our templates. So whether you are in the office, on the go, or in a remote location, you can stay in sync with your team and present your ideas with confidence. With Slidegeeks presentation got a whole lot easier. Grab these presentations today. This slide showcases trade show plan which can help marketers to attract and engage more audience. It provides details about goals, show selection, exhibit design, event promotion, booth tours, budget breakdown, etc.
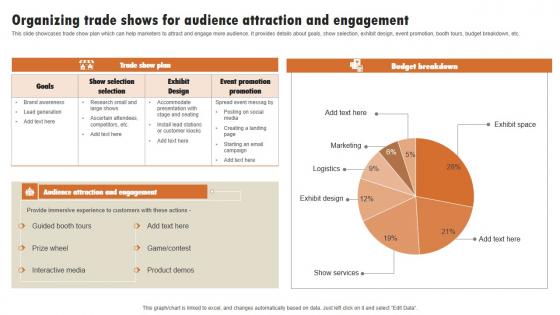
Organizing Trade Shows R Audience Attraction Experiential Marketing Technique Inspiration PDF
This slide showcases trade show plan which can help marketers to attract and engage more audience. It provides details about goals, show selection, exhibit design, event promotion, booth tours, budget breakdown, etc. Present like a pro with Organizing Trade Shows R Audience Attraction Experiential Marketing Technique Inspiration PDF Create beautiful presentations together with your team, using our easy-to-use presentation slides. Share your ideas in real-time and make changes on the fly by downloading our templates. So whether you are in the office, on the go, or in a remote location, you can stay in sync with your team and present your ideas with confidence. With Slidegeeks presentation got a whole lot easier. Grab these presentations today. This slide showcases trade show plan which can help marketers to attract and engage more audience. It provides details about goals, show selection, exhibit design, event promotion, booth tours, budget breakdown, etc.
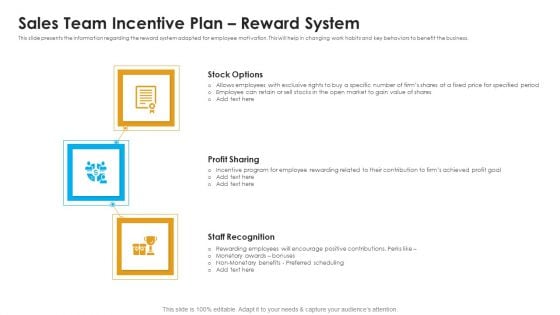
Sales Assistance Boost Overall Efficiency Sales Team Incentive Plan Reward System Diagrams PDF
This slide presents the information regarding the reward system adapted for employee motivation. This will help in changing work habits and key behaviors to benefit the business. This is a sales assistance boost overall efficiency sales team incentive plan reward system diagrams pdf template with various stages. Focus and dispense information on three stages using this creative set, that comes with editable features. It contains large content boxes to add your information on topics like stock options, profit sharing, staff recognition. You can also showcase facts, figures, and other relevant content using this PPT layout. Grab it now.
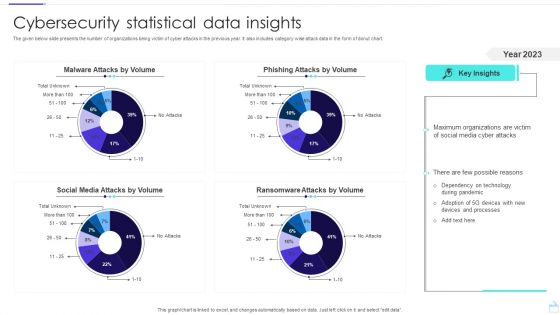
Cybersecurity Statistical Data Insights Sample PDF
The given below slide presents the number of organizations being victim of cyber attacks in the previous year. It also includes category wise attack data in the form of donut chart. Pitch your topic with ease and precision using this Cybersecurity Statistical Data Insights Sample PDF. This layout presents information on Social Media Attacks, Malware Attacks, Phishing Attacks. It is also available for immediate download and adjustment. So, changes can be made in the color, design, graphics or any other component to create a unique layout.
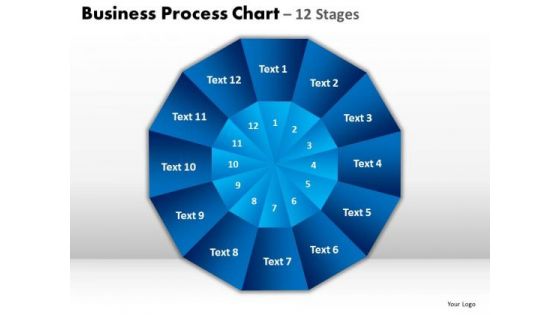
PowerPoint Design Slides Image Circular Quadrant Ppt Presentation Designs
PowerPoint Design Slides Image Circular Quadrant PPT Presentation Designs-These amazing PowerPoint pre-designed slides and PowerPoint templates have been carefully created by our team of experts to help you impress your audience. Our stunning collection of Powerpoint slides are 100% editable and can easily fit in any PowerPoint presentations. By using these animations and graphics in PowerPoint and you can easily make professional presentations. Any text can be entered at any point in the PowerPoint template or slide. Just DOWNLOAD our awesome PowerPoint templates and you are ready to go. Embrace changes with our PowerPoint Design Slides Image Circular Quadrant Ppt Presentation Designs. Develop the correct attitude for it.
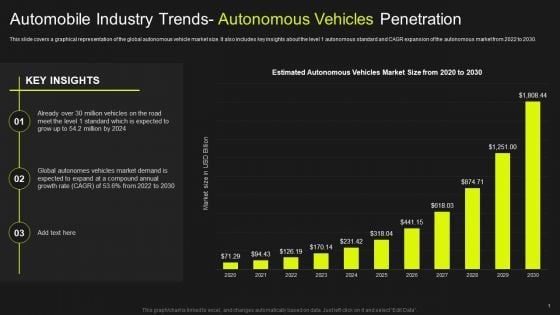
Global Automobile Market Analysis Automobile Industry Trends Autonomous Vehicles Penetration Rules PDF
This slide covers a graphical representation of the global autonomous vehicle market size. It also includes key insights about the level 1 autonomous standard and CAGR expansion of the autonomous market from 2022 to 2030. If your project calls for a presentation, then Slidegeeks is your go-to partner because we have professionally designed, easy-to-edit templates that are perfect for any presentation. After downloading, you can easily edit Global Automobile Market Analysis Automobile Industry Trends Autonomous Vehicles Penetration Rules PDF and make the changes accordingly. You can rearrange slides or fill them with different images. Check out all the handy templates
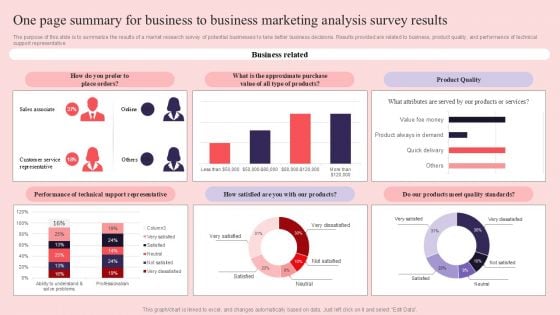
One Page Summary For Business To Business Marketing Analysis Survey Results Survey SS
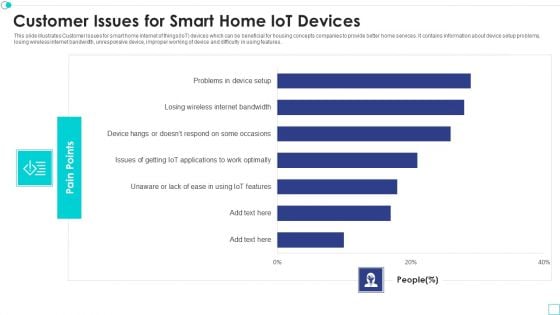
Customer Issues For Smart Home Iot Devices Designs PDF
This slide illustrates Customer Issues for smart home internet of things IoT devices which can be beneficial for housing concepts companies to provide better home services. It contains information about device setup problems, losing wireless internet bandwidth, unresponsive device, improper working of device and difficulty in using features. Pitch your topic with ease and precision using this stomer issues for smart home iot devices designs pdf. This layout presents information on customer issues for smart home iot devices. It is also available for immediate download and adjustment. So, changes can be made in the color, design, graphics or any other component to create a unique layout.
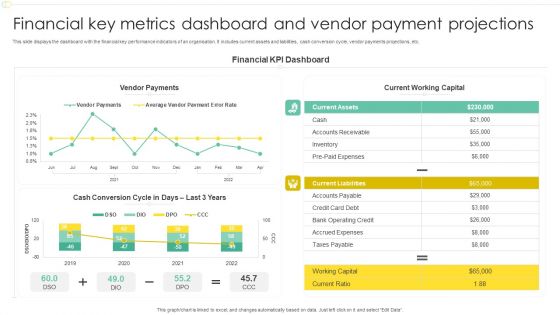
Financial Key Metrics Dashboard And Vendor Payment Projections Professional PDF
This slide displays the dashboard with the financial key performance indicators of an organisation. It includes current assets and liabilities, cash conversion cycle, vendor payments projections, etc. Pitch your topic with ease and precision using this Financial Key Metrics Dashboard And Vendor Payment Projections Professional PDF. This layout presents information on Financial KPI Dashboard, Current Working Capital, Vendor Payments. It is also available for immediate download and adjustment. So, changes can be made in the color, design, graphics or any other component to create a unique layout.
Project Tracking Bug And Progress Tracker Dashboard Elements PDF
The following slide showcases the progress status of project tracking activities to achieve objectives. It constitutes of elements such as number of projects, features, work items, number of bugs along with the progress status etc. Pitch your topic with ease and precision using this Project Tracking Bug And Progress Tracker Dashboard Elements PDF. This layout presents information on Project Tracking, Progress Tracker Dashboard. It is also available for immediate download and adjustment. So, changes can be made in the color, design, graphics or any other component to create a unique layout.
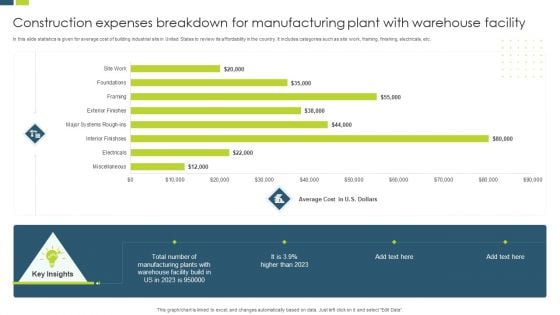
Construction Expenses Breakdown For Manufacturing Plant With Warehouse Facility Slides PDF
In this slide statistics is given for average cost of building industrial site in United States to review its affordability in the country. It includes categories such as site work, framing, finishing, electricals, etc. Pitch your topic with ease and precision using this Construction Expenses Breakdown For Manufacturing Plant With Warehouse Facility Slides PDF. This layout presents information on Manufacturing Plants, Warehouse Facility, Average Cost. It is also available for immediate download and adjustment. So, changes can be made in the color, design, graphics or any other component to create a unique layout.

Cost Breakdown For Conducting Marketing Research Formats PDF
This slide covers cost breakdown for conducting market research more efficiently. It involves key elements such as reporting, project initiation, research design, field work and data analysis. If your project calls for a presentation, then Slidegeeks is your go-to partner because we have professionally designed, easy-to-edit templates that are perfect for any presentation. After downloading, you can easily edit Cost Breakdown For Conducting Marketing Research Formats PDF and make the changes accordingly. You can rearrange slides or fill them with different images. Check out all the handy templates
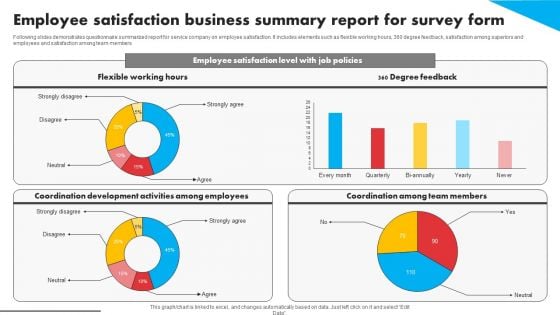
Employee Satisfaction Business Summary Report For Survey Form Survey SS
Following slides demonstrates questionnaire summarized report for service company on employee satisfaction. It includes elements such as flexible working hours, 360 degree feedback, satisfaction among superiors and employees and satisfaction among team members. Pitch your topic with ease and precision using this Employee Satisfaction Business Summary Report For Survey Form Survey SS. This layout presents information on Employee Satisfaction, Business Summary Report, Survey Form. It is also available for immediate download and adjustment. So, changes can be made in the color, design, graphics or any other component to create a unique layout.
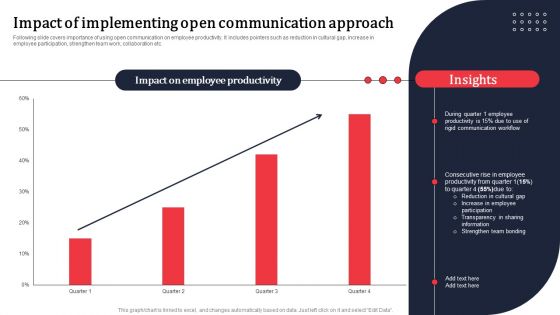
Impact Of Implementing Open Communication Approach Ppt PowerPoint Presentation File Infographics PDF
Following slide covers importance of using open communication on employee productivity. It includes pointers such as reduction in cultural gap, increase in employee participation, strengthen team work, collaboration etc. If your project calls for a presentation, then Slidegeeks is your go to partner because we have professionally designed, easy to edit templates that are perfect for any presentation. After downloading, you can easily edit Impact Of Implementing Open Communication Approach Ppt PowerPoint Presentation File Infographics PDF and make the changes accordingly. You can rearrange slides or fill them with different images. Check out all the handy templates
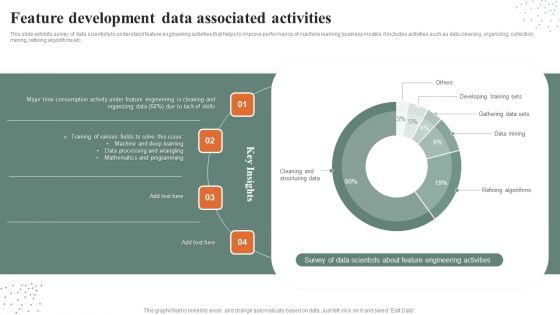
Feature Development Data Associated Activities Guidelines PDF
This slide exhibits survey of data scientists to understand feature engineering activities that helps to improve performance of machine learning business models. It includes activities such as data cleaning, organizing, collection, mining, refining algorithms etc. Pitch your topic with ease and precision using this Feature Development Data Associated Activities Guidelines PDF. This layout presents information on Programming, Developing Training Sets, Gathering Data Sets. It is also available for immediate download and adjustment. So, changes can be made in the color, design, graphics or any other component to create a unique layout.
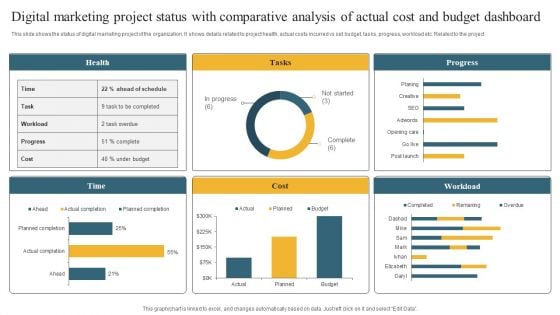
Digital Marketing Project Status With Comparative Analysis Of Actual Cost And Budget Dashboard Information PDF
This slide shows the status of digital marketing project of the organization. It shows details related to project health, actual costs incurred vs set budget, tasks, progress, workload etc. Related to the project Pitch your topic with ease and precision using this Digital Marketing Project Status With Comparative Analysis Of Actual Cost And Budget Dashboard Information PDF. This layout presents information on Health, Tasks, Progress. It is also available for immediate download and adjustment. So, changes can be made in the color, design, graphics or any other component to create a unique layout.
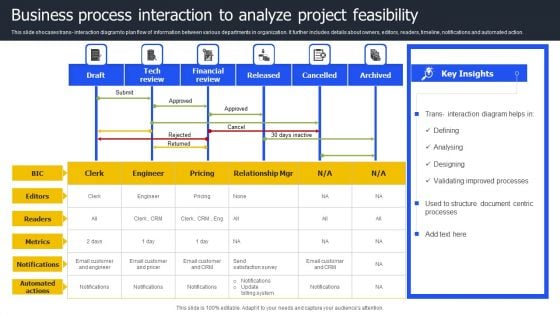
Business Process Interaction To Analyze Project Feasibility Topics PDF
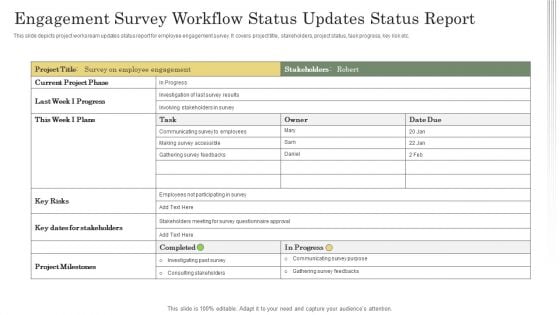
Engagement Survey Workflow Status Updates Status Report Ppt Model Example PDF
This slide depicts project worksream updates status report for employee engagement survey. It covers project title, stakeholders, project status, task progress, key risk etc. Pitch your topic with ease and precision using this Engagement Survey Workflow Status Updates Status Report Ppt Model Example PDF. This layout presents information on Current Project Phase, Key Risks, Project Milestones. It is also available for immediate download and adjustment. So, changes can be made in the color, design, graphics or any other component to create a unique layout.
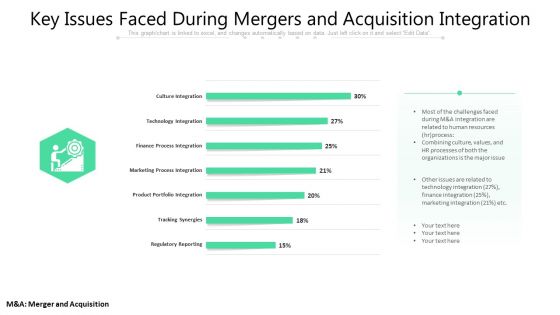
Key Issues Faced During Mergers And Acquisition Integration Ppt PowerPoint Presentation Summary Graphics PDF
This graph or chart is linked to excel, and changes automatically based on data. Just left click on it and select Edit Data. Showcasing this set of slides titled key issues faced during mergers and acquisition integration ppt powerpoint presentation summary graphics pdf. The topics addressed in these templates are culture integration, technology integration, finance process integration, marketing process integration, product portfolio integration, tracking synergies, regulatory reporting. All the content presented in this PPT design is completely editable. Download it and make adjustments in color, background, font etc. as per your unique business setting.
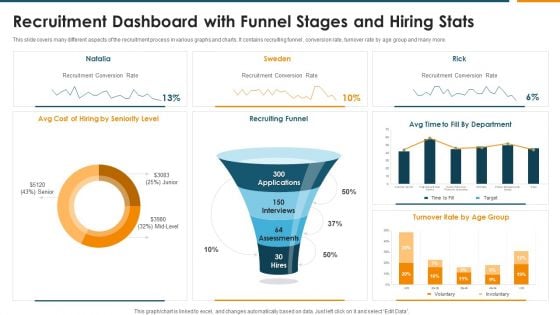
Recruitment Dashboard With Funnel Stages And Hiring Stats Rules PDF
This slide covers many different aspects of the recruitment process in various graphs and charts. It contains recruiting funnel , conversion rate, turnover rate by age group and many more. Pitch your topic with ease and precision using this Recruitment Dashboard With Funnel Stages And Hiring Stats Rules PDF. This layout presents information on Recruiting Funnel, Recruitment Conversion Rate, Seniority Level. It is also available for immediate download and adjustment. So, changes can be made in the color, design, graphics or any other component to create a unique layout.

Expenses Of Materials Used In Construction With Rate Per Unit Diagrams PDF
This slide displays a table which list down quantities of different materials used in construction process with price per unit and total cost. It includes details about cement, steel, bricks, tiles, colour, etc. Pitch your topic with ease and precision using this Expenses Of Materials Used In Construction With Rate Per Unit Diagrams PDF. This layout presents information on Material, Quantity, Rate Per Unit. It is also available for immediate download and adjustment. So, changes can be made in the color, design, graphics or any other component to create a unique layout.

Forecast Analysis Technique IT Predictive Modeling Forecast Model Introduction Diagrams PDF
This slide outlines the introduction of the forecast model used for predictive analytics to make the metric value predictions for business processes. This model uses the Prophet algorithm to make predictions and includes its use cases in the manufacturing industry. If your project calls for a presentation, then Slidegeeks is your go to partner because we have professionally designed, easy to edit templates that are perfect for any presentation. After downloading, you can easily edit Forecast Analysis Technique IT Predictive Modeling Forecast Model Introduction Diagrams PDF and make the changes accordingly. You can rearrange slides or fill them with different images. Check out all the handy templates.
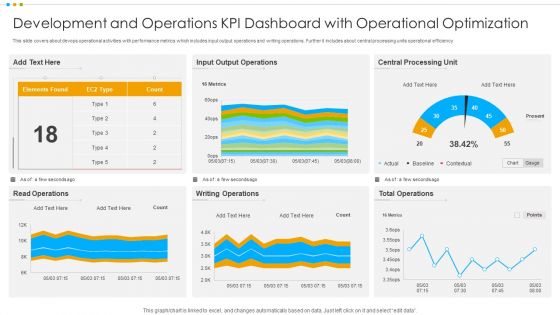
Development And Operations KPI Dashboard With Operational Optimization Pictures PDF
This slide covers about devops operational activities with performance metrics which includes input output operations and writing operations. Further it includes about central processing units operational efficiency.Pitch your topic with ease and precision using this Development And Operations KPI Dashboard With Operational Optimization Pictures PDF This layout presents information on Output Operations, Central Processing, Total Operations It is also available for immediate download and adjustment. So, changes can be made in the color, design, graphics or any other component to create a unique layout.
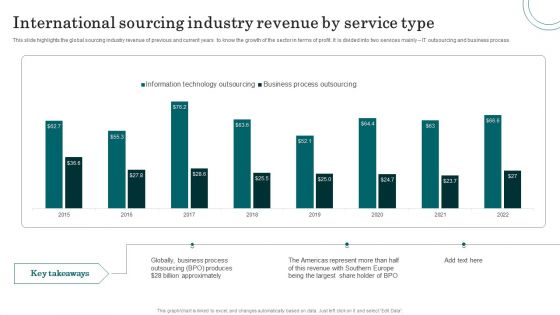
International Sourcing Industry Revenue By Service Type Mockup PDF
This slide highlights the global sourcing industry revenue of previous and current years to know the growth of the sector in terms of profit. It is divided into two services mainly IT outsourcing and business process. Pitch your topic with ease and precision using this International Sourcing Industry Revenue By Service Type Mockup PDF. This layout presents information on Business Process, Revenue, Share Holder. It is also available for immediate download and adjustment. So, changes can be made in the color, design, graphics or any other component to create a unique layout.
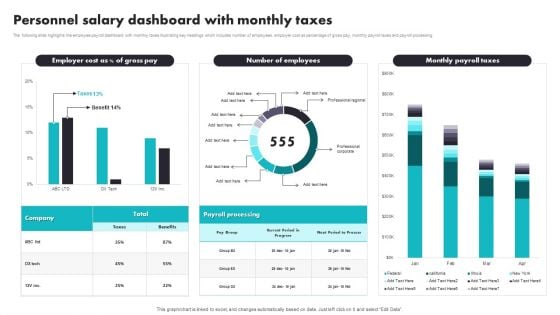
Personnel Salary Dashboard With Monthly Taxes Introduction PDF
The following slide highlights the employee payroll dashboard with monthly taxes illustrating key headings which includes number of employees, employer cost as percentage of gross pay, monthly payroll taxes and payroll processing. Pitch your topic with ease and precision using this Personnel Salary Dashboard With Monthly Taxes Introduction PDF. This layout presents information on Payroll Processing, Benefits. It is also available for immediate download and adjustment. So, changes can be made in the color, design, graphics or any other component to create a unique layout.
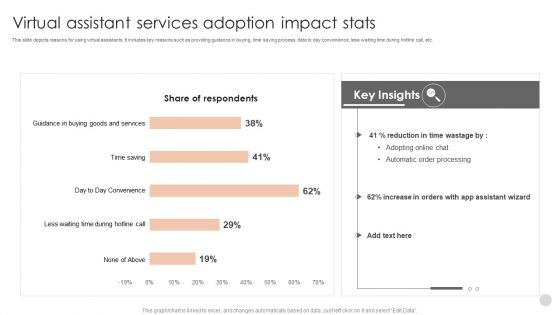
Virtual Assistant Services Adoption Impact Stats Structure PDF
This slide depicts reasons for using virtual assistants. It includes key reasons such as providing guidance in buying, time saving process, data to day convenience, less waiting time during hotline call, etc.Pitch your topic with ease and precision using this Virtual Assistant Services Adoption Impact Stats Structure PDF. This layout presents information on Automatic Order Processing, Assistant Wizard, Guidance Buying. It is also available for immediate download and adjustment. So, changes can be made in the color, design, graphics or any other component to create a unique layout.
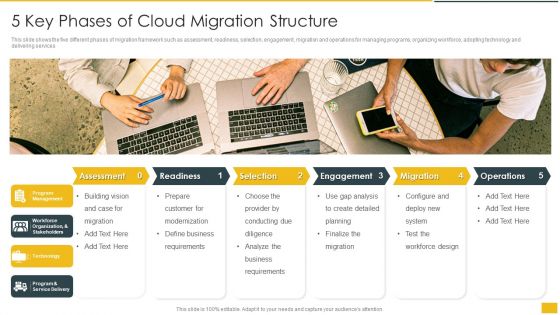
5 Key Phases Of Cloud Migration Structure Download PDF
This slide shows the five different phases of migration framework such as assessment, readiness, selection, engagement, migration and operations for managing programs, organizing workforce, adopting technology and delivering servicesp. Presenting 5 Key Phases Of Cloud Migration Structure Download PDF to dispense important information. This template comprises five stages. It also presents valuable insights into the topics including Program Management, Technology, Define Business Requirements. This is a completely customizable PowerPoint theme that can be put to use immediately. So, download it and address the topic impactfully.
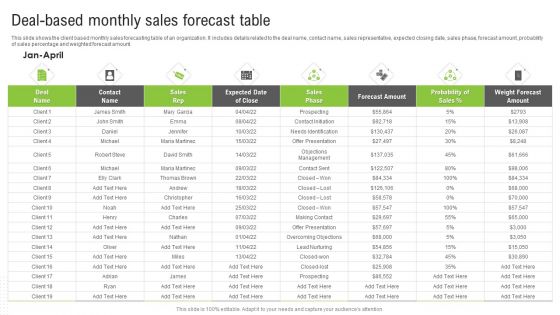
Deal Based Monthly Sales Forecast Table Ppt Portfolio Template PDF
This slide shows the client based monthly sales forecasting table of an organization. It includes details related to the deal name, contact name, sales representative, expected closing date, sales phase, forecast amount, probability of sales percentage and weighted forecast amount. Pitch your topic with ease and precision using this Deal Based Monthly Sales Forecast Table Ppt Portfolio Template PDF. This layout presents information on Sales Rep, Forecast Amount, Weight Forecast Amount. It is also available for immediate download and adjustment. So, changes can be made in the color, design, graphics or any other component to create a unique layout.
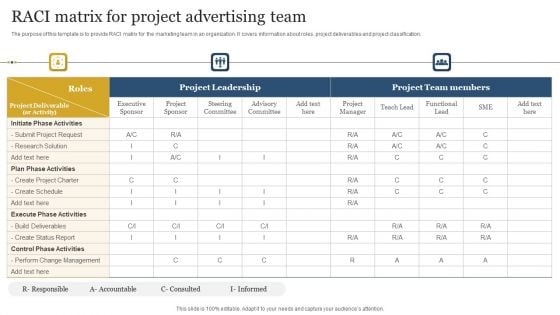
RACI Matrix For Project Advertising Team Clipart PDF
The purpose of this template is to provide RACI matrix for the marketing team in an organization. It covers information about roles, project deliverables and project classification. Pitch your topic with ease and precision using this RACI Matrix For Project Advertising Team Clipart PDF. This layout presents information on Project Leadership, Project Team Members, Initiate Phase Activities. It is also available for immediate download and adjustment. So, changes can be made in the color, design, graphics or any other component to create a unique layout.
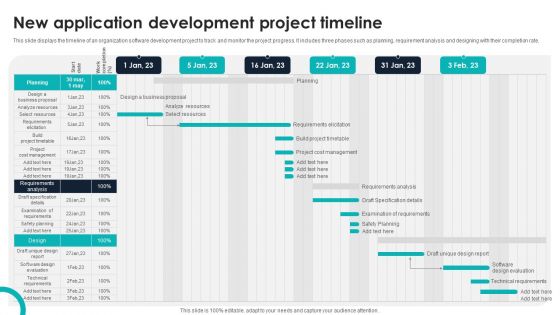
New Application Development Project Timeline Pictures PDF
This slide displays the timeline of an organization software development project to track and monitor the project progress. It includes three phases such as planning, requirement analysis and designing with their completion rate. Pitch your topic with ease and precision using this New Application Development Project Timeline Pictures PDF. This layout presents information on Planning, Requirements Analysis, Design. It is also available for immediate download and adjustment. So, changes can be made in the color, design, graphics or any other component to create a unique layout.
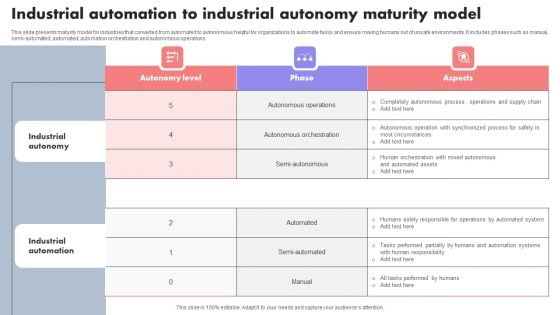
Industrial Automation To Industrial Autonomy Maturity Model Template PDF
This slide presents maturity model for industries that converted from automated to autonomous helpful for organizations to automate tasks and ensure moving humans out of unsafe environments. It includes phases such as manual, semi automated, automated, automation orchestration and autonomous operations. Pitch your topic with ease and precision using this Industrial Automation To Industrial Autonomy Maturity Model Template PDF. This layout presents information on Industrial Autonomy, Industrial Automation, Autonomy Level. It is also available for immediate download and adjustment. So, changes can be made in the color, design, graphics or any other component to create a unique layout.
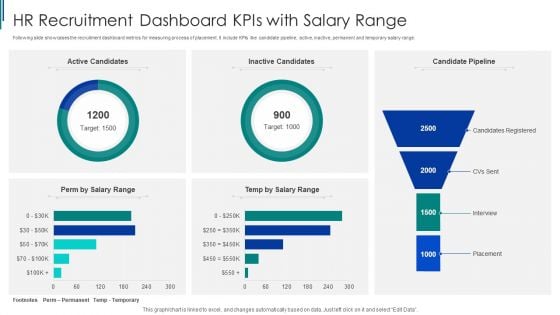
HR Recruitment Dashboard Kpis With Salary Range Ppt Inspiration Rules PDF
Following slide showcases the recruitment dashboard metrics for measuring process of placement. It include KPIs like candidate pipeline, active, inactive, permanent and temporary salary range. Pitch your topic with ease and precision using this HR Recruitment Dashboard Kpis With Salary Range Ppt Inspiration Rules PDF. This layout presents information on HR Recruitment, Dashboard Kpis, Salary Range. It is also available for immediate download and adjustment. So, changes can be made in the color, design, graphics or any other component to create a unique layout.
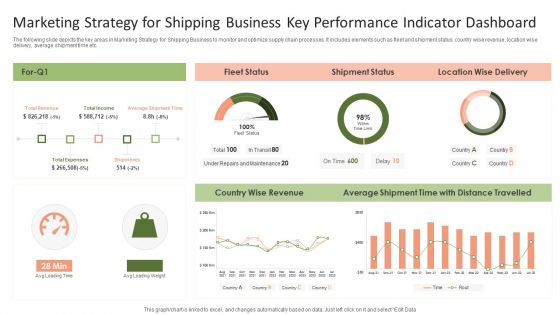
Marketing Strategy For Shipping Business Key Performance Indicator Dashboard Graphics PDF
The following slide depicts the key areas in Marketing Strategy for Shipping Business to monitor and optimize supply chain processes. It includes elements such as fleet and shipment status, country wise revenue, location wise delivery, average shipment time etc.Pitch your topic with ease and precision using this Marketing Strategy For Shipping Business Key Performance Indicator Dashboard Graphics PDF. This layout presents information on Shipment Status, Average Shipment, Wise Revenue. It is also available for immediate download and adjustment. So, changes can be made in the color, design, graphics or any other component to create a unique layout.
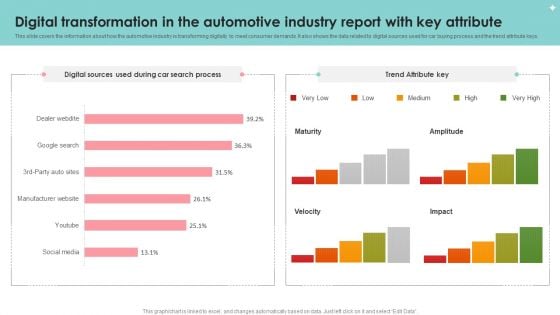
Digital Transformation In The Automotive Industry Report With Key Attribute Slides PDF
This slide covers the information about how the automotive industry is transforming digitally to meet consumer demands. It also shows the data related to digital sources used for car buying process and the trend attribute keys. Pitch your topic with ease and precision using this Digital Transformation In The Automotive Industry Report With Key Attribute Slides PDF. This layout presents information on Digital Transformation, Automotive Industry Report, Key Attribute. It is also available for immediate download and adjustment. So, changes can be made in the color, design, graphics or any other component to create a unique layout.
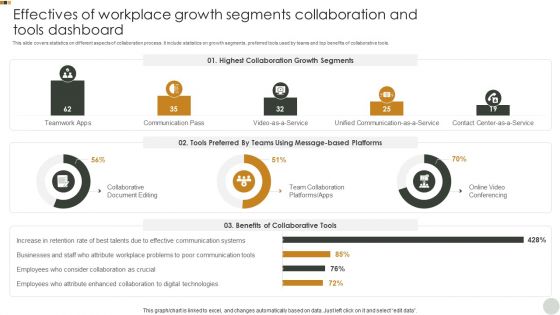
Effectives Of Workplace Growth Segments Collaboration And Tools Dashboard Graphics PDF
This slide covers statistics on different aspects of collaboration process. It include statistics on growth segments, preferred tools used by teams and top benefits of collaborative tools. Pitch your topic with ease and precision using this Effectives Of Workplace Growth Segments Collaboration And Tools Dashboard Graphics PDF. This layout presents information on Highest Collaboration, Growth Segments, Tools Preferred. It is also available for immediate download and adjustment. So, changes can be made in the color, design, graphics or any other component to create a unique layout.
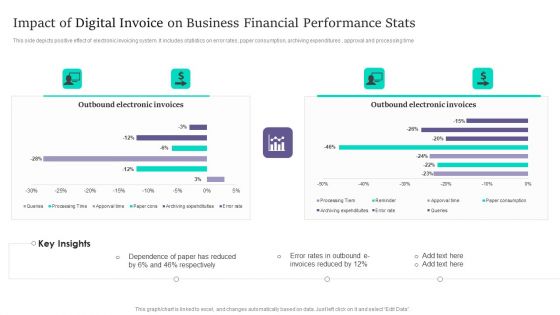
Impact Of Digital Invoice On Business Financial Performance Stats Infographics PDF
This side depicts positive effect of electronic invoicing system. It includes statistics on error rates, paper consumption, archiving expenditures , approval and processing time. Pitch your topic with ease and precision using this Impact Of Digital Invoice On Business Financial Performance Stats Infographics PDF. This layout presents information on Impact Of Digital Invoice, Business Financial Performance Stats. It is also available for immediate download and adjustment. So, changes can be made in the color, design, graphics or any other component to create a unique layout.
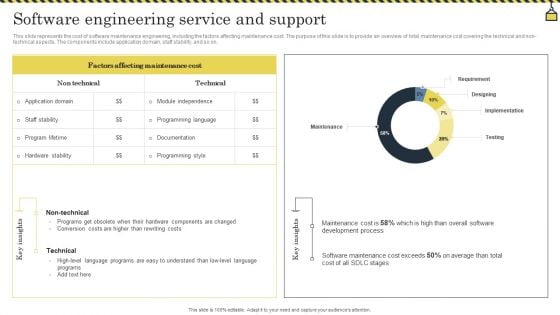
Software Engineering Service And Support Information PDF
This slide represents the cost of software maintenance engineering, including the factors affecting maintenance cost. The purpose of this slide is to provide an overview of total maintenance cost covering the technical and non technical aspects. The components include application domain, staff stability, and so on. Pitch your topic with ease and precision using this Software Engineering Service And Support Information PDF. This layout presents information on Rewriting Costs, Conversion Costs, Development Process. It is also available for immediate download and adjustment. So, changes can be made in the color, design, graphics or any other component to create a unique layout.
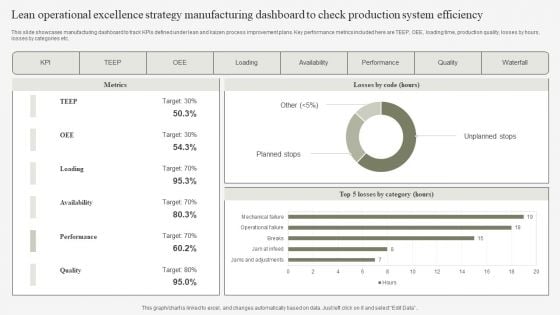
Lean Operational Excellence Strategy Manufacturing Dashboard To Check Production System Efficiency Pictures PDF
This slide showcases manufacturing dashboard to track KPIs defined under lean and kaizen process improvement plans. Key performance metrics included here are TEEP, OEE, loading time, production quality, losses by hours, losses by categories etc. Pitch your topic with ease and precision using this Lean Operational Excellence Strategy Manufacturing Dashboard To Check Production System Efficiency Pictures PDF. This layout presents information on Loading, Availability, Performance. It is also available for immediate download and adjustment. So, changes can be made in the color, design, graphics or any other component to create a unique layout.

 Home
Home