Chart Analysis
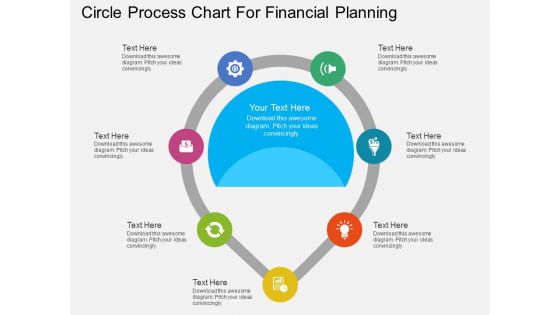
Seven Staged Circle Process Chart For Financial Planning Powerpoint Template
Our above PPT slide contains process chart with icons. This PowerPoint template may be used to display strategic planning methodology. This template is designed to attract the attention of your audience.
Line Chart Business Data Ppt PowerPoint Presentation Styles Layout Cpb
Presenting this set of slides with name line chart business data ppt powerpoint presentation styles layout cpb. This is an editable Powerpoint three stages graphic that deals with topics like line chart business data to help convey your message better graphically. This product is a premium product available for immediate download and is 100 percent editable in Powerpoint. Download this now and use it in your presentations to impress your audience.
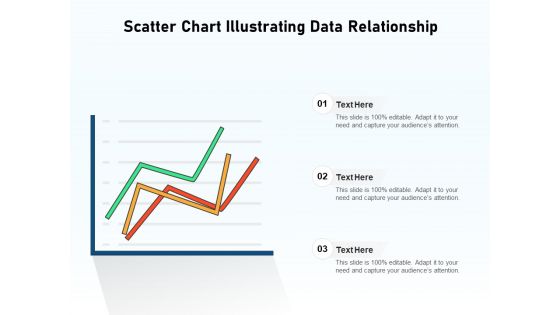
Scatter Chart Illustrating Data Relationship Ppt PowerPoint Presentation Microsoft PDF
Persuade your audience using this scatter chart illustrating data relationship ppt powerpoint presentation microsoft pdf. This PPT design covers three stages, thus making it a great tool to use. It also caters to a variety of topics including scatter chart illustrating data relationship. Download this PPT design now to present a convincing pitch that not only emphasizes the topic but also showcases your presentation skills.
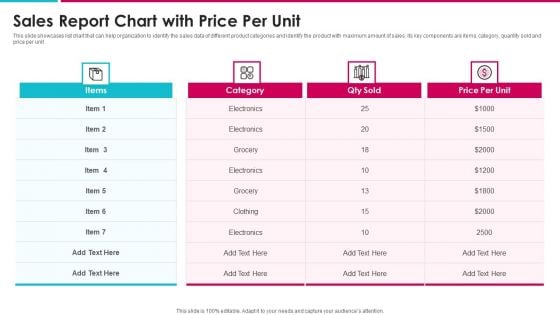
Sales Report Chart With Price Per Unit Information PDF
This slide showcases list chart that can help organization to identify the sales data of different product categories and identify the product with maximum amount of sales. Its key components are items, category, quantity sold and price per unit Showcasing this set of slides titled sales report chart with price per unit information pdf. The topics addressed in these templates are sales report chart with price per unit. All the content presented in this PPT design is completely editable. Download it and make adjustments in color, background, font etc. as per your unique business setting.
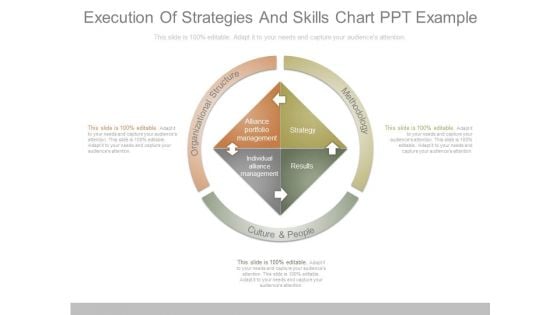
Execution Of Strategies And Skills Chart Ppt Example
This is a execution of strategies and skills chart ppt example. This is a three stage process. The stages in this process are methodology, culture and people, organizational structure, alliance portfolio management, strategy, individual alliance management, results.
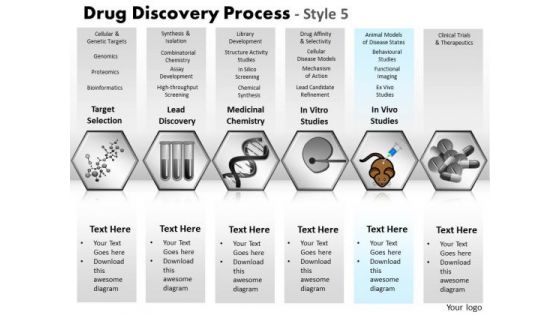
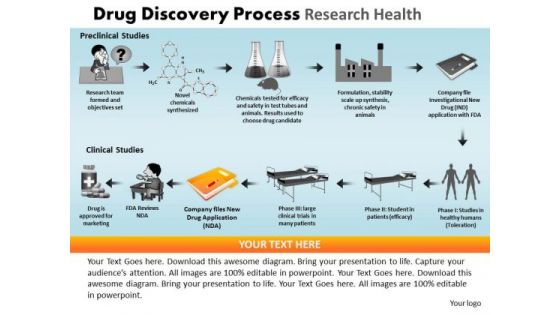
PowerPoint Presentation Designs Chart Drug Discovery Ppt Themes
PowerPoint Presentation Designs Chart Drug Discovery PPT Themes-These high quality powerpoint pre-designed slides and powerpoint templates have been carefully created by our professional team to help you impress your audience. All slides have been created and are 100% editable in powerpoint. Each and every property of any graphic - color, size, orientation, shading, outline etc. can be modified to help you build an effective powerpoint presentation. Any text can be entered at any point in the powerpoint template or slide. Simply DOWNLOAD, TYPE and PRESENT! Import ideas with our PowerPoint Presentation Designs Chart Drug Discovery Ppt Themes. Download without worries with our money back guaranteee.
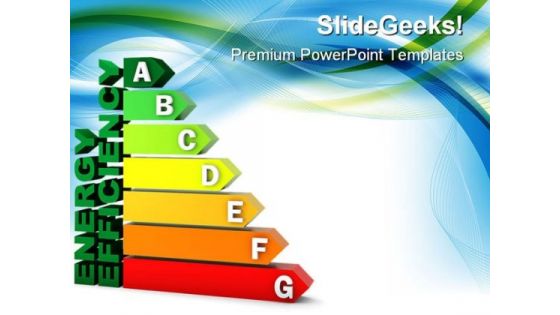
Energy Efficiency Chart Geographical PowerPoint Themes And PowerPoint Slides 0311
Microsoft PowerPoint Theme and Slide with energy efficiency rating certification system Fashion yourfate with our Energy Efficiency Chart Geographical PowerPoint Themes And PowerPoint Slides 0311. Your efforts will achieve their every aim.
Ppt Slide Business Illustration Umbrella Chart Strategic Planning
Get The Domestics Right With Our PPT Slide business illustration umbrella chart strategic planning Powerpoint Templates. Create The Base For Thoughts To Grow. Do Away With Dogmatic Approaches. Establish The Value Of Reason With Our Business Plan Powerpoint Templates.
PowerPoint Presentation Designs Chart Drug Discovery Ppt Template
PowerPoint Presentation Designs Chart Drug Discovery PPT Template-These high quality powerpoint pre-designed slides and powerpoint templates have been carefully created by our professional team to help you impress your audience. All slides have been created and are 100% editable in powerpoint. Each and every property of any graphic - color, size, orientation, shading, outline etc. can be modified to help you build an effective powerpoint presentation. Any text can be entered at any point in the powerpoint template or slide. Simply DOWNLOAD, TYPE and PRESENT! Deliver exciting presentations with our PowerPoint Presentation Designs Chart Drug Discovery Ppt Template. Dont waste time struggling with PowerPoint. Let us do it for you.
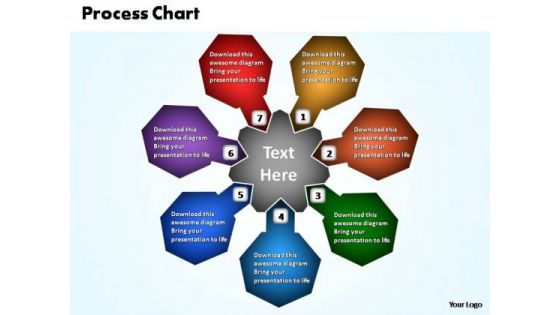
PowerPoint Theme Growth Business Process Chart Ppt Design
This easy to use diagrams can be used for information flow, business process automation, business process re-engineering. Resolve the feud with our PowerPoint Theme Growth Business Process Chart Ppt Design. Take all different approaches into consideration.
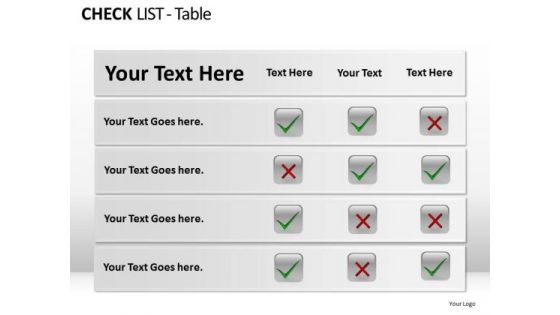
PowerPoint Presentation Designs Chart Check List Table Ppt Themes
PowerPoint Presentation Designs Chart Check List Table PPT Themes-These high quality powerpoint pre-designed slides and powerpoint templates have been carefully created by our professional team to help you impress your audience. All slides have been created and are 100% editable in powerpoint. Each and every property of any graphic - color, size, orientation, shading, outline etc. can be modified to help you build an effective powerpoint presentation. Any text can be entered at any point in the powerpoint template or slide. Simply DOWNLOAD, TYPE and PRESENT! Win genuine accolades with our PowerPoint Presentation Designs Chart Check List Table Ppt Themes. Dont waste time struggling with PowerPoint. Let us do it for you.
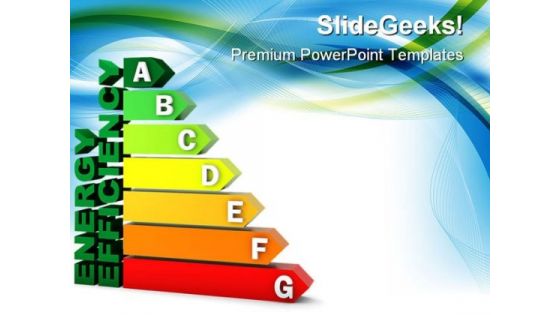
Energy Efficiency Chart Geographical PowerPoint Templates And PowerPoint Backgrounds 0311
Microsoft PowerPoint Template and Background with energy efficiency rating certification system Change is a constant in corporate life. Detect the correct co-efficient with our Energy Efficiency Chart Geographical PowerPoint Templates And PowerPoint Backgrounds 0311.
Search Engine Marketing Analysis Economic Development Brand Culture Ppt PowerPoint Presentation Summary Display
This is a search engine marketing analysis economic development brand culture ppt powerpoint presentation summary display. This is a four stage process. The stages in this process are search engine marketing analysis, economic development, brand culture.
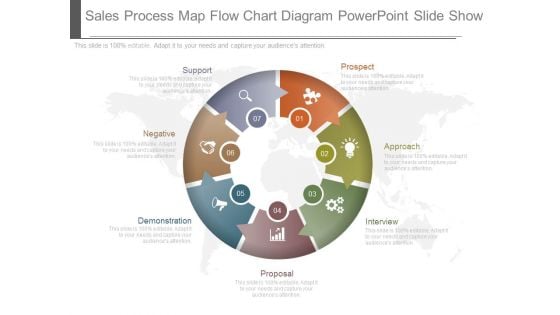
Sales Process Map Flow Chart Diagram Powerpoint Slide Show
This is a sales process map flow chart diagram powerpoint slide show. This is a seven stage process. The stages in this process are prospect, approach, interview, proposal, demonstration, negative, support.
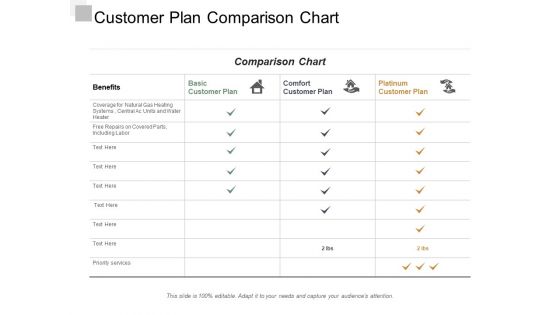
Customer Plan Comparison Chart Ppt Powerpoint Presentation Infographic Template Portrait
This is a customer plan comparison chart ppt powerpoint presentation infographic template portrait. This is a four stage process. The stages in this process are customer service strategy, customer service plan, customer service approach.
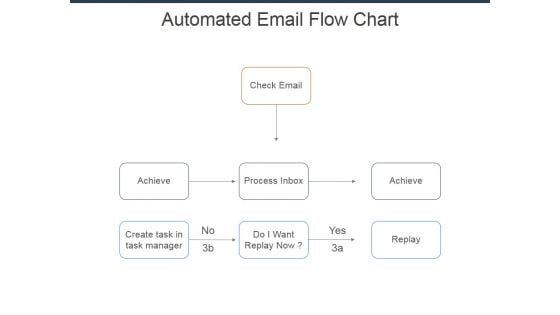
Automated Email Flow Chart Ppt Powerpoint Presentation Infographics Show
This is a automated email flow chart ppt powerpoint presentation infographics show. This is a three stage process. The stages in this process are check email, achieve, process inbox, do i want replay now, create task in task manager.
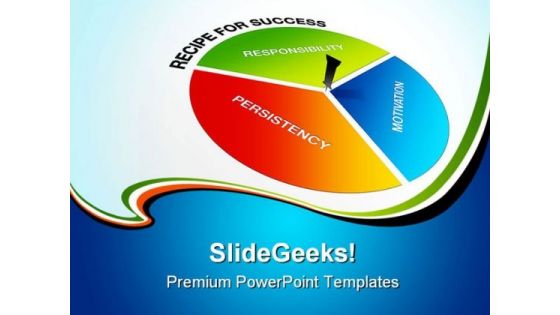
Chart For Success Business PowerPoint Templates And PowerPoint Backgrounds 0411
Microsoft PowerPoint Template and Background with perspective graphic of a pie with words recipe for succes Fly in the face of conservative approaches. Our Chart For Success Business PowerPoint Templates And PowerPoint Backgrounds 0411 encourage bold actions.
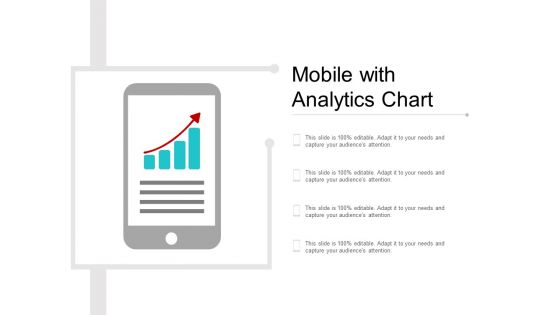
Mobile With Analytics Chart Ppt PowerPoint Presentation Layouts Graphics
This is a mobile with analytics chart ppt powerpoint presentation layouts graphics. This is a four stage process. The stages in this process are mobile analytics, mobile tracking, mobile web analytics.
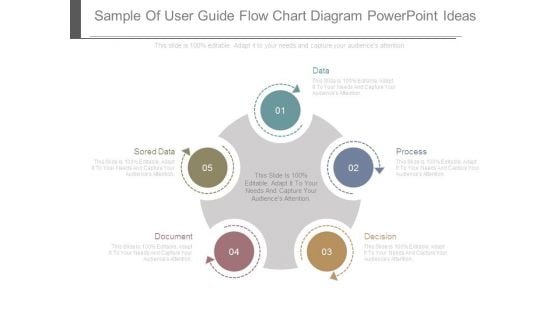
Sample Of User Guide Flow Chart Diagram Powerpoint Ideas
This is a sample of user guide flow chart diagram powerpoint ideas. This is a five stage process. The stages in this process are data, process, decision, document, sored data.
Five Staged Semicircle Step Chart And Icons Powerpoint Template
This business slide has been designed with five staged semi circle chart and icons. This diagram is suitable to evaluate strategic planning. This professional slide helps in making an instant impact on viewers.
Six Steps Business Chart With Icons Powerpoint Template
This PPT slide contains six steps business chart with icons. Download this diagram to display information in visual manner. Visual effect of this diagram helps in maintaining the flow of the discussion and provides more clarity to the subject.
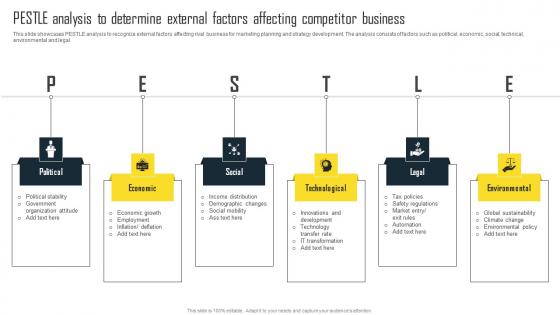
PESTLE Analysis To Determine External Factors Efficient Plan For Conducting Competitor Summary Pdf
This slide showcases PESTLE analysis to recognize external factors affecting rival business for marketing planning and strategy development. The analysis consists of factors such as political, economic, social, technical, environmental and legal. Get a simple yet stunning designed PESTLE Analysis To Determine External Factors Efficient Plan For Conducting Competitor Summary Pdf. It is the best one to establish the tone in your meetings. It is an excellent way to make your presentations highly effective. So, download this PPT today from Slidegeeks and see the positive impacts. Our easy-to-edit PESTLE Analysis To Determine External Factors Efficient Plan For Conducting Competitor Summary Pdf can be your go-to option for all upcoming conferences and meetings. So, what are you waiting for Grab this template today. This slide showcases PESTLE analysis to recognize external factors affecting rival business for marketing planning and strategy development. The analysis consists of factors such as political, economic, social, technical, environmental and legal.
User Software Requirements Chart Icon Ppt Inspiration Graphics Design PDF
Persuade your audience using this User Software Requirements Chart Icon Ppt Inspiration Graphics Design PDF. This PPT design covers three stages, thus making it a great tool to use. It also caters to a variety of topics including User Software, Requirements Chart, Icon. Download this PPT design now to present a convincing pitch that not only emphasizes the topic but also showcases your presentation skills.
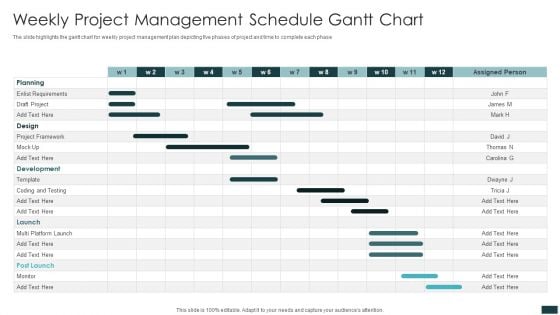
Weekly Project Management Schedule Gantt Chart Information PDF
The slide highlights the gantt chart for weekly project management plan depicting five phases of project and time to complete each phase. Pitch your topic with ease and precision using this Weekly Project Management Schedule Gantt Chart Information PDF. This layout presents information on Project Framework, Design, Planning. It is also available for immediate download and adjustment. So, changes can be made in the color, design, graphics or any other component to create a unique layout.
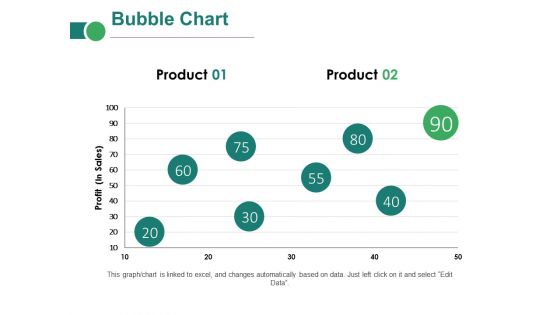
Bubble Chart Ppt PowerPoint Presentation Layouts Clipart Images
This is a bubble chart ppt powerpoint presentation layouts clipart images. This is a two stage process. The stages in this process are business, marketing, profit, innovation, technology, idea bulb.
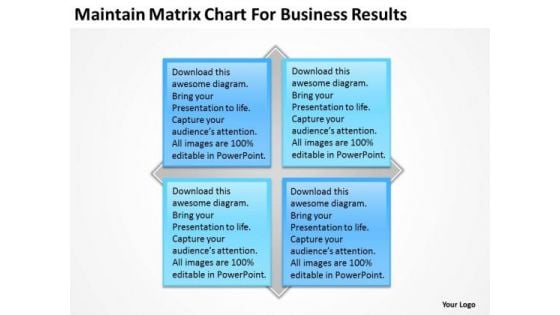
Maintain Matrix Chart For Business Results Plan Sample PowerPoint Slides
Blend your views with our maintain matrix chart for business results plan sample PowerPoint Slides. They are made for each other. Our Boxes Powerpoint templates are duly appointed. They have all the facets you require. There is no subject too dull for our Process and Flows Powerpoint templates. They will always generate keenness. Create failsafe designs with our Maintain Matrix Chart For Business Results Plan Sample PowerPoint Slides. Examine likely defects in detail.
Project Management Gantt Chart Ppt PowerPoint Presentation Icon Example
This is a project management gantt chart ppt powerpoint presentation icon example. This is a ten stage process. The stages in this process are lists, table, data, management, marketing.
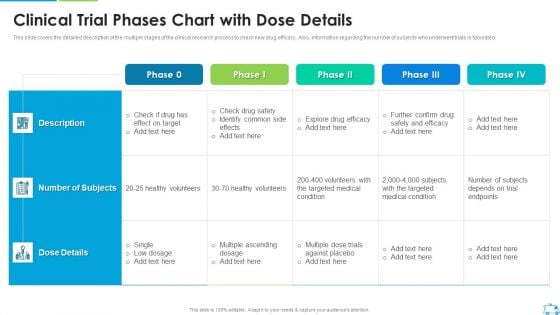
Clinical Trial Phases Chart With Dose Details Graphics PDF
This slide covers the detailed description of the multiple stages of the clinical research process to check new drug efficacy. Also, information regarding the number of subjects who underwent trials is tabulated.Deliver an awe inspiring pitch with this creative Clinical Trial Phases Chart With Dose Details Graphics PDF bundle. Topics like Clinical Trial Phases Chart With Dose Details can be discussed with this completely editable template. It is available for immediate download depending on the needs and requirements of the user.
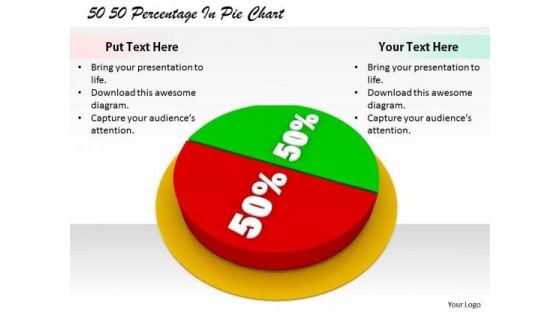
Stock Photo Corporate Business Strategy 50 Percentage Pie Chart Images
Extract admiration from the audience. Create a forceful impact with our stock photo corporate business strategy 50 percentage pie chart images. Force doors open with our finance. The audience will decide to let your thoughts enter.
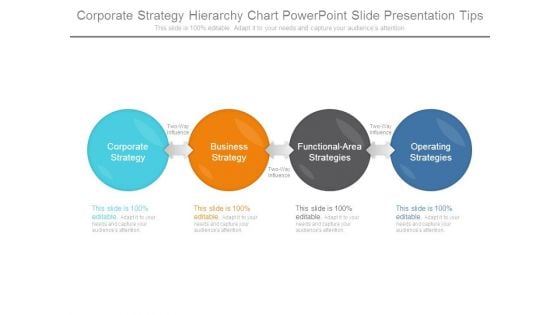
Corporate Strategy Hierarchy Chart Powerpoint Slide Presentation Tips
This is a corporate strategy hierarchy chart powerpoint slide presentation tips. This is a four stage process. The stages in this process are corporate strategy, business strategy, functional area strategies, operating strategies.
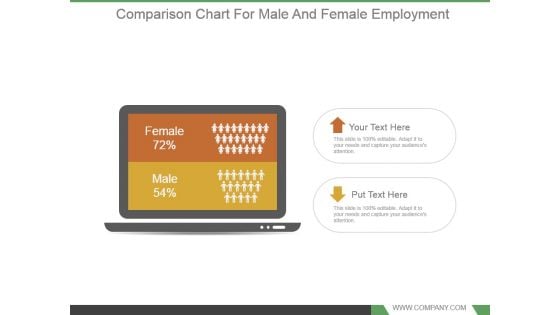
Comparison Chart For Male And Female Employment Powerpoint Shapes
This is a comparison chart for male and female employment powerpoint shapes. This is a two stage process. The stages in this process are female 72 percent, male 54 percent.
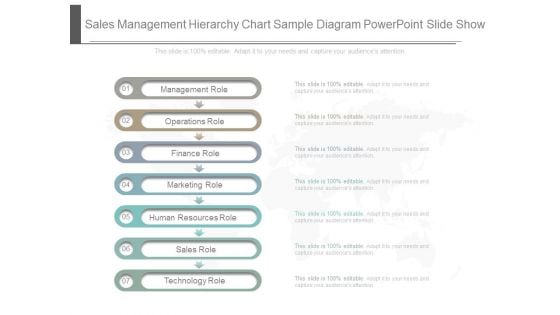
Sales Management Hierarchy Chart Sample Diagram Powerpoint Slide Show
This is a sales management hierarchy chart sample diagram powerpoint slide show. This is a seven stage process. The stages in this process are management role, operations role, finance role, marketing role, human resources role, sales role, technology role.
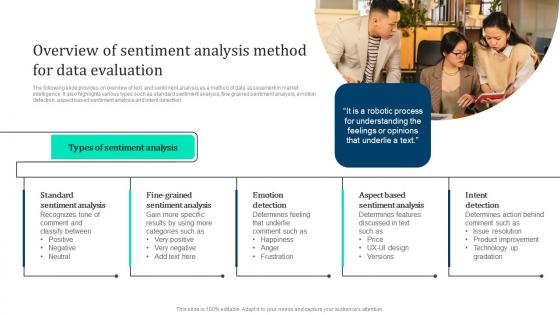
Overview Sentiment Analysis Method Marketing Intelligence Guide Data Gathering Sample Pdf
The following slide provides on overview of text and sentiment analysis as a method of data assessment in market intelligence. It also highlights various types such as standard sentiment analysis, fine grained sentiment analysis, emotion detection, aspect based sentiment analysis and intent detection. Do you know about Slidesgeeks Overview Sentiment Analysis Method Marketing Intelligence Guide Data Gathering Sample Pdf These are perfect for delivering any kind od presentation. Using it, create PowerPoint presentations that communicate your ideas and engage audiences. Save time and effort by using our pre designed presentation templates that are perfect for a wide range of topic. Our vast selection of designs covers a range of styles, from creative to business, and are all highly customizable and easy to edit. Download as a PowerPoint template or use them as Google Slides themes. The following slide provides on overview of text and sentiment analysis as a method of data assessment in market intelligence. It also highlights various types such as standard sentiment analysis, fine grained sentiment analysis, emotion detection, aspect based sentiment analysis and intent detection.
Hexagonal Chart With Finance And Communication Icons Powerpoint Template
Our above slide contains hexagonal chart with finance and communication icons. This PowerPoint template helps to display communication steps. Use this diagram to impart more clarity to data and to create more sound impact on viewers.

Social Media Chart Internet PowerPoint Templates And PowerPoint Backgrounds 0211
Microsoft PowerPoint Template and Background with social media mind map with networking concept Tickle their brains with our Social Media Chart Internet PowerPoint Templates And PowerPoint Backgrounds 0211. They will find you an entertaining speaker.
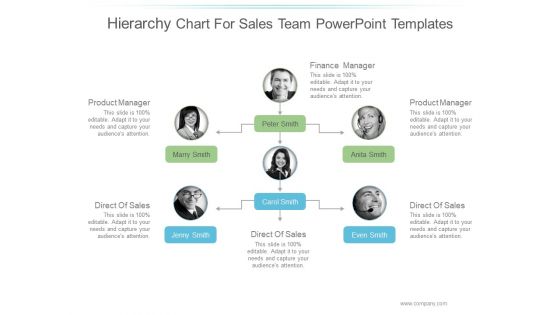
Hierarchy Chart For Sales Team Ppt PowerPoint Presentation Samples
This is a hierarchy chart for sales team ppt powerpoint presentation samples. This is a six stage process. The stages in this process are business, marketing, technology, product, management.
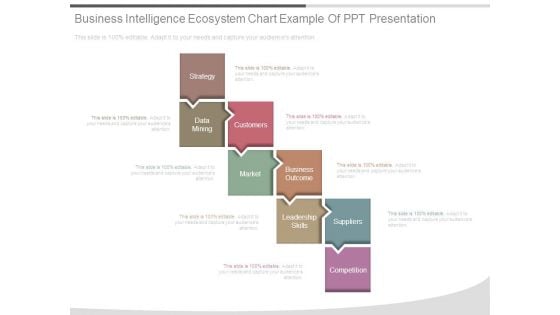
Business Intelligence Ecosystem Chart Example Of Ppt Presentation
This is a business intelligence ecosystem chart example of ppt presentation. This is a eight stage process. The stages in this process are strategy, data mining, customers, market, business outcome, leadership skills, suppliers, competition.
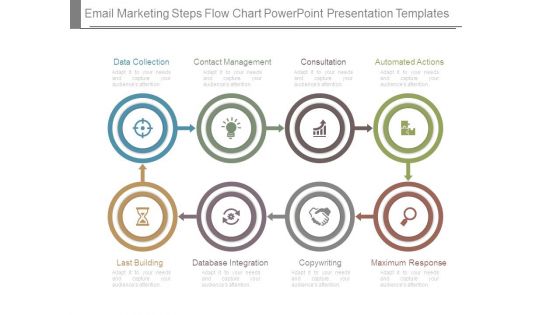
Email Marketing Steps Flow Chart Powerpoint Presentation Templates
This is a email marketing steps flow chart powerpoint presentation templates. This is a eight stage process. The stages in this process are data collection, contact management, consultation, automated actions, last building, database integration, copywriting, maximum response.
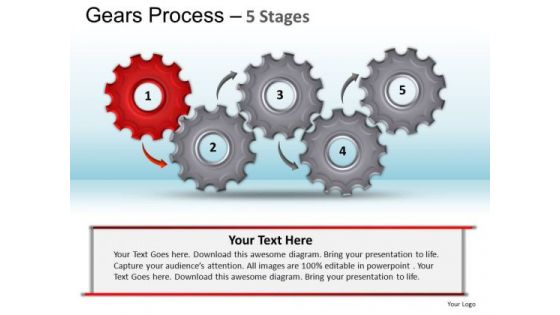
PowerPoint Design Slides Chart Gears Process Ppt Template
PowerPoint Design Slides Chart Gears Process PPT Template-The Circle of Life - a concept emmbedded in our minds and hence easy to comprehend. Life and Business is made up of processes comprising stages that flow from one to another. An excellent graphic to attract the attention of and understanding by your audience to improve earnings. Give your thoughts an extravagant display. Our PowerPoint Design Slides Chart Gears Process Ppt Template will add on extra dimensions.
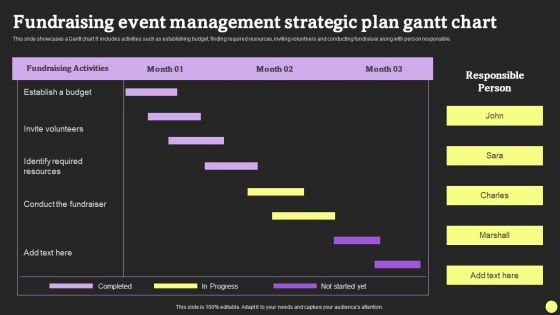
Fundraising Event Management Strategic Plan Gantt Chart Formats PDF
This slide showcases a Gantt chart It includes activities such as establishing budget, finding required resources, inviting volunteers and conducting fundraiser along with person responsible. Pitch your topic with ease and precision using this Fundraising Event Management Strategic Plan Gantt Chart Formats PDF. This layout presents information on Fundraising Activities, Invite Volunteers, Conduct The Fundraiser. It is also available for immediate download and adjustment. So, changes can be made in the color, design, graphics or any other component to create a unique layout.
Icons Slide For Global Wind Power Market Analysis PPT Example IR SS V
Help your business to create an attention-grabbing presentation using our Icons Slide For Global Wind Power Market Analysis PPT Example IR SS V set of slides. The slide contains innovative icons that can be flexibly edited. Choose this Icons Slide For Global Wind Power Market Analysis PPT Example IR SS V template to create a satisfactory experience for your customers. Go ahead and click the download button. Our Icons Slide For Global Wind Power Market Analysis PPT Example IR SS V are topically designed to provide an attractive backdrop to any subject. Use them to look like a presentation pro.
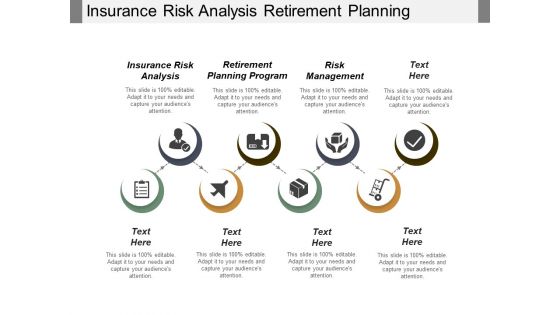
Insurance Risk Analysis Retirement Planning Program Risk Management Ppt PowerPoint Presentation Gallery Sample
This is a insurance risk analysis retirement planning program risk management ppt powerpoint presentation gallery sample. This is a eight stage process. The stages in this process are insurance risk analysis, retirement planning program, risk management.
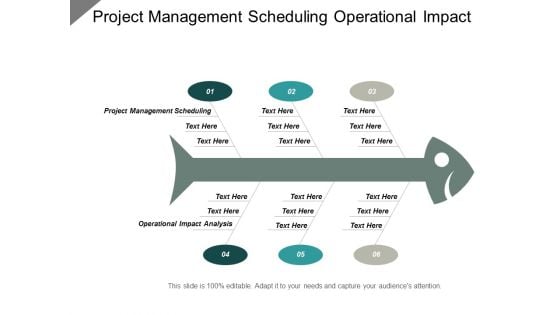
Project Management Scheduling Operational Impact Analysis Risk Management Ppt PowerPoint Presentation Portfolio Graphics Template
This is a project management scheduling operational impact analysis risk management ppt powerpoint presentation portfolio graphics template. This is a sex stage process. The stages in this process are project management scheduling, operational impact analysis, risk management.
Data Flow Chart Vector Icon Ppt PowerPoint Presentation File Samples
Presenting this set of slides with name data flow chart vector icon ppt powerpoint presentation file samples. This is a one stage process. The stages in this process are data icon, status icon, status symbol icon. This is a completely editable PowerPoint presentation and is available for immediate download. Download now and impress your audience.
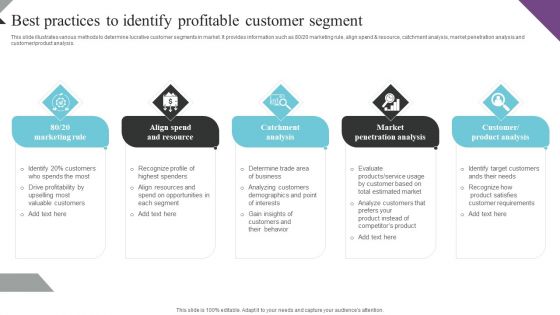
Customer Segmentation And Behavioral Analysis Best Practices To Identify Professional PDF
This slide illustrates various methods to determine lucrative customer segments in market. It provides information such as 80 20 marketing rule, align spend and resource, catchment analysis, market penetration analysis and customer product analysis. If you are looking for a format to display your unique thoughts, then the professionally designed Customer Segmentation And Behavioral Analysis Best Practices To Identify Professional PDF is the one for you. You can use it as a Google Slides template or a PowerPoint template. Incorporate impressive visuals, symbols, images, and other charts. Modify or reorganize the text boxes as you desire. Experiment with shade schemes and font pairings. Alter, share or cooperate with other people on your work. Download Customer Segmentation And Behavioral Analysis Best Practices To Identify Professional PDF and find out how to give a successful presentation. Present a perfect display to your team and make your presentation unforgettable.
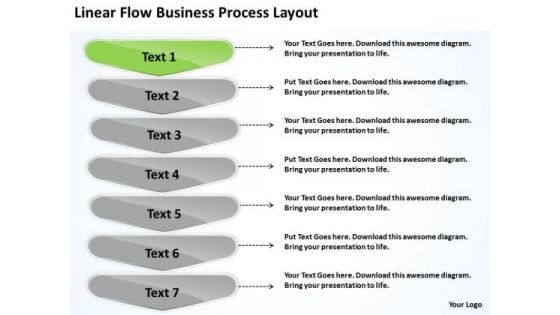
PowerPoint Presentation Process Layout Business Flow Chart Slides
We present our powerpoint presentation process layout business flow chart Slides.Use our Marketing PowerPoint Templates because networking is an imperative in todays world. You need to access the views of others. Similarly you need to give access to them of your abilities. Use our Leadership PowerPoint Templates because there are so many different pieces to the puzzle. Present our Business PowerPoint Templates because you have selected your team man for man. Download our Shapes PowerPoint Templates because it can bring your ideas to the fore so that all around can know. Dissect each idea to the core and select the best. Use our Arrows PowerPoint Templates because it is all there in bits and pieces.Use these PowerPoint slides for presentations relating to Abstract, Arrow, Arrows, Business, Chart, Design, Development, Diagram, Direction, Element, Flow, Flowchart, Graph, Linear, Management, Model, Motion, Organization, Plan, Process, Program, Section, Segment, Set, Sign, Solution, Strategy, Symbol, Technology,,. The prominent colors used in the PowerPoint template are White, Green, Gray. PowerPoint presentation experts tell us our powerpoint presentation process layout business flow chart Slides are Enchanting. Customers tell us our Chart PowerPoint templates and PPT Slides are Elevated. Use our powerpoint presentation process layout business flow chart Slides are Spectacular. Use our Arrows PowerPoint templates and PPT Slides are Dazzling. We assure you our powerpoint presentation process layout business flow chart Slides are Zippy. People tell us our Chart PowerPoint templates and PPT Slides are Stylish. Win trust with our PowerPoint Presentation Process Layout Business Flow Chart Slides. You will come out on top.
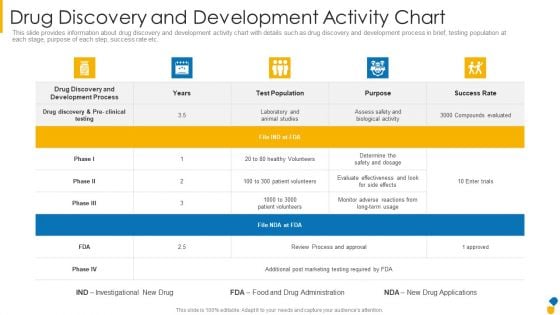
Drug Discovery And Development Activity Chart Introduction PDF
Deliver an awe inspiring pitch with this creative drug discovery and development activity chart introduction pdf bundle. Topics like drug discovery and development process, laboratory and animal studies, review process and approval can be discussed with this completely editable template. It is available for immediate download depending on the needs and requirements of the user.
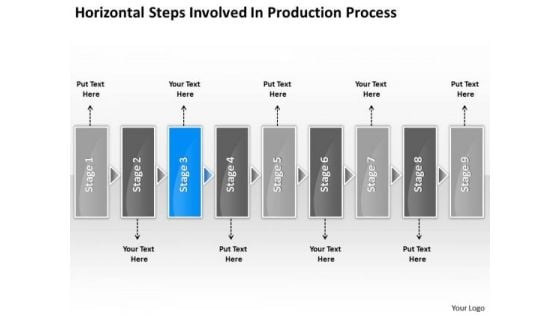
Steps Involved Production Processs Chart Electrical Design PowerPoint Slides
We present our steps involved production processs chart electrical design PowerPoint Slides.Download and present our Advertising PowerPoint Templates because you require care and diligence to function well. Download and present our Business PowerPoint Templates because you can see clearly through to the bigger bowl ahead. Time your jump to perfection and hit the nail on the head. Download and present our Shapes PowerPoint Templates because you have the people in place, selected the team leaders and all are raring to go. Download our Process and Flow PowerPoint Templates because there is a very good saying that prevention is better than cure, either way you have a store of knowledge for sure. Present our Arrows PowerPoint Templates because excite your audience with the brilliance of your thoughts.Use these PowerPoint slides for presentations relating to Abstract, Action, Attach, Box, Business, Center, Chain, Chart, Color, Communication, Concept, Connection, Cube, Cycle, Data, Diagram, Flow, Globe, Horizontal, Idea, Illustration, Information, Interaction, Jigsaw, Join, Link, Pieces, Process, Puzzle, Relation, Relationship, Shape, Success. The prominent colors used in the PowerPoint template are Blue, Gray, White. PowerPoint presentation experts tell us our steps involved production processs chart electrical design PowerPoint Slides will help you be quick off the draw. Just enter your specific text and see your points hit home. Customers tell us our Chart PowerPoint templates and PPT Slides are Flirty. Use our steps involved production processs chart electrical design PowerPoint Slides are Elevated. Use our Box PowerPoint templates and PPT Slides are Graceful. We assure you our steps involved production processs chart electrical design PowerPoint Slides are Majestic. People tell us our Chart PowerPoint templates and PPT Slides are Versatile. Beat criticism with our Steps Involved Production Processs Chart Electrical Design PowerPoint Slides. You will come out on top.
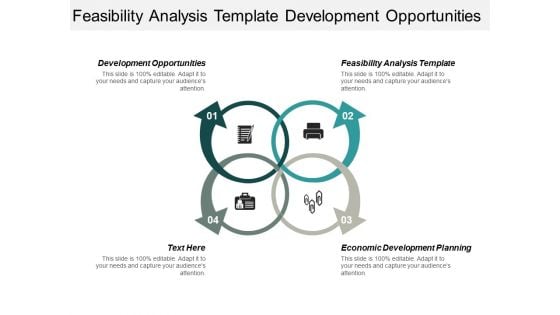
Feasibility Analysis Template Development Opportunities Economic Development Planning Ppt PowerPoint Presentation Portfolio Demonstration
This is a feasibility analysis template development opportunities economic development planning ppt powerpoint presentation portfolio demonstration. This is a four stage process. The stages in this process are feasibility analysis template, development opportunities, economic development planning.
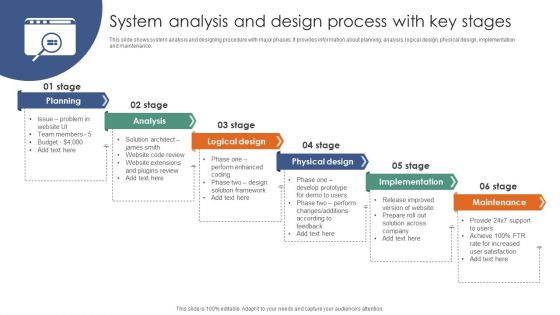
System Analysis And Design Process With Key Stages Ppt Layouts Background PDF
This slide shows system analysis and designing procedure with major phases. It provides information about planning, analysis, logical design, physical design, implementation and maintenance. Presenting System Analysis And Design Process With Key Stages Ppt Layouts Background PDF to dispense important information. This template comprises six stages. It also presents valuable insights into the topics including Planning, Analysis, Logical Design, Physical Design. This is a completely customizable PowerPoint theme that can be put to use immediately. So, download it and address the topic impactfully.
Financial Analysis Software Pricing Plans Guide To Corporate Financial Growth Plan Icons Pdf
This slide provides glimpse about multiple pricing plans for selected financial analysis software with its features. It includes features such as various financial tools and reports, sample reports availability, liquidity and profitability analysis, etc.The best PPT templates are a great way to save time, energy, and resources. Slidegeeks have 100Precent editable powerpoint slides making them incredibly versatile. With these quality presentation templates, you can create a captivating and memorable presentation by combining visually appealing slides and effectively communicating your message. Download Financial Analysis Software Pricing Plans Guide To Corporate Financial Growth Plan Icons Pdf from Slidegeeks and deliver a wonderful presentation. This slide provides glimpse about multiple pricing plans for selected financial analysis software with its features. It includes features such as various financial tools and reports, sample reports availability, liquidity and profitability analysis, etc.
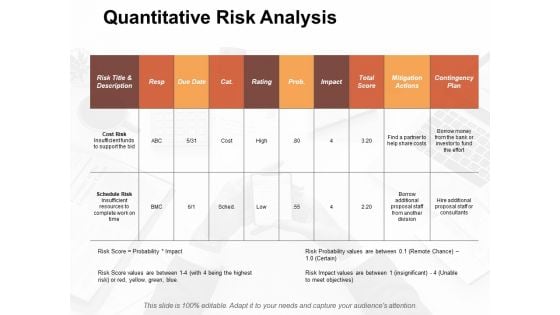
Quantitative Risk Analysis Slide2 Risk Estimator Ppt PowerPoint Presentation Layouts Themes
This is a quantitative risk analysis slide2 risk estimator ppt powerpoint presentation layouts themes. This is a two stage process. The stages in this process are business, management, strategy, analysis, marketing.
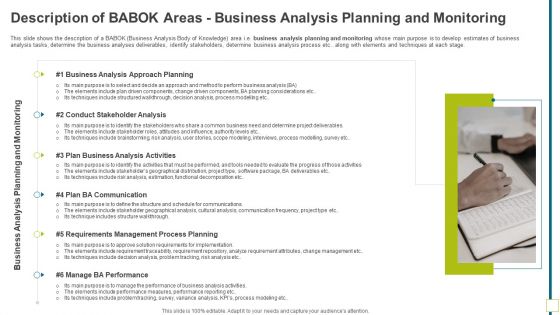
Description Of BABOK Areas Business Analysis Planning And Monitoring Template PDF
This slide shows the description of a BABOK Business Analysis Body of Knowledge area i.e. business analysis planning and monitoring whose main purpose is to develop estimates of business analysis tasks, determine the business analyses deliverables, identify stakeholders, determine business analysis process etc.. along with elements and techniques at each stage. Presenting description of babok areas business analysis planning and monitoring template pdf to provide visual cues and insights. Share and navigate important information on six stages that need your due attention. This template can be used to pitch topics like business analysis approach planning, stakeholder analysis, analysis activities, ba communication. In addtion, this PPT design contains high resolution images, graphics, etc, that are easily editable and available for immediate download.
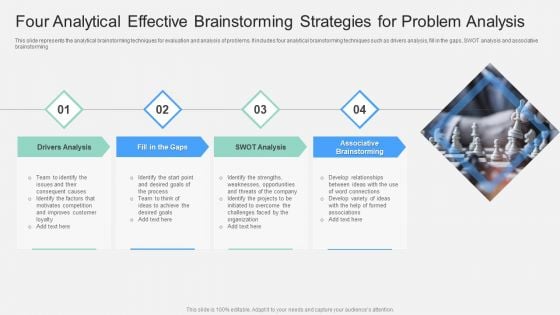
Four Analytical Effective Brainstorming Strategies For Problem Analysis Ppt Summary Slide PDF
This slide represents the analytical brainstorming techniques for evaluation and analysis of problems. It includes four analytical brainstorming techniques such as drivers analysis, fill in the gaps, SWOT analysis and associative brainstorming. Presenting Four Analytical Effective Brainstorming Strategies For Problem Analysis Ppt Summary Slide PDF to dispense important information. This template comprises four stages. It also presents valuable insights into the topics including Drivers Analysis, SWOT Analysis, Associative Brainstorming. This is a completely customizable PowerPoint theme that can be put to use immediately. So, download it and address the topic impactfully.
Development Leadership Program Research Data Analysis Liquidation Value Ppt PowerPoint Presentation File Graphics Example
This is a development leadership program research data analysis liquidation value ppt powerpoint presentation file graphics example. This is a four stage process. The stages in this process are development leadership program, research data analysis, liquidation value.
Break Even Analysis With Fixed And Variable Cost Export Business Plan Icons Pdf
The slides highlight the break-even analysis of the firm. This analysis provides an estimate of the minimum volume of revenue required to cover the fixed cost of business. Below this point, the business will make a financial loss. Slidegeeks is one of the best resources for PowerPoint templates. You can download easily and regulate Break Even Analysis With Fixed And Variable Cost Export Business Plan Icons Pdf for your personal presentations from our wonderful collection. A few clicks is all it takes to discover and get the most relevant and appropriate templates. Use our Templates to add a unique zing and appeal to your presentation and meetings. All the slides are easy to edit and you can use them even for advertisement purposes. The slides highlight the break-even analysis of the firm. This analysis provides an estimate of the minimum volume of revenue required to cover the fixed cost of business. Below this point, the business will make a financial loss.
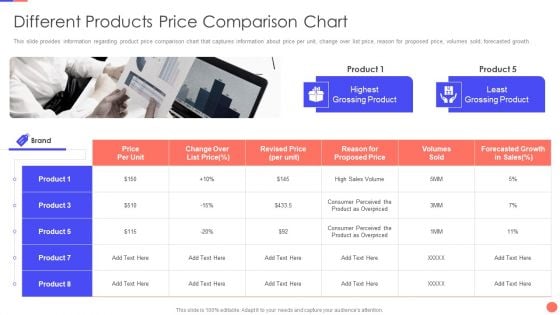
Sales Techniques Playbook Different Products Price Comparison Chart Demonstration PDF
This slide provides information regarding product price comparison chart that captures information about price per unit, change over list price, reason for proposed price, volumes sold, forecasted growth. This is a sales techniques playbook different products price comparison chart demonstration pdf template with various stages. Focus and dispense information on two stages using this creative set, that comes with editable features. It contains large content boxes to add your information on topics like product, consumer, price, growth. You can also showcase facts, figures, and other relevant content using this PPT layout. Grab it now.
Report Icon Audit And Analysis Ppt PowerPoint Presentation Portfolio Infographic Template
This is a report icon audit and analysis ppt powerpoint presentation portfolio infographic template. This is a four stage process. The stages in this process are document review, document analysis, document evaluation.
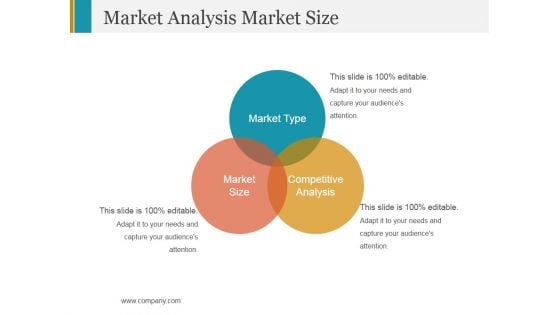
Market Analysis Market Size Template 1 Ppt PowerPoint Presentation Gallery Images
This is a market analysis market size template 1 ppt powerpoint presentation gallery images. This is a three stage process. The stages in this process are market type, market size, competitive analysis.
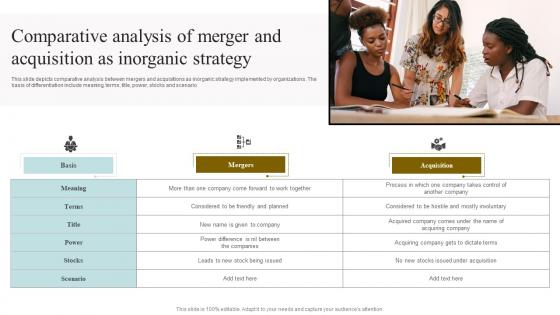
Comparative Analysis Of Merger And Acquisition As Inorganic Strategy Diagrams Pdf
This slide depicts comparative analysis between mergers and acquisitions as inorganic strategy implemented by organizations. The basis of differentiation include meaning, terms, title, power, stocks and scenario Pitch your topic with ease and precision using this Comparative Analysis Of Merger And Acquisition As Inorganic Strategy Diagrams Pdf. This layout presents information on Basis, Mergers, Acquisition. It is also available for immediate download and adjustment. So, changes can be made in the color, design, graphics or any other component to create a unique layout. This slide depicts comparative analysis between mergers and acquisitions as inorganic strategy implemented by organizations. The basis of differentiation include meaning, terms, title, power, stocks and scenario


 Continue with Email

 Home
Home


