Chart Analysis
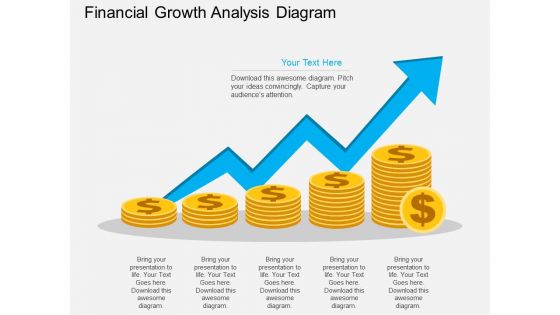
Financial Growth Analysis Diagram Powerpoint Template
Develop competitive advantage with our above template which contains coins stacks with blue arrow. This diagram may be used to exhibit financial growth analysis. You can edit text, color, shade and style as per you need.
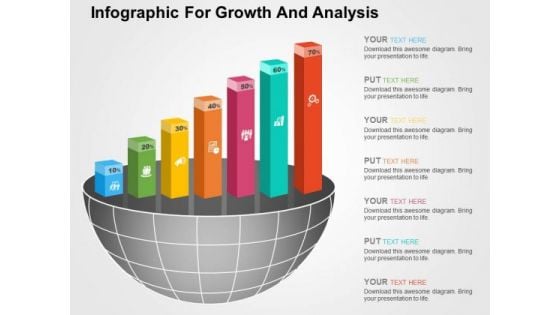
Infographic For Growth And Analysis PowerPoint Templates
This business slide has been designed infographic layout. Download this diagram to display business growth and analysis. Use this professional template to make the presentation outstanding and remarkable.
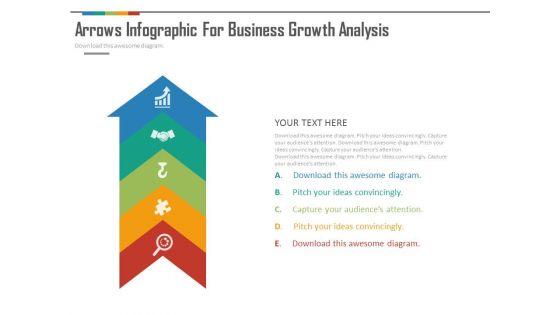
Arrow Infographics For Strategic Analysis Powerpoint Slides
This PowerPoint template contains design of arrow infographic. Download this diagram slide to depict strategic analysis. Use this PPT slide to make impressive presentations.
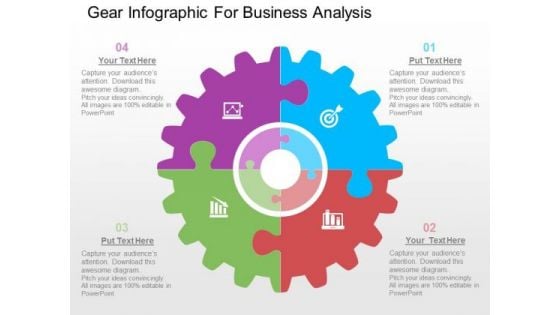
Gear Infographic For Business Analysis PowerPoint Templates
Our above slide contains diagram of gear infographic. This gear infographic slide helps to exhibit business analysis. Use this diagram to impart more clarity to data and to create more sound impact on viewers.
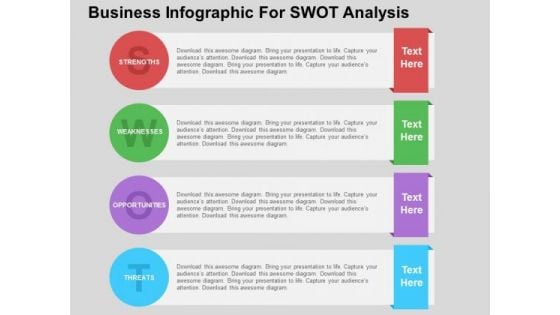
Business Infographic For Swot Analysis PowerPoint Template
This professional diagram slide has been designed with graphics of SWOT analysis. You may use this diagram to analyze strengths, weakness, opportunities and threats for your business. It will help you to sequence your thoughts.

Four Staged Competitive Analysis Model Powerpoint Template
This PowerPoint slide contains matrix diagram of four steps. This professional slide may be used for competitive analysis. Adjust the above diagram in your business presentations to give professional impact.
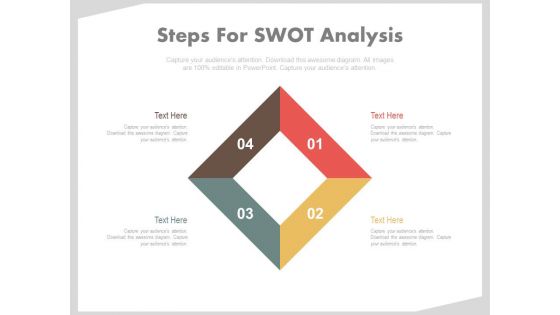
Diamond Design For Swot Analysis Powerpoint Slides
This PPT slide has been designed with graphics of four steps diamond diagram. This business diagram helps to exhibit SWOT analysis. Use this PowerPoint template to build an exclusive presentation.
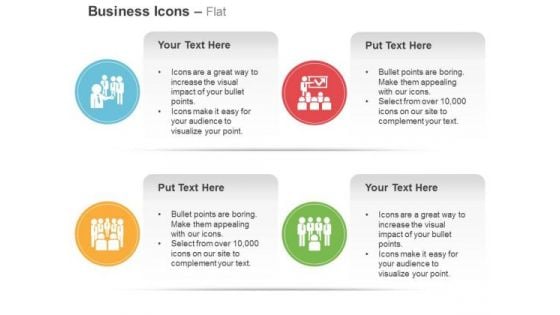
Leadership Team Management Analysis Ppt Slides Graphics
Concept of leadership and team management can be well explained with these icons. This template contains the professional designed icons for time management, leadership and analysis. Amplify your thoughts via our appropriate template.
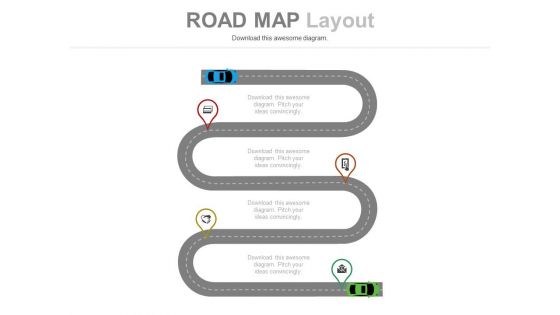
Linear Roadmap For Success Analysis Powerpoint Slides
This infographic timeline template can be used for multiple purposes including event planning, new milestones and tasks. This PPT slide may be helpful to display success steps and analysis. Download this PowerPoint timeline template to make impressive presentations.
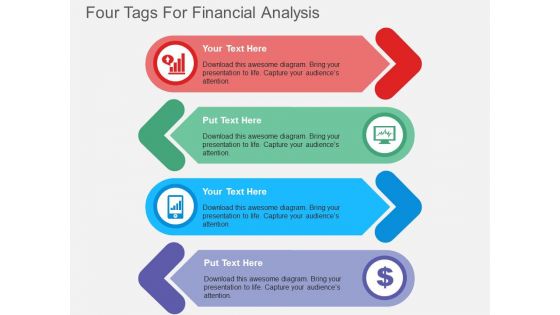
Four Tags For Financial Analysis Powerpoint Template
This business slide contains graphics of four colored banners. You may download this diagram to exhibit financial analysis. Grab center stage with this slide and capture the attention of your audience.
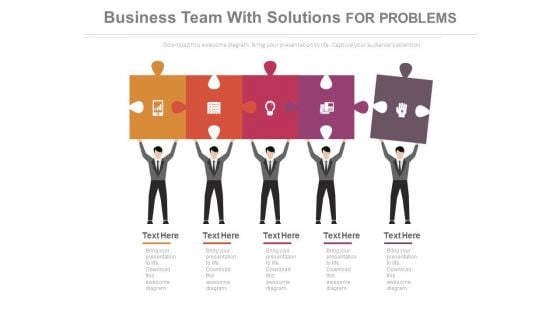
Team Together For Conjoint Analysis Powerpoint Template
This power point template has been designed with team and puzzle pieces. This diagram helps to portray the concept of conjoint analysis. Download this template to leave permanent impression on your audience.
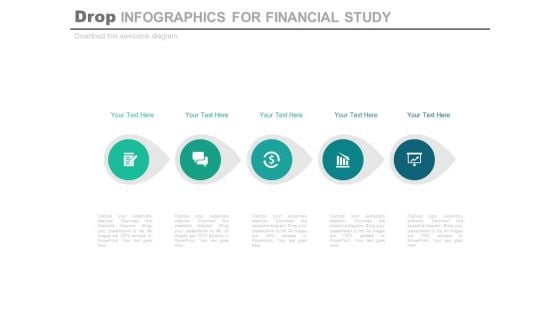
Circle Infographics For Financial Analysis Powerpoint Template
This business slide contains circular infographic design. This diagram may be used to depict financial process analysis. Visual effect this slide helps in maintaining the flow of the discussion and provides more clarity to the subject.

Swot Analysis Flower Petal Design Powerpoint Template
This PPT slide has been designed with graphics of flower petals diagram. Download this PowerPoint to depict SWOT analysis. Imprint your concepts with this professional slide in your presentations.?
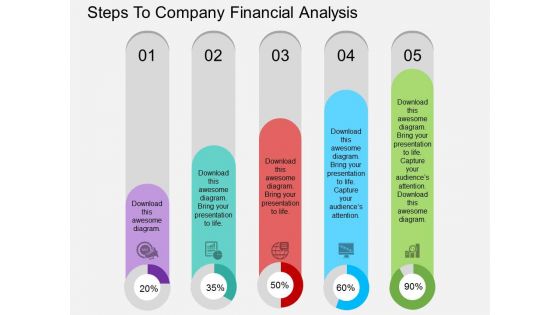
Steps To Company Financial Analysis Powerpoint Template
Visually support your presentation with our above template of modern business icons. This slide has been professionally designed to display financial analysis. This template offers an excellent background to build impressive presentation.

Business Strategy Analysis With Team Powerpoint Slides
On this template you can layout of team meeting. This PowerPoint slide is an excellent tool for business strategy analysis. Download this PPT slide for team strategy and planning related topics.
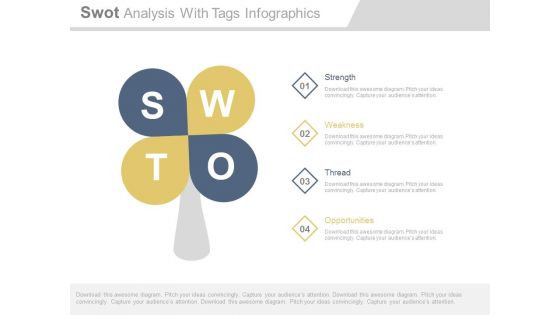
Swot Analysis Layout For Business PowerPoint Slides
This slide is also among the most downloaded template for PowerPoint presentations being used by corporate sectors. This PPT slide has a tree and a flower shaped figure with petals depicting the SWOT (Strength, Weaknesses, Opportunity, Threats) analysis. The colored slide brings a different and innovative look to an otherwise theoretical or text centered topic. The slide is a creative piece of work and can alternatively be used for some other process as well which takes place in 4 steps. The slide can be an effective tool to explain the sales strategy to the professionals to reach the desired targets and goals. The slide is customizable and the colors and font styles can be edited to match the theme of the slide or as per the needs and requirements of the presenter. \n

Cloud Computing Project Analysis Diagram Powerpoint Template
Our above PPT slide contains graphics of cloud with technology icons. This PowerPoint template may be used for project related to cloud computing. Use this diagram to impart more clarity to data and to create more sound impact on viewers.
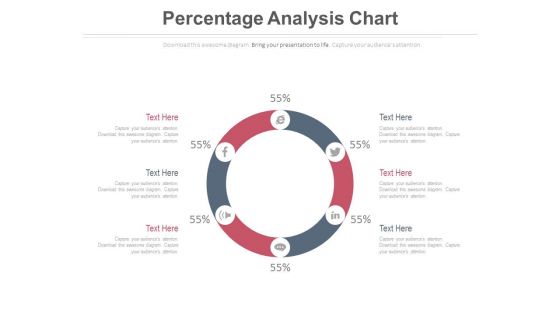
Circular Diagram For Percentage Analysis Powerpoint Slides
This PowerPoint slide has been designed with circular diagram with social media icons. This diagram slide may be used to display users of social media. Prove the viability of your ideas with this professional slide.
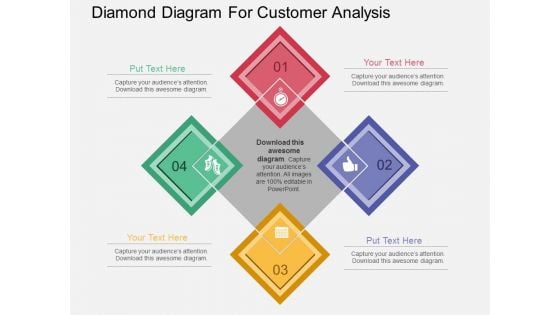
Diamond Diagram For Customer Analysis Powerpoint Template
This business slide contains graphics of four diamonds with icons. This diagram provides schematic representation of any information. Visual effect this slide helps in maintaining the flow of the discussion and provides more clarity to the subject.

Global Social Networking Analysis Diagram Powerpoint Template
Our above PowerPoint slide contains diagram of globe with people pictures. Download this business slide to illustrate social networking. Use this diagram to impart more clarity to data and to create more sound impact on viewers.
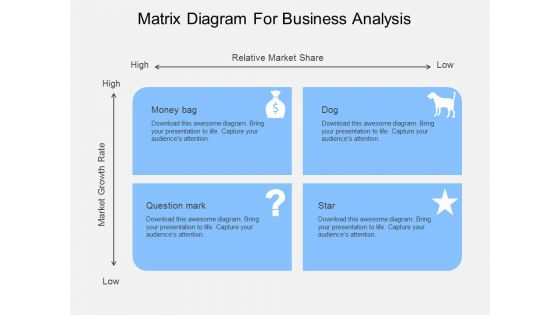
Matrix Diagram For Business Analysis Powerpoint Template
Our professionally designed business diagram is as an effective tool for communicating concepts of process control and management. This slide displays graphics of matrix diagram. Convey your views with this diagram slide.
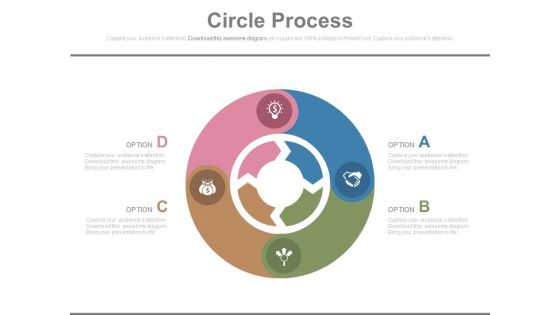
Circle Process For Financial Analysis Powerpoint Template
This business slide has been designed with circle diagram of four icons. This diagram has been designed to display financial planning. Develop your marketing strategy and communicate with your team with this professional slide design.
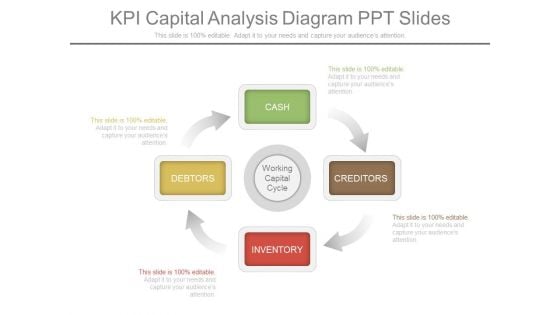
Kpi Capital Analysis Diagram Ppt Slides
This is a kpi capital dashboard ppt slides. This is a four stage process. The stages in this process are cash, creditors, inventory, debtors.
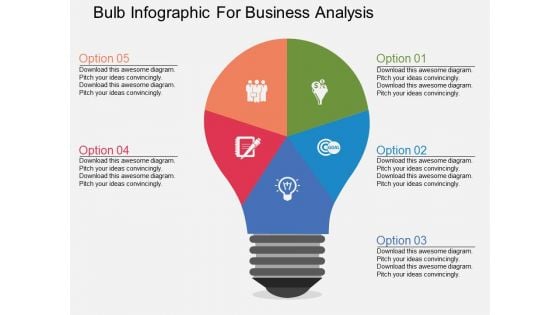
Bulb Infographic For Business Analysis Powerpoint Templates
This PowerPoint slide contains graphics of bulb diagram with icons. It helps to exhibit concepts of marketing strategy. Use this diagram to impart more clarity to data and to create more sound impact on viewers.
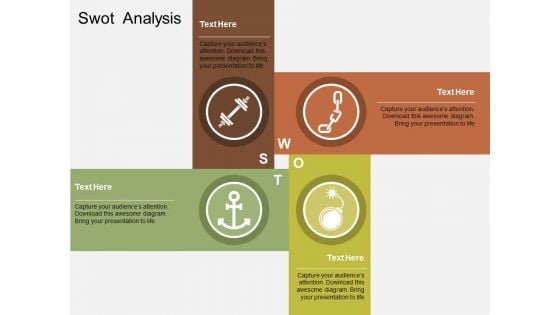
Swot Analysis Infographic Layout Powerpoint Templates
Stop watch with icons has been used to design this power point template. This diagram may be used to display time planning for business strategy. Use this unique slide to present you?re your views in an effective manner.

Stopwatch With Percentage Value Analysis Powerpoint Slides
The above template displays a diagram of stopwatch with percentage value. This diagram has been professionally designed to emphasize on time management. Grab center stage with this slide and capture the attention of your audience.
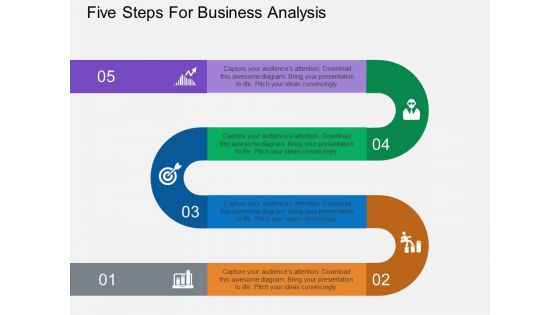
Five Steps For Business Analysis Powerpoint Template
Our above business diagram contains zigzag infographic layout. This slide is suitable to present marketing research and strategy. Use this business diagram to present your work in a more smart and precise manner.
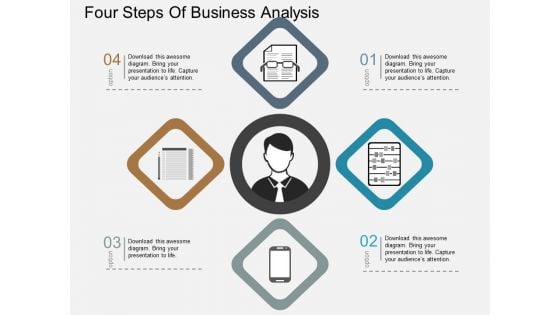
Four Steps Of Business Analysis Powerpoint Templates
Our above slide displays four icons around business man. This PPT slide contains the concept of business management and strategy. You have your strategy well thought out. Facilitate the understanding with this PPT slide.
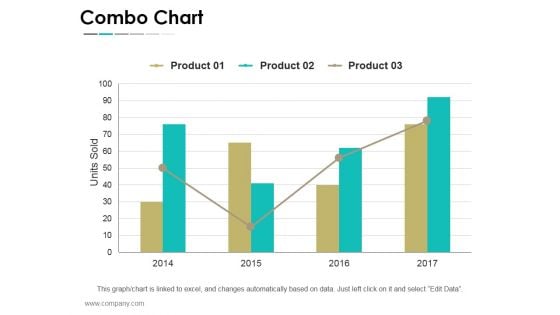
Combo Chart Ppt PowerPoint Presentation Slides Smartart
This is a combo chart ppt powerpoint presentation slides smartart. This is a four stage process. The stages in this process are business, strategy, analysis, planning, combo chart.
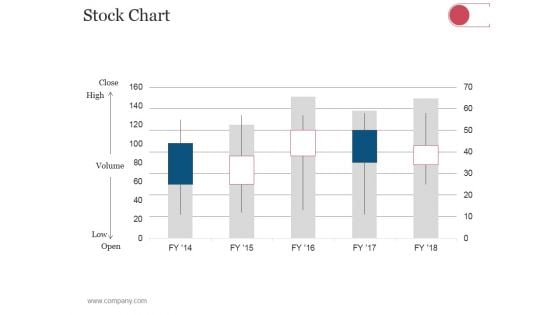
Stock Chart Ppt PowerPoint Presentation Diagram Ppt
This is a stock chart ppt powerpoint presentation diagram ppt. This is a five stage process. The stages in this process are business, strategy, analysis, marketing, stock chart.
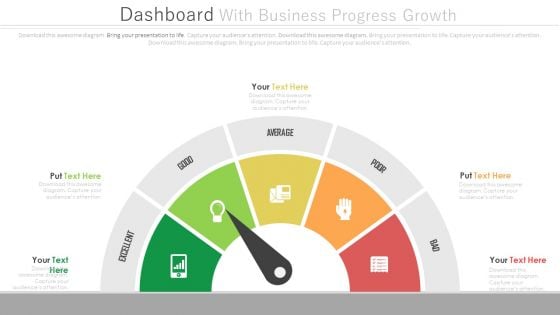
Dashboard To Simplify Business Data Analysis Powerpoint Slides
This PowerPoint template graphics of meter chart. Download this PPT chart to simplify business data analysis. This PowerPoint slide is of great help in the business sector to make realistic presentations and provides effective way of presenting your newer thoughts.
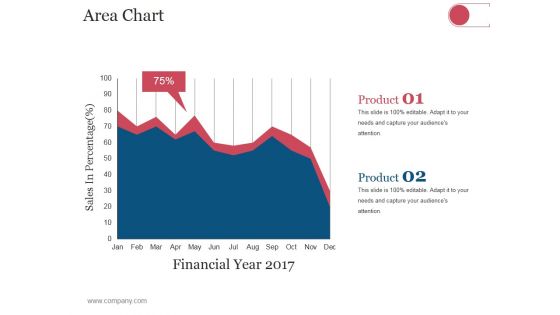
Area Chart Ppt PowerPoint Presentation Professional Infographics
This is a area chart ppt powerpoint presentation professional infographics. This is a two stage process. The stages in this process are business, strategy, analysis, planning, area chart.
Area Chart Ppt PowerPoint Presentation Icon Microsoft
This is a area chart ppt powerpoint presentation icon microsoft. This is a two stage process. The stages in this process are business, strategy, analysis, planning, area chart.
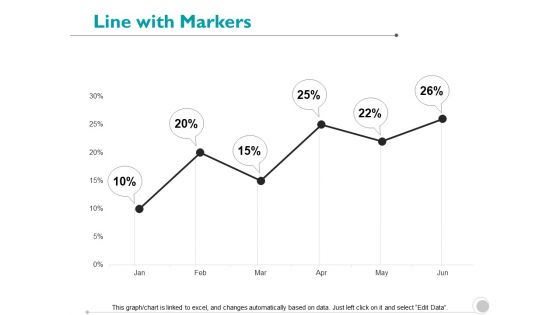
Line With Markers Marketing Analysis Ppt PowerPoint Presentation Pictures Portrait
Presenting this set of slides with name line with markers marketing analysis ppt powerpoint presentation pictures portrait. The topics discussed in these slides are line chart, finance, marketing, analysis, investment. This is a completely editable PowerPoint presentation and is available for immediate download. Download now and impress your audience.
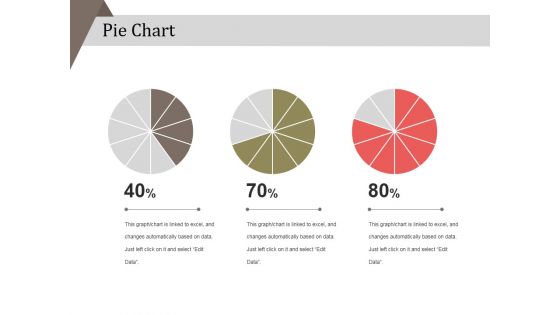
Pie Chart Ppt PowerPoint Presentation Layouts Example
This is a pie chart ppt powerpoint presentation layouts example. This is a three stage process. The stages in this process are business, strategy, analysis, pie chart, finance, marketing.
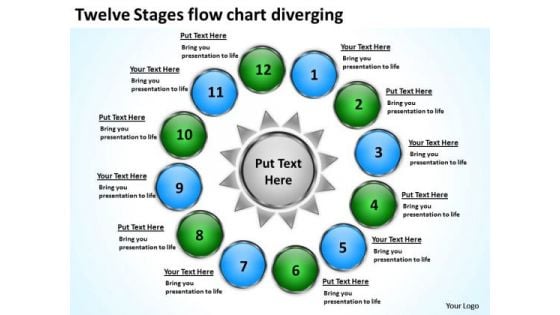
Twelve Stages Flow Chart Diverging Charts And PowerPoint Slides
We present our twelve stages flow chart diverging Charts and PowerPoint Slides.Present our Circle Charts PowerPoint Templates because this diagram helps to reaffirm to your team your faith in maintaining the highest ethical standards. Present our Arrows PowerPoint Templates because it helps you to get your team in the desired sequence into the bracket. Present our Business PowerPoint Templates because profit levels have been steady over the recent past. Spread your heightened excitement to others in the room. Present our Shapes PowerPoint Templates because our cleverly selected background hues are guaranteed to achieve this aim. Download and present our Flow Charts PowerPoint Templates because the ideas and plans are on your finger tips.Use these PowerPoint slides for presentations relating to analysis, analyze, background, blank, business, businessman, center, central, chart, component, concept, connect, core, decentralize, deploy, diagram, disperse, disseminate, distribute, diverge, diverse, diversify, divide, education, element, empty, expand, extend, flow, gist, group, hand, industry, link, management, manager, part, people, person, plan, process, scatter. The prominent colors used in the PowerPoint template are Blue, Green, Gray. Customers tell us our twelve stages flow chart diverging Charts and PowerPoint Slides are Elevated. PowerPoint presentation experts tell us our business PowerPoint templates and PPT Slides effectively help you save your valuable time. People tell us our twelve stages flow chart diverging Charts and PowerPoint Slides will help them to explain complicated concepts. People tell us our business PowerPoint templates and PPT Slides are Second to none. Customers tell us our twelve stages flow chart diverging Charts and PowerPoint Slides are Beautiful. People tell us our central PowerPoint templates and PPT Slides are aesthetically designed to attract attention. We guarantee that they will grab all the eyeballs you need. Our Twelve Stages Flow Chart Diverging Charts And PowerPoint Slides have more than what meets the eye. They contain additional dimensions.
bar chart ppt powerpoint presentation professional icons
This is a bar chart ppt powerpoint presentation professional icons. This is a two stage process. The stages in this process are bar chart, finance, marketing, strategy, analysis.
Bubble Chart Ppt PowerPoint Presentation Icon Gridlines
This is a bubble chart ppt powerpoint presentation icon gridlines. This is a two stage process. The stages in this process are bubble chart, finance, marketing, strategy, analysis.
Area Chart Ppt PowerPoint Presentation File Icons
This is a area chart ppt powerpoint presentation file icons. This is a two stage process. The stages in this process are area chart, finance, marketing, strategy, analysis.

Radar Chart Ppt PowerPoint Presentation Styles Show
This is a radar chart ppt powerpoint presentation styles show. This is a two stage process. The stages in this process are business, strategy, marketing, analysis, radar chart.
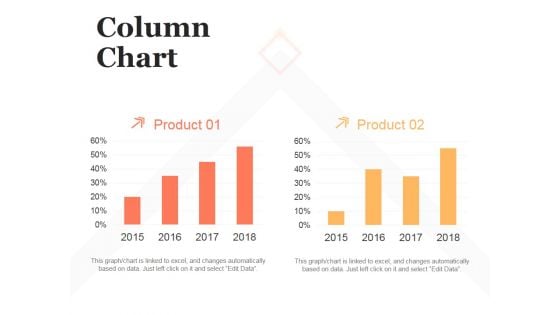
Column Chart Ppt PowerPoint Presentation Influencers
This is a column chart ppt powerpoint presentation influencers. This is a two stage process. The stages in this process are column chart, finance, marketing, strategy, analysis, business.
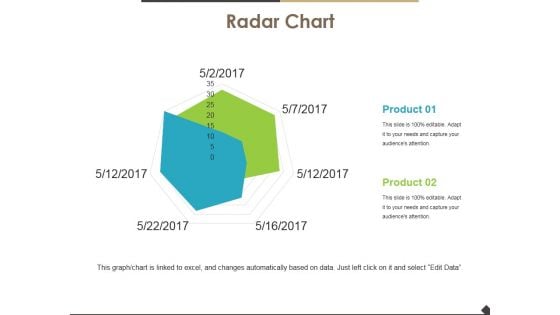
Radar Chart Ppt PowerPoint Presentation Inspiration Layouts
This is a radar chart ppt powerpoint presentation inspiration layouts. This is a two stage process. The stages in this process are radar chart, product, marketing, strategy, analysis.
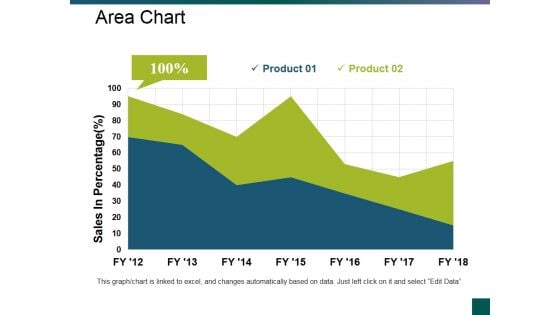
Area Chart Ppt PowerPoint Presentation File Gallery
This is a area chart ppt powerpoint presentation file gallery. This is a two stage process. The stages in this process are area chart, business, finance, marketing, analysis.
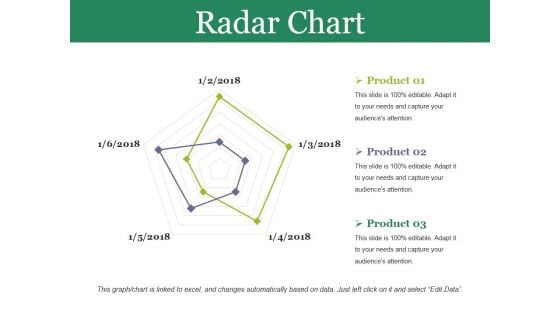
Radar Chart Ppt PowerPoint Presentation Styles Clipart
This is a radar chart ppt powerpoint presentation styles clipart. This is a two stage process. The stages in this process are finance, business, analysis, radar chart, strategy.
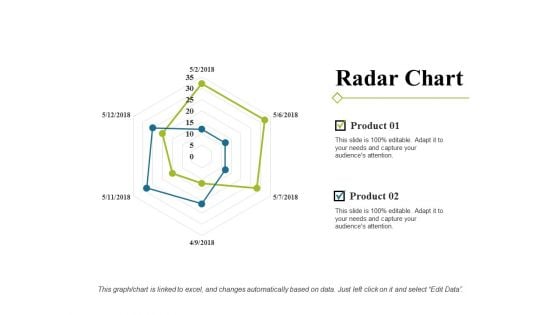
Radar Chart Ppt PowerPoint Presentation Portfolio Show
This is a radar chart ppt powerpoint presentation portfolio show. This is a two stage process. The stages in this process are radar chart, finance, marketing, strategy, analysis.
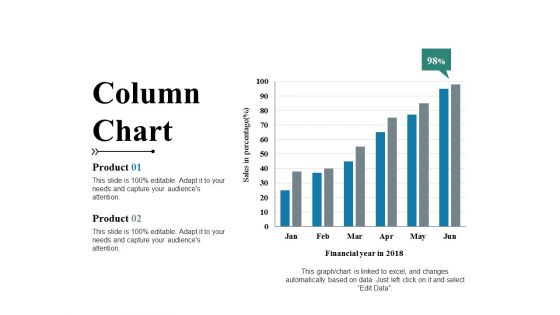
Column Chart Ppt PowerPoint Presentation Inspiration Inspiration
This is a column chart ppt powerpoint presentation inspiration inspiration. This is a two stage process. The stages in this process are column chart, growth, strategy, business, analysis.
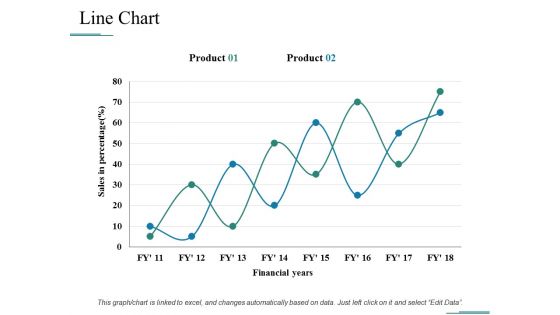
Line Chart Ppt PowerPoint Presentation Ideas Tips
This is a line chart ppt powerpoint presentation ideas tips. This is a two stage process. The stages in this process are line chart, growth, strategy, business, analysis.
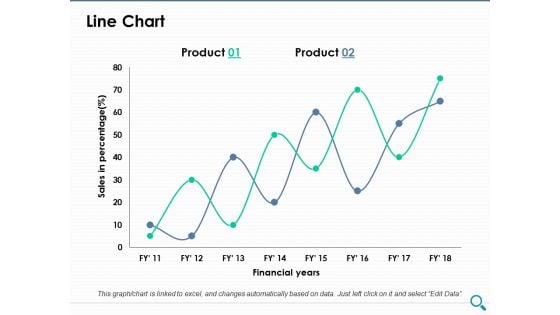
Line Chart Ppt PowerPoint Presentation Model Model
This is a line chart ppt powerpoint presentation model model. This is a two stage process. The stages in this process are line chart, growth, strategy, business, analysis.
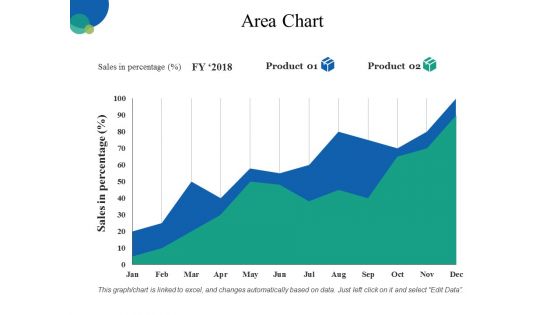
Area Chart Ppt PowerPoint Presentation Guidelines
This is a area chart ppt powerpoint presentation guidelines. This is a two stage process. The stages in this process are business, marketing, analysis, area chart, finance.
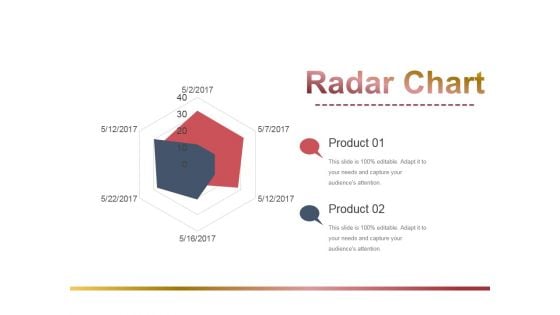
Radar Chart Ppt PowerPoint Presentation Pictures Guidelines
This is a radar chart ppt powerpoint presentation pictures guidelines. This is a two stage process. The stages in this process are business, strategy, marketing, analysis, radar chart.
Combo Chart Ppt PowerPoint Presentation Icon Portrait
This is a combo chart ppt powerpoint presentation icon portrait. This is a three stage process. The stages in this process are combo chart, finance, marketing, strategy, analysis.
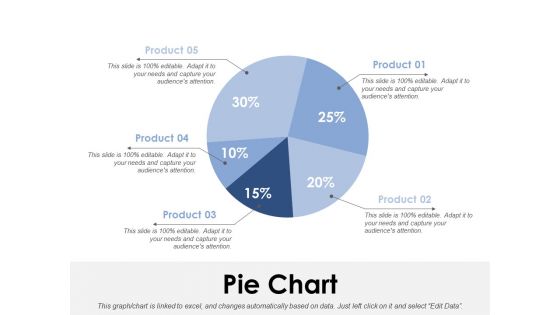
Pie Chart Ppt PowerPoint Presentation Outline Gallery
This is a pie chart ppt powerpoint presentation outline gallery. This is a five stage process. The stages in this process are pie chart, finance, marketing, strategy, analysis.
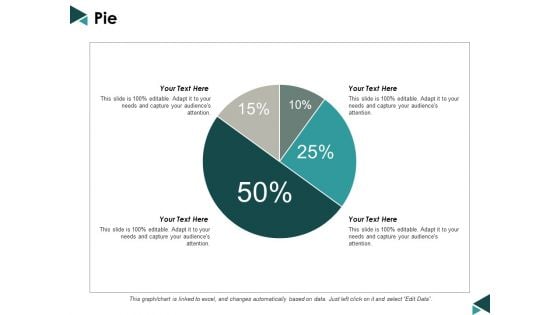
Pie Business Analysis Ppt Powerpoint Presentation Model Graphics
This is a pie business analysis ppt powerpoint presentation model graphics. This is a four stage process. The stages in this process are pie chart, percentage, marketing, business, analysis.

Line Chart Ppt PowerPoint Presentation Visuals
This is a line chart ppt powerpoint presentation visuals. This is a three stage process. The stages in this process are business, strategy, analysis, success, chart and graph.
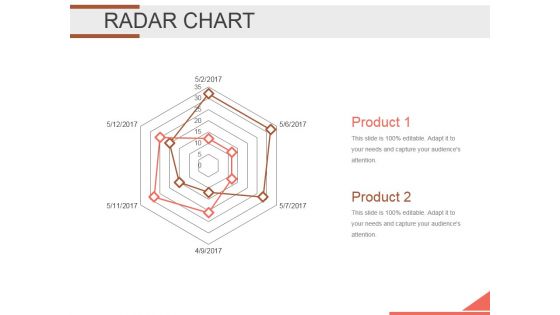
Radar Chart Ppt PowerPoint Presentation Designs Download
This is a radar chart ppt powerpoint presentation designs download. This is a two stage process. The stages in this process are radar chart, management, product, business, analysis.

Line Chart Ppt PowerPoint Presentation Gallery Good
This is a line chart ppt powerpoint presentation gallery good. This is a two stage process. The stages in this process are business, strategy, marketing, analysis, line chart.
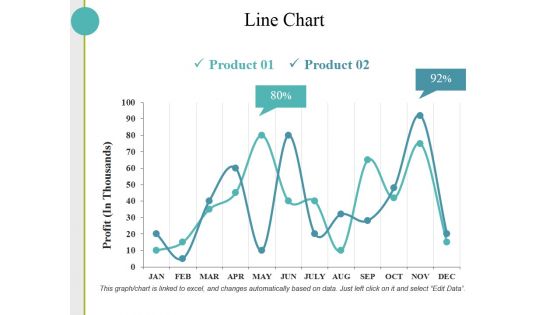
Line Chart Ppt PowerPoint Presentation Outline Templates
This is a line chart ppt powerpoint presentation outline templates. This is a two stage process. The stages in this process are line chart, growth, strategy, business, analysis.
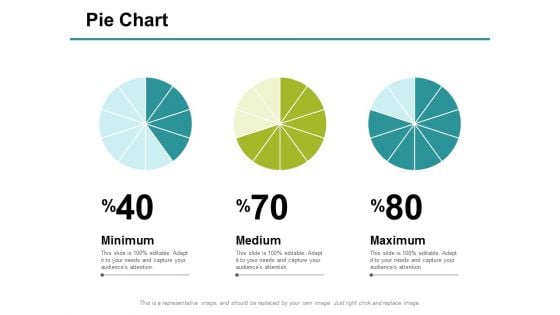
Pie Chart Ppt PowerPoint Presentation Model Examples
This is a pie chart ppt powerpoint presentation model examples. This is a three stage process. The stages in this process are pie chart, minimum, medium, maximum, analysis.
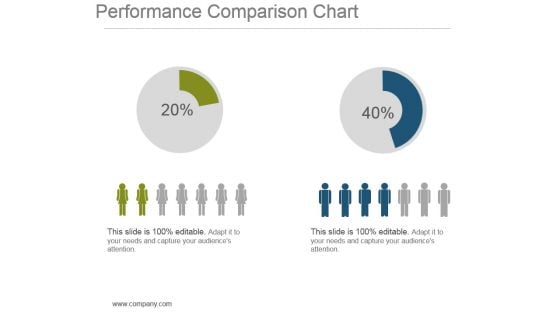
Performance Comparison Chart Powerpoint Show
This is a performance comparison chart powerpoint show. This is a two stage process. The stages in this process are finance, compare, strategy, management, planning.
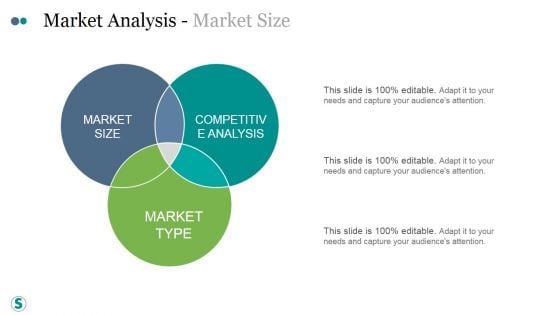
Market Analysis Market Size Ppt PowerPoint Presentation Microsoft
This is a market analysis market size ppt powerpoint presentation designs. This is a six stage process. The stages in this process are business, strategy, marketing, analysis, success, pie chart.


 Continue with Email

 Home
Home


