Chart Analysis

Commodity Category Analysis Ppt PowerPoint Presentation Complete Deck With Slides
This complete presentation has PPT slides on wide range of topics highlighting the core areas of your business needs. It has professionally designed templates with relevant visuals and subject driven content. This presentation deck has total of eighty four slides. Get access to the customizable templates. Our designers have created editable templates for your convenience. You can edit the colour, text and font size as per your need. You can add or delete the content if required. You are just a click to away to have this ready made presentation. Click the download button now.

Tactical Analysis Ppt PowerPoint Presentation Complete Deck With Slides
This complete presentation has PPT slides on wide range of topics highlighting the core areas of your business needs. It has professionally designed templates with relevant visuals and subject driven content. This presentation deck has total of seventy one slides. Get access to the customizable templates. Our designers have created editable templates for your convenience. You can edit the colour, text and font size as per your need. You can add or delete the content if required. You are just a click to away to have this ready made presentation. Click the download button now.
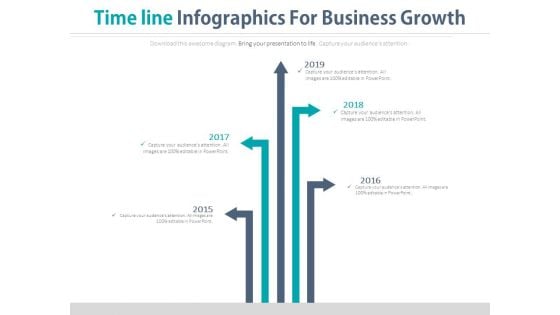
Five Arrows Timeline Diagram For Business Analysis Powerpoint Slides
This arrows timeline template can be used for multiple purposes including business planning, new milestones and tasks. It contains five arrows pointing in different directions. Download this PowerPoint timeline template to make impressive presentations.
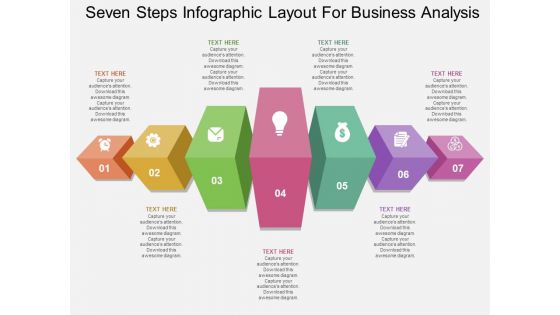
Seven Steps Infographic Layout For Business Analysis Powerpoint Template
This business slide contains diagram of seven cubes with icons. This PowerPoint template is suitable to present business planning and strategy steps. Use this business diagram to present your work in a more smart and precise manner.
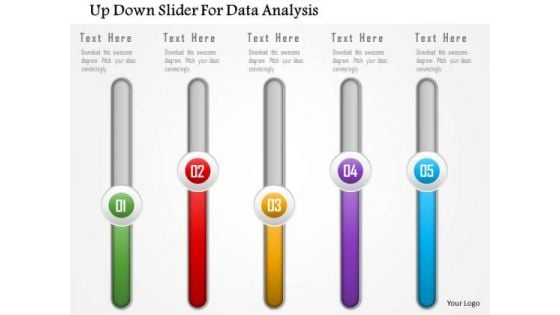
Business Diagram Up Down Slider For Data Analysis Presentation Template
This business diagram has been designed with graphics of slider. You may download this professional slide to display data trends. Transmit your thoughts via this slide.
Banners With Icons For Information Analysis Powerpoint Templates
Communicate with your group through this slide of banners. It will facilitate understanding of your views. This diagram can be used to explain the process steps in business presentations.
Upward Arrow With Growth Analysis Icons PowerPoint Slides
Now talk about your company?s growth in a more creative manner. This innovatively designed PPT slide will help you. Show your company?s growth to your colleagues or to your clients with the help of this slide. Two step arrows clearly depicts the achievements of the organization. You can also use this slide to show how high you are aiming or your company. This diagram has two icons in it which are editable. You can also add color of your own choice in the diagram. Use this PowerPoint template and let world see your achievements.
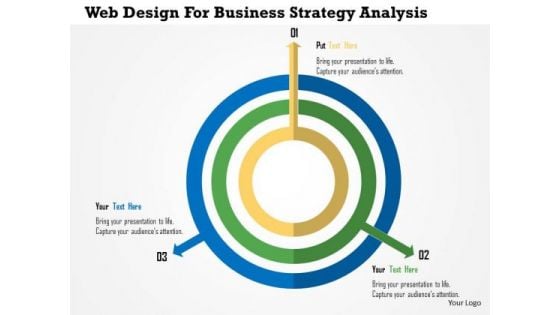
Business Diagram Web Design For Business Strategy Analysis Presentation Template
This business diagram has been designed with concentric circles with three arrows. This slide displays three steps of business process. Download this diagram slide to make professional presentations.

Corporate Vision And Mission Analysis Diagram Powerpoint Slides
This PPT slide contains corporate vision diagram slide. Use this PPT slide to depict companys vision and strategy. This PowerPoint template can be customized as per your requirements.
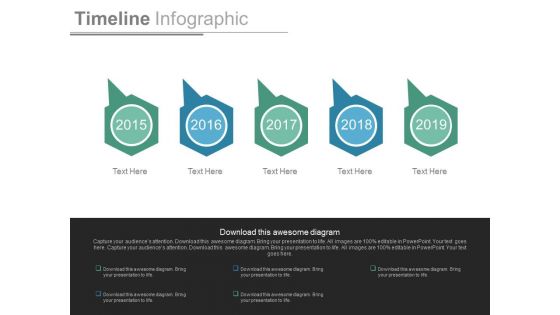
Timeline Design For Year Based Analysis Powerpoint Slides
This PowerPoint diagram consists of timeline tags design representing planning steps. This PowerPoint template may be used to display when events or steps should happen. This timeline design is most useful for showing important milestones and deadlines.
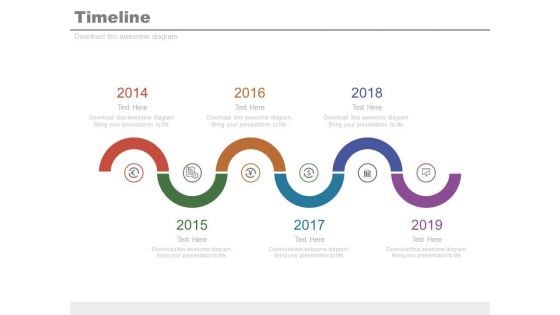
Six Staged Spiral Timeline For Financial Analysis Powerpoint Slides
This infographic template contains graphics of six staged spiral timeline diagram. This PPT slide may be helpful to display financial strategy timeline. Download this PowerPoint timeline template to make impressive presentations.
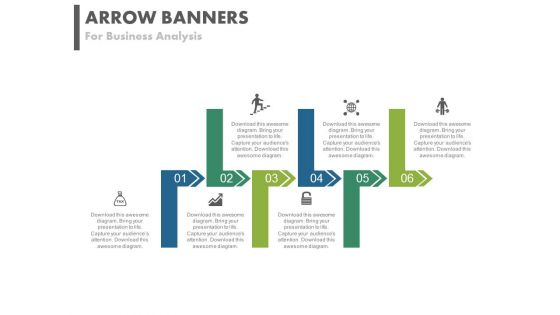
Six Arrows For Global Business Growth And Analysis Powerpoint Template
Deliver amazing presentations with our above template showing six arrow tags with icons. You may download this PPT slide to organize information. Capture the attention of your audience using this PPT diagram slide.
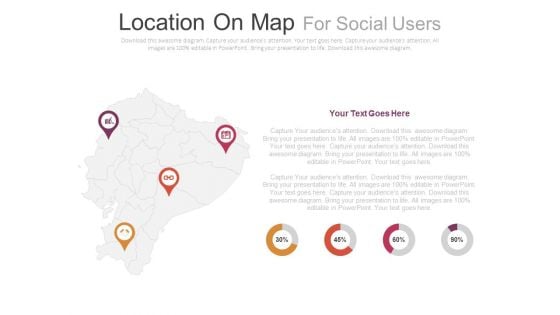
Four Locations On Map With Percentage Analysis Powerpoint Slides
This PowerPoint slide contains diagram of map with location pointers and icons. This professional slide helps to exhibit demographics of social media users. Use this PowerPoint template to make impressive presentations.
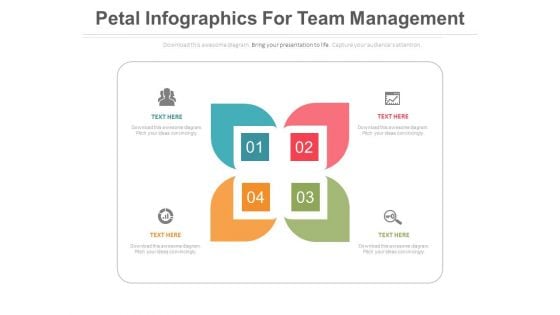
Petal Infographics For Value Chain Analysis Powerpoint Template
This business slide contains diagram of petals infographic. This diagram provides schematic representation of any information. Visual effect this slide helps in maintaining the flow of the discussion and provides more clarity to the subject.
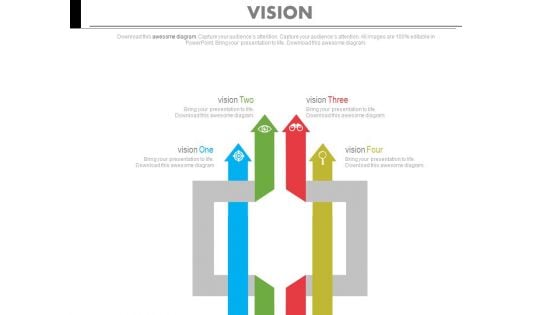
Arrows Matrix For Business Vision Analysis Powerpoint Slides
This PowerPoint template has been designed with arrow matrix diagram. You may download this diagram slide to depict company?s vision, mission, goal and values. Add this slide to your presentation and impress your superiors.
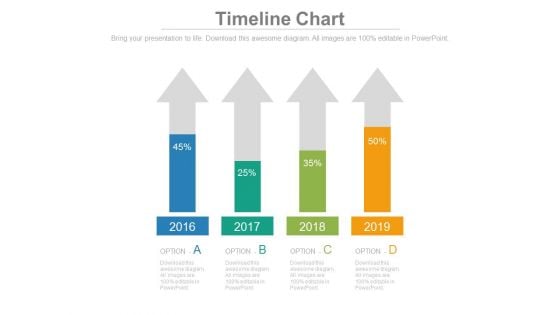
Four Arrows With Percentage Data Analysis Powerpoint Slides
This timeline template can be used for multiple purposes including financial planning, new milestones and tasks. It contains four upward arrows with percentage values. Download this PowerPoint timeline template to make impressive presentations.
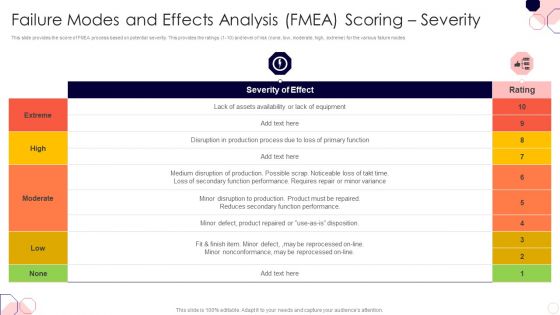
Issues And Impact Of Failure Mode And Effects Analysis Failure Modes And Effects Analysis FMEA Scoring Severity Guidelines PDF
This slide provides the score of FMEA process based on potential severity. This provides the ratings 1 10 and level of risk none, low, moderate, high, extreme for the various failure modes.Deliver and pitch your topic in the best possible manner with this Issues And Impact Of Failure Mode And Effects Analysis Failure Modes And Effects Analysis FMEA Scoring Severity Guidelines PDF. Use them to share invaluable insights on Assets Availability, Reduces Secondary, Minor Nonconformance and impress your audience. This template can be altered and modified as per your expectations. So, grab it now.

Market Area Analysis Ppt PowerPoint Presentation Complete Deck With Slides
This complete deck acts as a great communication tool. It helps you in conveying your business message with personalized sets of graphics, icons etc. Comprising a set of fortyone slides, this complete deck can help you persuade your audience. It also induces strategic thinking as it has been thoroughly researched and put together by our experts. Not only is it easily downloadable but also editable. The color, graphics, theme any component can be altered to fit your individual needs. So grab it now.

Scenario Analysis Ppt PowerPoint Presentation Complete Deck With Slides
This complete deck acts as a great communication tool. It helps you in conveying your business message with personalized sets of graphics, icons etc. Comprising a set of fifteen slides, this complete deck can help you persuade your audience. It also induces strategic thinking as it has been thoroughly researched and put together by our experts. Not only is it easily downloadable but also editable. The color, graphics, theme any component can be altered to fit your individual needs. So grab it now.

Substructure Segment Analysis Ppt PowerPoint Presentation Complete Deck With Slides
This complete deck acts as a great communication tool. It helps you in conveying your business message with personalized sets of graphics, icons etc. Comprising a set of sixty eight slides, this complete deck can help you persuade your audience. It also induces strategic thinking as it has been thoroughly researched and put together by our experts. Not only is it easily downloadable but also editable. The color, graphics, theme any component can be altered to fit your individual needs. So grab it now.

Bid Governance Analysis Ppt PowerPoint Presentation Complete Deck With Slides
This complete deck acts as a great communication tool. It helps you in conveying your business message with personalized sets of graphics, icons etc. Comprising a set of thirty four slides, this complete deck can help you persuade your audience. It also induces strategic thinking as it has been thoroughly researched and put together by our experts. Not only is it easily downloadable but also editable. The color, graphics, theme any component can be altered to fit your individual needs. So grab it now.
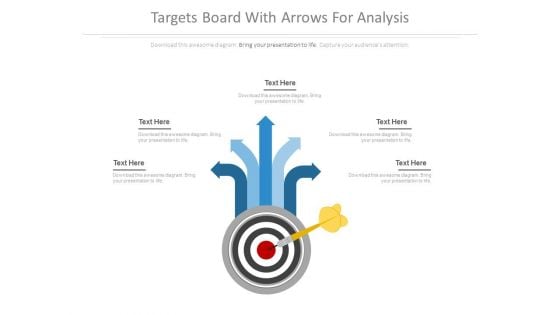
Targets Board With Arrows For Analysis Powerpoint Slides
This PowerPoint template has been designed with target diagram with arrows. Download this slide design for target management development processes. Enlighten others on the process with this innovative PowerPoint template.
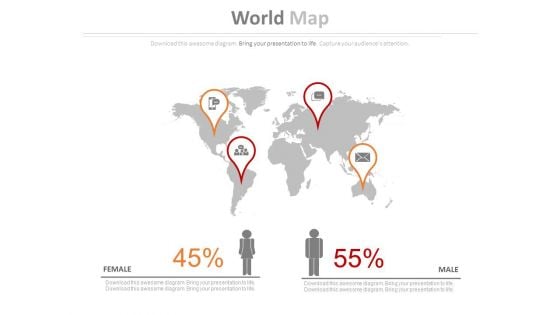
World Map With Gender Ratio Analysis PowerPoint Slides
This slide can be the perfect slide to demonstrate the comparison or changes between the different genders. This PowerPoint slide will be useful to show the ratio of males and females in different parts of the world. Have business abroad? Let your clients and investors know that visually. Above is the PowerPoint slide which can help you explain where all you have your empire. Now isn?t this great. Well yes. You can also use the above template to tell your colleagues or teammates about the places or countries where you plan to further expand your business or open a franchise. This would be an apt background template if you have tourism business. This PPT template is completely customizable. You can adjust the icons present in the slide. Color, icon and text can be modified the way you want. Download this and include it in your presentation to make it more impactful than before.
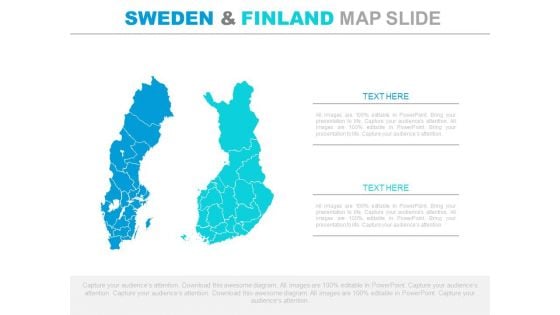
Sweden And Finland Map For Business Analysis Powerpoint Slides
This PowerPoint template has been designed with Sweden and Finland map. Each and every property of any region - color, size, shading etc can be modified to help you build an effective PowerPoint presentation. Use these maps to show sales territories, business and new office locations, travel planning etc in your presentations.
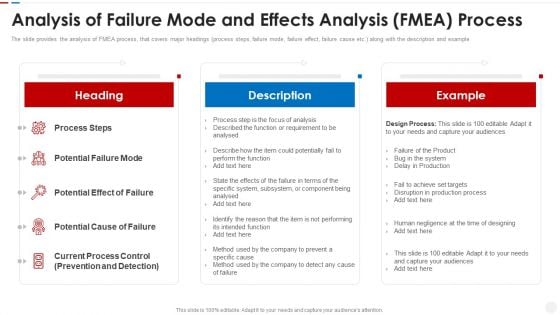
Failure Methods And Effects Assessments FMEA Analysis Of Failure Mode And Effects Analysis FMEA Process Professional PDF
The slide provides the analysis of FMEA process, that covers major headings process steps, failure mode, failure effect, failure cause etc. along with the description and example. Presenting failure methods and effects assessments fmea analysis of failure mode and effects analysis fmea process professional pdf to provide visual cues and insights. Share and navigate important information on three stages that need your due attention. This template can be used to pitch topics like process steps, potential, system, requirement, analysis. In addtion, this PPT design contains high resolution images, graphics, etc, that are easily editable and available for immediate download.
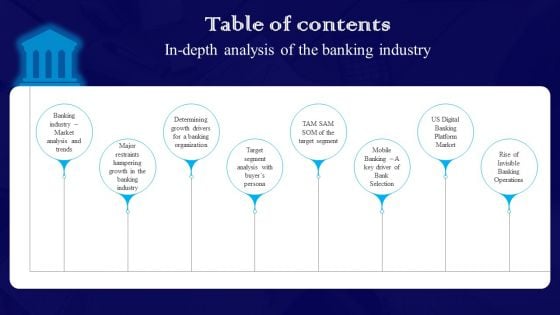
Exploring The Banking Industry A Comprehensive Analysis Table Of Contents In Depth Analysis Of The Banking Sample PDF
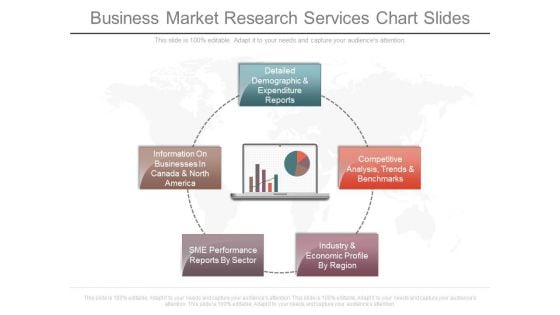
Business Market Research Services Chart Slides
This is a business market research services chart slides. This is a five stage process. The stages in this process are detailed demographic and expenditure reports, competitive analysis trends and benchmarks, industry and economic profile by region, sme performance reports by sector, information on businesses in canada and north america.
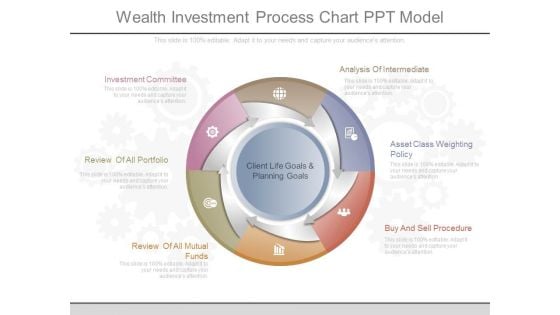
Wealth Investment Process Chart Ppt Model
This is a wealth investment process chart ppt model. This is a six stage process. The stages in this process are investment committee, review of all portfolio, review of all mutual funds, client life goals and planning goals, analysis of intermediate, asset class weighting policy, buy and sell procedure.
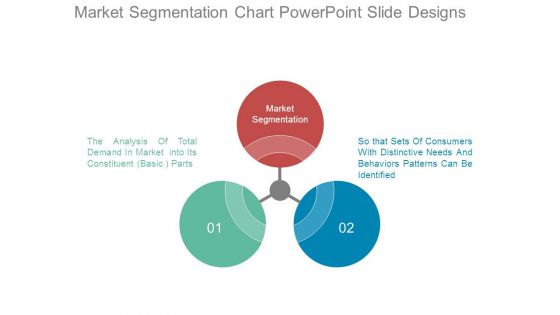
Market Segmentation Chart Powerpoint Slide Designs
This is a market segmentation chart powerpoint slide designs. This is a three stage process. The stages in this process are market segmentation, so that sets of consumers with distinctive needs and behaviors patterns can be identified, the analysis of total demand in market into its constituent basic parts.
Target Market Tips Based On Technical Analysis Technical Analysis For Target Market Cons Ppt Icon Designs Download PDF
Deliver an awe inspiring pitch with this creative target market tips based on technical analysis technical analysis for target market cons ppt icon designs download pdf bundle. Topics like technical analysis for target market can be discussed with this completely editable template. It is available for immediate download depending on the needs and requirements of the user.
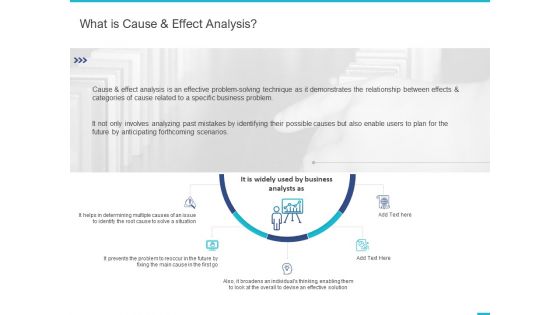
Fishbone Ishikawa Cause And Effect Analysis What Is Cause And Effect Analysis Ppt PowerPoint Presentation Professional Diagrams PDF
Presenting this set of slides with name fishbone ishikawa cause and effect analysis what is cause and effect analysis ppt powerpoint presentation professional diagrams pdf. This is a five stage process. The stages in this process are business, analysts, problem, individuals, relationship. This is a completely editable PowerPoint presentation and is available for immediate download. Download now and impress your audience.
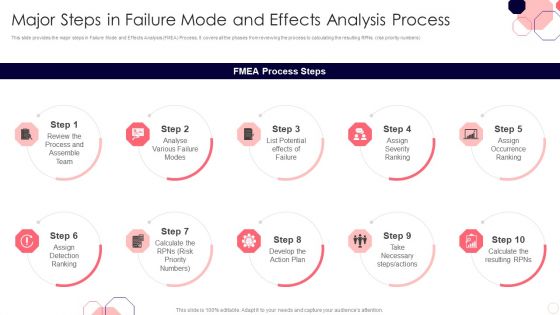
Issues And Impact Of Failure Mode And Effects Analysis Major Steps In Failure Mode And Effects Analysis Process Download PDF
This slide provides the major steps in Failure Mode and Effects Analysis FMEA Process. It covers all the phases from reviewing the process to calculating the resulting RPNs risk priority numbers.This is a Issues And Impact Of Failure Mode And Effects Analysis Major Steps In Failure Mode And Effects Analysis Process Download PDF template with various stages. Focus and dispense information onten stages using this creative set, that comes with editable features. It contains large content boxes to add your information on topics like Process And Assemble, Assign Detection, Occurrence Ranking. You can also showcase facts, figures, and other relevant content using this PPT layout. Grab it now.
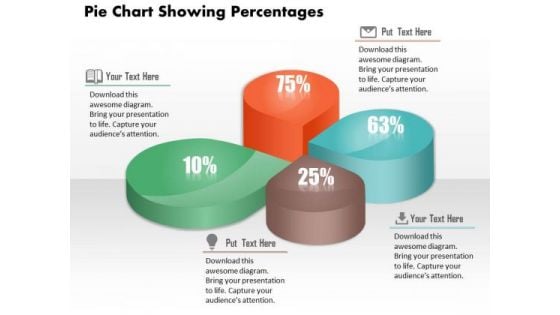
Business Diagram Pie Chart Showing Percentages Presentation Slide Template
This power point diagram template has been designed with graphic of pie chart with percentage values. Use this pie chart for result analysis display in any business presentation. Build an exclusive presentation for your viewers by using this professional diagram template.
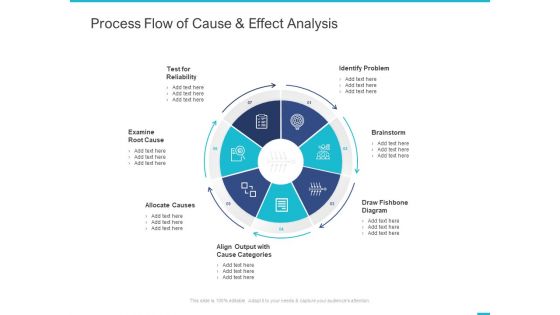
Fishbone Ishikawa Cause And Effect Analysis Process Flow Of Cause And Effect Analysis Ppt PowerPoint Presentation Show Design Ideas PDF
Presenting this set of slides with name fishbone ishikawa cause and effect analysis process flow of cause and effect analysis ppt powerpoint presentation show design ideas pdf. This is a seven stage process. The stages in this process are test for reliability, examine root cause, allocate causes, align output with cause categories, draw fishbone diagram, brainstorm, identify problem. This is a completely editable PowerPoint presentation and is available for immediate download. Download now and impress your audience.
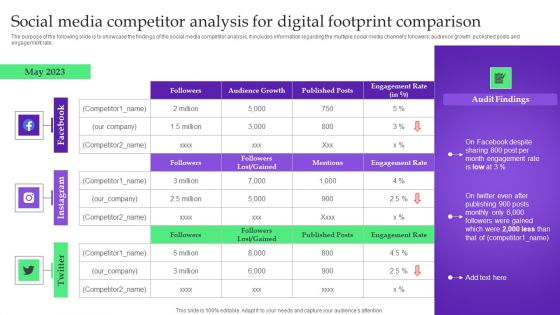
Analysis Plan For E Commerce Promotion Tactics Social Media Competitor Analysis For Digital Footprint Comparison Demonstration PDF
The purpose of the following slide is to showcase the findings of the social media competitor analysis. It includes information regarding the multiple social media channels followers, audience growth, published posts and engagement rate. The Analysis Plan For E Commerce Promotion Tactics Social Media Competitor Analysis For Digital Footprint Comparison Demonstration PDF is a compilation of the most recent design trends as a series of slides. It is suitable for any subject or industry presentation, containing attractive visuals and photo spots for businesses to clearly express their messages. This template contains a variety of slides for the user to input data, such as structures to contrast two elements, bullet points, and slides for written information. Slidegeeks is prepared to create an impression.
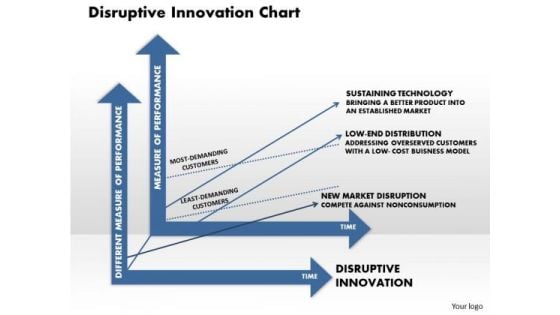
Business Framework Disruptive Innovation Chart PowerPoint Presentation
This image slide displays business framework for diminishing marginal returns. This image slide may be used in your presentations to depict analysis in marketing and business. You may change color, size and orientation of any icon to your liking. Create wonderful presentations using this image slide.
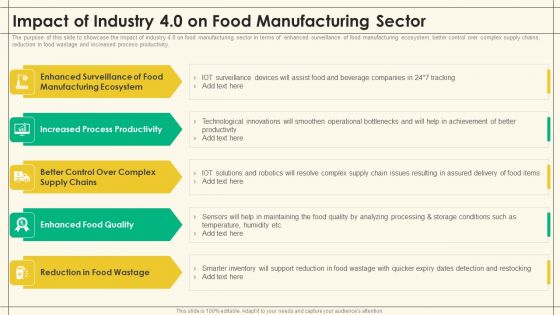
Precooked Food Industry Analysis Impact Of Industry 4 0 On Food Manufacturing Sector Precooked Food Industry Analysis Slides PDF
The purpose of this slide to showcase the impact of industry 4.0 on food manufacturing sector in terms of enhanced surveillance of food manufacturing ecosystem, better control over complex supply chains, reduction in food wastage and increased process productivity.Presenting Precooked Food Industry Analysis Impact Of Industry 4 0 On Food Manufacturing Sector Precooked Food Industry Analysis Slides PDF to provide visual cues and insights. Share and navigate important information on five stages that need your due attention. This template can be used to pitch topics like Contribution Towards, Global Export, Food Segments. In addtion, this PPT design contains high resolution images, graphics, etc, that are easily editable and available for immediate download.
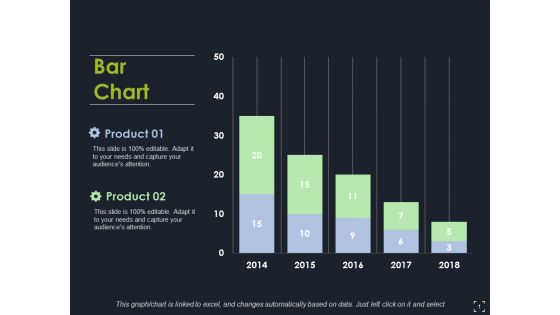
Bar Chart Ppt PowerPoint Presentation Model Clipart Images
This is a bar chart ppt powerpoint presentation model clipart images. This is a two stage process. The stages in this process are bar chart, finance, marketing, strategy, analysis.

Combo Chart Ppt PowerPoint Presentation Infographic Template Themes
This is a combo chart ppt powerpoint presentation infographic template themes. This is a eight stage process. The stages in this process are combo chart, finance, marketing, strategy, analysis, business.
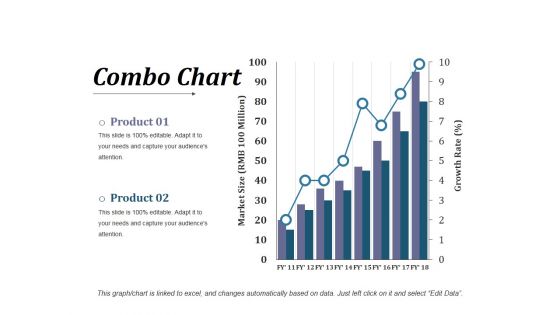
Combo Chart Ppt PowerPoint Presentation Infographic Template Visuals
This is a combo chart ppt powerpoint presentation infographic template visuals. This is a three stage process. The stages in this process are business, finance, strategy, analysis, combo chart.
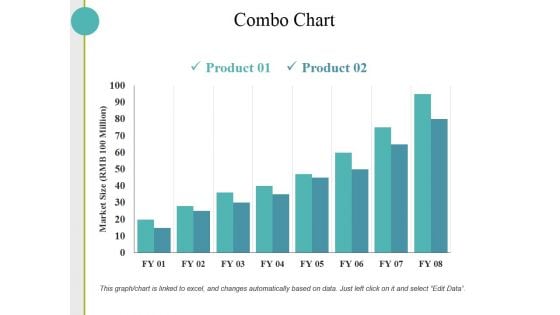
Combo Chart Ppt PowerPoint Presentation Layouts Design Templates
This is a combo chart ppt powerpoint presentation layouts design templates. This is a two stage process. The stages in this process are combo chart, finance, marketing, strategy, analysis, business.
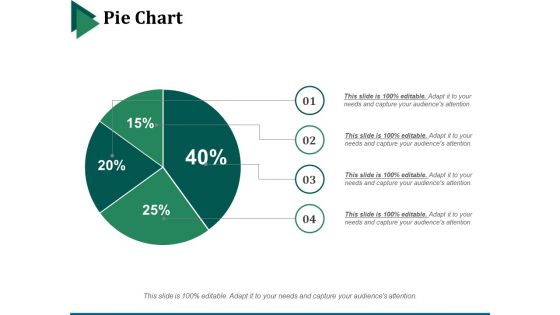
Pie Chart Ppt PowerPoint Presentation Infographic Template Backgrounds
This is a pie chart ppt powerpoint presentation infographic template backgrounds. This is a four stage process. The stages in this process are pie chart, marketing, strategy, finance, analysis.
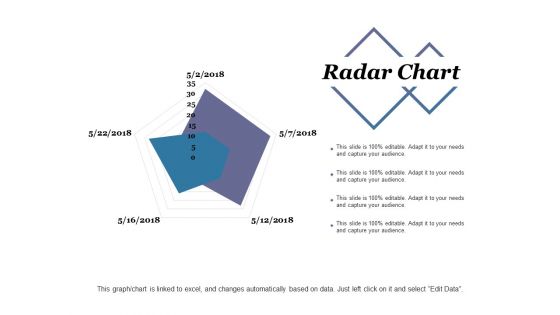
Radar Chart Ppt PowerPoint Presentation Infographic Template Sample
This is a radar chart ppt powerpoint presentation infographic template sample. This is a two stage process. The stages in this process are radar chart, finance, marketing, strategy, analysis.
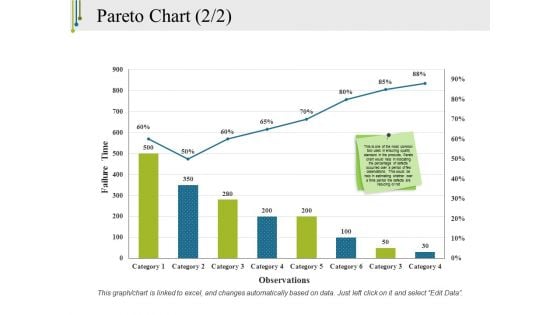
Pareto Chart Template 2 Ppt PowerPoint Presentation Outline Model
This is a pareto chart template 2 ppt powerpoint presentation outline model. This is a eight stage process. The stages in this process are pareto chart, finance, marketing, strategy, analysis.
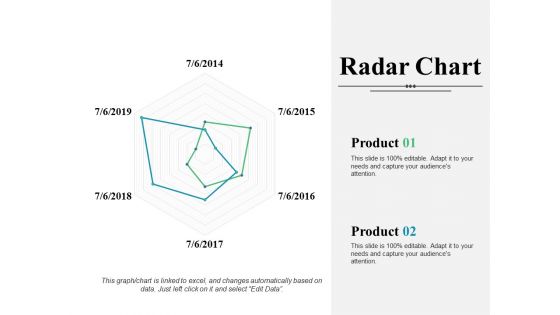
Radar Chart Ppt PowerPoint Presentation Infographic Template Introduction
This is a radar chart ppt powerpoint presentation infographic template introduction. This is a two stage process. The stages in this process are radar chart, finance, marketing, strategy, analysis, business.
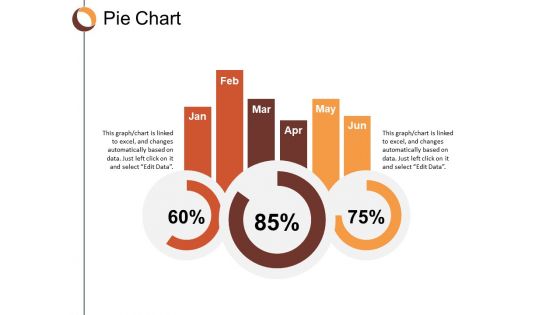
Pie Chart Finance Ppt Powerpoint Presentation Infographic Template Clipart
This is a pie chart finance ppt powerpoint presentation infographic template clipart. This is a three stage process. The stages in this process are pie chart, finance, marketing, business, analysis.
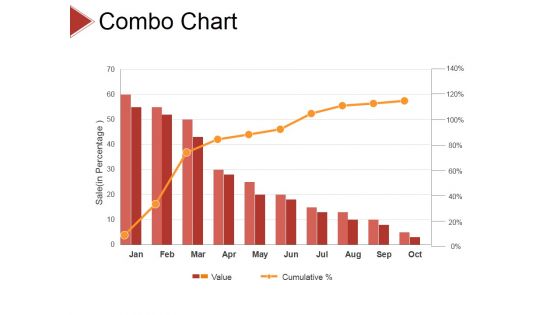
Combo Chart Ppt PowerPoint Presentation File Example Introduction
This is a combo chart ppt powerpoint presentation file example introduction. This is a ten stage process. The stages in this process are business, strategy, analysis, pretention, chart and graph.
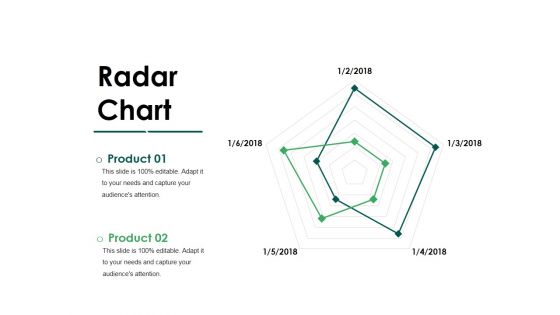
Radar Chart Ppt PowerPoint Presentation Inspiration File Formats
This is a radar chart ppt powerpoint presentation inspiration file formats. This is a two stage process. The stages in this process are radar chart, business, finance, management, analysis.
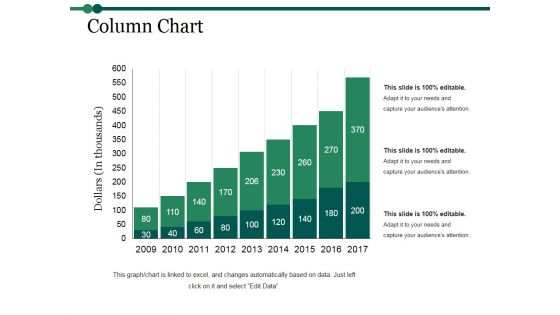
Column Chart Ppt PowerPoint Presentation Inspiration Graphics Example
This is a column chart ppt powerpoint presentation inspiration graphics example. This is a nine stage process. The stages in this process are column chart, finance, marketing, strategy, analysis, business.
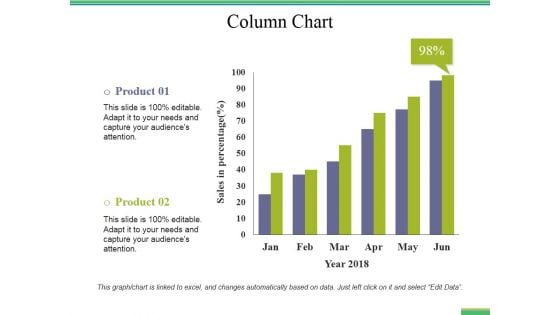
Column Chart Ppt PowerPoint Presentation Pictures Visual Aids
This is a column chart ppt powerpoint presentation pictures visual aids. This is a two stage process. The stages in this process are column chart, business, finance, marketing, analysis, investment.
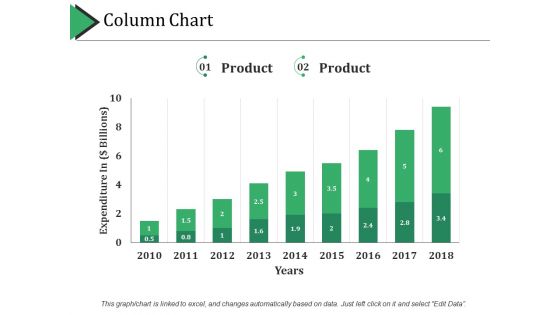
Column Chart Ppt PowerPoint Presentation Professional Example Topics
This is a column chart ppt powerpoint presentation professional example topics. This is a two stage process. The stages in this process are column chart, finance, marketing, strategy, analysis, business.
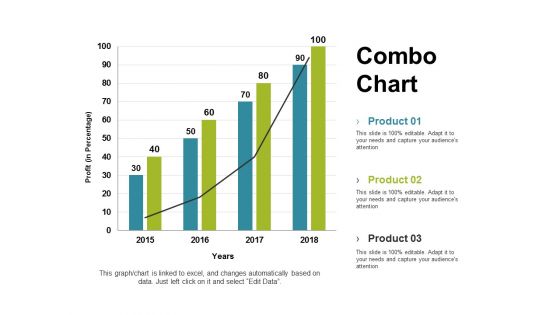
Combo Chart Ppt PowerPoint Presentation Gallery Graphics Tutorials
This is a Combo Chart Ppt PowerPoint Presentation Gallery Graphics Tutorials. This is a three stage process. The stages in this process are combo chart, finance, marketing, strategy, analysis.

Combo Chart Ppt PowerPoint Presentation Inspiration Slide Download
This is a combo chart ppt powerpoint presentation inspiration slide download. This is a two stage process. The stages in this process are Combo chart, finance, marketing, strategy, analysis.
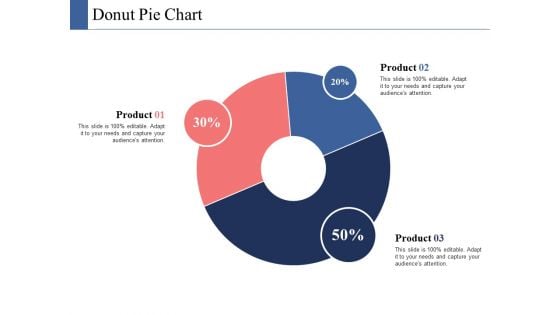
Donut Pie Chart Ppt PowerPoint Presentation Infographics Ideas
This is a donut pie chart ppt powerpoint presentation infographics ideas. This is a three stage process. The stages in this process are donut pie chart, finance, marketing, strategy, analysis.
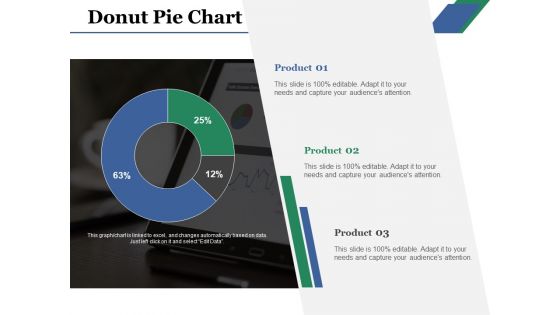
Donut Pie Chart Ppt PowerPoint Presentation Gallery Gridlines
This is a donut pie chart ppt powerpoint presentation gallery gridlines. This is a three stage process. The stages in this process are donut pie chart, product, business, management, analysis.
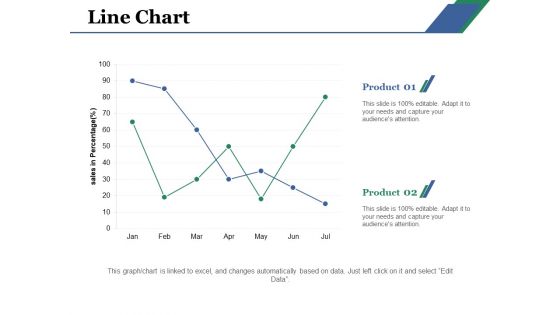
Line Chart Ppt PowerPoint Presentation Layouts Example File
This is a line chart ppt powerpoint presentation layouts example file. This is a two stage process. The stages in this process are line chart, product, business, sales, analysis.
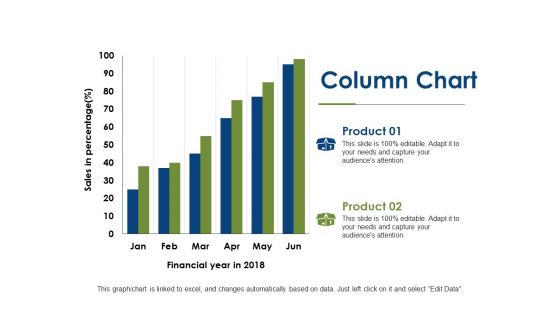
Column Chart Finance Ppt PowerPoint Presentation Infographics Backgrounds
This is a column chart finance ppt powerpoint presentation infographics backgrounds. This is a two stage process. The stages in this process are column chart, investment, marketing, finance, analysis.
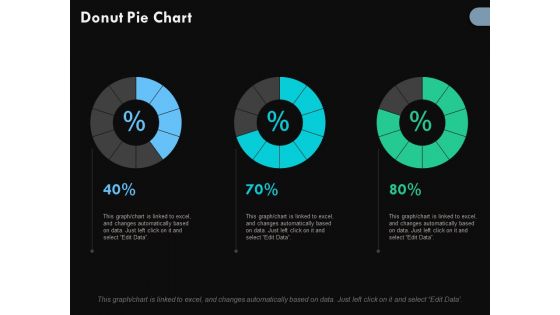
Donut Pie Chart Finance Ppt PowerPoint Presentation Outline Portrait
This is a donut pie chart finance ppt powerpoint presentation outline portrait. This is a three stage process. The stages in this process are donut pie chart, percentage, marketing, business, analysis.
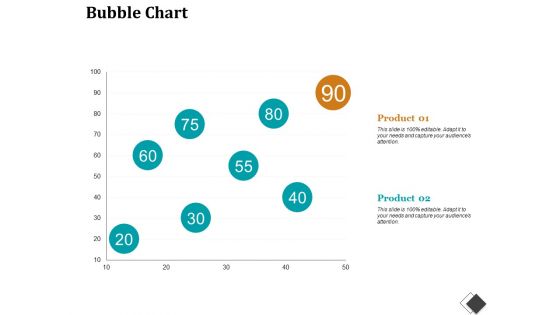
Bubble Chart Enterprise Model Canvas Ppt PowerPoint Presentation File Structure
This is a bubble chart enterprise model canvas ppt powerpoint presentation file structure. This is a two stage process. The stages in this process are bubble chart, finance, marketing, strategy, analysis, investment.
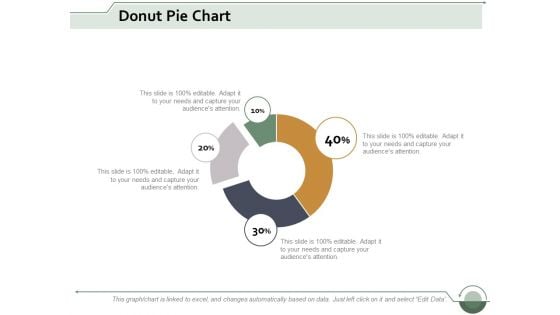
donut pie chart investment ppt powerpoint presentation show guide
This is a donut pie chart investment ppt powerpoint presentation show guide. This is a four stage process. The stages in this process are donut pie chart, finance, marketing, business, analysis.


 Continue with Email

 Home
Home


