Check List
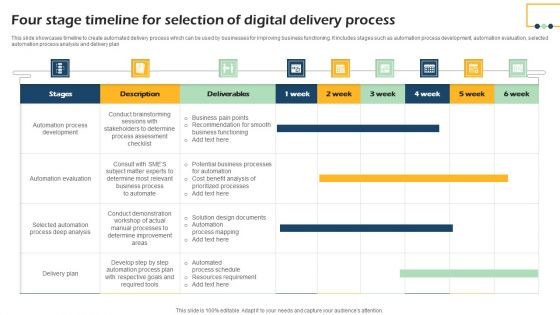
Four Stage Timeline For Selection Of Digital Delivery Process Introduction PDF
This slide showcases timeline to create automated delivery process which can be used by businesses for improving business functioning. It includes stages such as automation process development, automation evaluation, selected automation process analysis and delivery plan. Showcasing this set of slides titled Four Stage Timeline For Selection Of Digital Delivery Process Introduction PDF. The topics addressed in these templates are Automation Process Development, Automation Evaluation, Delivery Plan. All the content presented in this PPT design is completely editable. Download it and make adjustments in color, background, font etc. as per your unique business setting.
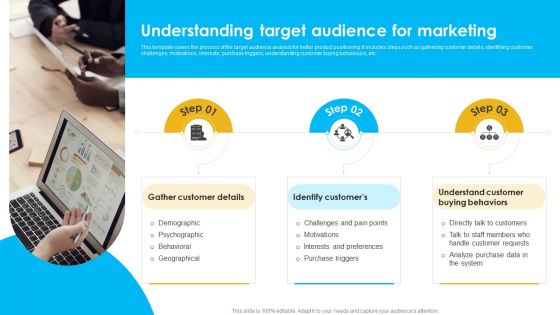
Approaches To Targeting New Customers In Various Markets Understanding Target Audience Microsoft PDF
This template covers the process of the target audience analysis for better product positioning. It includes steps such as gathering customer details, identifying customer challenges, motivations, interests, purchase triggers, understanding customer buying behaviours, etc. Explore a selection of the finest Approaches To Targeting New Customers In Various Markets Understanding Target Audience Microsoft PDF here. With a plethora of professionally designed and pre made slide templates, you can quickly and easily find the right one for your upcoming presentation. You can use our Approaches To Targeting New Customers In Various Markets Understanding Target Audience Microsoft PDF to effectively convey your message to a wider audience. Slidegeeks has done a lot of research before preparing these presentation templates. The content can be personalized and the slides are highly editable. Grab templates today from Slidegeeks.
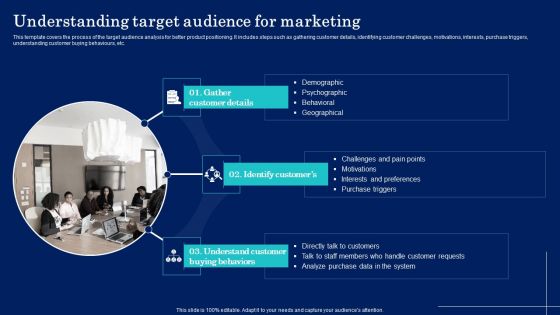
Why Target Market Identification Understanding Target Audience For Marketing Graphics PDF
This template covers the process of the target audience analysis for better product positioning. It includes steps such as gathering customer details, identifying customer challenges, motivations, interests, purchase triggers, understanding customer buying behaviours, etc. Retrieve professionally designed Why Target Market Identification Understanding Target Audience For Marketing Graphics PDF to effectively convey your message and captivate your listeners. Save time by selecting pre made slideshows that are appropriate for various topics, from business to educational purposes. These themes come in many different styles, from creative to corporate, and all of them are easily adjustable and can be edited quickly. Access them as PowerPoint templates or as Google Slides themes. You do not have to go on a hunt for the perfect presentation because Slidegeeks got you covered from everywhere.

Firm Growth Assessment Framework Drivers Inhibitors Opportunities Risks Slides PDF
This slide provides information regarding firm growth analysis framework that assists in identifying firm growth drivers, inhibitors, opportunities and risk associated to it. It helps in managing strategic positioning of firm in target market. Crafting an eye catching presentation has never been more straightforward. Let your presentation shine with this tasteful yet straightforward Firm Growth Assessment Framework Drivers Inhibitors Opportunities Risks Slides PDF template. It offers a minimalistic and classy look that is great for making a statement. The colors have been employed intelligently to add a bit of playfulness while still remaining professional. Construct the ideal Firm Growth Assessment Framework Drivers Inhibitors Opportunities Risks Slides PDF that effortlessly grabs the attention of your audience Begin now and be certain to wow your customers.
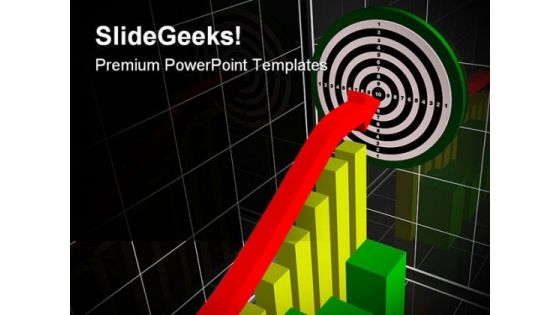
Performance Chart Business PowerPoint Templates And PowerPoint Backgrounds 0311
Microsoft PowerPoint Template and Background with business picture about analysis graph arrow and target Illustrate the essential elements of the project. Delve into the basic nature with our Performance Chart Business PowerPoint Templates And PowerPoint Backgrounds 0311.
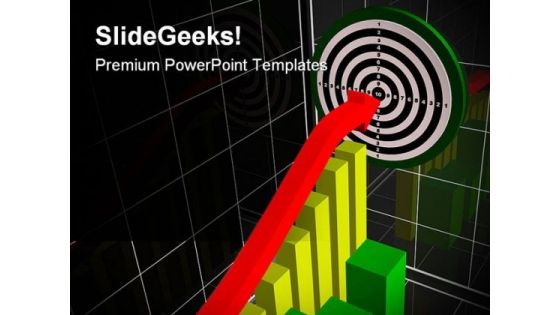
Performance Chart Business PowerPoint Themes And PowerPoint Slides 0311
Microsoft PowerPoint Theme and Slide with business picture about analysis graph arrow and target Your ideas will flower with our Performance Chart Business PowerPoint Themes And PowerPoint Slides 0311. Your brilliance will begin to bloom.
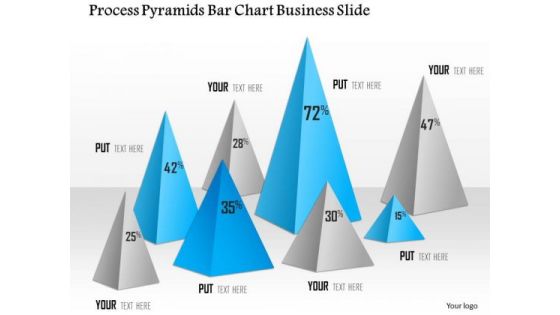
Business Diagram Process Pyramids Bar Chart Business Slide Presentation Template
Graphic of pyramid and bar chart has been used to design this power point template diagram. This PPT diagram contains the concept of business result analysis and process flow. Use this template slide and display result in your presentations.
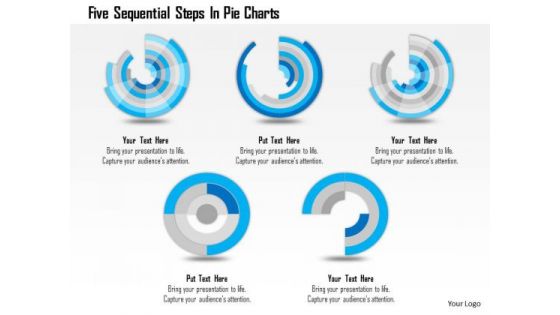
Business Diagram Five Sequential Steps In Pie Charts Presentation Template
Five sequential pie charts are used to craft this power point template. This PPT contains the concept of process flow and result analysis. Use this PPT for your business and sales related presentations and build quality presentation for your viewers.
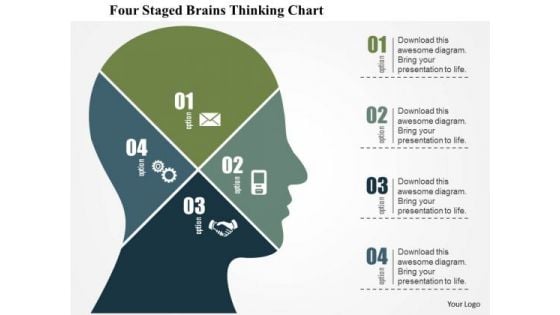
Business Diagram Four Staged Brains Thinking Chart Presentation Template
Graphic of four staged chart in human brain has been used to design this business diagram. This slide depicts concept of thinking process and analysis. Make your presentation more interactive with this business slide.
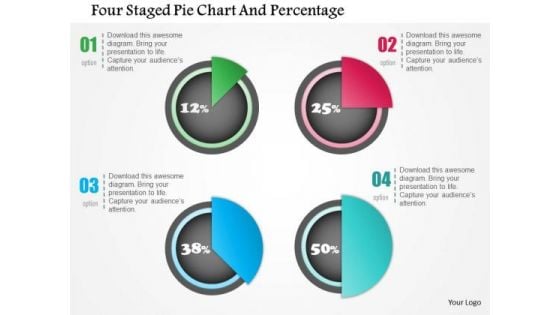
Business Diagram Four Staged Pie Chart And Percentage Presentation Template
Four staged pie chart and percentage values has been used to design this power point template. This PPT contains the concept of financial result analysis. Use this PPT for business and marketing related presentations.
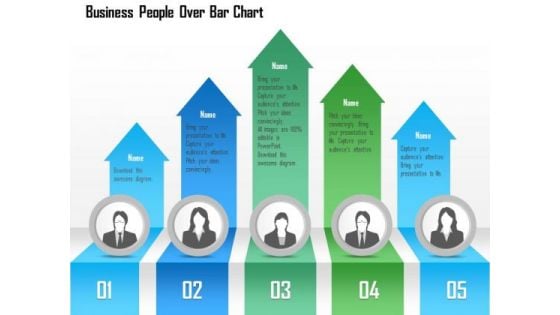
Business Diagram Business People Over Bar Chart PowerPoint Template
This Power Point template has been designed with graphic of business people and bar chart. This PPT contains the concept of result analysis and business data display. Use this PPT slide for your business and marketing related presentations.
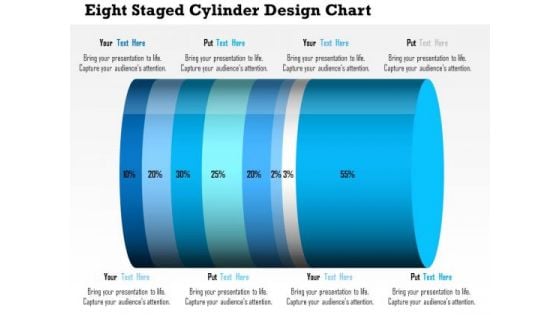
Business Daigram Eight Staged Cylinder Design Chart Presentation Templets
This business diagram contains eight staged cylinder design chart with percentage ratio. Download this diagram to display financial analysis. Use this diagram to make business and marketing related presentations.
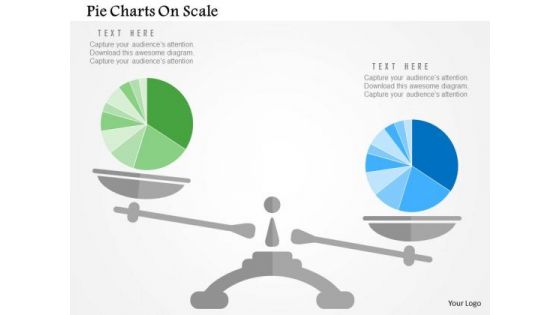
Business Diagram Pie Charts On Scale Presentation Template
Our above slide display graphics of pie chart on a scale. Download this diagram slide to display competitive analysis of business. Adjust the above diagram in your business presentations to visually support your content.
Business Diagram Icons And Charts For Business Growth Presentation Template
Our above slide contains graphics of business charts and icons. It helps to display business reports and analysis. Use this diagram to impart more clarity to data and to create more sound impact on viewers.
Circular Arrow Chart With Business Icons Powerpoint Slides
Graphics of circular arrow chart with icons have been displayed in this business slide. This business diagram helps to exhibit strategy analysis and management. Use this PowerPoint template to visually support your content.
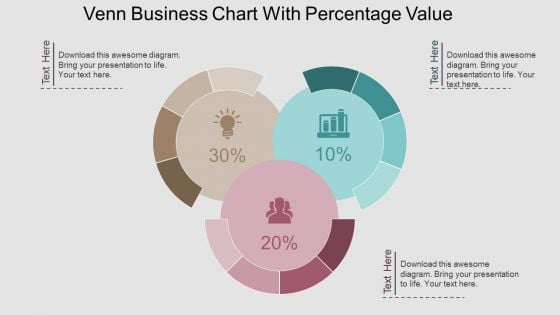
Venn Business Chart With Percentage Value Powerpoint Template
This PPT slide contains Venn business chart with percentage values. This PPT diagram is suitable to present data comparison and analysis. Enlighten others on the process with this innovative PowerPoint template.
Circular Chart With Icons For Value Chain Powerpoint Template
This PowerPoint template has been designed with circular chart and icons. This professional PPT slide is suitable to present value chain analysis. Capture the attention of your audience using this professional slide.
Pie Chart With Seven Business Icons Powerpoint Templates
Our compelling template consists with a design of pie chart with seven business icons. This slide has been professionally designed to exhibit financial ratio analysis. This template offers an excellent background to build impressive presentation.
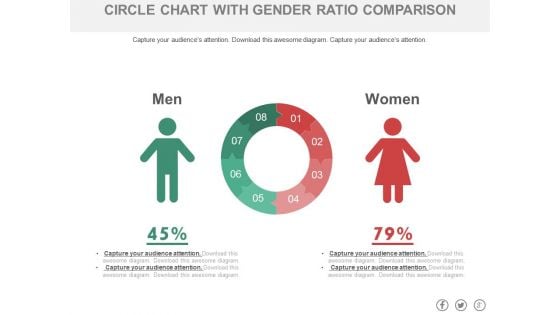
Circle Chart With Man And Woman Ratio Comparison Powerpoint Slides
This PowerPoint template has been designed with graphics of circle chart. You may download this PPT slide to depict man and woman ratio analysis. Add this slide to your presentation and impress your superiors.
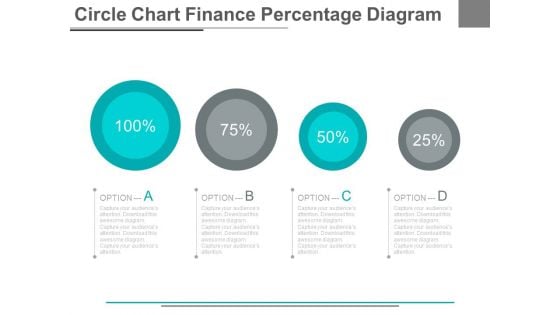
Four Options Circle Chart With Percentage Powerpoint Slides
This PowerPoint template has been designed with graphics of four options circle chart. This PowerPoint template may be used to display four steps of financial analysis. Prove the viability of your ideas using this impressive slide.
Five Circles Sequential Chart With Icons Powerpoint Slides
This PowerPoint template contains sequential chart of five circles with icons. You may download this PPT slide to depict corporate vision, mission and strategy analysis. Add this slide to your presentation and impress your superiors.
Market Trends Chart With Percentage And Icons Powerpoint Slides
This PowerPoint template has been designed with graphics of chart with percentage values and icons. This PowerPoint template may be used to market trends and financial analysis. Prove the viability of your ideas using this impressive slide.
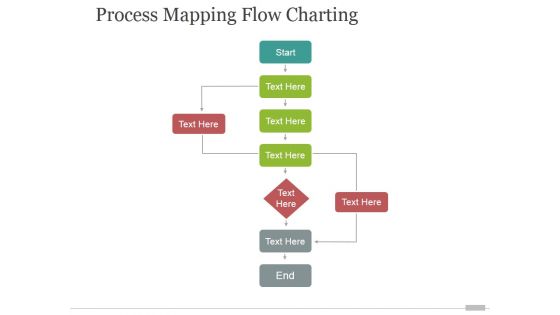
Process Mapping Flow Charting Ppt PowerPoint Presentation Designs Download
This is a process mapping flow charting ppt powerpoint presentation designs download. This is a three stage process. The stages in this process are business, process, management, analysis, success.
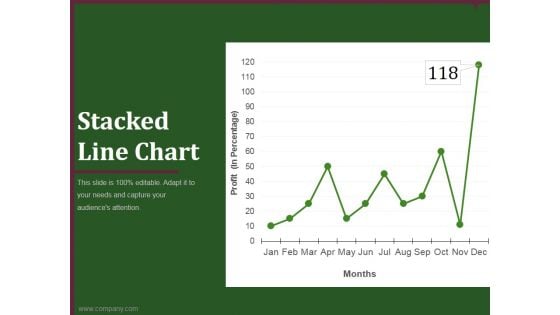
Stacked Line Chart Ppt PowerPoint Presentation Background Image
This is a stacked line chart ppt powerpoint presentation background image. This is a twelve stage process. The stages in this process are business, marketing, analysis, finance, growth strategy.
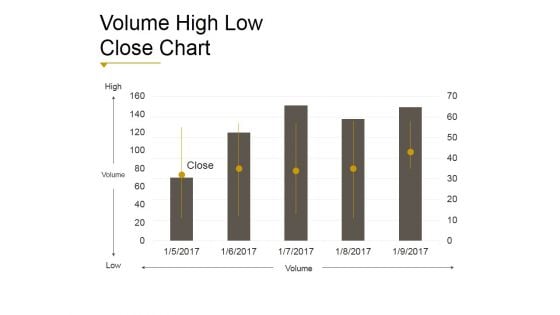
Volume High Low Close Chart Ppt PowerPoint Presentation Shapes
This is a volume high low close chart ppt powerpoint presentation shapes. This is a five stage process. The stages in this process are business, strategy, analysis, marketing, finance, growth.
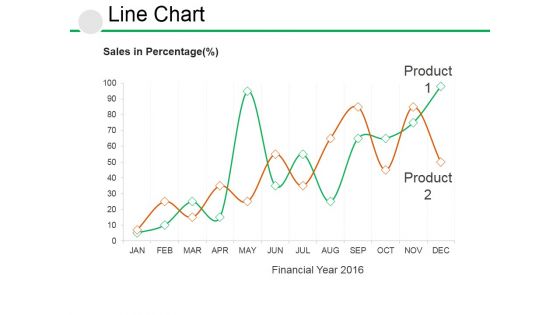
Line Chart Ppt PowerPoint Presentation Visual Aids Example File
This is a line chart ppt powerpoint presentation visual aids example file. This is a two stage process. The stages in this process are business, growth, strategy, analysis, management.
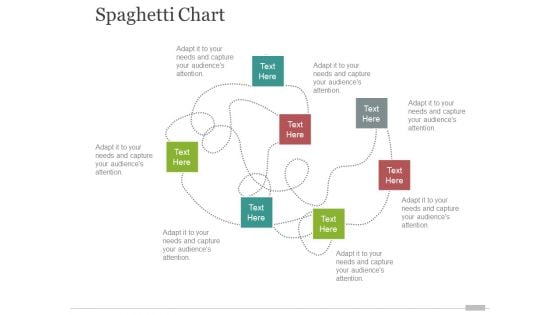
spaghetti chart template 2 ppt powerpoint presentation inspiration portfolio
This is a spaghetti chart template 2 ppt powerpoint presentation inspiration portfolio. This is a seven stage process. The stages in this process are business, marketing, management, analysis, strategy.
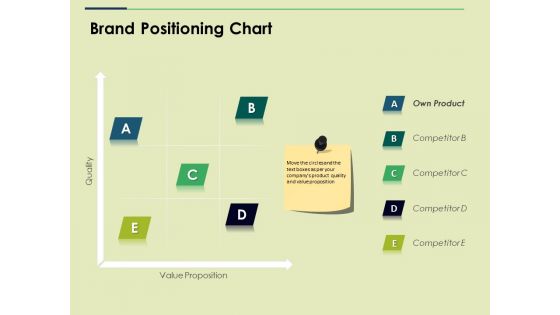
Brand Positioning Chart Ppt PowerPoint Presentation Show Example File
This is a brand positioning chart ppt powerpoint presentation show example file. This is a five stage process. The stages in this process are own product, business, marketing, strategy, analysis.
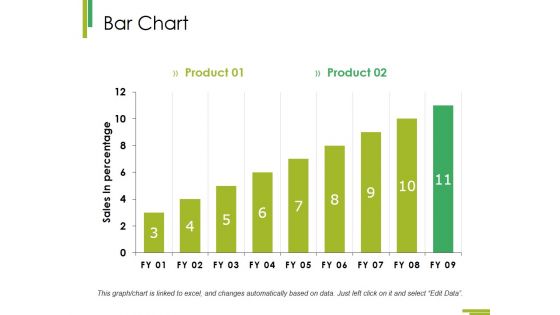
Bar Chart Ppt PowerPoint Presentation Infographic Template Master Slide
This is a bar chart ppt powerpoint presentation infographic template master slide. This is a two stage process. The stages in this process are growth, finance, business, analysis, marketing.
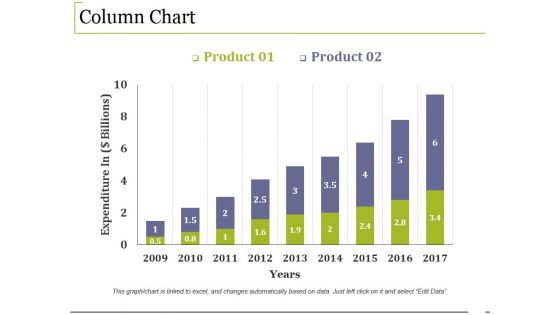
Column Chart Ppt PowerPoint Presentation Infographic Template Example File
This is a column chart ppt powerpoint presentation infographic template example file. This is a two stage process. The stages in this process are growth, finance, business, marketing, analysis.
Clustered Bar Chart Finance Ppt PowerPoint Presentation Icon Tips
This is a clustered bar chart finance ppt powerpoint presentation icon tips. This is a two stage process. The stages in this process are analysis, finance, marketing, management, investment.
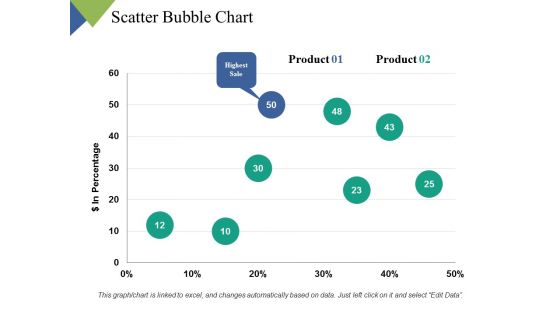
Scatter Bubble Chart Ppt PowerPoint Presentation Inspiration Graphics Tutorials
This is a scatter bubble chart ppt powerpoint presentation inspiration graphics tutorials. This is a two stage process. The stages in this process are finance, marketing, management, investment, analysis.
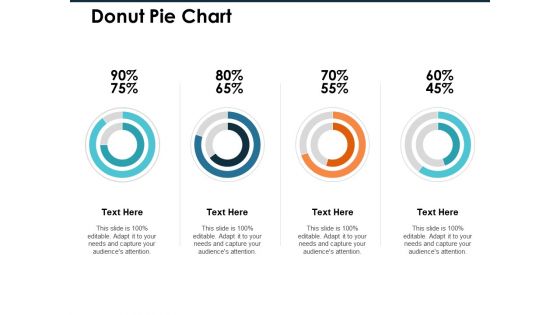
Donut Pie Chart Ppt PowerPoint Presentation Infographic Template Professional
This is a donut pie chart ppt powerpoint presentation infographic template professional. This is a four stage process. The stages in this process are finance, marketing, management, investment, analysis.
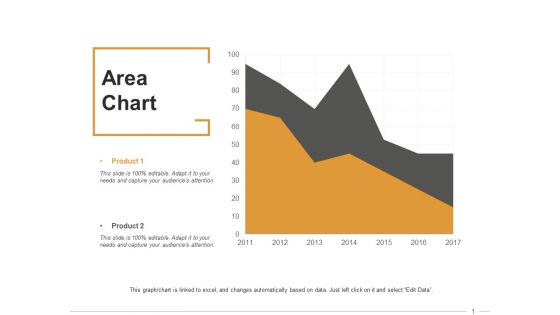
Area Chart Ppt PowerPoint Presentation Infographic Template Clipart Images
This is a area chart ppt powerpoint presentation infographic template clipart images. This is a two stage process. The stages in this process are finance, marketing, management, investment, analysis.
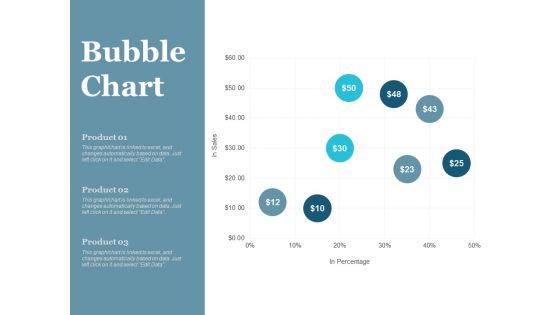
Bubble Chart Finance Ppt PowerPoint Presentation File Master Slide
This is a bubble chart finance ppt powerpoint presentation file master slide. This is a three stage process. The stages in this process are finance, marketing, management, investment, analysis.
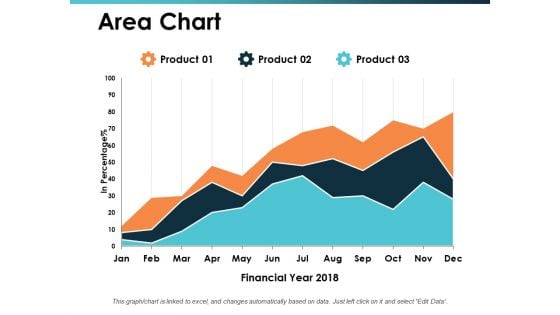
Area Chart Talent Mapping Ppt PowerPoint Presentation Ideas Vector
This is a area chart talent mapping ppt powerpoint presentation ideas vector. This is a three stage process. The stages in this process are business, management, strategy, analysis, marketing.
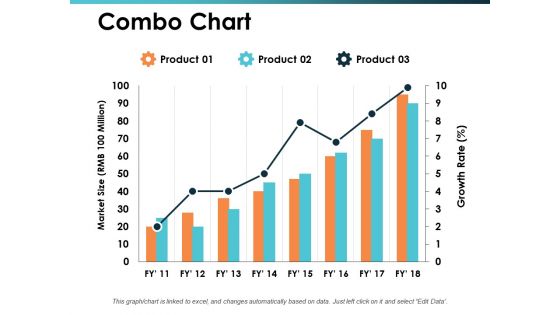
Combo Chart Talent Mapping Ppt PowerPoint Presentation Inspiration Display
This is a combo chart talent mapping ppt powerpoint presentation inspiration display. This is a three stage process. The stages in this process are business, management, strategy, analysis, marketing.
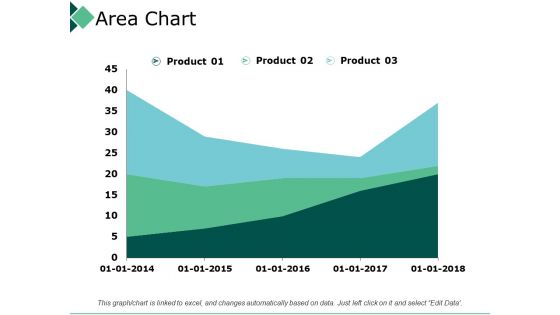
Area Chart Product Marketing Ppt PowerPoint Presentation Layouts Portfolio
This is a area chart product marketing ppt powerpoint presentation layouts portfolio. This is a three stage process. The stages in this process are business, management, strategy, analysis, marketing.
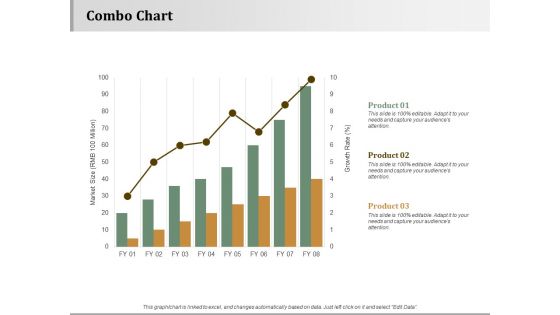
Combo Chart Strategy Approaches Ppt PowerPoint Presentation Inspiration Layout Ideas
This is a combo chart strategy approaches ppt powerpoint presentation inspiration layout ideas. This is a three stage process. The stages in this process are business, management, strategy, analysis, marketing.
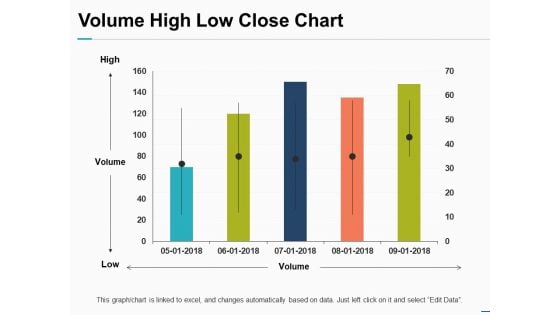
Volume High Low Close Chart Ppt PowerPoint Presentation Pictures Objects
This is a volume high low close chart ppt powerpoint presentation pictures objects. This is a one stage process. The stages in this process are finance, marketing, management, investment, analysis.
Bubble Chart Employee Value Proposition Ppt PowerPoint Presentation Icon Sample
This is a bubble chart employee value proposition ppt powerpoint presentation icon sample. This is a two stage process. The stages in this process are business, management, strategy, analysis, marketing.
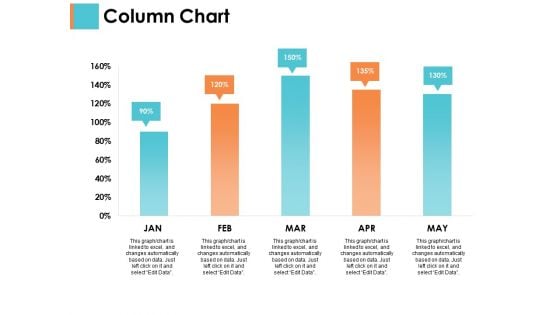
Column Chart Sample Budget Ppt Ppt PowerPoint Presentation Infographics Brochure
This is a column chart sample budget ppt ppt powerpoint presentation infographics brochure. This is a two stage process. The stages in this process are business, management, strategy, analysis, marketing.
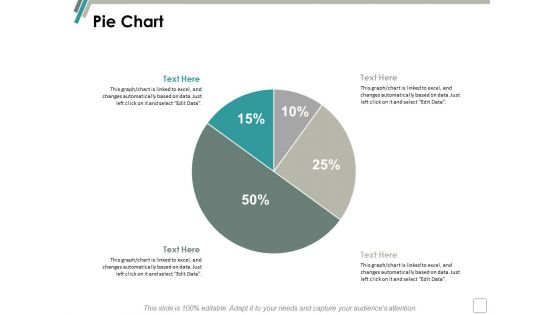
Pie Chart Finance Marketing Ppt Powerpoint Presentation Infographics Background
This is a pie chart finance marketing ppt powerpoint presentation infographics background. This is a two stage process. The stages in this process are finance, marketing, management, investment, analysis.
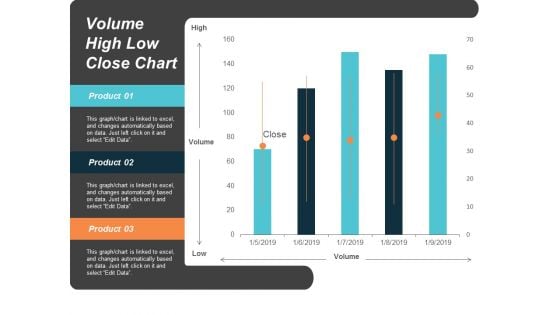
Volume High Low Close Chart Ppt Powerpoint Presentation Slides Images
This is a volume high low close chart ppt powerpoint presentation slides images. This is a five stage process. The stages in this process are finance, marketing, management, investment, analysis.

Area Chart Finance Marketing Ppt Powerpoint Presentation Gallery Slides
This is a area chart finance marketing ppt powerpoint presentation gallery slides. This is a three stage process. The stages in this process are finance, marketing, management, investment, analysis.
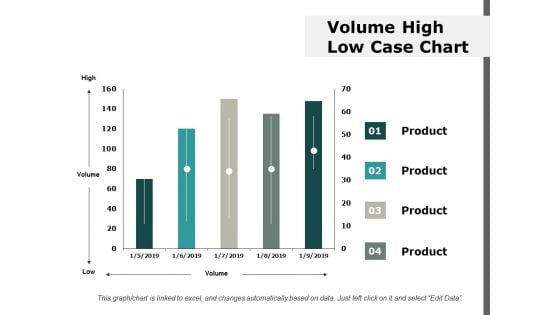
Volume High Low Case Chart Ppt Powerpoint Presentation Ideas Information
This is a volume high low case chart ppt powerpoint presentation ideas information. This is a four stage process. The stages in this process are finance, marketing, management, investment, analysis.
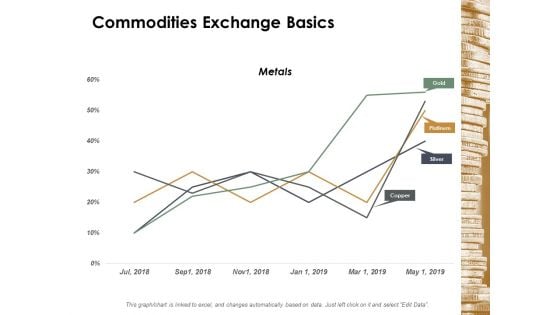
Commodities Exchange Basics Ppt Powerpoint Presentation Diagram Graph Charts
This is a commodities exchange basics ppt powerpoint presentation diagram graph charts. This is a four stage process. The stages in this process are finance, marketing, management, investment, analysis.
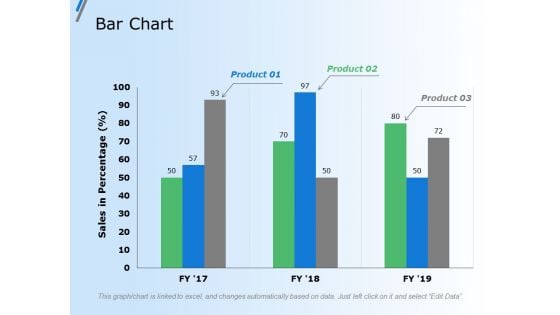
Bar Chart Finance Marketing Ppt Powerpoint Presentation Gallery Grid
This is a bar chart finance marketing ppt powerpoint presentation gallery grid. This is a three stage process. The stages in this process are finance, marketing, management, investment, analysis.

Donut Pie Chart Product Finance Ppt PowerPoint Presentation Diagram Ppt
This is a donut pie chart product finance ppt powerpoint presentation diagram ppt. This is a three stage process. The stages in this process are finance, management, strategy, analysis, marketing.
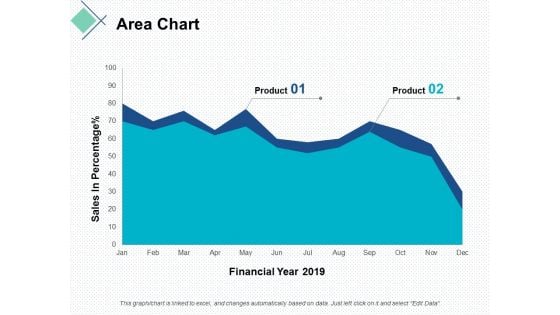
area chart finance ppt powerpoint presentation portfolio graphics download
This is a area chart finance ppt powerpoint presentation portfolio graphics download. This is a two stage process. The stages in this process are finance, marketing, management, investment, analysis.

Pie Chart Finance Ppt Powerpoint Presentation Layouts Design Ideas
This is a pie chart finance ppt powerpoint presentation layouts design ideas. This is a four stage process. The stages in this process are finance, marketing, management, investment, analysis.
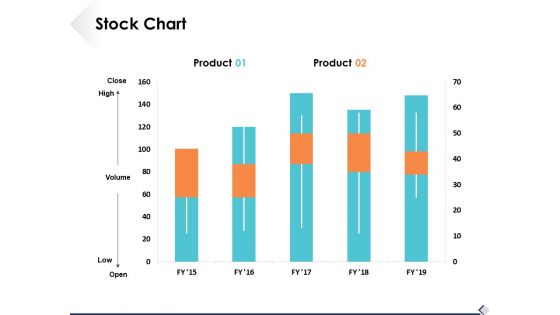
Stock Chart Finance Ppt PowerPoint Presentation Styles Background Image
This is a stock chart finance ppt powerpoint presentation styles background image. This is a two stage process. The stages in this process are analysis, marketing, icons, finance, strategy.
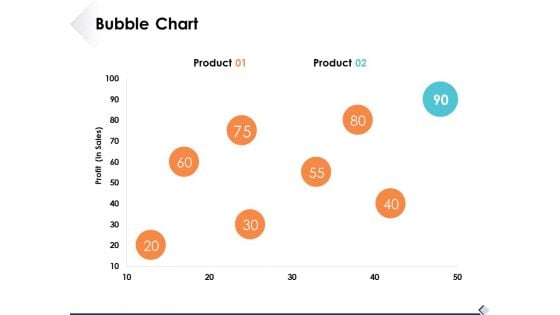
Bubble Chart Marketing Business Ppt PowerPoint Presentation Model Sample
This is a bubble chart marketing business ppt powerpoint presentation model sample. This is a two stage process. The stages in this process are finance, business, management, strategy, analysis.
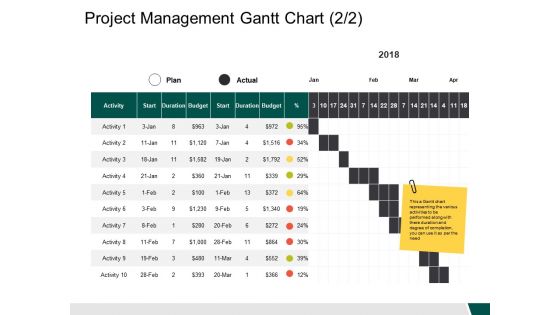
Project Management Gantt Chart Activity Ppt PowerPoint Presentation Inspiration Samples
This is a project management gantt chart activity ppt powerpoint presentation inspiration samples. This is a ten stage process. The stages in this process are business, management, strategy, analysis, marketing.

Donut Pie Chart Finance Ppt PowerPoint Presentation Portfolio Model
This is a donut pie chart finance ppt powerpoint presentation portfolio model. This is a three stage process. The stages in this process are finance, management, strategy, analysis, marketing.
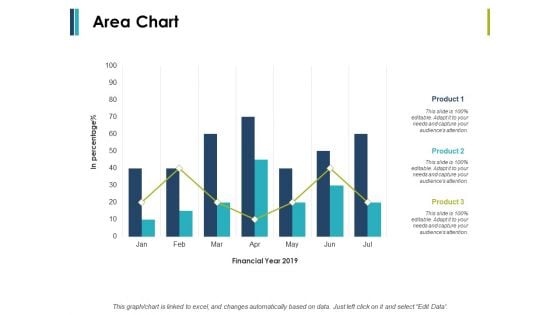
Area Chart Finance Ppt PowerPoint Presentation Infographic Template Model
This is a area chart finance ppt powerpoint presentation infographic template model. This is a two stage process. The stages in this process are finance, marketing, management, investment, analysis.
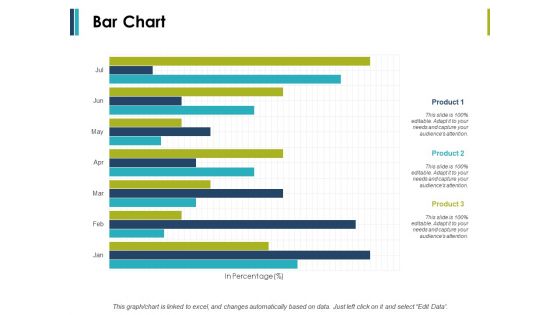
Bar Chart Business Management Ppt PowerPoint Presentation Ideas Example Introduction
This is a bar chart business management ppt powerpoint presentation ideas example introduction. This is a three stage process. The stages in this process are finance, marketing, management, investment, analysis.
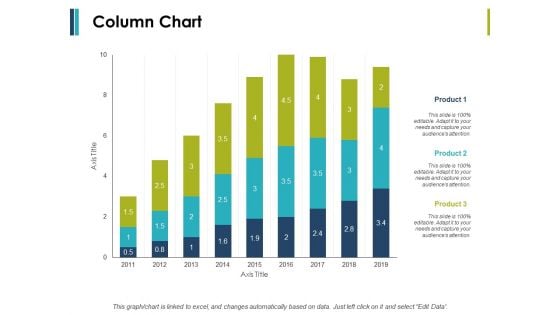
Column Chart And Graph Ppt PowerPoint Presentation File Introduction
This is a column chart and graph ppt powerpoint presentation file introduction. This is a three stage process. The stages in this process are finance, marketing, management, investment, analysis.
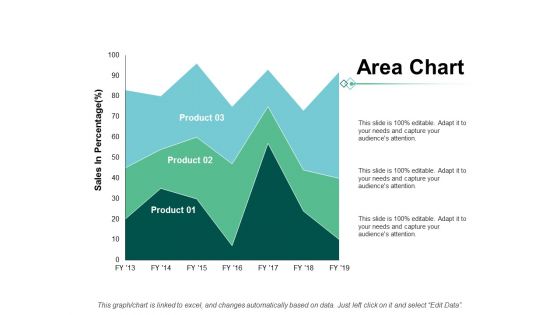
Area Chart Finance Marketing Ppt Powerpoint Presentation Show Grid
This is a area chart finance marketing ppt powerpoint presentation show grid. This is a three stage process. The stages in this process are finance, marketing, management, investment, analysis.
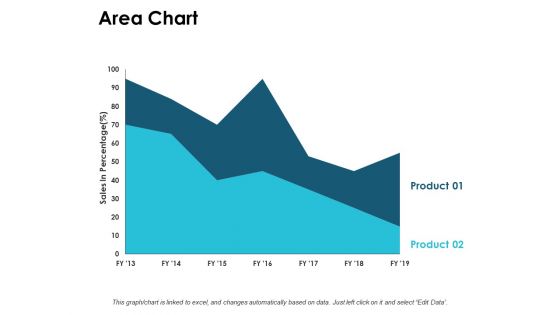
Area Chart Finance Ppt PowerPoint Presentation Infographic Template Graphics Template
This is a area chart finance ppt powerpoint presentation infographic template graphics template. This is a two stage process. The stages in this process are finance, marketing, management, investment, analysis.


 Continue with Email

 Home
Home


