Checklist Icon

Business Operation Modeling Approaches Questionnaires And Surveys In Project Management Designs PDF
This slide provides the glimpse about the questionnaires and surveys in project management along with questions asked and survey results.Deliver an awe inspiring pitch with this creative business operation modeling approaches questionnaires and surveys in project management designs pdf bundle. Topics like desired business results, project information, overall rating for the success can be discussed with this completely editable template. It is available for immediate download depending on the needs and requirements of the user.
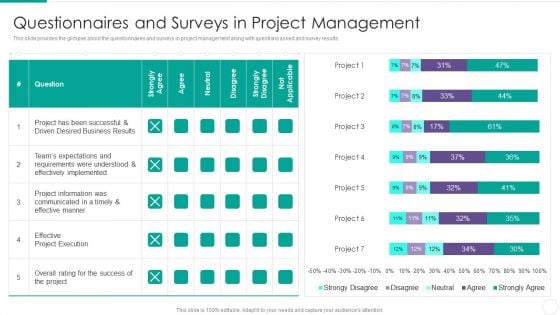
Quantitative Risk Assessment Questionnaires And Surveys In Project Management Information PDF
This slide provides the glimpse about the questionnaires and surveys in project management along with questions asked and survey results. Deliver an awe inspiring pitch with this creative Quantitative Risk Assessment Questionnaires And Surveys In Project Management Information PDF bundle. Topics like Requirements, Team, Communicated, Implemented can be discussed with this completely editable template. It is available for immediate download depending on the needs and requirements of the user.
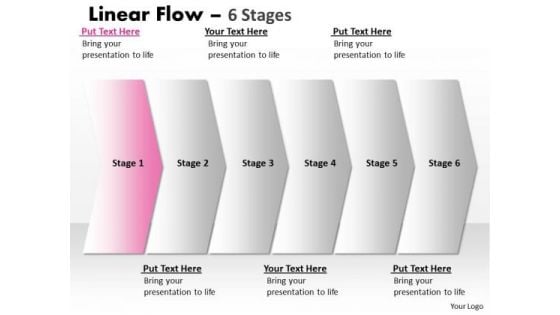
Editable PowerPoint Template Straight Demonstration Of 6 Stages Business Graphic
We present our editable PowerPoint template straight Demonstration of 6 stages business Graphic.Use our Process and flows PowerPoint Templates because, are the symbols of human growth. Use our shapes PowerPoint Templates because, guaranteed to focus the minds of your team. Use our Signs PowerPoint Templates because, Amplify on your plans to have dedicated sub groups working on related but distinct tasks. Use our Business PowerPoint Templates because; heighten the anticipation of your audience with this slide listing. Use our Arrows PowerPoint Templates because, The Venn graphic comprising interlinking circles geometrically demonstrate how various functions operating independently, to a large extent, are essentially interdependant.Use these PowerPoint slides for presentations relating to Algorithm, arrow, arrow chart, block, block diagram, business, chart, connection, design, development, diagram, direction, element, flow, flow chart, flow diagram, flowchart, graph, linear, linear diagram, management, model, module, motion, process, process arrows, process chart, process diagram, process flow, program, section, segment, set, sign, solution, strategy, symbol, technology, vibrant, workflow, workflow chart, workflow diagram. The prominent colors used in the PowerPoint template are Pink, White, and Gray Our Editable PowerPoint Template Straight Demonstration Of 6 Stages Business Graphic make many a feat feasible. They ease out all difficulties.
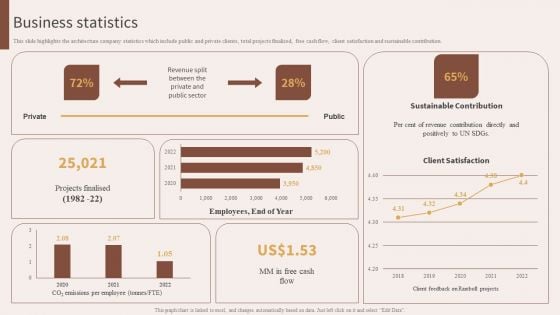
Architecture Engineering Planning Services Company Business Statistics Clipart PDF
This slide highlights the architecture company statistics which include public and private clients, total projects finalized, free cash flow, client satisfaction and sustainable contribution. Presenting this PowerPoint presentation, titled Architecture Engineering Planning Services Company Business Statistics Clipart PDF, with topics curated by our researchers after extensive research. This editable presentation is available for immediate download and provides attractive features when used. Download now and captivate your audience. Presenting this Architecture Engineering Planning Services Company Business Statistics Clipart PDF. Our researchers have carefully researched and created these slides with all aspects taken into consideration. This is a completely customizable Architecture Engineering Planning Services Company Business Statistics Clipart PDF that is available for immediate downloading. Download now and make an impact on your audience. Highlight the attractive features available with our PPTs.
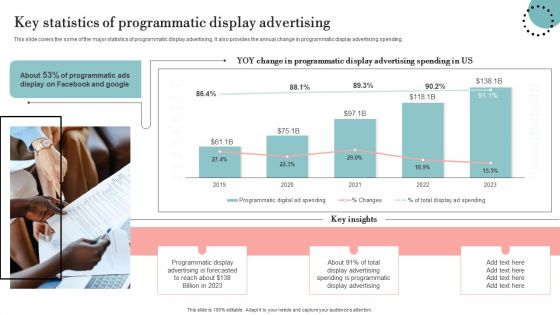
Key Statistics Of Programmatic Display Advertising Pictures PDF
This slide covers the some of the major statistics of programmatic display advertising. It also provides the annual change in programmatic display advertising spending. Presenting this PowerPoint presentation, titled Key Statistics Of Programmatic Display Advertising Pictures PDF, with topics curated by our researchers after extensive research. This editable presentation is available for immediate download and provides attractive features when used. Download now and captivate your audience. Presenting this Key Statistics Of Programmatic Display Advertising Pictures PDF. Our researchers have carefully researched and created these slides with all aspects taken into consideration. This is a completely customizable Key Statistics Of Programmatic Display Advertising Pictures PDF that is available for immediate downloading. Download now and make an impact on your audience. Highlight the attractive features available with our PPTs.
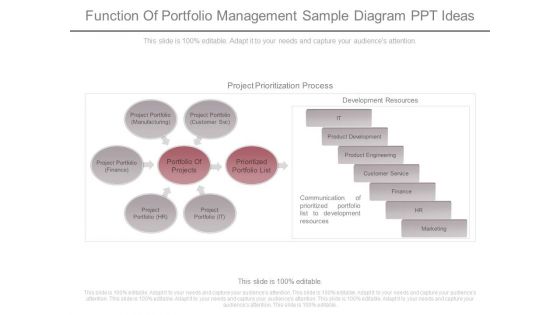
Function Of Portfolio Management Sample Diagram Ppt Ideas
This is a function of portfolio management sample diagram ppt ideas. This is a seven stage process. The stages in this process are project portfolio manufacturing, project portfolio customer svc, prioritized portfolio list, project portfolio it, project portfolio hr, project portfolio finance, portfolio of projects, project prioritization process, product development, product engineering, customer service, finance, marketing, development resources.
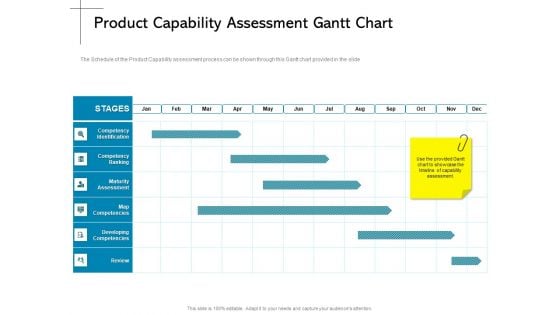
New Product Introduction In The Market Product Capability Assessment Gantt Chart Ppt PowerPoint Presentation Slides Graphics Tutorials PDF
Our Gantt Chart PowerPoint Template is a modern and professional layout designed to create some of the vital components that help you to create timelines, roadmaps, project plans, etc. Communicate your project activity durations, milestones, tasks, subtasks, dependencies and other attributes with this content-ready PowerPoint template. Further, showcase precedence against time by employing this fully editable PowerPoint chart into your business tasks. With a single glance at this resourceful PPT layout, the audiences can get a complete overview of the tasks, duration, resources employed, and overlapping of the activities in a particular project, making it an ideal choice for project managers and leaders. Not only this, but the color scheme of this template is also such that it is sure to impress your audience, no matter which niche they belong to. Thus steer your project meetings, meetups, and conferences with this Gantt Chart PPT slide.
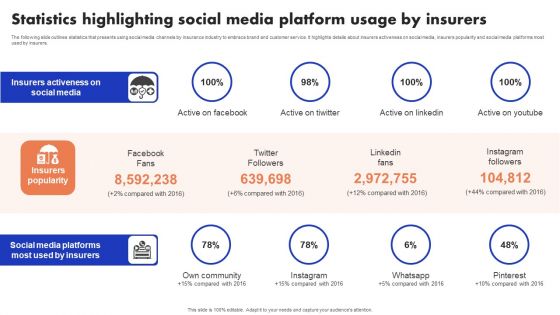
Implementation Of Digital Advancement Techniques Statistics Highlighting Social Media Pictures PDF
The following slide outlines statistics that presents using social media channels by insurance industry to embrace brand and customer service. It highlights details about insurers activeness on social media, insurers popularity and social media platforms most used by insurers. Are you searching for a Implementation Of Digital Advancement Techniques Statistics Highlighting Social Media Pictures PDF that is uncluttered, straightforward, and original Its easy to edit, and you can change the colors to suit your personal or business branding. For a presentation that expresses how much effort you have put in, this template is ideal. With all of its features, including tables, diagrams, statistics, and lists, its perfect for a business plan presentation. Make your ideas more appealing with these professional slides. Download Implementation Of Digital Advancement Techniques Statistics Highlighting Social Media Pictures PDF from Slidegeeks today.
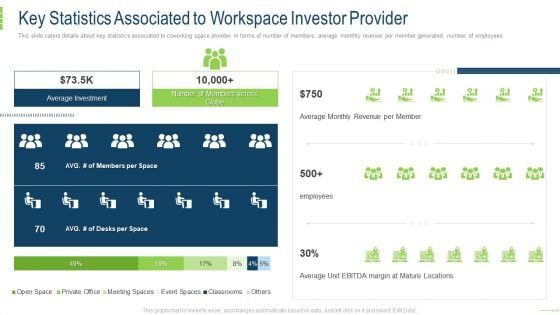
Key Statistics Associated To Workspace Investor Provider Designs PDF
This slide caters details about key statistics associated to coworking space provider in terms of number of members, average monthly revenue per member generated, number of employees. Deliver an awe inspiring pitch with this key statistics associated to workspace investor provider designs pdf. Topics like average, revenue, margin, locations can be discussed with this completely editable template. It is available for immediate download depending on the needs and requirements of the user.
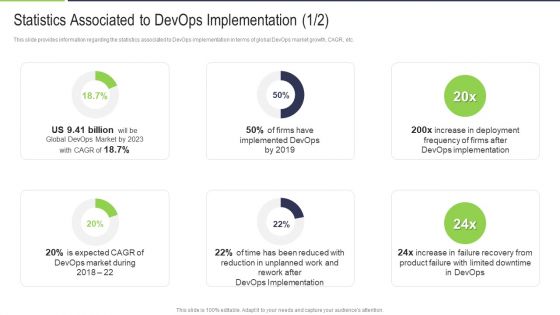
Statistics Associated To Devops Implementation Market Sample PDF
This slide provides information regarding the statistics associated to DevOps implementation in terms of global DevOps market growth, CAGR, etc. Deliver an awe inspiring pitch with this creative statistics associated to devops implementation market sample pdf bundle. Topics like global, implemented, deployment, product, market can be discussed with this completely editable template. It is available for immediate download depending on the needs and requirements of the user.
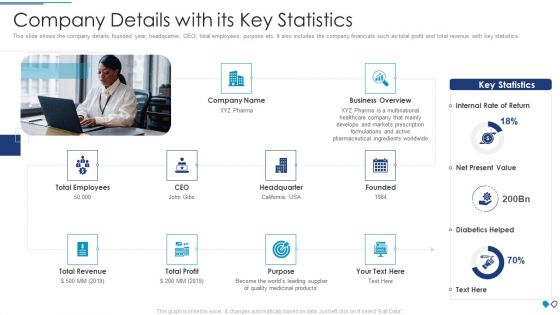
Company Details With Its Key Statistics Pictures PDF
This slide shows the company details, founded year, headquarter, CEO, total employees, purpose etc. It also includes the company financials such as total profit and total revenue with key statistics.Deliver an awe inspiring pitch with this creative company details with its key statistics pictures pdf bundle. Topics like business overview, internal rate of return, headquarter can be discussed with this completely editable template. It is available for immediate download depending on the needs and requirements of the user.
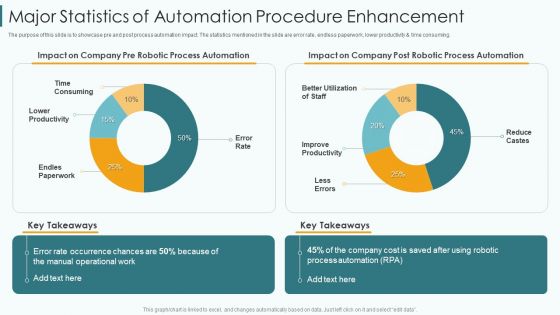
Major Statistics Of Automation Procedure Enhancement Introduction PDF
The purpose of this slide is to showcase pre and post process automation impact. The statistics mentioned in the slide are error rate, endless paperwork, lower productivity and time consuming. Showcasing this set of slides titled major statistics of automation procedure enhancement introduction pdf. The topics addressed in these templates are occurrence, process automation, cost. All the content presented in this PPT design is completely editable. Download it and make adjustments in color, background, font etc. as per your unique business setting.
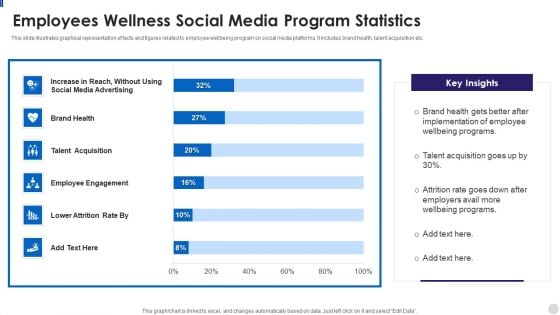
Employees Wellness Social Media Program Statistics Background PDF
This slide illustrates graphical representation of facts and figures related to employee wellbeing program on social media platforms. It includes brand health, talent acquisition etc. Showcasing this set of slides titled Employees Wellness Social Media Program Statistics Background PDF. The topics addressed in these templates are Employees Wellness Social Media Program Statistics. All the content presented in this PPT design is completely editable. Download it and make adjustments in color, background, font etc. as per your unique business setting.
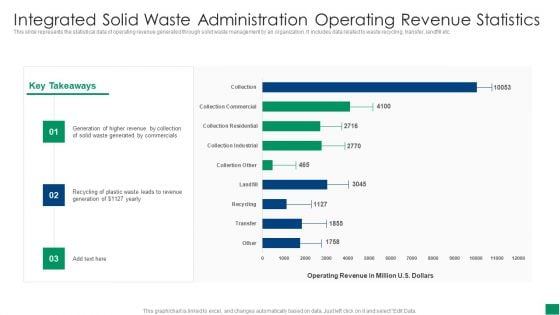
Integrated Solid Waste Administration Operating Revenue Statistics Formats PDF
This slide represents the statistical data of operating revenue generated through solid waste management by an organization. It includes data related to waste recycling, transfer, landfill etc. Pitch your topic with ease and precision using this Integrated Solid Waste Administration Operating Revenue Statistics Formats PDF. This layout presents information on Revenue, Recycling, Commercials. It is also available for immediate download and adjustment. So, changes can be made in the color, design, graphics or any other component to create a unique layout.
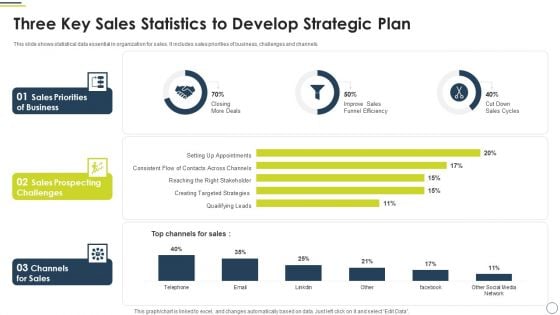
Three Key Sales Statistics To Develop Strategic Plan Microsoft PDF
This slide shows statistical data essential in organization for sales. It includes sales priorities of business, challenges and channels. Pitch your topic with ease and precision using this Three Key Sales Statistics To Develop Strategic Plan Microsoft PDF. This layout presents information on Sales Priorities Business, Sales Prospecting Challenges, Channels For Sales. It is also available for immediate download and adjustment. So, changes can be made in the color, design, graphics or any other component to create a unique layout.
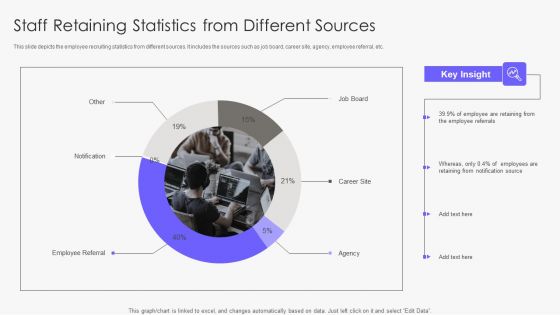
Staff Retaining Statistics From Different Sources Sample PDF
This slide depicts the employee recruiting statistics from different sources. It includes the sources such as job board, career site, agency, employee referral, etc. Showcasing this set of slides titled Staff Retaining Statistics From Different Sources Sample PDF. The topics addressed in these templates are Employee Referrals, Notification Source. All the content presented in this PPT design is completely editable. Download it and make adjustments in color, background, font etc. as per your unique business setting.
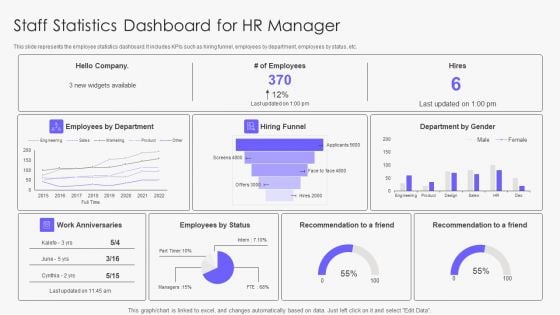
Staff Statistics Dashboard For Hr Manager Rules PDF
This slide represents the employee statistics dashboard. It includes KPIs such as hiring funnel, employees by department, employees by status, etc. Pitch your topic with ease and precision using this Staff Statistics Dashboard For Hr Manager Rules PDF. This layout presents information on Hiring Funnel, Employees By Status, Employees By Department. It is also available for immediate download and adjustment. So, changes can be made in the color, design, graphics or any other component to create a unique layout.
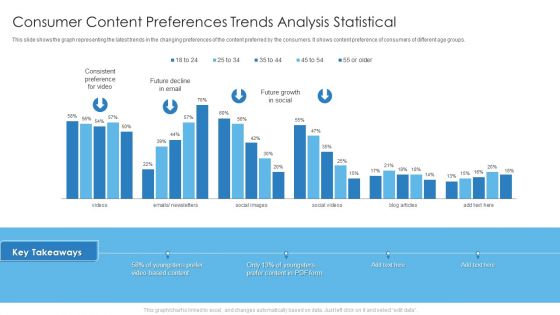
Consumer Content Preferences Trends Analysis Statistical Designs PDF
This slide shows the graph representing the latest trends in the changing preferences of the content preferred by the consumers. It shows content preference of consumers of different age groups. Deliver an awe inspiring pitch with this creative Consumer Content Preferences Trends Analysis Statistical Designs PDF bundle. Topics like Consumer Content Preferences, Trends Analysis Statistical can be discussed with this completely editable template. It is available for immediate download depending on the needs and requirements of the user.
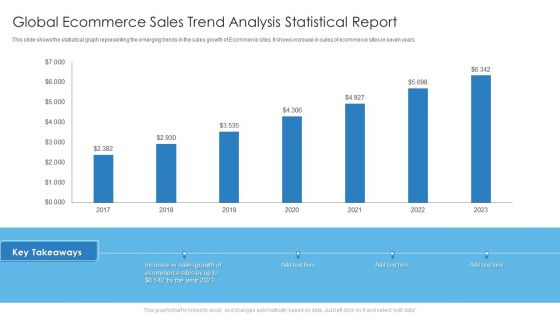
Global Ecommerce Sales Trend Analysis Statistical Report Mockup PDF
This slide shows the statistical graph representing the emerging trends in the sales growth of Ecommerce sites. It shows increase in sales of ecommerce sites in seven years. Deliver and pitch your topic in the best possible manner with this Global Ecommerce Sales Trend Analysis Statistical Report Mockup PDF. Use them to share invaluable insights on Sales Growth, Ecommerce Sites and impress your audience. This template can be altered and modified as per your expectations. So, grab it now.
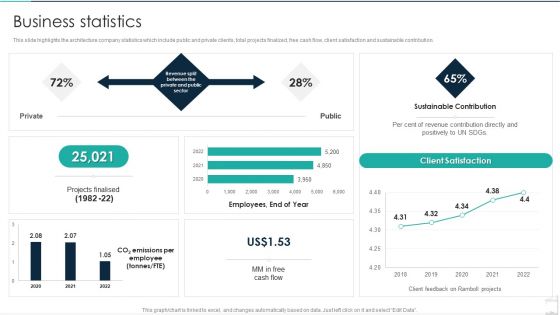
Commercial Construction And Architecture Firm Business Statistics Ideas PDF
This slide highlights the architecture company statistics which include public and private clients, total projects finalized, free cash flow, client satisfaction and sustainable contribution. Deliver an awe inspiring pitch with this creative Commercial Construction And Architecture Firm Business Statistics Ideas PDF bundle. Topics like Revenue, Projects Finalised, Employees can be discussed with this completely editable template. It is available for immediate download depending on the needs and requirements of the user.
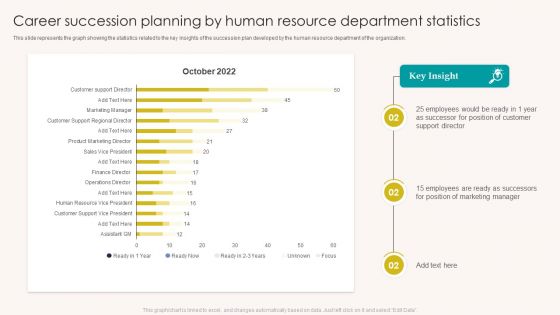
Career Succession Planning By Human Resource Department Statistics Graphics PDF
This slide represents the graph showing the statistics related to the key insights of the succession plan developed by the human resource department of the organization. Showcasing this set of slides titled Career Succession Planning By Human Resource Department Statistics Graphics PDF. The topics addressed in these templates are Employees, Customer, Marketing Manager. All the content presented in this PPT design is completely editable. Download it and make adjustments in color, background, font etc. as per your unique business setting.
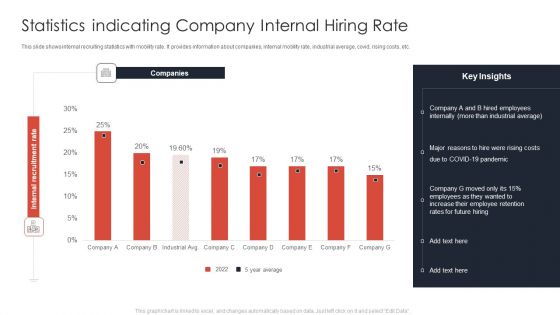
Statistics Indicating Company Internal Hiring Rate Ppt Ideas Templates PDF
This slide shows internal recruiting statistics with mobility rate. It provides information about companies, internal mobility rate, industrial average, covid, rising costs, etc. Showcasing this set of slides titled Statistics Indicating Company Internal Hiring Rate Ppt Ideas Templates PDF. The topics addressed in these templates are Companies, Employees Internally, COVID 19 Pandemic. All the content presented in this PPT design is completely editable. Download it and make adjustments in color, background, font etc. as per your unique business setting.
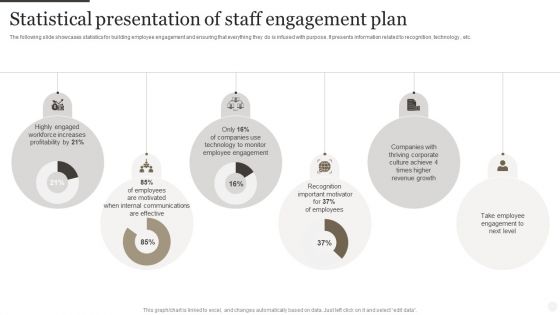
Statistical Presentation Of Staff Engagement Plan Inspiration PDF
The following slide showcases statistics for building employee engagement and ensuring that everything they do is infused with purpose. It presents information related to recognition, technology, etc. Showcasing this set of slides titled Statistical Presentation Of Staff Engagement Plan Inspiration PDF. The topics addressed in these templates are Communications Are Effective, Engagement Plan All the content presented in this PPT design is completely editable. Download it and make adjustments in color, background, font etc. as per your unique business setting.
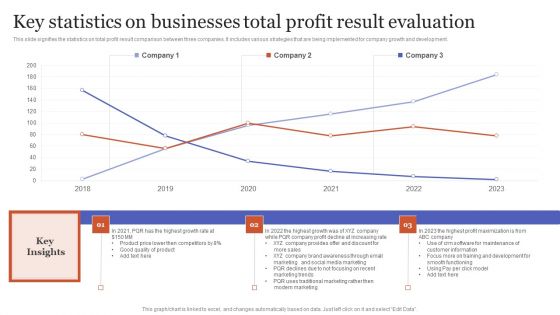
Key Statistics On Businesses Total Profit Result Evaluation Rules PDF
This slide signifies the statistics on total profit result comparison between three companies. It includes various strategies that are being implemented for company growth and development.Pitch your topic with ease and precision using this Key Statistics On Businesses Total Profit Result Evaluation Rules PDF. This layout presents information on Traditional Marketing, Modern Marketing, Training Development. It is also available for immediate download and adjustment. So, changes can be made in the color, design, graphics or any other component to create a unique layout.
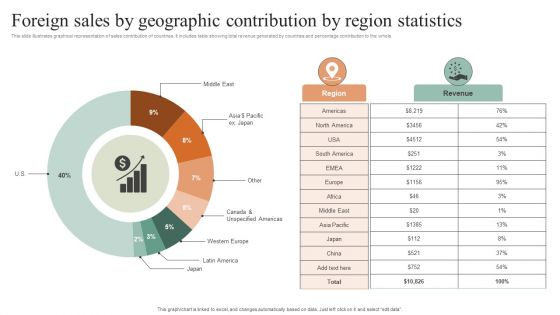
Foreign Sales By Geographic Contribution By Region Statistics Information PDF
This slide illustrates graphical representation of sales contribution of countries. It includes table showing total revenue generated by countries and percentage contribution to the whole. Showcasing this set of slides titled Foreign Sales By Geographic Contribution By Region Statistics Information PDF. The topics addressed in these templates are Region Statistics, Geographic Contribution, Foreign Sales. All the content presented in this PPT design is completely editable. Download it and make adjustments in color, background, font etc. as per your unique business setting.
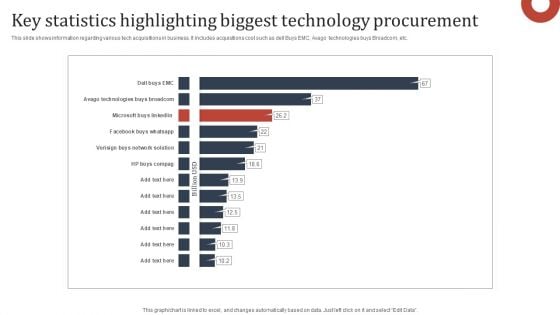
Key Statistics Highlighting Biggest Technology Procurement Slides PDF
This slide shows information regarding various tech acquisitions in business. It includes acquisitions cost such as dell Buys EMC, Avago technologies buys Broadcom, etc. Showcasing this set of slides titled Key Statistics Highlighting Biggest Technology Procurement Slides PDF. The topics addressed in these templates are Key Statistics, Biggest Technology, Procurement. All the content presented in this PPT design is completely editable. Download it and make adjustments in color, background, font etc. as per your unique business setting.
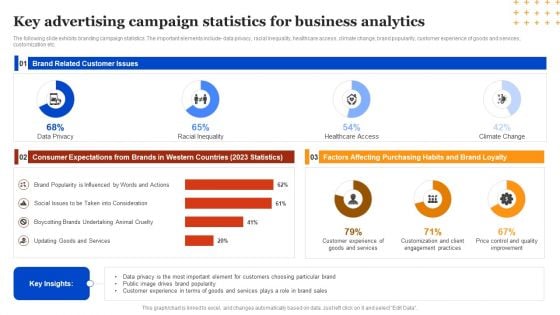
Key Advertising Campaign Statistics For Business Analytics Summary PDF
The following slide exhibits branding campaign statistics. The important elements include- data privacy, racial inequality, healthcare access, climate change, brand popularity, customer experience of goods and services, customization etc. Showcasing this set of slides titled Key Advertising Campaign Statistics For Business Analytics Summary PDF. The topics addressed in these templates are Key Insights, Analytics, Healthcare Access. All the content presented in this PPT design is completely editable. Download it and make adjustments in color, background, font etc. as per your unique business setting.
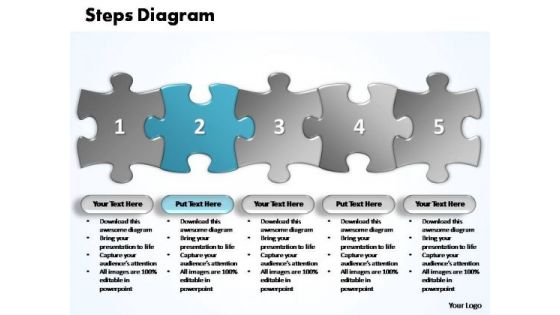
PowerPoint Templates Business Five Improvement Steps Puzzle Ppt Process
PowerPoint Templates Business Five Improvement Steps Puzzle PPT Process-Use this graphic to represent a continuing sequence of stages, tasks, or events and emphasize the connection between all components-PowerPoint Templates Business Five Improvement Steps Puzzle PPT Process Get a blue-chip client list with your ideas. Attract the best customers with our PowerPoint Templates Business Five Improvement Steps Puzzle Ppt Process.
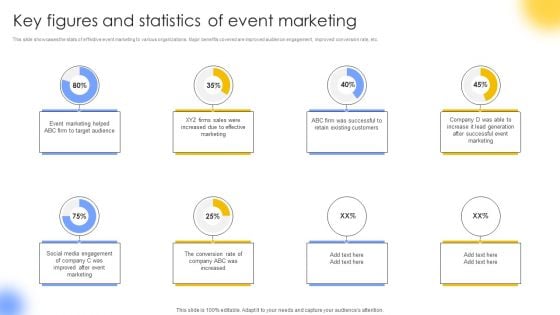
Key Figures And Statistics Of Event Marketing Portrait PDF
This slide showcases the stats of effective event marketing to various organizations. Major benefits covered are improved audience engagement, improved conversion rate, etc. If you are looking for a format to display your unique thoughts, then the professionally designed Key Figures And Statistics Of Event Marketing Portrait PDF is the one for you. You can use it as a Google Slides template or a PowerPoint template. Incorporate impressive visuals, symbols, images, and other charts. Modify or reorganize the text boxes as you desire. Experiment with shade schemes and font pairings. Alter, share or cooperate with other people on your work. Download Key Figures And Statistics Of Event Marketing Portrait PDF and find out how to give a successful presentation. Present a perfect display to your team and make your presentation unforgettable.
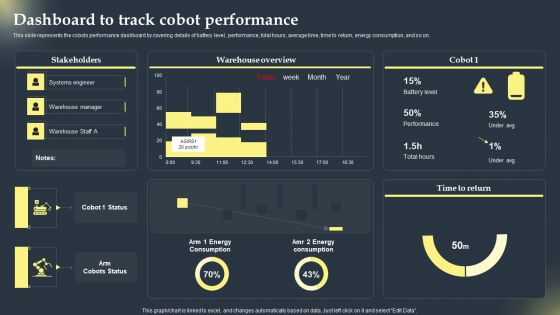
Cobots Global Statistics Dashboard To Track Cobot Performance Mockup PDF
This slide represents the cobots performance dashboard by covering details of battery level, performance, total hours, average time, time to return, energy consumption, and so on. If you are looking for a format to display your unique thoughts, then the professionally designed Cobots Global Statistics Dashboard To Track Cobot Performance Mockup PDF is the one for you. You can use it as a Google Slides template or a PowerPoint template. Incorporate impressive visuals, symbols, images, and other charts. Modify or reorganize the text boxes as you desire. Experiment with shade schemes and font pairings. Alter, share or cooperate with other people on your work. Download Cobots Global Statistics Dashboard To Track Cobot Performance Mockup PDF and find out how to give a successful presentation. Present a perfect display to your team and make your presentation unforgettable.
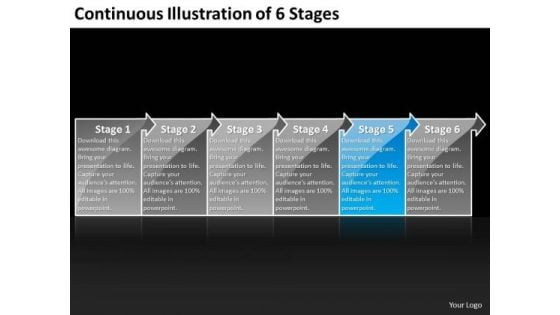
Continuous Illustration Of 6 Stages Business Create Flow Chart PowerPoint Slides
We present our continuous illustration of 6 stages business create flow chart PowerPoint Slides.Download and present our Advertising PowerPoint Templates because a lot of hard work has gone in and you are almost there. Use our Arrows PowerPoint Templates because the concept and strategy is your strength. Present our Business PowerPoint Templates because you can see clearly through to the bigger bowl ahead. Time your jump to perfection and hit the nail on the head. Download and present our Shapes PowerPoint Templates because you will be able to Highlight the various ways in which we can maintain its efficiency. Present our Flow charts PowerPoint Templates because you have the moves to sway the market.Use these PowerPoint slides for presentations relating to Arrow Background Blue Business Button Chart Diagram Goal Graphic Gray Illustration Important Management Organization Priority Process Setting Task Transparency Urgent White. The prominent colors used in the PowerPoint template are Blue light, Gray, Black. Use our continuous illustration of 6 stages business create flow chart PowerPoint Slides are Splendid. Presenters tell us our Diagram PowerPoint templates and PPT Slides are specially created by a professional team with vast experience. They diligently strive to come up with the right vehicle for your brilliant Ideas. Presenters tell us our continuous illustration of 6 stages business create flow chart PowerPoint Slides will make the presenter look like a pro even if they are not computer savvy. You can be sure our Button PowerPoint templates and PPT Slides are Pleasant. PowerPoint presentation experts tell us our continuous illustration of 6 stages business create flow chart PowerPoint Slides are Luxuriant. Professionals tell us our Chart PowerPoint templates and PPT Slides are Multicolored. Our Continuous Illustration Of 6 Stages Business Create Flow Chart PowerPoint Slides ensure approval. Your ideas will fit the bill.
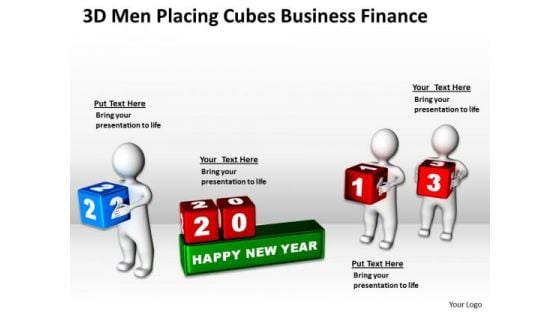
Business Charts Placing Cubes PowerPoint Presentation Finance Templates
We present our business charts placing cubes powerpoint presentation finance templates.Download our Business PowerPoint Templates because Our PowerPoint Templates and Slides are topically designed to provide an attractive backdrop to any subject. Use our Cubes PowerPoint Templates because Our PowerPoint Templates and Slides will let your ideas bloom. Create a bed of roses for your audience. Download and present our Boxes PowerPoint Templates because you can Set pulses racing with our PowerPoint Templates and Slides. They will raise the expectations of your team. Download and present our Communication PowerPoint Templates because Our PowerPoint Templates and Slides will let you Hit the target. Go the full distance with ease and elan. Use our Signs PowerPoint Templates because Our PowerPoint Templates and Slides are innately eco-friendly. Their high recall value negate the need for paper handouts.Use these PowerPoint slides for presentations relating to 2013, business, calendar, cartoon, celebrate, celebration, character, christmas, communication, concept, creative, date, day, december, eve, event, future, gift, greetings, guy, happy, holiday, hopes, human, illustration, information, internet, joy, men, message, new, number, past, people, person, replace, sale, season, sign, success, successful, support, task, text, time, view, wishes, xmas, year. The prominent colors used in the PowerPoint template are Green, Blue, Red. Professionals tell us our business charts placing cubes powerpoint presentation finance templates are visually appealing. Use our communication PowerPoint templates and PPT Slides are second to none. Use our business charts placing cubes powerpoint presentation finance templates will impress their bosses and teams. Customers tell us our cartoon PowerPoint templates and PPT Slides will impress their bosses and teams. Presenters tell us our business charts placing cubes powerpoint presentation finance templates will help them to explain complicated concepts. People tell us our character PowerPoint templates and PPT Slides will help them to explain complicated concepts. Bring on your ideas in all confidence. Our Business Charts Placing Cubes PowerPoint Presentation Finance Templates will deliver them with great fervour.
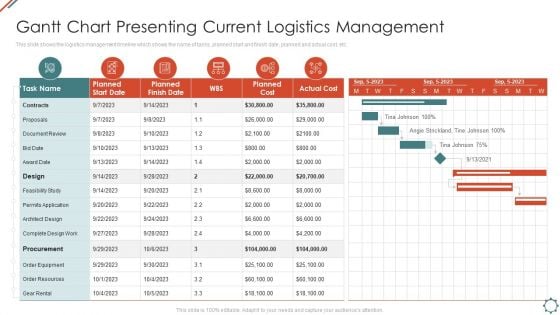
Administering Logistics Activities In SCM Gantt Chart Presenting Current Logistics Management Elements PDF
This slide shows the logistics management timeline which shows the name of tasks, planned start and finish date, planned and actual cost, etc. Deliver and pitch your topic in the best possible manner with this Administering Logistics Activities In SCM Gantt Chart Presenting Current Logistics Management Elements PDF. Use them to share invaluable insights on Document Review, Permits Application, Procurement and impress your audience. This template can be altered and modified as per your expectations. So, grab it now.
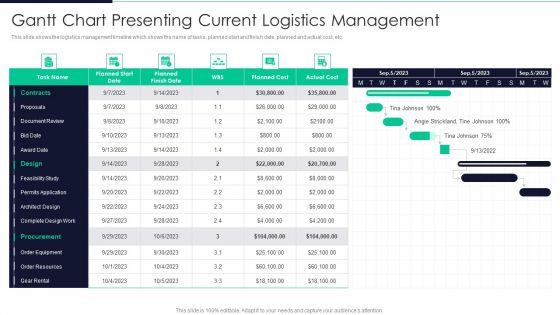
Developing Excellence In Logistics Operations Gantt Chart Presenting Current Logistics Management Topics PDF
This slide shows the logistics management timeline which shows the name of tasks, planned start and finish date, planned and actual cost, etc.Deliver and pitch your topic in the best possible manner with this Developing Excellence In Logistics Operations Gantt Chart Presenting Current Logistics Management Topics PDF Use them to share invaluable insights on Feasibility Study, Order Equipment, Order Resources and impress your audience. This template can be altered and modified as per your expectations. So, grab it now.
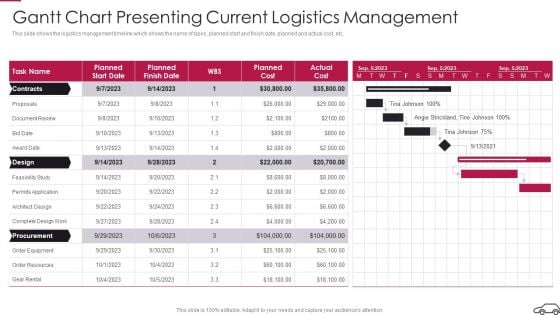
Continual Improvement Procedure In Supply Chain Gantt Chart Presenting Current Logistics Management Sample PDF
This slide shows the logistics management timeline which shows the name of tasks, planned start and finish date, planned and actual cost, etc.Deliver and pitch your topic in the best possible manner with this Continual Improvement Procedure In Supply Chain Gantt Chart Presenting Current Logistics Management Sample PDF Use them to share invaluable insights on Document Review, Feasibility Study, Order Equipment and impress your audience. This template can be altered and modified as per your expectations. So, grab it now.
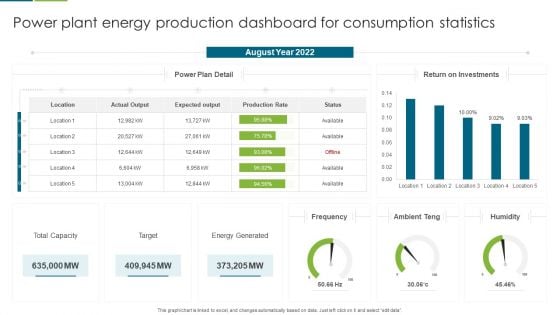
Power Plant Energy Production Dashboard For Consumption Statistics Download PDF
This graph or chart is linked to excel, and changes automatically based on data. Just left click on it and select edit data. Pitch your topic with ease and precision using this Multiple Country Energy Consumption Statistics Comparison Dashboard Formats PDF. This layout presents information on August Year 2022, Return on Investments, Power Plan Detail . It is also available for immediate download and adjustment. So, changes can be made in the color, design, graphics or any other component to create a unique layout.
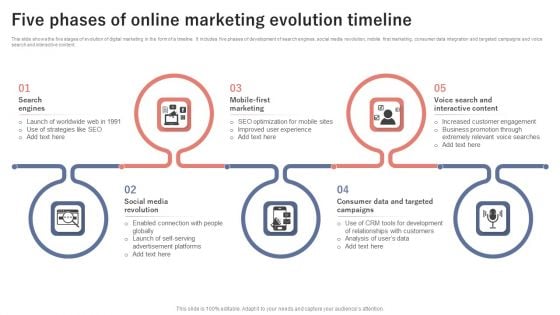
Five Phases Of Online Marketing Evolution Timeline Background PDF
This slide shows the five stages of evolution of digital marketing in the form of a timeline. It includes five phases of development of search engines, social media revolution, mobile first marketing, consumer data integration and targeted campaigns and voice search and interactive content. Presenting Five Phases Of Online Marketing Evolution Timeline Background PDF to dispense important information. This template comprises five stages. It also presents valuable insights into the topics including Search Engines, Social Media Revolution, Mobile First Marketing. This is a completely customizable PowerPoint theme that can be put to use immediately. So, download it and address the topic impactfully.
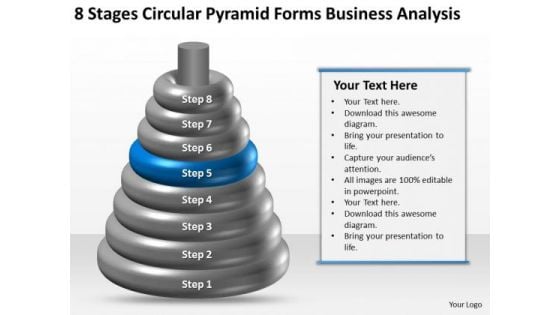
Business Process Flow 8 Stages Circular Pyramid Forms Analysis PowerPoint Templates
We present our business process flow 8 stages circular pyramid forms analysis PowerPoint templates.Use our Business PowerPoint Templates because Our PowerPoint Templates and Slides are conceived by a dedicated team. Use them and give form to your wondrous ideas. Present our Pyramids PowerPoint Templates because Our PowerPoint Templates and Slides come in all colours, shades and hues. They help highlight every nuance of your views. Use our Layers PowerPoint Templates because Our PowerPoint Templates and Slides will give you great value for your money. Be assured of finding the best projection to highlight your words. Present our Shapes PowerPoint Templates because Our PowerPoint Templates and Slides will provide weight to your words. They will bring out the depth of your thought process. Use our Leadership PowerPoint Templates because Our PowerPoint Templates and Slides are the chords of your song. String them along and provide the lilt to your views.Use these PowerPoint slides for presentations relating to chart, graph, pyramidal, pyramid, vector, diagram, stage, level, rainbow, color, business, scheme, progress, rank, pyramid structure, segment, pyramid diagram, pyramid chart, hierarchy, presentation, bright, symbol, layered, multicolor, layer, top, pyramid model, shape, layered pyramid, support, illustration, object, cone pyramid chart, system, cone pyramid, rainbow pyramid, pyramid scheme, pyramidal structure, cylinder, growth, cylinder pyramid, construction, structure, pyramid shape, performance. The prominent colors used in the PowerPoint template are Blue navy, Gray, White. Feast away on our Business Process Flow 8 Stages Circular Pyramid Forms Analysis PowerPoint Templates. Your eyes will get all the excitement they desire.
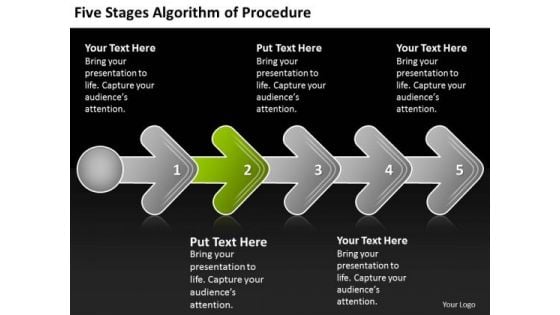
Five Stages Agorithm Of Procedure Business Flow Chart Description PowerPoint Templates
We present our five stages agorithm of procedure business flow chart description PowerPoint templates.Download and present our Arrows PowerPoint Templates because this diagram helps you to show goal also clearly etched in your mind. Download our Shapes PowerPoint Templates because you have the people in place, selected the team leaders and all are raring to go. Download our Business PowerPoint Templates because this slide will fire away with all the accuracy at your command. Download and present our Circle Charts PowerPoint Templates because profit is fairly earned in what you believe. Present our Process and Flows PowerPoint Templates because this slide illuminates the spiritual brilliance of Jesus and showers the love for mankind he showed even while being crucified.Use these PowerPoint slides for presentations relating to 3d, action, algorithm, algorithmic, arrow, automatic, automation, block, calculation, chart, computer, cycle, development, diagram, digital, engineering, flow, flowchart, informatics, information, logic, mathematical, mathematics, operation, plan, procedure, process, program, programme, programming, scheme, science, software, solve, task, technology. The prominent colors used in the PowerPoint template are Green, Gray, White. The feedback we get is that our five stages agorithm of procedure business flow chart description PowerPoint templates are Dynamic. PowerPoint presentation experts tell us our algorithmic PowerPoint templates and PPT Slides are Graceful. People tell us our five stages agorithm of procedure business flow chart description PowerPoint templates are Playful. Professionals tell us our arrow PowerPoint templates and PPT Slides are Precious. You can be sure our five stages agorithm of procedure business flow chart description PowerPoint templates are Ritzy. We assure you our calculation PowerPoint templates and PPT Slides are Dazzling. Charge your account with our Five Stages Agorithm Of Procedure Business Flow Chart Description PowerPoint Templates. Earn the interest of your audience.
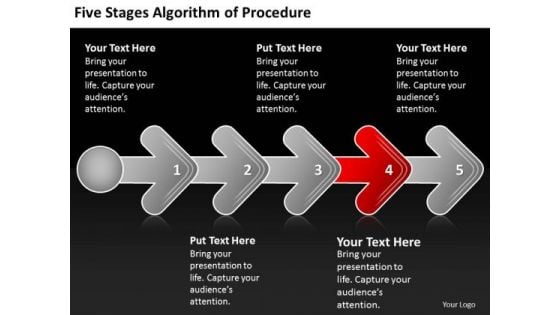
Five Stages Agorithm Of Procedure Design Process Flow Chart PowerPoint Slides
We present our five stages agorithm of procedure design process flow chart PowerPoint Slides.Present our Arrows PowerPoint Templates because all elements of the venture are equally critical. Use our Shapes PowerPoint Templates because you can outline your targets to your team. Download our Business PowerPoint Templates because this layout helps you to bring some important aspects of your business process to the notice of all concerned. Streamline the flow of information across the board. Use our Circle Charts PowerPoint Templates because this diagram provides range of options to garner your interest. Present our Process and Flows PowerPoint Templates because you should explain the process by which you intend to right it.Use these PowerPoint slides for presentations relating to 3d, action, algorithm, algorithmic, arrow, automatic, automation, block, calculation, chart, computer, cycle, development, diagram, digital, engineering, flow, flowchart, informatics, information, logic, mathematical, mathematics, operation, plan, procedure, process, program, programme, programming, scheme, science, software, solve, task, technology. The prominent colors used in the PowerPoint template are Red, Gray, White. The feedback we get is that our five stages agorithm of procedure design process flow chart PowerPoint Slides are Nifty. PowerPoint presentation experts tell us our arrow PowerPoint templates and PPT Slides help you meet deadlines which are an element of today's workplace. Just browse and pick the slides that appeal to your intuitive senses. People tell us our five stages agorithm of procedure design process flow chart PowerPoint Slides are Sparkling. Professionals tell us our calculation PowerPoint templates and PPT Slides look good visually. You can be sure our five stages agorithm of procedure design process flow chart PowerPoint Slides are Ritzy. We assure you our arrow PowerPoint templates and PPT Slides are Adorable. Let the audience decide with our Five Stages Agorithm Of Procedure Design Process Flow Chart PowerPoint Slides. Make sure your presentation gets the attention it deserves.
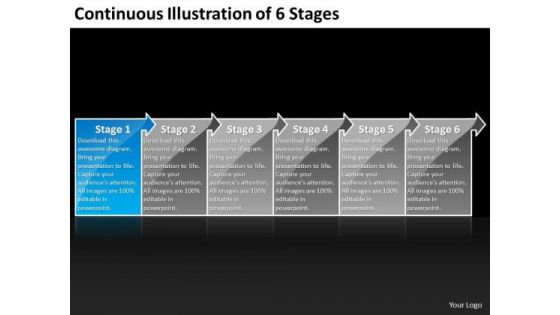
Continuous Illustration Of 6 Stages Flow Chart For Process PowerPoint Slides
We present our continuous illustration of 6 stages flow chart for process PowerPoint Slides.Present our Advertising PowerPoint Templates because this diagram helps you to harness the opportunities, celebrate your performance till date and focus on greater growth and expansion in coming years. Download our Arrows PowerPoint Templates because using this Ideas will roll along in your mind like billiard balls. Use our Business PowerPoint Templates because you can Lead your flock steadily to greater heights. Look around at the vast potential of achievement around you. Use our Shapes PowerPoint Templates because you can Educate your listeners on the means to keep it ticking over. Download our Flow charts PowerPoint Templates because you understand the ailment and how to fight it.Use these PowerPoint slides for presentations relating to Arrow Background Blue Business Button Chart Diagram Goal Graphic Gray Illustration Important Management Organization Priority Process Setting Task Transparency Urgent White. The prominent colors used in the PowerPoint template are Blue light, Gray, Black. Use our continuous illustration of 6 stages flow chart for process PowerPoint Slides are Splendid. Presenters tell us our Button PowerPoint templates and PPT Slides are Radiant. Presenters tell us our continuous illustration of 6 stages flow chart for process PowerPoint Slides are Charming. You can be sure our Business PowerPoint templates and PPT Slides are Playful. PowerPoint presentation experts tell us our continuous illustration of 6 stages flow chart for process PowerPoint Slides are Festive. Professionals tell us our Graphic PowerPoint templates and PPT Slides are Elegant. Break out of the cocoon with our Continuous Illustration Of 6 Stages Flow Chart For Process PowerPoint Slides. Let your thoughts take to the air.
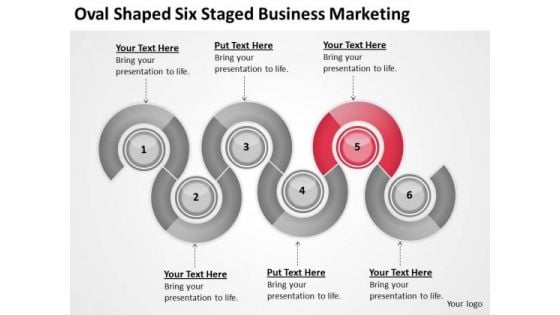
Oval Shaped Six Staged Business Marketing Ppt Plan Ideas PowerPoint Slides
We present our oval shaped six staged business marketing ppt plan ideas PowerPoint Slides.Download our Flow Charts PowerPoint Templates because Our PowerPoint Templates and Slides will embellish your thoughts. See them provide the desired motivation to your team. Download our Marketing PowerPoint Templates because Our PowerPoint Templates and Slides will Activate the energies of your audience. Get their creative juices flowing with your words. Download and present our Spheres PowerPoint Templates because Our PowerPoint Templates and Slides will generate and maintain the level of interest you desire. They will create the impression you want to imprint on your audience. Download and present our Business PowerPoint Templates because Our PowerPoint Templates and Slides will bullet point your ideas. See them fall into place one by one. Use our Process and Flows PowerPoint Templates because You can Double your output with our PowerPoint Templates and Slides. They make beating deadlines a piece of cake.Use these PowerPoint slides for presentations relating to Diagram, chart, flow, business, process, vector, arrow, organization, segment, flow, vibrant, circlediagram, arrowchart, plan, chart, rotation, glossy, circle, processarrows, element, workflow, flowchart, blockdiagram, development, graph, cycle, circulation, circular, flowchart, strategy,round, section, solution, processchart, direction, design, motion, lineardiagram, rounddiagram, module, movement, cyclic, workflow diagram. The prominent colors used in the PowerPoint template are Red, White, Gray. Dosen't matter what the topic. Make it interesting with our Oval Shaped Six Staged Business Marketing Ppt Plan Ideas PowerPoint Slides. You will be at the top of your game.
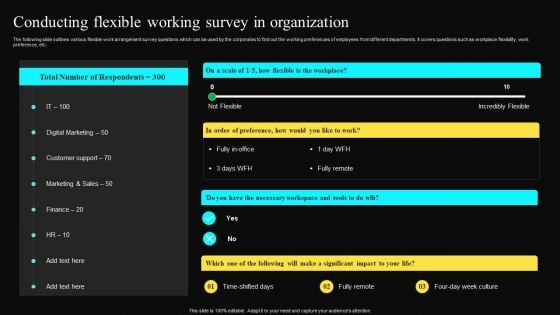
Conducting Flexible Working Survey In Organization Background PDF
The following slide outlines various flexible work arrangement survey questions which can be used by the corporates to find out the working preferences of employees from different departments. It covers questions such as workplace flexibility, work preference, etc. Whether you have daily or monthly meetings, a brilliant presentation is necessary. Conducting Flexible Working Survey In Organization Background PDF can be your best option for delivering a presentation. Represent everything in detail using Conducting Flexible Working Survey In Organization Background PDF and make yourself stand out in meetings. The template is versatile and follows a structure that will cater to your requirements. All the templates prepared by Slidegeeks are easy to download and edit. Our research experts have taken care of the corporate themes as well. So, give it a try and see the results.
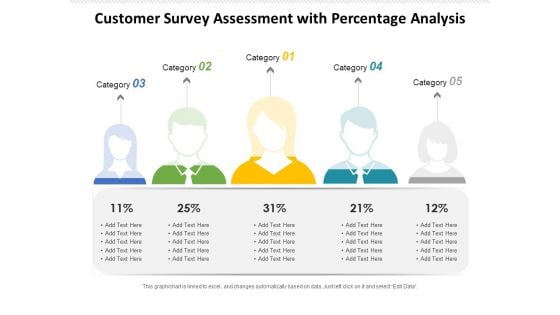
Customer Survey Assessment With Percentage Analysis Ppt PowerPoint Presentation Styles Grid PDF
Presenting this set of slides with name customer survey assessment with percentage analysis ppt powerpoint presentation styles grid pdf.The topics discussed in these slide is customer survey assessment with percentage analysis. This is a completely editable PowerPoint presentation and is available for immediate download. Download now and impress your audience.
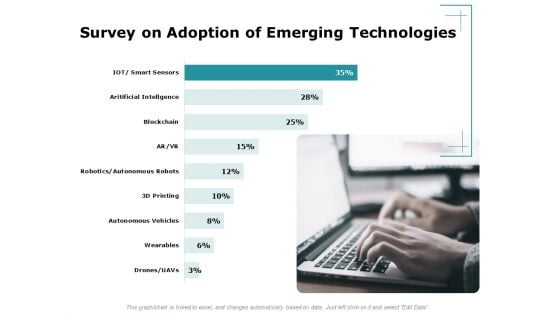
Artificial Intelligence Survey On Adoption Of Emerging Technologies Ppt Gallery Visual Aids PDF
Presenting this set of slides with name artificial intelligence survey on adoption of emerging technologies ppt gallery visual aids pdf. The topics discussed in these slides are survey on adoption of emerging technologies. This is a completely editable PowerPoint presentation and is available for immediate download. Download now and impress your audience.
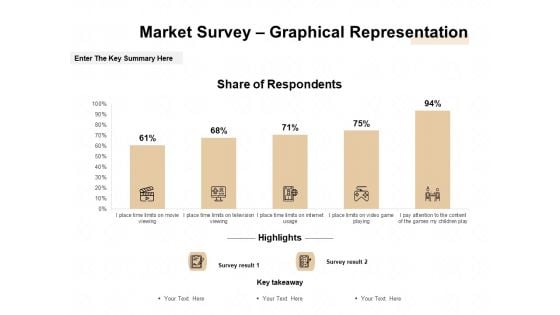
Market Sizing Market Survey Graphical Representation Ppt Infographic Template Examples PDF
Presenting this set of slides with name market sizing market survey graphical representation ppt infographic template examples pdf. The topics discussed in these slides are market survey graphical representation. This is a completely editable PowerPoint presentation and is available for immediate download. Download now and impress your audience.
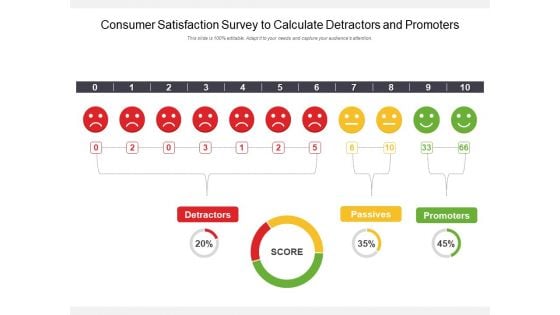
Consumer Satisfaction Survey To Calculate Detractors And Promoters Ppt PowerPoint Presentation Show Topics PDF
Pitch your topic with ease and precision using this consumer satisfaction survey to calculate detractors and promoters ppt powerpoint presentation show topics pdf. This layout presents information on consumer satisfaction survey to calculate detractors and promoters. It is also available for immediate download and adjustment. So, changes can be made in the color, design, graphics or any other component to create a unique layout.
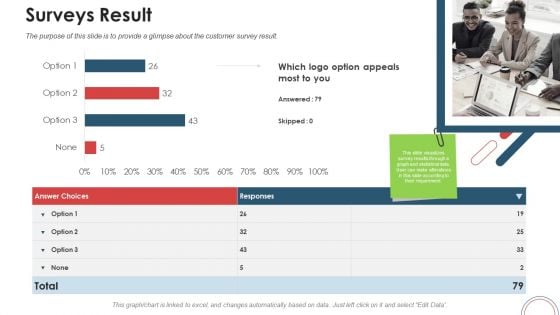
Action Plan For Brand Revitalization To Attract Target Customers Surveys Result Ppt Portfolio Guidelines PDF
Deliver an awe inspiring pitch with this creative action plan for brand revitalization to attract target customers surveys result ppt portfolio guidelines pdf bundle. Topics like surveys result can be discussed with this completely editable template. It is available for immediate download depending on the needs and requirements of the user.
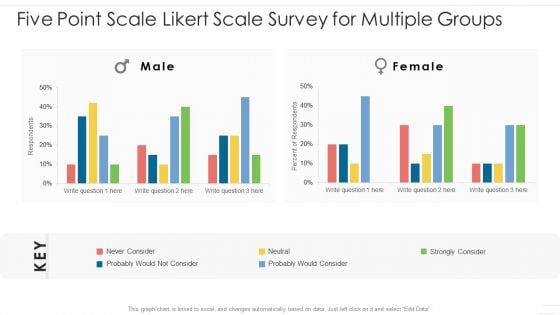
Five Point Scale Likert Scale Survey For Multiple Groups Formats PDF
Showcasing this set of slides titled five point scale likert scale survey for multiple groups formats pdf. The topics addressed in these templates are five point scale likert scale survey for multiple groups. All the content presented in this PPT design is completely editable. Download it and make adjustments in color, background, font etc. as per your unique business setting.
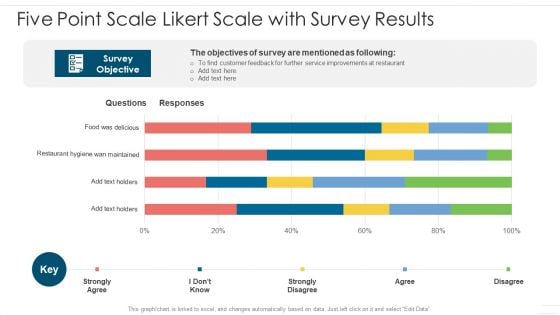
Five Point Scale Likert Scale With Survey Results Slide2 Summary PDF
Showcasing this set of slides titled five point scale likert scale with survey results summary pdf. The topics addressed in these templates are five point scale likert scale with survey results. All the content presented in this PPT design is completely editable. Download it and make adjustments in color, background, font etc. as per your unique business setting.

Employee Feedback Survey Outcomes Results To Assess Team Engagement Demonstration PDF
Showcasing this set of slides titled employee feedback survey outcomes results to assess team engagement demonstration pdf. The topics addressed in these templates are employee feedback survey outcomes results to assess team engagement. All the content presented in this PPT design is completely editable. Download it and make adjustments in color, background, font etc. as per your unique business setting.
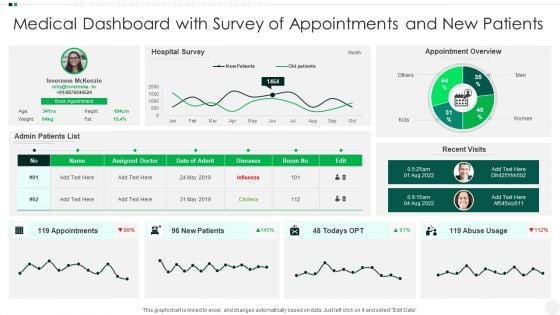
Medical Dashboard With Survey Of Appointments And New Patients Summary PDF
Showcasing this set of slides titled Medical Dashboard With Survey Of Appointments And New Patients Summary PDF. The topics addressed in these templates are Medical Dashboard With Survey Of Appointments And New Patients. All the content presented in this PPT design is completely editable. Download it and make adjustments in color, background, font etc. as per your unique business setting.
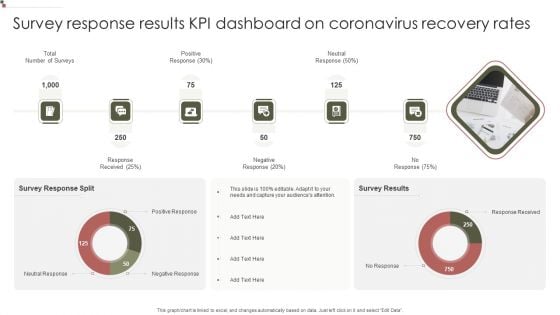
Survey Response Results KPI Dashboard On Coronavirus Recovery Rates Information PDF
Pitch your topic with ease and precision using this Survey Response Results KPI Dashboard On Coronavirus Recovery Rates Information PDF. This layout presents information on Positive Response, Response Received, Survey Response. It is also available for immediate download and adjustment. So, changes can be made in the color, design, graphics or any other component to create a unique layout.
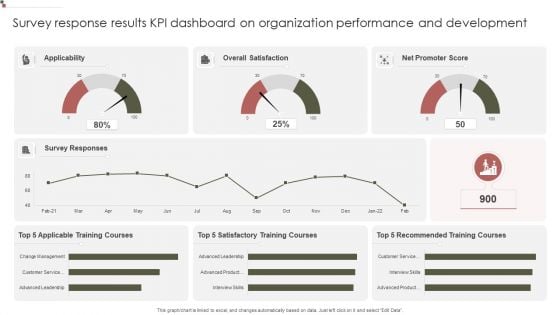
Survey Response Results KPI Dashboard On Organization Performance And Development Summary PDF
Showcasing this set of slides titled Survey Response Results KPI Dashboard On Organization Performance And Development Summary PDF. The topics addressed in these templates are Survey Responses, Overall Satisfaction, Training Courses. All the content presented in this PPT design is completely editable. Download it and make adjustments in color, background, font etc. as per your unique business setting.
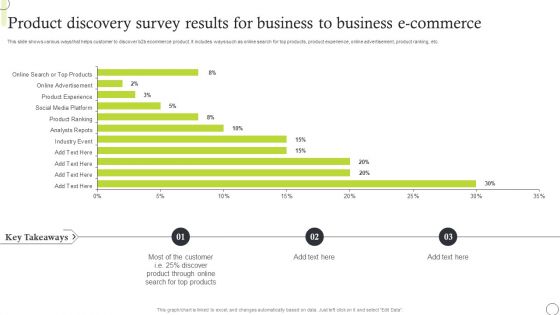
Product Discovery Survey Results For Business To Business E Commerce Elements PDF
Showcasing this set of slides titled Product Discovery Survey Results For Business To Business E Commerce Elements PDF. The topics addressed in these templates are Product Discovery Survey, Results For Business, To Business E-Commerce. All the content presented in this PPT design is completely editable. Download it and make adjustments in color, background, font etc. as per your unique business setting.
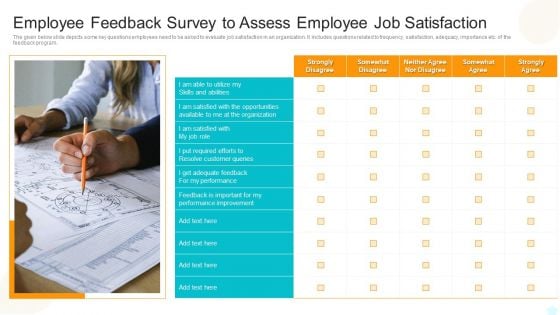
Employee Feedback Survey To Assess Employee Job Satisfaction Clipart PDF
The given below slide depicts some key questions employees need to be asked to evaluate job satisfaction in an organization. It includes questions related to frequency, satisfaction, adequacy, importance etc. of the feedback program.Presenting Employee Feedback Survey To Assess Employee Job Satisfaction Clipart PDF to dispense important information. This template comprises one stage. It also presents valuable insights into the topics including Strongly Disagree, Satisfied With The Opportunities, Performance Improvement This is a completely customizable PowerPoint theme that can be put to use immediately. So, download it and address the topic impactfully.
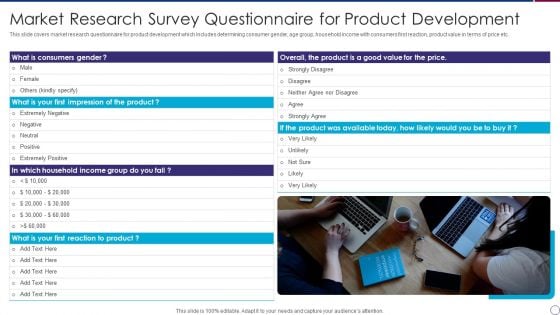
Market Research Survey Questionnaire For Product Development Brochure PDF
This slide covers market research questionnaire for product development which includes determining consumer gender, age group, household income with consumers first reaction, product value in terms of price etc.Presenting Market Research Survey Questionnaire For Product Development Brochure PDF to dispense important information. This template comprises one stage. It also presents valuable insights into the topics including consumers gender, reaction product, Extremely Positive This is a completely customizable PowerPoint theme that can be put to use immediately. So, download it and address the topic impactfully.
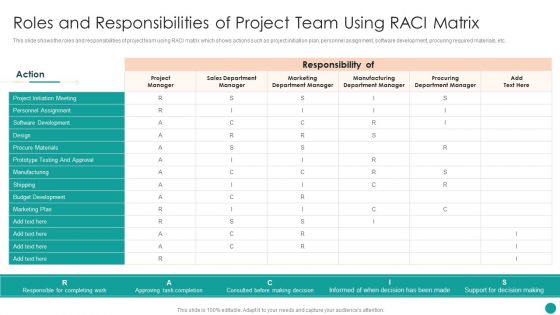
Time Management Techniques For Successful Project Roles And Responsibilities Of Project Team Using RACI Matrix Diagrams PDF
This slide shows the roles and responsibilities of project team using RACI matrix which shows actions such as project initiation plan, personnel assignment, software development, procuring required materials, etc.Deliver an awe inspiring pitch with this creative Time Management Techniques For Successful Project Roles And Responsibilities Of Project Team Using RACI Matrix Diagrams PDF bundle. Topics like Personnel Assignment, Software Development, Prototype Testing can be discussed with this completely editable template. It is available for immediate download depending on the needs and requirements of the user.
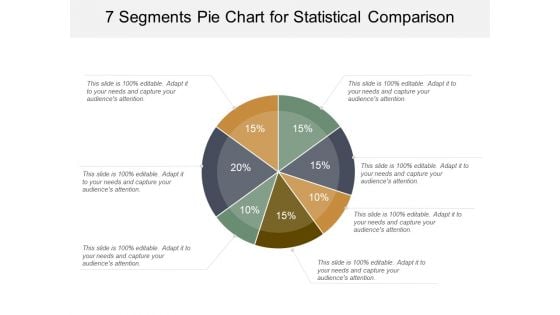
7 Segments Pie Chart For Statistical Comparison Ppt PowerPoint Presentation Gallery Visual Aids
This is a 7 segments pie chart for statistical comparison ppt powerpoint presentation gallery visual aids. This is a seven stage process. The stages in this process are 6 piece pie chart, 6 segment pie chart, 6 parts pie chart.
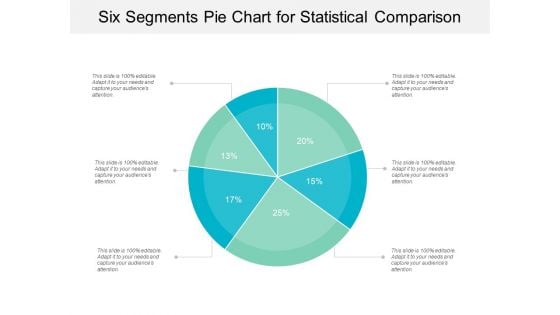
Six Segments Pie Chart For Statistical Comparison Ppt PowerPoint Presentation Gallery Background
This is a six segments pie chart for statistical comparison ppt powerpoint presentation gallery background. This is a six stage process. The stages in this process are 6 piece pie chart, 6 segment pie chart, 6 parts pie chart.


 Continue with Email

 Home
Home


