Checkmark Icon
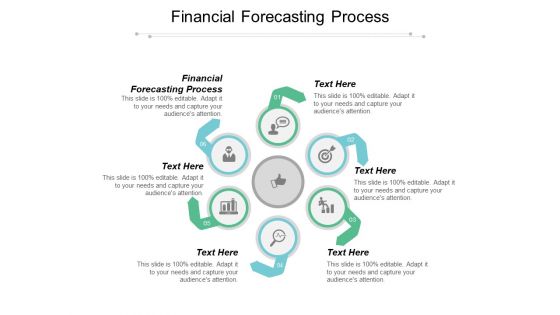
Financial Forecasting Process Ppt PowerPoint Presentation Ideas Example File Cpb
This is a financial forecasting process ppt powerpoint presentation ideas example file cpb. This is a six stage process. The stages in this process are financial forecasting process.
Product Sales Forecasting Ppt PowerPoint Presentation Visual Aids Cpb
This is a product sales forecasting ppt powerpoint presentation visual aids cpb. This is a six stage process. The stages in this process are product sales forecasting.
Corporate Forecasting Ppt PowerPoint Presentation Styles Clipart Cpb
This is a corporate forecasting ppt powerpoint presentation styles clipart cpb. This is a four stage process. The stages in this process are corporate forecasting.
Revenue Forecasting Methods Ppt PowerPoint Presentation Gallery Professional Cpb
This is a revenue forecasting methods ppt powerpoint presentation gallery professional cpb. This is a five stage process. The stages in this process are revenue forecasting methods.
Marketing Forecasting Techniques Ppt PowerPoint Presentation Professional Guide Cpb
This is a marketing forecasting techniques ppt powerpoint presentation professional guide cpb. This is a four stage process. The stages in this process are marketing forecasting techniques.
Sales Forecast Tool Ppt PowerPoint Presentation Gallery Images Cpb
This is a sales forecast tool ppt powerpoint presentation gallery images cpb. This is a four stage process. The stages in this process are sales forecast tool.
Company Budget Forecast Ppt PowerPoint Presentation Layouts Graphics Pictures Cpb
This is a company budget forecast ppt powerpoint presentation layouts graphics pictures cpb. This is a eight stage process. The stages in this process are company budget forecast.
Economic Indicator Forecasts Ppt PowerPoint Presentation Summary Design Ideas Cpb
This is a economic indicator forecasts ppt powerpoint presentation summary design ideas cpb. This is a three stage process. The stages in this process are economic indicator forecasts.
Projected Sales Forecast Ppt PowerPoint Presentation Professional Portrait Cpb
This is a projected sales forecast ppt powerpoint presentation professional portrait cpb. This is a four stage process. The stages in this process are projected sales forecast.
Revenue Forecasting Method Ppt PowerPoint Presentation Layouts Slideshow Cpb
This is a revenue forecasting method ppt powerpoint presentation layouts slideshow cpb. This is a four stage process. The stages in this process are revenue forecasting method.
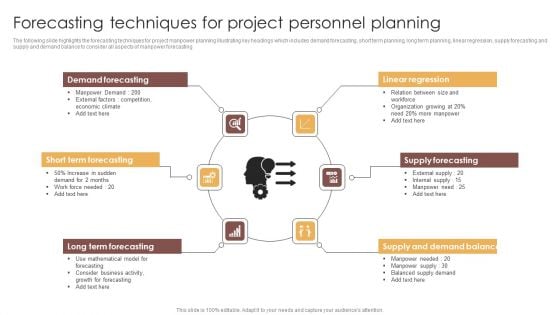
Forecasting Techniques For Project Personnel Planning Rules PDF
The following slide highlights the forecasting techniques for project manpower planning illustrating key headings which includes demand forecasting, short term planning, long term planning, linear regression, supply forecasting and supply and demand balance to consider all aspects of manpower forecasting. Persuade your audience using this Forecasting Techniques For Project Personnel Planning Rules PDF. This PPT design covers six stages, thus making it a great tool to use. It also caters to a variety of topics including Demand Forecasting, Long Term Forecasting, Supply Forecasting. Download this PPT design now to present a convincing pitch that not only emphasizes the topic but also showcases your presentation skills.
PowerPoint Theme Strategy Views Ppt Slides
PowerPoint Theme Strategy Views PPT Slides-Explore the various directions and layers existing in your in your plans and processes. Unravel the desired and essential elements of your overall strategy. Explain the relevance of the different layers and stages and directions in getting down to your core competence, ability and desired result. You have envisaged a bright future for your organisation. Deliver your forecast on our PowerPoint Theme Strategy Views Ppt Slides.
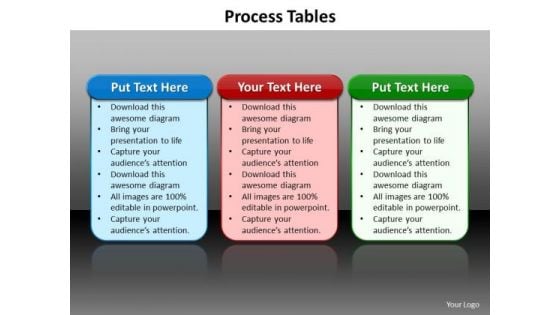
Ppt Tabular Illustration Of 3 Different Processes PowerPoint Templates
PPT tabular illustration of 3 different processes PowerPoint Templates-This Animated PowerPoint Diagram shows Three Colorful Process Tables. This Diagram Signifies Three Different components used in Business. Use this Diagram for Business Presentations.-Can be used for presentations on advertise,amount, badge, banner, bill, blank, business, button, cart, checklist, column, costing, counting, currency, descriptive, design, discount, element, empty, gradient, grid, hosting, illustration, isolated, list, message, nobody, pricing, rectangle, red-PPT tabular illustration of 3 different processes PowerPoint Templates Our Ppt Tabular Illustration Of 3 Different Processes PowerPoint Templates believe in fidelity. They will abide by your faith in them.

Monthly Report For Customer Satisfaction Survey Outcome Information PDF
This slide showcases customer satisfaction survey outcome monthly report that can help organization to compare the CSAT score and take timely corrective actions to correct the deviations. It showcases comparison for a period of 2 months and its key elements are customer experience, payment experience, website design and performance. Persuade your audience using this Monthly Report For Customer Satisfaction Survey Outcome Information PDF. This PPT design covers four stages, thus making it a great tool to use. It also caters to a variety of topics including Customer Experience, Payment Experience, Website Design. Download this PPT design now to present a convincing pitch that not only emphasizes the topic but also showcases your presentation skills.

Survey Questions To Develop EVP Components Designs PDF
The following slide presents various questions to be asked by organization from employees to efficiently develop employee value proposition. Its key purpose is to attract and retain top talent and gain competitive advantage by enhancing brand image. Find highly impressive Survey Questions To Develop EVP Components Designs PDF on Slidegeeks to deliver a meaningful presentation. You can save an ample amount of time using these presentation templates. No need to worry to prepare everything from scratch because Slidegeeks experts have already done a huge research and work for you. You need to download Survey Questions To Develop EVP Components Designs PDF for your upcoming presentation. All the presentation templates are 100 percent editable and you can change the color and personalize the content accordingly. Download now.
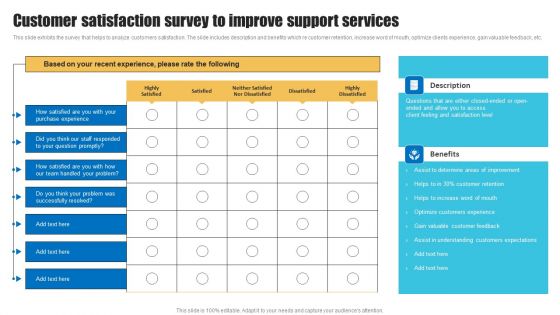
Customer Satisfaction Survey To Improve Support Services Designs PDF
This slide exhibits the survey that helps to analyze customers satisfaction. The slide includes description and benefits which re customer retention, increase word of mouth, optimize clients experience, gain valuable feedback, etc. Are you in need of a template that can accommodate all of your creative concepts This one is crafted professionally and can be altered to fit any style. Use it with Google Slides or PowerPoint. Include striking photographs, symbols, depictions, and other visuals. Fill, move around, or remove text boxes as desired. Test out color palettes and font mixtures. Edit and save your work, or work with colleagues. Download Customer Satisfaction Survey To Improve Support Services Designs PDF and observe how to make your presentation outstanding. Give an impeccable presentation to your group and make your presentation unforgettable.
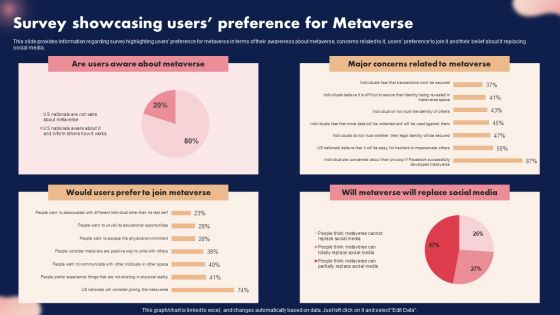
Survey Showcasing Users Preference For Metaverse Ppt Background PDF
This slide provides information regarding survey highlighting users preference for metaverse in terms of their awareness about metaverse, concerns related to it, users preference to join it and their belief about it replacing social media. The Survey Showcasing Users Preference For Metaverse Ppt Background PDF is a compilation of the most recent design trends as a series of slides. It is suitable for any subject or industry presentation, containing attractive visuals and photo spots for businesses to clearly express their messages. This template contains a variety of slides for the user to input data, such as structures to contrast two elements, bullet points, and slides for written information. Slidegeeks is prepared to create an impression.
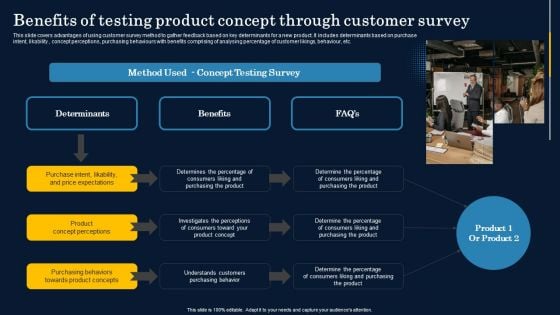
Benefits Of Testing Product Concept Through Customer Survey Graphics PDF
This slide covers advantages of using customer survey method to gather feedback based on key determinants for a new product. It includes determinants based on purchase intent, likability , concept perceptions, purchasing behaviours with benefits comprising of analysing percentage of customer likings, behaviour, etc. Boost your pitch with our creative Benefits Of Testing Product Concept Through Customer Survey Graphics PDF. Deliver an awe inspiring pitch that will mesmerize everyone. Using these presentation templates you will surely catch everyones attention. You can browse the ppts collection on our website. We have researchers who are experts at creating the right content for the templates. So you do not have to invest time in any additional work. Just grab the template now and use them.

Business Diagram Data Driven Pie Chart Inside The Magnifier PowerPoint Slide
This business slide displays 3d colorful pie graph with magnifier. This diagram is a data visualization tool that gives you a simple way to present statistical information. This slide helps your audience examine and interpret the data you present.
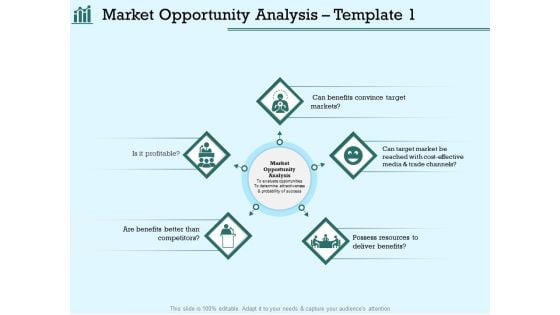
Survey Analysis Gain Marketing Insights Market Opportunity Analysis Summary PDF
Presenting this set of slides with name survey analysis gain marketing insights market opportunity analysis summary pdf. This is a five stage process. The stages in this process are possess resources to deliver benefits, are benefits better than competitors, is it profitable, can benefits convince target markets. This is a completely editable PowerPoint presentation and is available for immediate download. Download now and impress your audience.
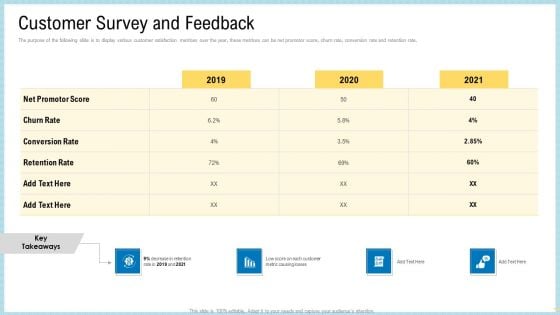
Marketing Technology Stack Customer Survey And Feedback Structure PDF
The purpose of the following slide is to display various customer satisfaction metrices over the year, these metrices can be net promotor score, churn rate, conversion rate and retention rate.Deliver an awe-inspiring pitch with this creative marketing technology stack customer survey and feedback structure pdf bundle. Topics like net promotor score, conversion rate, retention rate can be discussed with this completely editable template. It is available for immediate download depending on the needs and requirements of the user.
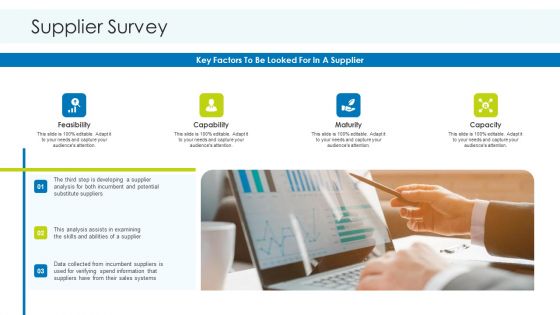
Planning And Predicting Of Logistics Management Supplier Survey Guidelines PDF
This is a planning and predicting of logistics management supplier survey guidelines pdf. template with various stages. Focus and dispense information on four stages using this creative set, that comes with editable features. It contains large content boxes to add your information on topics like feasibility, capability, maturity, capacity. You can also showcase facts, figures, and other relevant content using this PPT layout. Grab it now.

SCM And Purchasing Supplier Survey Ppt Show Clipart PDF
This is a scm and purchasing supplier survey ppt show clipart pdf template with various stages. Focus and dispense information on three stages using this creative set, that comes with editable features. It contains large content boxes to add your information on topics like maturity, capability, feasibility, capacity. You can also showcase facts, figures, and other relevant content using this PPT layout. Grab it now.
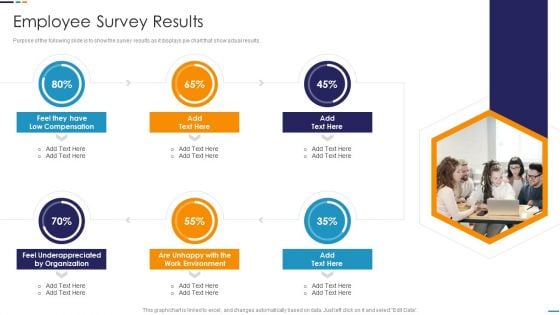
Employee Attrition Rate Management Employee Survey Results Background PDF
This is a Employee Attrition Rate Management Employee Survey Results Background PDF template with various stages. Focus and dispense information on six stages using this creative set, that comes with editable features. It contains large content boxes to add your information on topics like Low Compensation, Underappreciated By Organization, Work Environment, Feel Underappreciated. You can also showcase facts, figures, and other relevant content using this PPT layout. Grab it now.
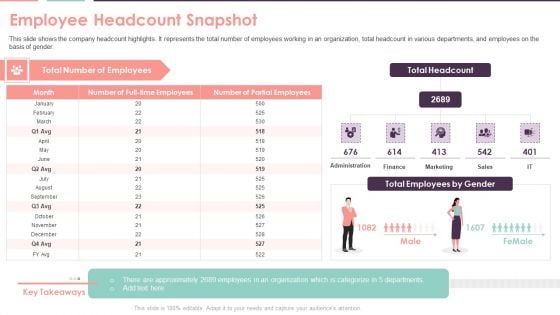
Compensation Survey Sheet Employee Headcount Snapshot Rules PDF
This slide shows the company headcount highlights. It represents the total number of employees working in an organization, total headcount in various departments, and employees on the basis of gender. Deliver and pitch your topic in the best possible manner with this Compensation Survey Sheet Employee Headcount Snapshot Rules PDF. Use them to share invaluable insights on Finance, Marketing, Sales and impress your audience. This template can be altered and modified as per your expectations. So, grab it now.
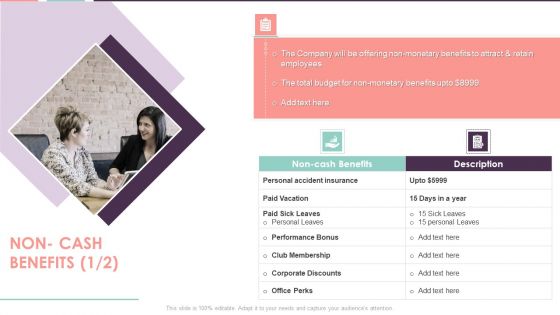
Compensation Survey Sheet Non Cash Benefits Background PDF
Presenting Compensation Survey Sheet Non Cash Benefits Background PDF to provide visual cues and insights. Share and navigate important information on two stages that need your due attention. This template can be used to pitch topics like Personal Accident Insurance, Non Cash Benefits, Performance Bonus. In addtion, this PPT design contains high resolution images, graphics, etc, that are easily editable and available for immediate download.
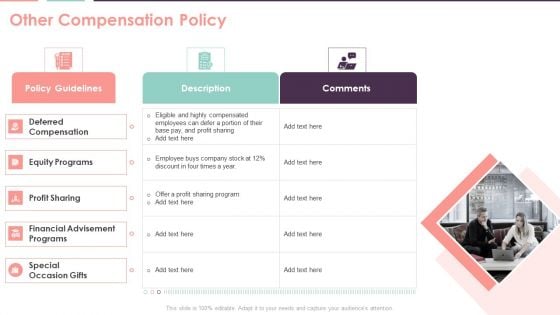
Compensation Survey Sheet Other Compensation Policy Summary PDF
This is a Compensation Survey Sheet Other Compensation Policy Summary PDF template with various stages. Focus and dispense information on three stages using this creative set, that comes with editable features. It contains large content boxes to add your information on topics like Deferred Compensation, Special Occasion Gifts, Equity Programs. You can also showcase facts, figures, and other relevant content using this PPT layout. Grab it now.
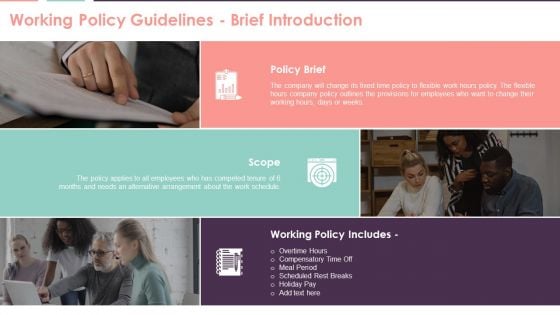
Compensation Survey Sheet Working Policy Guidelines Brief Introduction Formats PDF
Presenting Compensation Survey Sheet Working Policy Guidelines Brief Introduction Formats PDF to provide visual cues and insights. Share and navigate important information on three stages that need your due attention. This template can be used to pitch topics like Policy Brief, Scope, Working Policy Includes. In addtion, this PPT design contains high resolution images, graphics, etc, that are easily editable and available for immediate download.
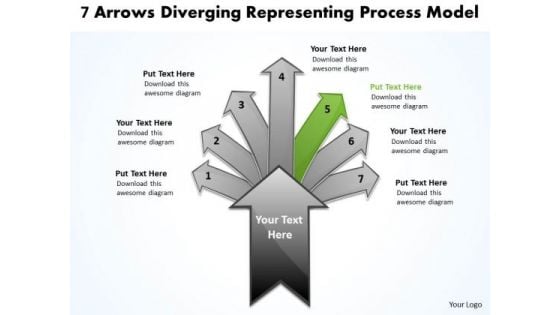
7 Arrows Diverging Representing Process Model Cycle Motion Chart PowerPoint Templates
We present our 7 arrows diverging representing process model Cycle Motion Chart PowerPoint templates.Use our Sale PowerPoint Templates because it illustrates the symbols of human growth. Present our Arrows PowerPoint Templates because you should go for Gold and not just silver. Download our Process and Flows PowerPoint Templates because they will Amplify your thoughts via our appropriate templates. Use our Business PowerPoint Templates because the NASA Space programme took mankind to the moon and so much more. Like them you too can look far beyond normal boundaries. Show them that in your mind the sky is certainly not the limit. Download and present our Shapes PowerPoint Templates because like your thoughts arrows are inherently precise and true.Use these PowerPoint slides for presentations relating to Abstract, Arrow, Art, Artistic, Background, Banner, Boost, Box, Business, Clip Art, Color, Colorful, Concept, Cover, Creative, Decide, Decision, Design, Direction, Finance, Futuristic, Graphic, Icon, Idea, Illustration, Increase, Info, Information, Journey, Label, Modern, Path, Pattern, Pop, Print, Process, Sale, Solution, Statistic, Sticker, Stylish, Template. The prominent colors used in the PowerPoint template are Green, Gray, Black. PowerPoint presentation experts tell us our 7 arrows diverging representing process model Cycle Motion Chart PowerPoint templates are Colorful. People tell us our Banner PowerPoint templates and PPT Slides are Clever. People tell us our 7 arrows diverging representing process model Cycle Motion Chart PowerPoint templates are Ritzy. Presenters tell us our Box PowerPoint templates and PPT Slides are Breathtaking. Customers tell us our 7 arrows diverging representing process model Cycle Motion Chart PowerPoint templates are Elevated. The feedback we get is that our Background PowerPoint templates and PPT Slides are Classic. Let our 7 Arrows Diverging Representing Process Model Cycle Motion Chart PowerPoint Templates figure in your plans. Appreciate the assistance they provide.
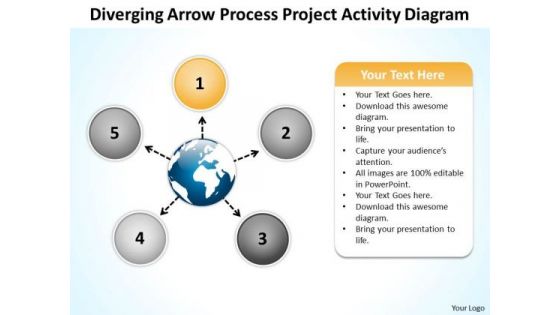
Diverging Arrow Process Project Activity Diagram Ppt Radial Chart PowerPoint Slide
We present our diverging arrow process project activity diagram ppt Radial Chart PowerPoint Slide.Download our Globe PowerPoint Templates because sprout your thoughts into the minds of your colleagues. Present our Circle Charts PowerPoint Templates because your brain is always churning out ideas like cogs in a wheel. Use our Ring Charts PowerPoint Templates because it can bring your ideas to the fore so that all around can know. Dissect each idea to the core and select the best. Download and present our Business PowerPoint Templates because this template can project the path to sucess that you have charted. Use our Marketing PowerPoint Templates because networking is an imperative in todays world. You need to access the views of others. Similarly you need to give access to them of your abilities.Use these PowerPoint slides for presentations relating to Arrow, art, caricature, chart, childish,circular, creative, design, diagram,doodle, draw, flow, graffiti, graphic,grunge, hand, handwritten, icon,illustration, image, isolated, object, pie, pieces, process, raster,report, retro, rough, scribble, segmented, simple, sketch, sketchy, slices,statistic, styling, succeed, success,symbol. The prominent colors used in the PowerPoint template are Gray, Black, White. Professionals tell us our diverging arrow process project activity diagram ppt Radial Chart PowerPoint Slide are Wistful. People tell us our caricature PowerPoint templates and PPT Slides are Wistful. The feedback we get is that our diverging arrow process project activity diagram ppt Radial Chart PowerPoint Slide are Swanky. Presenters tell us our circular PowerPoint templates and PPT Slides will make the presenter look like a pro even if they are not computer savvy. You can be sure our diverging arrow process project activity diagram ppt Radial Chart PowerPoint Slide are Multicolored. PowerPoint presentation experts tell us our circular PowerPoint templates and PPT Slides will help you be quick off the draw. Just enter your specific text and see your points hit home. Bond with the boys with our Diverging Arrow Process Project Activity Diagram Ppt Radial Chart PowerPoint Slide. They enhance espirit-de-corps.
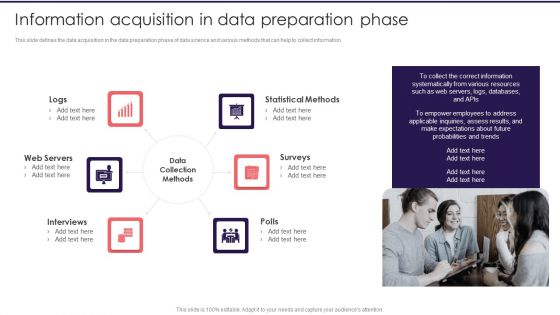
Information Studies Information Acquisition In Data Preparation Phase Topics PDF
This slide defines the data acquisition in the data preparation phase of data science and various methods that can help to collect information. Presenting Information Studies Information Acquisition In Data Preparation Phase Topics PDF to provide visual cues and insights. Share and navigate important information on six stages that need your due attention. This template can be used to pitch topics like Data Collection Methods, Web Servers, Statistical Methods. In addtion, this PPT design contains high resolution images, graphics, etc, that are easily editable and available for immediate download.
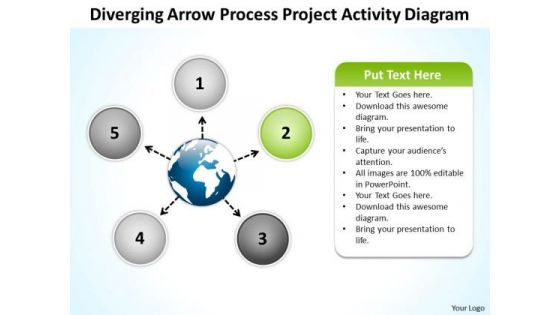
Diverging Arrow Process Project Activity Diagram Circle Radial Chart PowerPoint Slides
We present our diverging arrow process project activity diagram circle Radial Chart PowerPoint Slides.Download and present our Globe PowerPoint Templates because you can Flutter your wings and enchant the world. Impress them with the innate attractiveness of your thoughts and words. Use our Process and Flows PowerPoint Templates because your listeners do not have to put on their thinking caps. Present our Circle Charts PowerPoint Templates because they are Designed to attract the attention of your audience. Present our Ring Charts PowerPoint Templates because it is all there in bits and pieces. Download our Marketing PowerPoint Templates because The marketplace is the merger of your dreams and your ability. Use these PowerPoint slides for presentations relating to Arrow, art, chart, childish,circular, creative, design, diagram,doodle, draw, flow, graffiti, graphic,grunge, hand, handwritten, icon,illustration, image, isolated, object, pie, pieces, process, raster,report, retro, rough, scribble, segmented, simple, sketch, sketchy, slices,statistic, styling, succeed, success,symbol. The prominent colors used in the PowerPoint template are Yellow, Black, Blue. Professionals tell us our diverging arrow process project activity diagram circle Radial Chart PowerPoint Slides effectively help you save your valuable time. People tell us our chart PowerPoint templates and PPT Slides are Upbeat. The feedback we get is that our diverging arrow process project activity diagram circle Radial Chart PowerPoint Slides are Spiffy. Presenters tell us our design PowerPoint templates and PPT Slides are Appealing. You can be sure our diverging arrow process project activity diagram circle Radial Chart PowerPoint Slides are Adorable. PowerPoint presentation experts tell us our creative PowerPoint templates and PPT Slides are Dazzling. Your audience will fawn on you. Our Diverging Arrow Process Project Activity Diagram Circle Radial Chart PowerPoint Slides will certainly capture their fancy.
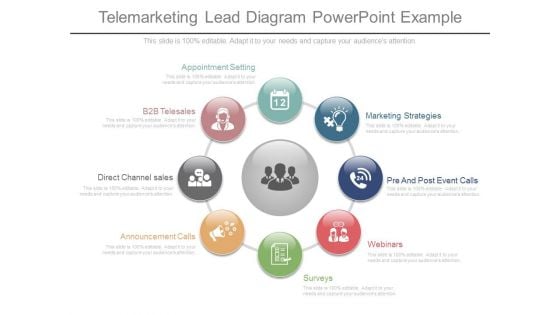
Telemarketing Lead Diagram Powerpoint Example
This is a telemarketing lead diagram powerpoint example. This is a eight stage process. The stages in this process are appointment setting, b2b telesales, direct channel sales, announcement calls, marketing strategies, pre and post event calls, webinars, surveys.
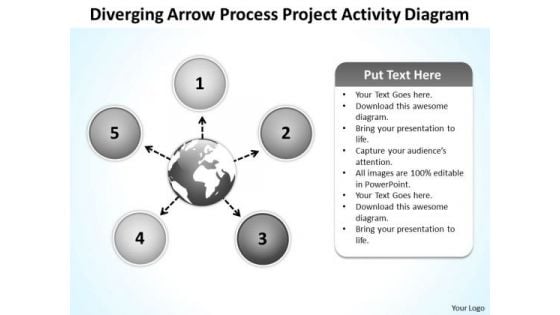
Diverging Arrow Process Project Activity Diagram Ppt Radial Chart PowerPoint Slides
We present our diverging arrow process project activity diagram ppt Radial Chart PowerPoint Slides.Use our Arrows PowerPoint Templates because this slide illustrates your thoughts and experiences to your staff. Present our Flow Charts PowerPoint Templates because there are a bucketful of brilliant ideas swirling around within your group. Present our Process and Flows PowerPoint Templates because Our PowerPoint Templates and Slides will give you great value for your money. Be assured of finding the best projection to highlight your words. Download and present our Business PowerPoint Templates because the fruits of your labour are beginning to show.Enlighten them on the great plans you have for their enjoyment. Use our Shapes PowerPoint Templates because stable ideas are the building blocks of a sucessful structure.Use these PowerPoint slides for presentations relating to Arrow, art, artistic,background, caricature, chart, childish,circular, creative, design, diagram,doodle, draw, flow, graffiti, graphic,grunge, hand, handwritten, icon,illustration, image, isolated, object, pie, pieces, process, raster,report, retro, rough, scribble, segmented, simple, sketch, sketchy, slices,statistic, styling, succeed, success,symbol. The prominent colors used in the PowerPoint template are Blue navy, Black, Gray. Professionals tell us our diverging arrow process project activity diagram ppt Radial Chart PowerPoint Slides are Flirty. People tell us our caricature PowerPoint templates and PPT Slides are Bold. The feedback we get is that our diverging arrow process project activity diagram ppt Radial Chart PowerPoint Slides are Stylish. Presenters tell us our circular PowerPoint templates and PPT Slides are Clever. You can be sure our diverging arrow process project activity diagram ppt Radial Chart PowerPoint Slides are Energetic. PowerPoint presentation experts tell us our creative PowerPoint templates and PPT Slides are Great. Achieve high-growth with our Diverging Arrow Process Project Activity Diagram Ppt Radial Chart PowerPoint Slides. They will make you look good.

Online Food Business Start Up Pre Launch Checklist And Task Status Report Clipart PDF
This slide covers prerequisites of launching a food start up business. It includes various activities along with person responsible, target completion date and activity status report chart. Pitch your topic with ease and precision using this Online Food Business Start Up Pre Launch Checklist And Task Status Report Clipart PDF. This layout presents information on Target Completion, Analyse Successful, Finance, Planning. It is also available for immediate download and adjustment. So, changes can be made in the color, design, graphics or any other component to create a unique layout.
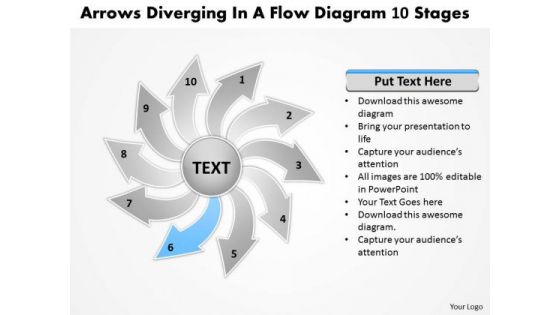
Diverging A Flow Diagram 10 Stages Relative Circular Arrow PowerPoint Slides
We present our diverging a flow diagram 10 stages Relative Circular Arrow PowerPoint Slides.Download our Process and flows PowerPoint Templates because you can asked to strive to give true form to your great dream. Use our Arrows PowerPoint Templates because the plans are in your head, stage by stage, year by year. Present our Flow charts PowerPoint Templates because you have some great folks working with you, thinking with you. Use our Business PowerPoint Templates because infrastructure growth is an obvious requirement of today.inform your group on how exactly this potential is tailor made for you. Use our Signs PowerPoint Templates because in this Slide Various threads are joining up and being stitched together providing necessary strength Now you have to take the last leap.Use these PowerPoint slides for presentations relating to Aound, arrow, business,chart, circle, circular, circulation, color,concept, curving, cycle, diagram,direction, element, financial, flow,flowchart, graphic, icon, illustration,improve, loop, management, measure,motion, movement, part, perspective,plan, presentation, process, recycle,reflection, reflective, repeat, repetitive,ring, rotation, round, shape, step. The prominent colors used in the PowerPoint template are Gray, Black, White. People tell us our diverging a flow diagram 10 stages Relative Circular Arrow PowerPoint Slides are Reminiscent. Professionals tell us our chart PowerPoint templates and PPT Slides are Reminiscent. We assure you our diverging a flow diagram 10 stages Relative Circular Arrow PowerPoint Slides are Gorgeous. PowerPoint presentation experts tell us our concept PowerPoint templates and PPT Slides look good visually. We assure you our diverging a flow diagram 10 stages Relative Circular Arrow PowerPoint Slides are Dazzling. People tell us our concept PowerPoint templates and PPT Slides are Tranquil. Our Diverging A Flow Diagram 10 Stages Relative Circular Arrow PowerPoint Slides believe in fidelity. They will abide by your faith in them.
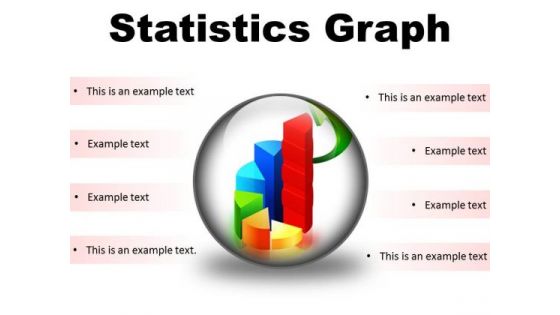
Statistics Graph Business PowerPoint Presentation Slides C
Microsoft Powerpoint Slides and Backgrounds with business statistics in white with a green arrow Exercise creativity with our Statistics Graph Business PowerPoint Presentation Slides C. You will come out on top.
Statistics Graph Business PowerPoint Presentation Slides Cc
Microsoft Powerpoint Slides and Backgrounds with business statistics in white with a green arrow Display your even handedness with our Statistics Graph Business PowerPoint Presentation Slides Cc. Show them that you make fair assessments.
Statistics Graph Business PowerPoint Presentation Slides F
Microsoft Powerpoint Slides and Backgrounds with business statistics in white with a green arrow Double your growth with our Statistics Graph Business PowerPoint Presentation Slides F. Download without worries with our money back guaranteee.
Statistics Graph Business PowerPoint Presentation Slides R
Microsoft Powerpoint Slides and Backgrounds with business statistics in white with a green arrow Motivate teams with our Statistics Graph Business PowerPoint Presentation Slides R. Download without worries with our money back guaranteee.
Statistics Graph Business PowerPoint Presentation Slides S
Microsoft Powerpoint Slides and Backgrounds with business statistics in white with a green arrow Our slides and your story create a beautiful combination with our Statistics Graph Business PowerPoint Presentation Slides S. Dont pass up this opportunity to shine.
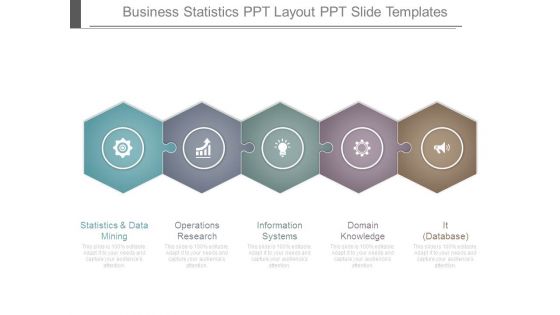
Business Statistics Ppt Layout Ppt Slide Templates
This is a business statistics ppt layout ppt slide templates. This is a five stage process. The stages in this process are statistics and data mining, operations research, information systems, domain knowledge, it database.

Statistical Assessment Example Ppt Background Images
This is a statistical assessment example ppt background images. This is a five stage process. The stages in this process are data element, data field, indexed collection, keved collection, bean collection, statistical assessment.
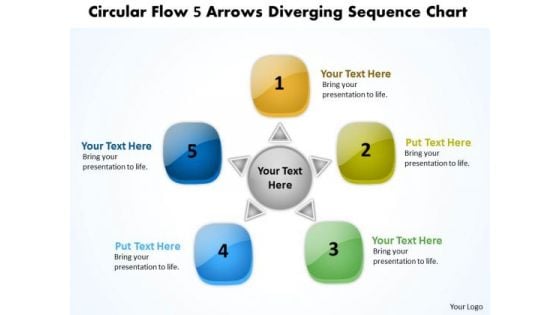
Circular Flow 5 Arrows Diverging Sequence Chart Cycle PowerPoint Slides
We present our circular flow 5 arrows diverging sequence chart Cycle PowerPoint Slides.Download our Boxes PowerPoint Templates because strengthen your relationship with your present customers and likely future ones as the occasion has an intrinsic business potential. Present our Business PowerPoint Templates because a lot of dissimilar elements needing to gel to strike the deal. Present our Arrows PowerPoint Templates because you can Step by step develop the entire picture and project it onto their minds. Present our Circle Charts PowerPoint Templates because you can Amplify your views, ideas and thoughts from very basic aspects to the highly technical and complicated issus using this template as a tool. Download and present our Flow Charts PowerPoint Templates because you can Amplify your views, ideas and thoughts from very basic aspects to the highly technical and complicated issus using this template as a tool.Use these PowerPoint slides for presentations relating to abstract, advertising, arrow, artwork, backdrop, background, banner, brochure, business, button, card, circle, color, concept, corporate, creative, design, form, graphic, histogram, icons, illustration, industrial, infographic, information, label, layout, leaflet, menu, number, options, paper, pattern, pictogram, presentation, product, promotion, symbol, tab, tag, team, teamwork, technology, template, text, vector, version, web, web design, website. The prominent colors used in the PowerPoint template are Green, Blue, Yellow. Presenters tell us our circular flow 5 arrows diverging sequence chart Cycle PowerPoint Slides are Charming. You can be sure our business PowerPoint templates and PPT Slides are Elevated. Professionals tell us our circular flow 5 arrows diverging sequence chart Cycle PowerPoint Slides are Attractive. People tell us our banner PowerPoint templates and PPT Slides are Adorable. People tell us our circular flow 5 arrows diverging sequence chart Cycle PowerPoint Slides are Nice. Professionals tell us our backdrop PowerPoint templates and PPT Slides are Adorable. Lighten your workload with our Circular Flow 5 Arrows Diverging Sequence Chart Cycle PowerPoint Slides. Make sure your presentation gets the attention it deserves.

Ensuring Food Safety Practices To Prevent Contamination Application Of Quality Management For Food Processing Companies Themes PDF
This slide provides information regarding food safety practices and checklist implemented by firm in order to prevent food contamination. Deliver an awe inspiring pitch with this creative ensuring food safety practices to prevent contamination application of quality management for food processing companies themes pdf bundle. Topics like ensuring food safety practices to prevent contamination can be discussed with this completely editable template. It is available for immediate download depending on the needs and requirements of the user.
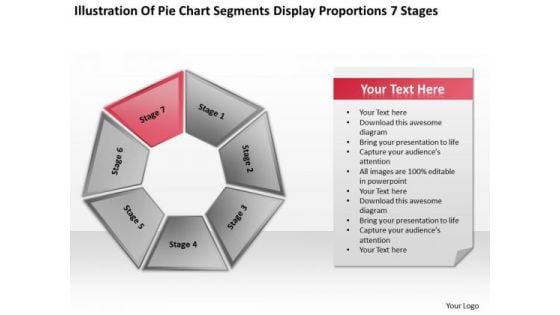
Pie Chart Segments Display Proportions 7 Stages Ppt PowerPoint Slides
We present our pie chart segments display proportions 7 stages ppt PowerPoint Slides.Present our Business PowerPoint Templates because Our PowerPoint Templates and Slides offer you the needful to organise your thoughts. Use them to list out your views in a logical sequence. Download and present our Marketing PowerPoint Templates because You canTake a leap off the starting blocks with our PowerPoint Templates and Slides. They will put you ahead of the competition in quick time. Present our Process and Flows PowerPoint Templates because Our PowerPoint Templates and Slides offer you the needful to organise your thoughts. Use them to list out your views in a logical sequence. Download our Flow Charts PowerPoint Templates because Our PowerPoint Templates and Slides has conjured up a web of all you need with the help of our great team. Use them to string together your glistening ideas. Download our Circle Charts PowerPoint Templates because Our PowerPoint Templates and Slides team portray an attitude of elegance. Personify this quality by using them regularly.Use these PowerPoint slides for presentations relating to Process, abstract, multicolored, market, website, network, cross, statistics, model, document, business, plan, presentation,diagram, circle, data, marketing, management, chart, sphere, options, function, shiny, direction, piechart,design, company, navigation,financial, structure, multiple, button, steps, seven, flow. The prominent colors used in the PowerPoint template are Red, White, Gray. Get fascinated by our Pie Chart Segments Display Proportions 7 Stages Ppt PowerPoint Slides. They will keep attracting your attention.
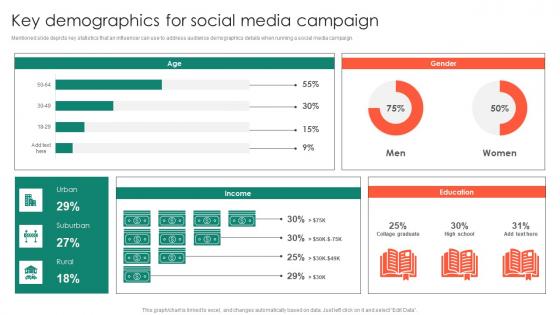
Key Demographics For Social Media Entrepreneurs Roadmap To Effective Graphics Pdf
Mentioned slide depicts key statistics that an influencer can use to address audience demographics details when running a social media campaign. Are you searching for a Key Demographics For Social Media Entrepreneurs Roadmap To Effective Graphics Pdf that is uncluttered, straightforward, and original Its easy to edit, and you can change the colors to suit your personal or business branding. For a presentation that expresses how much effort you have put in, this template is ideal. With all of its features, including tables, diagrams, statistics, and lists, its perfect for a business plan presentation. Make your ideas more appealing with these professional slides. Download Key Demographics For Social Media Entrepreneurs Roadmap To Effective Graphics Pdf from Slidegeeks today. Mentioned slide depicts key statistics that an influencer can use to address audience demographics details when running a social media campaign.
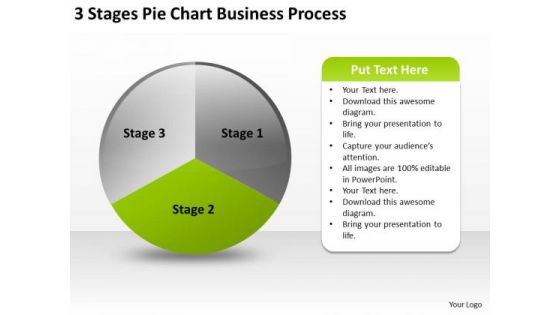
Pie Chart Business PowerPoint Theme Process Plan Slides
We present our pie chart business powerpoint theme process plan Slides.Download our Circle Charts PowerPoint Templates because Our PowerPoint Templates and Slides will give you great value for your money. Be assured of finding the best projection to highlight your words. Use our Process and Flows PowerPoint Templates because Our PowerPoint Templates and Slides will provide weight to your words. They will bring out the depth of your thought process. Present our Flow Charts PowerPoint Templates because You have gained great respect for your brilliant ideas. Use our PowerPoint Templates and Slides to strengthen and enhance your reputation. Download and present our Business PowerPoint Templates because Our PowerPoint Templates and Slides will fulfill your every need. Use them and effectively satisfy the desires of your audience. Download our Shapes PowerPoint Templates because Our PowerPoint Templates and Slides will embellish your thoughts. See them provide the desired motivation to your team.Use these PowerPoint slides for presentations relating to Abstract, background, banner, blue, bright, business, chart, circle, color, concept, conceptual, corporate, creative, cycle, design,different, element, empty, form, frame, graphic, group, idea, illustration, match, message, order, part, piece, place, process, red, shape, solution, special,speech, strategy, symbol, template, text, usable, web, website. The prominent colors used in the PowerPoint template are Green, Gray, White. Advise against fatalism with our Pie Chart Business PowerPoint Theme Process Plan Slides. Urge your audience to excercise control.
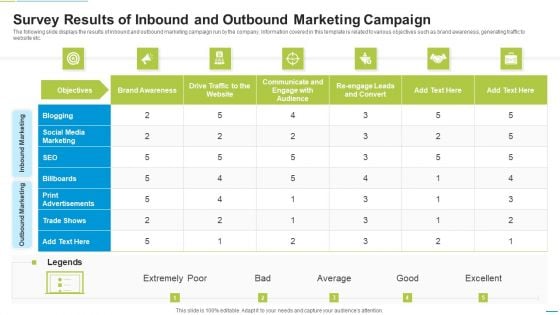
Survey Results Of Inbound And Outbound Marketing Campaign Clipart PDF
The following slide displays the results of inbound and outbound marketing campaign run by the company. Information covered in this template is related to various objectives such as brand awareness, generating traffic to website etc. Pitch your topic with ease and precision using this Survey Results Of Inbound And Outbound Marketing Campaign Clipart PDF. This layout presents information on Billboards, Print Advertisements, Blogging. It is also available for immediate download and adjustment. So, changes can be made in the color, design, graphics or any other component to create a unique layout.
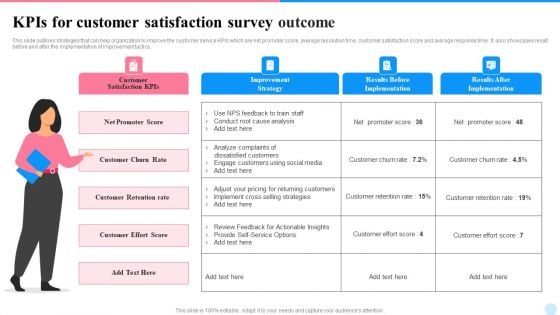
Kpis For Customer Satisfaction Survey Outcome Formats PDF
This slide outlines strategies that can help organization to improve the customer service KPIs which are net promoter score, average resolution time, customer satisfaction score and average response time . It also showcases result before and after the implementation of improvement tactics. Persuade your audience using this Kpis For Customer Satisfaction Survey Outcome Formats PDF. This PPT design covers four stages, thus making it a great tool to use. It also caters to a variety of topics including Improvement Strategy, Results Before Implementation, Results After Implementation. Download this PPT design now to present a convincing pitch that not only emphasizes the topic but also showcases your presentation skills.
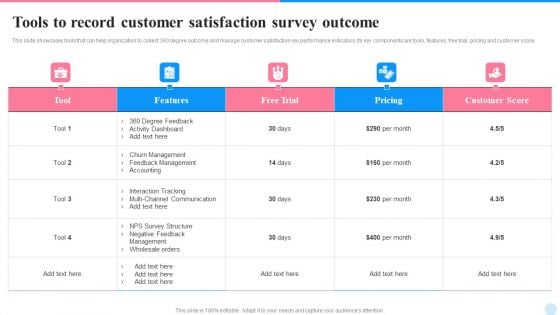
Tools To Record Customer Satisfaction Survey Outcome Brochure PDF
This slide showcases tools that can help organization to collect 360 degree outcome and manage customer satisfaction key performance indicators. Its key components are tools, features, free trial, pricing and customer score. Pitch your topic with ease and precision using this Tools To Record Customer Satisfaction Survey Outcome Brochure PDF. This layout presents information on Churn Management, Pricing, Customer Score. It is also available for immediate download and adjustment. So, changes can be made in the color, design, graphics or any other component to create a unique layout.
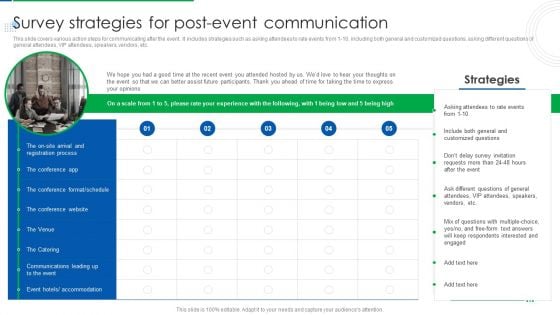
Company Event Communication Survey Strategies For Postevent Communication Inspiration PDF
This slide covers various action steps for communicating after the event. It includes strategies such as asking attendees to rate events from 1-10, including both general and customized questions, asking different questions of general attendees, VIP attendees, speakers, vendors, etc. Make sure to capture your audiences attention in your business displays with our gratis customizable Company Event Communication Survey Strategies For Postevent Communication Inspiration PDF. These are great for business strategies, office conferences, capital raising or task suggestions. If you desire to acquire more customers for your tech business and ensure they stay satisfied, create your own sales presentation with these plain slides.
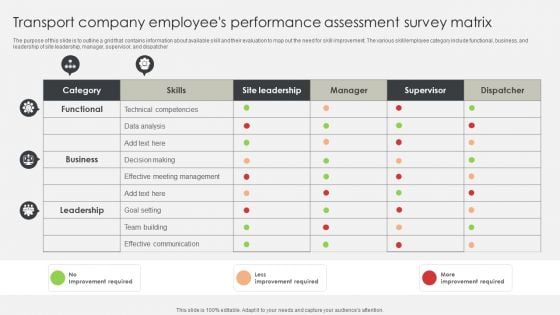
Transport Company Employees Performance Assessment Survey Matrix Graphics PDF
The purpose of this slide is to outline a grid that contains information about available skill and their evaluation to map out the need for skill improvement. The various skill or employee category include functional, business, and leadership of site leadership, manager, supervisor, and dispatcher. Showcasing this set of slides titled Transport Company Employees Performance Assessment Survey Matrix Graphics PDF. The topics addressed in these templates are Business, Technical Competencies, Data Analysis. All the content presented in this PPT design is completely editable. Download it and make adjustments in color, background, font etc. as per your unique business setting.

Key Questions For After Event Survey Brochure PDF
The slide showcases the key types of questions to include in post event survey to optimize the post event strategy. It covers key questions, measuring criteria and example. Persuade your audience using this Pre During And After Event Marketing Best Practices For Social Media Download PDF. This PPT design covers our stages, thus making it a great tool to use. It also caters to a variety of topics including Key Questions, Measuring Criteria, Example. Download this PPT design now to present a convincing pitch that not only emphasizes the topic but also showcases your presentation skills.
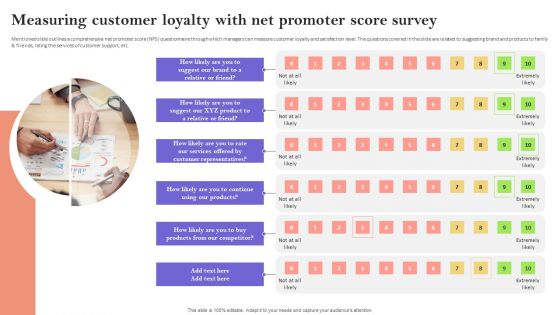
Measuring Customer Loyalty With Net Promoter Score Survey Elements PDF
Mentioned slide outlines a comprehensive net promoter score NPS questionnaire through which managers can measure customer loyalty and satisfaction level. The questions covered in the slide are related to suggesting brand and products to family and friends, rating the services of customer support, etc. The best PPT templates are a great way to save time, energy, and resources. Slidegeeks have 100 percent editable powerpoint slides making them incredibly versatile. With these quality presentation templates, you can create a captivating and memorable presentation by combining visually appealing slides and effectively communicating your message. Download Measuring Customer Loyalty With Net Promoter Score Survey Elements PDF from Slidegeeks and deliver a wonderful presentation.
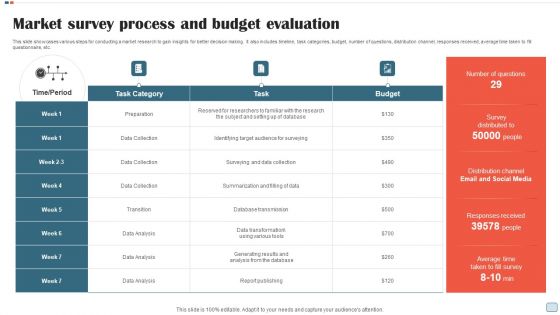
Market Survey Process And Budget Evaluation Inspiration PDF
This slide showcases various steps for conducting a market research to gain insights for better decision making. It also includes timeline, task categories, budget, number of questions, distribution channel, responses received, average time taken to fill questionnaire, etc. Showcasing this set of slides titled Market Survey Process And Budget Evaluation Inspiration PDF. The topics addressed in these templates are Database, Report Publishing, Data Collection, Data Analysis. All the content presented in this PPT design is completely editable. Download it and make adjustments in color, background, font etc. as per your unique business setting.
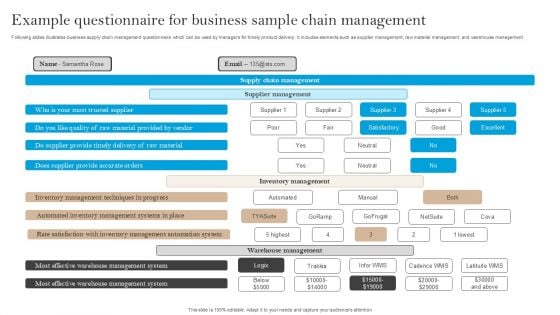
Example Questionnaire For Business Sample Chain Management Survey SS
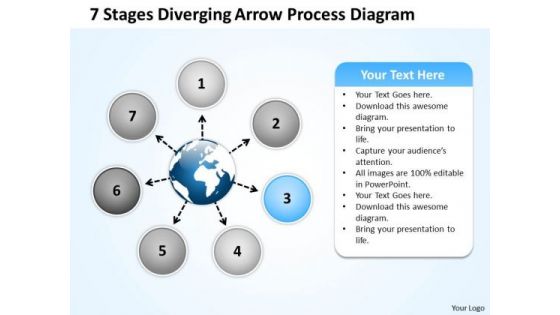
Diverging Arrow Process Diagram Relative Circular Flow PowerPoint Templates
We present our diverging arrow process diagram Relative Circular Flow PowerPoint templates.Present our Circle Charts PowerPoint Templates because this slide brings grey areas to the table and explain in detail you assessment of the need for care to ensure continued smooth progress. Download and present our Globe PowerPoint Templates because you can see In any endeavour people matter most. Present our Process and Flows PowerPoint Templates because this slide depicts the occasion for gifting and giving. Download and present our Flow Charts PowerPoint Templates because you can Organize your thoughts and illuminate your ideas accordingly. Use our Business PowerPoint Templates because you can Lead your flock steadily to greater heights. Look around at the vast potential of achievement around you.Use these PowerPoint slides for presentations relating to Arrow, art, artistic,background, caricature, chart, childish,circular, creative, design, diagram,doodle, draw, flow, graffiti, graphic,grunge, hand, handwritten, icon,illustration, image, isolated, object, pie, pieces, process, raster,report, retro, rough, scribble, segmented, simple, sketch, sketchy, slices,statistic, styling, succeed, success,symbol. The prominent colors used in the PowerPoint template are Green, Black, Blue. Professionals tell us our diverging arrow process diagram Relative Circular Flow PowerPoint templates look good visually. People tell us our chart PowerPoint templates and PPT Slides are second to none. The feedback we get is that our diverging arrow process diagram Relative Circular Flow PowerPoint templates are Wonderful. Presenters tell us our caricature PowerPoint templates and PPT Slides provide great value for your money. Be assured of finding the best projection to highlight your words. You can be sure our diverging arrow process diagram Relative Circular Flow PowerPoint templates are Lush. PowerPoint presentation experts tell us our artistic PowerPoint templates and PPT Slides are Attractive. Exult in the happiness of your performance. Convey your emotions through our Diverging Arrow Process Diagram Relative Circular Flow PowerPoint Templates.
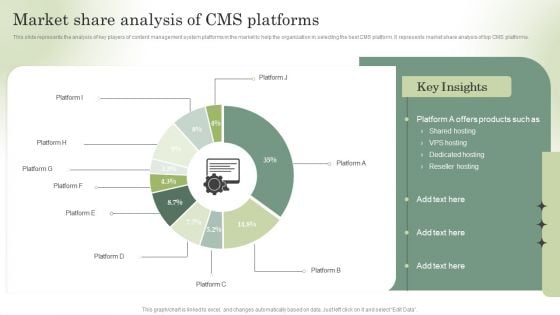
Optimizing Online Stores Market Share Analysis Of Cms Platforms Formats PDF
This slide represents the analysis of key players of content management system platforms in the market to help the organization in selecting the best CMS platform. It represents market share analysis of top CMS platforms. Are you searching for a Optimizing Online Stores Market Share Analysis Of Cms Platforms Formats PDF that is uncluttered, straightforward, and original Its easy to edit, and you can change the colors to suit your personal or business branding. For a presentation that expresses how much effort youve put in, this template is ideal With all of its features, including tables, diagrams, statistics, and lists, its perfect for a business plan presentation. Make your ideas more appealing with these professional slides. Download Optimizing Online Stores Market Share Analysis Of Cms Platforms Formats PDF from Slidegeeks today.
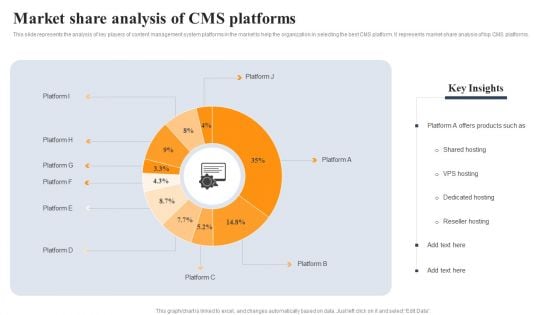
Implementing An Effective Ecommerce Management Framework Market Share Analysis Of CMS Platforms Inspiration PDF
This slide represents the analysis of key players of content management system platforms in the market to help the organization in selecting the best CMS platform. It represents market share analysis of top CMS platforms. Are you searching for a Implementing An Effective Ecommerce Management Framework Market Share Analysis Of CMS Platforms Inspiration PDF that is uncluttered, straightforward, and original Its easy to edit, and you can change the colors to suit your personal or business branding. For a presentation that expresses how much effort youve put in, this template is ideal With all of its features, including tables, diagrams, statistics, and lists, its perfect for a business plan presentation. Make your ideas more appealing with these professional slides. Download Implementing An Effective Ecommerce Management Framework Market Share Analysis Of CMS Platforms Inspiration PDF from Slidegeeks today.


 Continue with Email

 Home
Home


