Checkmark Icon
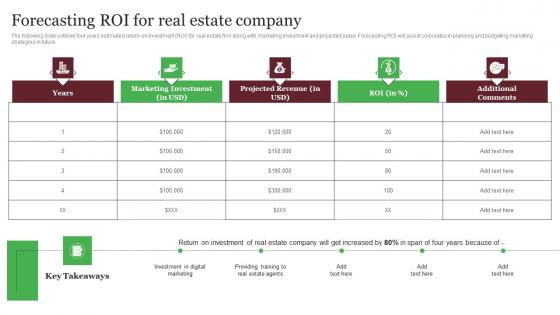
Forecasting Roi For Real Estate Company Out Of The Box Real Download Pdf
The following slide outlines four years estimated return-on-investment ROI for real estate firm along with marketing investment and projected sales. Forecasting ROI will assist corporates in planning and budgeting marketing strategies in future. Are you in need of a template that can accommodate all of your creative concepts This one is crafted professionally and can be altered to fit any style. Use it with Google Slides or PowerPoint. Include striking photographs, symbols, depictions, and other visuals. Fill, move around, or remove text boxes as desired. Test out color palettes and font mixtures. Edit and save your work, or work with colleagues. Download Forecasting Roi For Real Estate Company Out Of The Box Real Download Pdf and observe how to make your presentation outstanding. Give an impeccable presentation to your group and make your presentation unforgettable. The following slide outlines four years estimated return-on-investment ROI for real estate firm along with marketing investment and projected sales. Forecasting ROI will assist corporates in planning and budgeting marketing strategies in future.
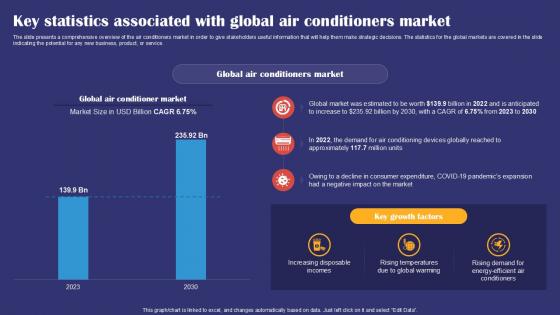
Key Statistics Associated With Global Air Conditioners Market Smartphones Industry Report PPT Sample IR SS V
The slide presents a comprehensive overview of the air conditioners market in order to give stakeholders useful information that will help them make strategic decisions. The statistics for the global markets are covered in the slide indicating the potential for any new business, product, or service. Whether you have daily or monthly meetings, a brilliant presentation is necessary. Key Statistics Associated With Global Air Conditioners Market Smartphones Industry Report PPT Sample IR SS V can be your best option for delivering a presentation. Represent everything in detail using Key Statistics Associated With Global Air Conditioners Market Smartphones Industry Report PPT Sample IR SS V and make yourself stand out in meetings. The template is versatile and follows a structure that will cater to your requirements. All the templates prepared by Slidegeeks are easy to download and edit. Our research experts have taken care of the corporate themes as well. So, give it a try and see the results. The slide presents a comprehensive overview of the air conditioners market in order to give stakeholders useful information that will help them make strategic decisions. The statistics for the global markets are covered in the slide indicating the potential for any new business, product, or service.
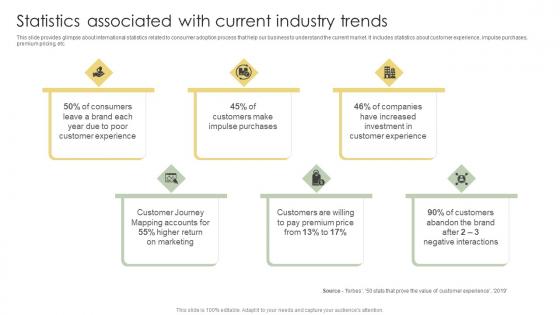
Statistics Associated With Current Industry Trends Analyzing Customer Adoption Journey Themes Pdf
This slide provides glimpse about international statistics related to consumer adoption process that help our business to understand the current market. It includes statistics about customer experience, impulse purchases, premium pricing, etc.Explore a selection of the finest Statistics Associated With Current Industry Trends Analyzing Customer Adoption Journey Themes Pdf here. With a plethora of professionally designed and pre-made slide templates, you can quickly and easily find the right one for your upcoming presentation. You can use our Statistics Associated With Current Industry Trends Analyzing Customer Adoption Journey Themes Pdf to effectively convey your message to a wider audience. Slidegeeks has done a lot of research before preparing these presentation templates. The content can be personalized and the slides are highly editable. Grab templates today from Slidegeeks. This slide provides glimpse about international statistics related to consumer adoption process that help our business to understand the current market. It includes statistics about customer experience, impulse purchases, premium pricing, etc.
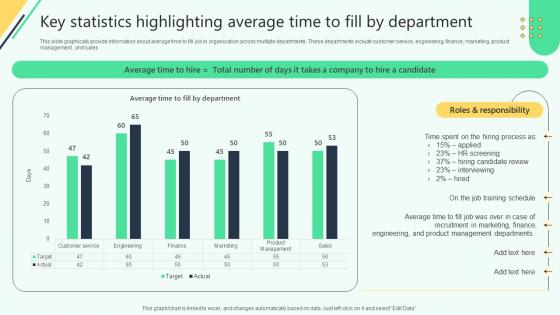
Key Statistics Highlighting Average Time To Fill By Analysing Hr Data For Effective Decision Making
This slide graphically provide information about average time to fill job in organisation across multiple departments. These departments include customer service, engineering, finance, marketing, product management , and sales Do you know about Slidesgeeks Key Statistics Highlighting Average Time To Fill By Analysing Hr Data For Effective Decision Making These are perfect for delivering any kind od presentation. Using it, create PowerPoint presentations that communicate your ideas and engage audiences. Save time and effort by using our pre-designed presentation templates that are perfect for a wide range of topic. Our vast selection of designs covers a range of styles, from creative to business, and are all highly customizable and easy to edit. Download as a PowerPoint template or use them as Google Slides themes. This slide graphically provide information about average time to fill job in organisation across multiple departments. These departments include customer service, engineering, finance, marketing, product management , and sales
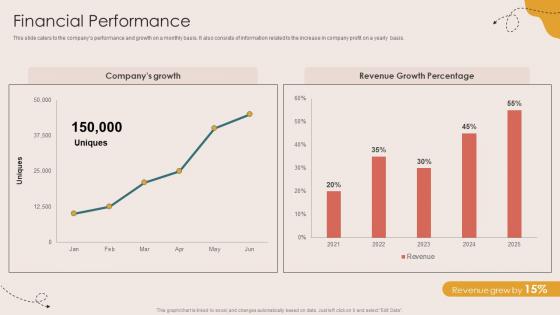
Financial Performance Children Events Listing Investor Funding Elevator Pitch Deck
This slide caters to the companys performance and growth on a monthly basis. It also consists of information related to the increase in company profit on a yearly basis. Present like a pro with Financial Performance Children Events Listing Investor Funding Elevator Pitch Deck. Create beautiful presentations together with your team, using our easy-to-use presentation slides. Share your ideas in real-time and make changes on the fly by downloading our templates. So whether you are in the office, on the go, or in a remote location, you can stay in sync with your team and present your ideas with confidence. With Slidegeeks presentation got a whole lot easier. Grab these presentations today. This slide caters to the companys performance and growth on a monthly basis. It also consists of information related to the increase in company profit on a yearly basis.
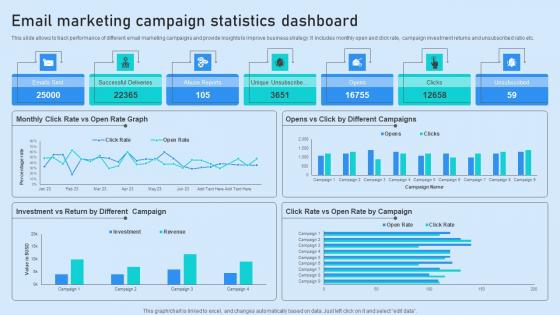
Email Marketing Campaign Statistics Dashboard Introduction Pdf
This slide allows to track performance of different email marketing campaigns and provide insights to improve business strategy. It includes monthly open and click rate, campaign investment returns and unsubscribed ratio etc. Showcasing this set of slides titled Email Marketing Campaign Statistics Dashboard Introduction Pdf. The topics addressed in these templates are Successful Deliveries, Abuse Reports, Unique Unsubscribe. All the content presented in this PPT design is completely editable. Download it and make adjustments in color, background, font etc. as per your unique business setting. This slide allows to track performance of different email marketing campaigns and provide insights to improve business strategy. It includes monthly open and click rate, campaign investment returns and unsubscribed ratio etc.
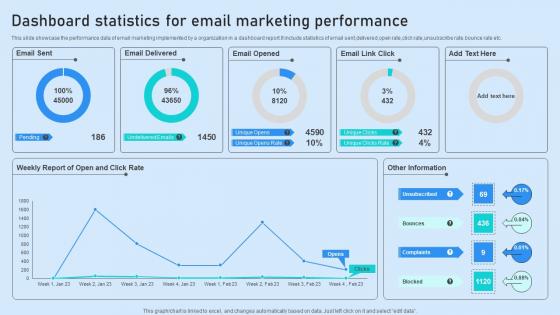
Dashboard Statistics For Email Marketing Performance Guidelines Pdf
This slide showcase the performance data of email marketing implemented by a organization in a dashboard report.It include statistics of email sent,delivered,open rate,click rate,unsubscribe rate,bounce rate etc. Showcasing this set of slides titled Dashboard Statistics For Email Marketing Performance Guidelines Pdf. The topics addressed in these templates are Email Delivered, Email Opened, Performance. All the content presented in this PPT design is completely editable. Download it and make adjustments in color, background, font etc. as per your unique business setting. This slide showcase the performance data of email marketing implemented by a organization in a dashboard report.It include statistics of email sent,delivered,open rate,click rate,unsubscribe rate,bounce rate etc.
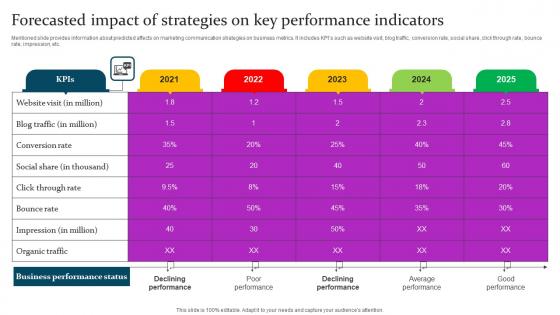
Forecasted Impact Of Strategies Marketing Mix Communication Guide Client Guidelines Pdf
Mentioned slide provides information about predicted affects on marketing communication strategies on business metrics. It includes KPIs such as website visit, blog traffic, conversion rate, social share, click through rate, bounce rate, impression, etc. Present like a pro with Forecasted Impact Of Strategies Marketing Mix Communication Guide Client Guidelines Pdf Create beautiful presentations together with your team, using our easy to use presentation slides. Share your ideas in real time and make changes on the fly by downloading our templates. So whether you are in the office, on the go, or in a remote location, you can stay in sync with your team and present your ideas with confidence. With Slidegeeks presentation got a whole lot easier. Grab these presentations today. Mentioned slide provides information about predicted affects on marketing communication strategies on business metrics. It includes KPIs such as website visit, blog traffic, conversion rate, social share, click through rate, bounce rate, impression, etc.
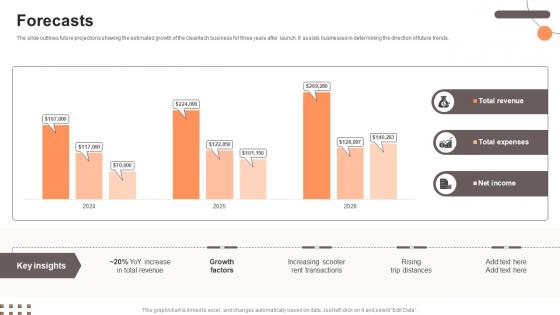
Forecasts Electric Scooter Rental Go To Market Strategy GTM SS V
The slide outlines future projections showing the estimated growth of the smart home automation business for five years after launch. It assists businesses in determining the direction of future trends.Coming up with a presentation necessitates that the majority of the effort goes into the content and the message you intend to convey. The visuals of a PowerPoint presentation can only be effective if it supplements and supports the story that is being told. Keeping this in mind our experts created Forecasts Electric Scooter Rental Go To Market Strategy GTM SS V to reduce the time that goes into designing the presentation. This way, you can concentrate on the message while our designers take care of providing you with the right template for the situation. The slide outlines future projections showing the estimated growth of the smart home automation business for five years after launch. It assists businesses in determining the direction of future trends.
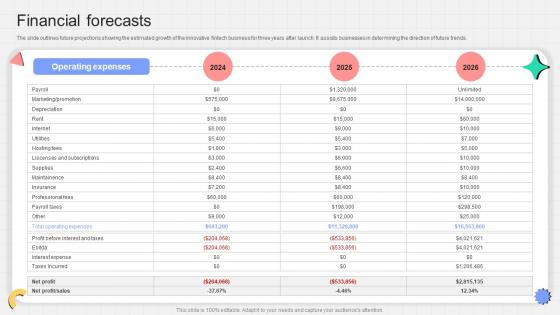
Financial Forecasts P2p Payment Startup Go To Market Strategy GTM SS V
The slide outlines future projections showing the estimated growth of the innovative fintech business for three years after launch. It assists businesses in determining the direction of future trends.Present like a pro with Financial Forecasts P2p Payment Startup Go To Market Strategy GTM SS V. Create beautiful presentations together with your team, using our easy-to-use presentation slides. Share your ideas in real-time and make changes on the fly by downloading our templates. So whether you are in the office, on the go, or in a remote location, you can stay in sync with your team and present your ideas with confidence. With Slidegeeks presentation got a whole lot easier. Grab these presentations today. The slide outlines future projections showing the estimated growth of the innovative fintech business for three years after launch. It assists businesses in determining the direction of future trends.
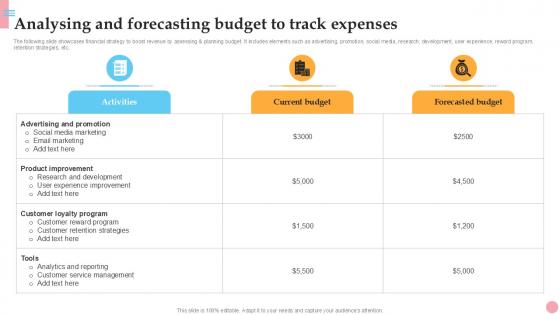
Analysing And Forecasting Budget How To Improve Company PPT Slide Strategy SS V
The following slide showcases financial strategy to boost revenue by assessing and planning budget. It includes elements such as advertising, promotion, social media, research, development, user experience, reward program, retention strategies, etc. Want to ace your presentation in front of a live audience Our Analysing And Forecasting Budget How To Improve Company PPT Slide Strategy SS V can help you do that by engaging all the users towards you. Slidegeeks experts have put their efforts and expertise into creating these impeccable powerpoint presentations so that you can communicate your ideas clearly. Moreover, all the templates are customizable, and easy-to-edit and downloadable. Use these for both personal and commercial use. The following slide showcases financial strategy to boost revenue by assessing and planning budget. It includes elements such as advertising, promotion, social media, research, development, user experience, reward program, retention strategies, etc.
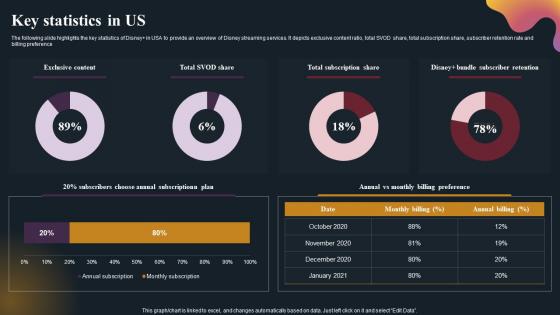
Key Statistics In Us OTT Platform Company Outline Brochure Pdf
The following slide highlights the key statistics of DisneyPlus in USA to provide an overview of Disney streaming services. It depicts exclusive content ratio, total SVOD share, total subscription share, subscriber retention rate and billing preference. Crafting an eye-catching presentation has never been more straightforward. Let your presentation shine with this tasteful yet straightforward Key Statistics In Us OTT Platform Company Outline Brochure Pdf template. It offers a minimalistic and classy look that is great for making a statement. The colors have been employed intelligently to add a bit of playfulness while still remaining professional. Construct the ideal Key Statistics In Us OTT Platform Company Outline Brochure Pdf that effortlessly grabs the attention of your audience Begin now and be certain to wow your customers The following slide highlights the key statistics of DisneyPlus in USA to provide an overview of Disney streaming services. It depicts exclusive content ratio, total SVOD share, total subscription share, subscriber retention rate and billing preference
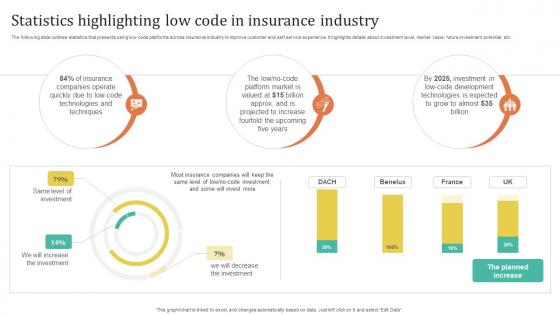
Improving Customer Satisfaction Statistics Highlighting Low Code In Insurance Industry
The following slide outlines statistics that presents using low code platforms across insurance industry to improve customer and self service experience. It highlights details about investment level, market value, future investment potential, etc. Find highly impressive Improving Customer Satisfaction Statistics Highlighting Low Code In Insurance Industry on Slidegeeks to deliver a meaningful presentation. You can save an ample amount of time using these presentation templates. No need to worry to prepare everything from scratch because Slidegeeks experts have already done a huge research and work for you. You need to download Improving Customer Satisfaction Statistics Highlighting Low Code In Insurance Industry for your upcoming presentation. All the presentation templates are 100 percent editable and you can change the color and personalize the content accordingly. Download now The following slide outlines statistics that presents using low code platforms across insurance industry to improve customer and self service experience. It highlights details about investment level, market value, future investment potential, etc.
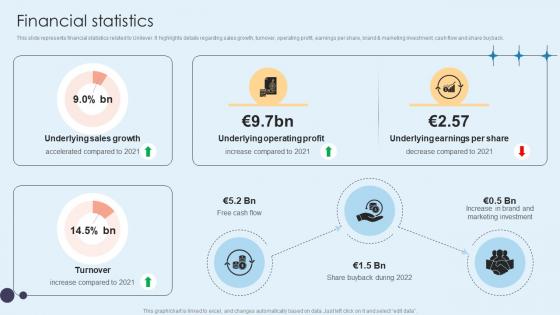
Financial Statistics Home Care Solutions Company Profile CP SS V
This slide represents financial statistics related to Unilever. It highlights details regarding sales growth, turnover, operating profit, earnings per share, brand and marketing investment, cash flow and share buyback.Formulating a presentation can take up a lot of effort and time, so the content and message should always be the primary focus. The visuals of the PowerPoint can enhance the presenters message, so our Financial Statistics Home Care Solutions Company Profile CP SS V was created to help save time. Instead of worrying about the design, the presenter can concentrate on the message while our designers work on creating the ideal templates for whatever situation is needed. Slidegeeks has experts for everything from amazing designs to valuable content, we have put everything into Financial Statistics Home Care Solutions Company Profile CP SS V. This slide represents financial statistics related to Unilever. It highlights details regarding sales growth, turnover, operating profit, earnings per share, brand and marketing investment, cash flow and share buyback.
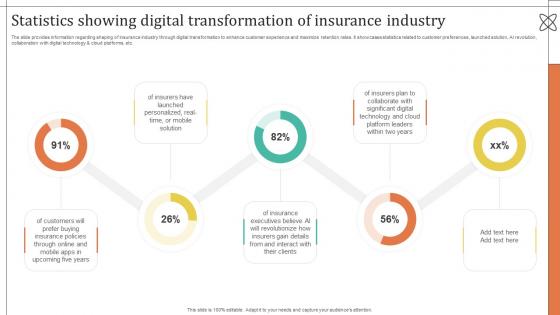
Improving Customer Satisfaction Statistics Showing Digital Transformation Of Insurance
The slide provides information regarding shaping of insurance industry through digital transformation to enhance customer experience and maximize retention rates. It showcases statistics related to customer preferences, launched solution, AI revolution, collaboration with digital technology and cloud platforms, etc. If you are looking for a format to display your unique thoughts, then the professionally designed Improving Customer Satisfaction Statistics Showing Digital Transformation Of Insurance is the one for you. You can use it as a Google Slides template or a PowerPoint template. Incorporate impressive visuals, symbols, images, and other charts. Modify or reorganize the text boxes as you desire. Experiment with shade schemes and font pairings. Alter, share or cooperate with other people on your work. Download Improving Customer Satisfaction Statistics Showing Digital Transformation Of Insurance and find out how to give a successful presentation. Present a perfect display to your team and make your presentation unforgettable. The slide provides information regarding shaping of insurance industry through digital transformation to enhance customer experience and maximize retention rates. It showcases statistics related to customer preferences, launched solution, AI revolution, collaboration with digital technology and cloud platforms, etc.
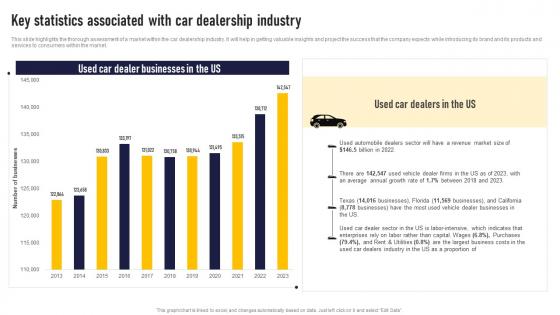
Key Statistics Associated With Car Dealership Industry Auto Dealership Business Plan Mockup Pdf
This slide highlights the thorough assessment of a market within the car dealership industry. It will help in getting valuable insights and project the success that the company expects while introducing its brand and its products and services to consumers within the market. Whether you have daily or monthly meetings, a brilliant presentation is necessary. Key Statistics Associated With Car Dealership Industry Auto Dealership Business Plan Mockup Pdf can be your best option for delivering a presentation. Represent everything in detail using Key Statistics Associated With Car Dealership Industry Auto Dealership Business Plan Mockup Pdf and make yourself stand out in meetings. The template is versatile and follows a structure that will cater to your requirements. All the templates prepared by Slidegeeks are easy to download and edit. Our research experts have taken care of the corporate themes as well. So, give it a try and see the results. This slide highlights the thorough assessment of a market within the car dealership industry. It will help in getting valuable insights and project the success that the company expects while introducing its brand and its products and services to consumers within the market.
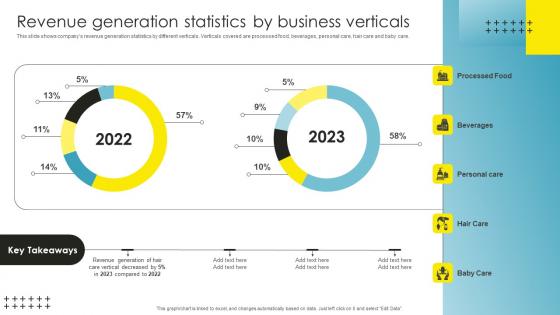
Revenue Generation Statistics Strategic Brand Management Background Pdf
This slide shows companys revenue generation statistics by different verticals. Verticals covered are processed food, beverages, personal care, hair care and baby care. Coming up with a presentation necessitates that the majority of the effort goes into the content and the message you intend to convey. The visuals of a PowerPoint presentation can only be effective if it supplements and supports the story that is being told. Keeping this in mind our experts created Revenue Generation Statistics Strategic Brand Management Background Pdf to reduce the time that goes into designing the presentation. This way, you can concentrate on the message while our designers take care of providing you with the right template for the situation. This slide shows companys revenue generation statistics by different verticals. Verticals covered are processed food, beverages, personal care, hair care and baby care.
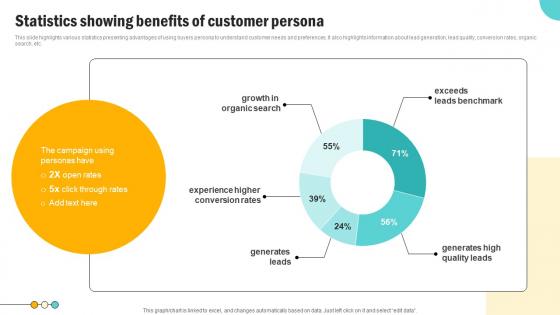
Statistics Showing Benefits Of Consumer Persona Development Strategy Pictures Pdf
This slide highlights various statistics presenting advantages of using buyers persona to understand customer needs and preferences. It also highlights information about lead generation, lead quality, conversion rates, organic search, etc. If your project calls for a presentation, then Slidegeeks is your go to partner because we have professionally designed, easy to edit templates that are perfect for any presentation. After downloading, you can easily edit Statistics Showing Benefits Of Consumer Persona Development Strategy Pictures Pdf and make the changes accordingly. You can rearrange slides or fill them with different images. Check out all the handy templates This slide highlights various statistics presenting advantages of using buyers persona to understand customer needs and preferences. It also highlights information about lead generation, lead quality, conversion rates, organic search, etc.
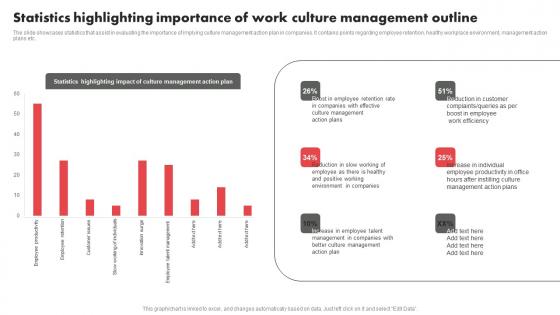
Statistics Highlighting Importance Of Work Culture Management Outline Elements Pdf
The slide showcases statistics that assist in evaluating the importance of implying culture management action plan in companies. It contains points regarding employee retention, healthy workplace environment, management action plans etc. Showcasing this set of slides titled Statistics Highlighting Importance Of Work Culture Management Outline Elements Pdf. The topics addressed in these templates are Culture Management, Reduction In Customer, Environment In Companies. All the content presented in this PPT design is completely editable. Download it and make adjustments in color, background, font etc. as per your unique business setting. The slide showcases statistics that assist in evaluating the importance of implying culture management action plan in companies. It contains points regarding employee retention, healthy workplace environment, management action plans etc.
Statistics For Tracking Policy Administration Activities Brochure Pdf
Following slide showcases statistics highlighting policy management activities by priority percentage which can be used by businesses to enhance organisation performance. It includes activities such as policy communication, compliance training, risk assessment, third party due diligence, etc. Pitch your topic with ease and precision using this Statistics For Tracking Policy Administration Activities Brochure Pdf. This layout presents information on Policy Communication, Compliance Training, Risk Assessment. It is also available for immediate download and adjustment. So, changes can be made in the color, design, graphics or any other component to create a unique layout. Following slide showcases statistics highlighting policy management activities by priority percentage which can be used by businesses to enhance organisation performance. It includes activities such as policy communication, compliance training, risk assessment, third party due diligence, etc.
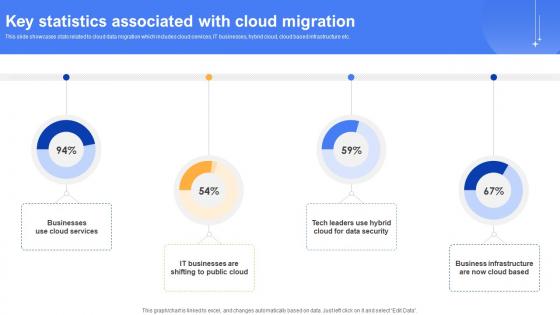
Effective Data Migration Key Statistics Associated With Cloud Migration
This slide showcases stats related to cloud data migration which includes cloud services, IT businesses, hybrid cloud, cloud based infrastructure etc. Presenting this PowerPoint presentation, titled Effective Data Migration Key Statistics Associated With Cloud Migration, with topics curated by our researchers after extensive research. This editable presentation is available for immediate download and provides attractive features when used. Download now and captivate your audience. Presenting this Effective Data Migration Key Statistics Associated With Cloud Migration. Our researchers have carefully researched and created these slides with all aspects taken into consideration. This is a completely customizable Effective Data Migration Key Statistics Associated With Cloud Migration that is available for immediate downloading. Download now and make an impact on your audience. Highlight the attractive features available with our PPTs. This slide showcases stats related to cloud data migration which includes cloud services, IT businesses, hybrid cloud, cloud based infrastructure etc.
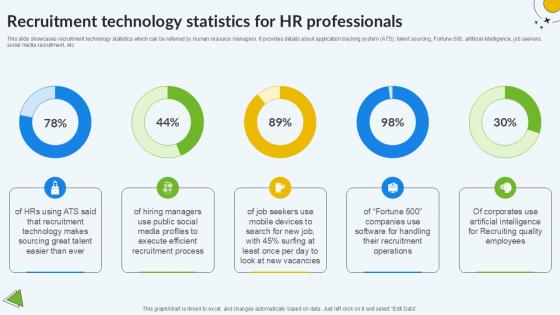
Recruitment Technology Statistics For HR Professionals PPT Presentation
This slide showcases recruitment technology statistics which can be referred by human resource managers. It provides details about application tracking system ATS, talent sourcing, Fortune 500, artificial intelligence, job seekers, social media recruitment, etc. Slidegeeks has constructed Recruitment Technology Statistics For HR Professionals PPT Presentation after conducting extensive research and examination. These presentation templates are constantly being generated and modified based on user preferences and critiques from editors. Here, you will find the most attractive templates for a range of purposes while taking into account ratings and remarks from users regarding the content. This is an excellent jumping-off point to explore our content and will give new users an insight into our top-notch PowerPoint Templates. This slide showcases recruitment technology statistics which can be referred by human resource managers. It provides details about application tracking system ATS, talent sourcing, Fortune 500, artificial intelligence, job seekers, social media recruitment, etc.

Business Diagram Stopwatch With Checklist For Planning Presentation Template
This business diagram is designed with graphics stopwatch with checklist. You may use this business slide to present methods of effective planning. This diagram provides an effective way of displaying information you can edit text, color, shade and style as per you need.
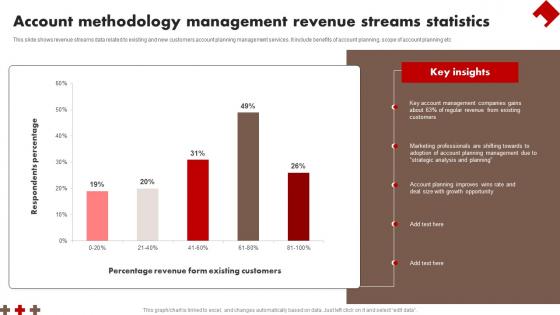
Account Methodology Management Revenue Streams Statistics Professional Pdf
This slide shows revenue streams data related to existing and new customers account planning management services. It include benefits of account planning, scope of account planning etc Pitch your topic with ease and precision using this Account Methodology Management Revenue Streams Statistics Professional Pdf This layout presents information on Account Methodology, Management Revenue, Streams Statistics It is also available for immediate download and adjustment. So, changes can be made in the color, design, graphics or any other component to create a unique layout. This slide shows revenue streams data related to existing and new customers account planning management services. It include benefits of account planning, scope of account planning etc
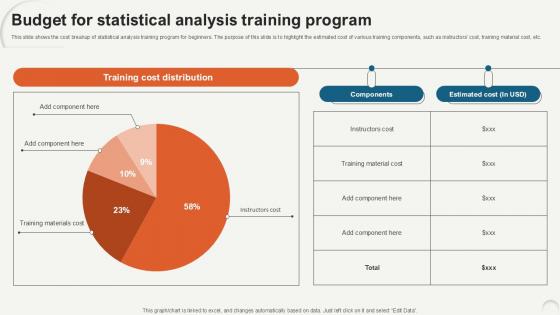
Budget For Statistical Data Analytics For Informed Decision Ppt Slide
This slide shows the cost breakup of statistical analysis training program for beginners. The purpose of this slide is to highlight the estimated cost of various training components, such as instructors cost, training material cost, etc. Do you have to make sure that everyone on your team knows about any specific topic I yes, then you should give Budget For Statistical Data Analytics For Informed Decision Ppt Slide a try. Our experts have put a lot of knowledge and effort into creating this impeccable Budget For Statistical Data Analytics For Informed Decision Ppt Slide. You can use this template for your upcoming presentations, as the slides are perfect to represent even the tiniest detail. You can download these templates from the Slidegeeks website and these are easy to edit. So grab these today This slide shows the cost breakup of statistical analysis training program for beginners. The purpose of this slide is to highlight the estimated cost of various training components, such as instructors cost, training material cost, etc.
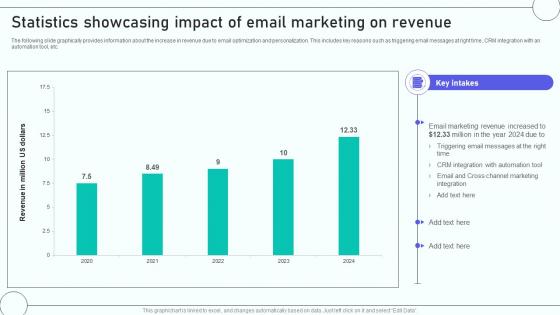
Email Marketing Automation Process Statistics Showcasing Impact Of Email
The following slide graphically provides information about the increase in revenue due to email optimization and personalization. This includes key reasons such as triggering email messages at right time, CRM integration with an automation tool, etc. Get a simple yet stunning designed Email Marketing Automation Process Statistics Showcasing Impact Of Email. It is the best one to establish the tone in your meetings. It is an excellent way to make your presentations highly effective. So, download this PPT today from Slidegeeks and see the positive impacts. Our easy-to-edit Email Marketing Automation Process Statistics Showcasing Impact Of Email can be your go-to option for all upcoming conferences and meetings. So, what are you waiting for Grab this template today. The following slide graphically provides information about the increase in revenue due to email optimization and personalization. This includes key reasons such as triggering email messages at right time, CRM integration with an automation tool, etc.
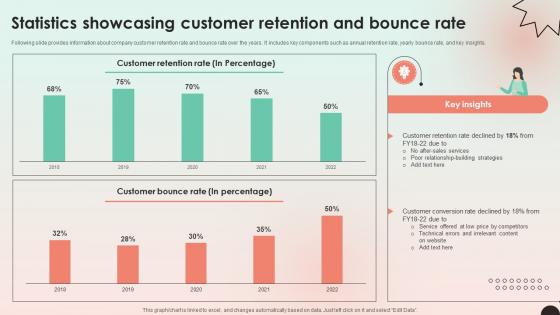
Web Consulting Business Performance Statistics Showcasing Customer Retention
Following slide provides information about company customer retention rate and bounce rate over the years. It includes key components such as annual retention rate, yearly bounce rate, and key insights. Find highly impressive Web Consulting Business Performance Statistics Showcasing Customer Retention on Slidegeeks to deliver a meaningful presentation. You can save an ample amount of time using these presentation templates. No need to worry to prepare everything from scratch because Slidegeeks experts have already done a huge research and work for you. You need to download Web Consulting Business Performance Statistics Showcasing Customer Retention for your upcoming presentation. All the presentation templates are 100 percent editable and you can change the color and personalize the content accordingly. Download now Following slide provides information about company customer retention rate and bounce rate over the years. It includes key components such as annual retention rate, yearly bounce rate, and key insights.
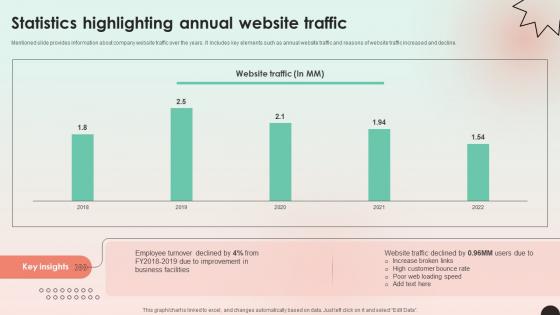
Web Consulting Business Statistics Highlighting Annual Website Traffic
Mentioned slide provides information about company website traffic over the years. It includes key elements such as annual website traffic and reasons of website traffic increased and decline. Crafting an eye-catching presentation has never been more straightforward. Let your presentation shine with this tasteful yet straightforward Web Consulting Business Statistics Highlighting Annual Website Traffic template. It offers a minimalistic and classy look that is great for making a statement. The colors have been employed intelligently to add a bit of playfulness while still remaining professional. Construct the ideal Web Consulting Business Statistics Highlighting Annual Website Traffic that effortlessly grabs the attention of your audience Begin now and be certain to wow your customers Mentioned slide provides information about company website traffic over the years. It includes key elements such as annual website traffic and reasons of website traffic increased and decline.
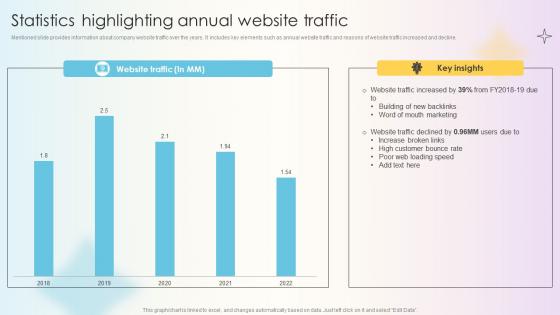
Managing Technical And Non Statistics Highlighting Annual Website Traffic
Mentioned slide provides information about company website traffic over the years. It includes key elements such as annual website traffic and reasons of website traffic increased and decline. Get a simple yet stunning designed Managing Technical And Non Statistics Highlighting Annual Website Traffic. It is the best one to establish the tone in your meetings. It is an excellent way to make your presentations highly effective. So, download this PPT today from Slidegeeks and see the positive impacts. Our easy-to-edit Managing Technical And Non Statistics Highlighting Annual Website Traffic can be your go-to option for all upcoming conferences and meetings. So, what are you waiting for Grab this template today. Mentioned slide provides information about company website traffic over the years. It includes key elements such as annual website traffic and reasons of website traffic increased and decline.
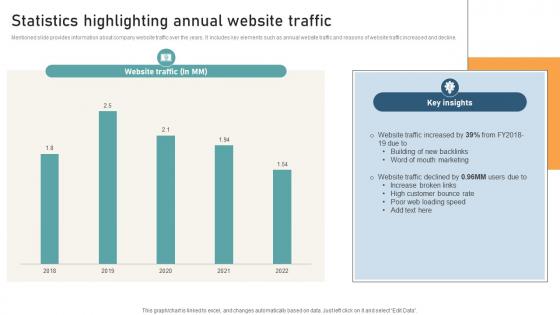
Comprehensive Guide For Website Statistics Highlighting Annual Website Traffic
Mentioned slide provides information about company website traffic over the years. It includes key elements such as annual website traffic and reasons of website traffic increased and decline. Find highly impressive Comprehensive Guide For Website Statistics Highlighting Annual Website Traffic on Slidegeeks to deliver a meaningful presentation. You can save an ample amount of time using these presentation templates. No need to worry to prepare everything from scratch because Slidegeeks experts have already done a huge research and work for you. You need to download Comprehensive Guide For Website Statistics Highlighting Annual Website Traffic for your upcoming presentation. All the presentation templates are 100 percent editable and you can change the color and personalize the content accordingly. Download now Mentioned slide provides information about company website traffic over the years. It includes key elements such as annual website traffic and reasons of website traffic increased and decline.
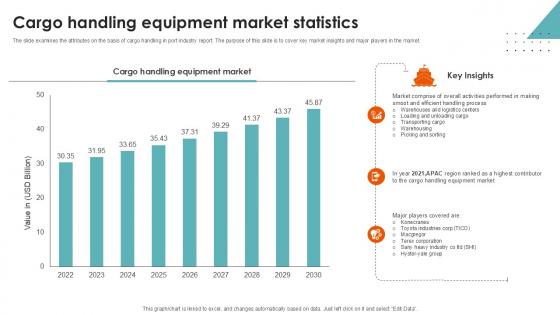
Cargo Handling Equipment Market Statistics Port Terminal Industry Ppt Presentation
The slide examines the attributes on the basis of cargo handling in port industry report. The purpose of this slide is to cover key market insights and major players in the market.Create an editable Cargo Handling Equipment Market Statistics Port Terminal Industry Ppt Presentation that communicates your idea and engages your audience. Whether you are presenting a business or an educational presentation, pre designed presentation templates help save time. Cargo Handling Equipment Market Statistics Port Terminal Industry Ppt Presentation is highly customizable and very easy to edit, covering many different styles from creative to business presentations. Slidegeeks has creative team members who have crafted amazing templates. So, go and get them without any delay. The slide examines the attributes on the basis of cargo handling in port industry report. The purpose of this slide is to cover key market insights and major players in the market.
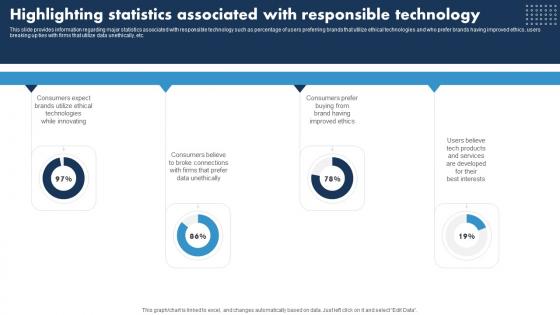
Highlighting Statistics Associated Esponsible Tech Guide To Manage Infographics Pdf
This slide provides information regarding major statistics associated with responsible technology such as percentage of users preferring brands that utilize ethical technologies and who prefer brands having improved ethics, users breaking up ties with firms that utilize data unethically, etc. Coming up with a presentation necessitates that the majority of the effort goes into the content and the message you intend to convey. The visuals of a PowerPoint presentation can only be effective if it supplements and supports the story that is being told. Keeping this in mind our experts created Highlighting Statistics Associated Esponsible Tech Guide To Manage Infographics Pdf to reduce the time that goes into designing the presentation. This way, you can concentrate on the message while our designers take care of providing you with the right template for the situation. This slide provides information regarding major statistics associated with responsible technology such as percentage of users preferring brands that utilize ethical technologies and who prefer brands having improved ethics, users breaking up ties with firms that utilize data unethically, etc.
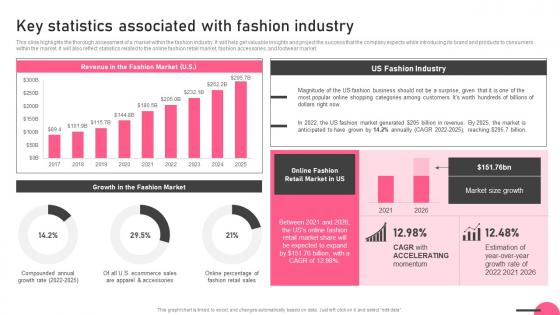
Key Statistics Associated With Fashion Industry Boutique Business Pictures Pdf
This slide highlights the thorough assessment of a market within the fashion industry. It will help get valuable insights and project the success that the company expects while introducing its brand and products to consumers within the market. It will also reflect statistics related to the online fashion retail market, fashion accessories, and footwear market. The best PPT templates are a great way to save time, energy, and resources. Slidegeeks have 100 percent editable powerpoint slides making them incredibly versatile. With these quality presentation templates, you can create a captivating and memorable presentation by combining visually appealing slides and effectively communicating your message. Download Key Statistics Associated With Fashion Industry Boutique Business Pictures Pdf from Slidegeeks and deliver a wonderful presentation. This slide highlights the thorough assessment of a market within the fashion industry. It will help get valuable insights and project the success that the company expects while introducing its brand and products to consumers within the market. It will also reflect statistics related to the online fashion retail market, fashion accessories, and footwear market.
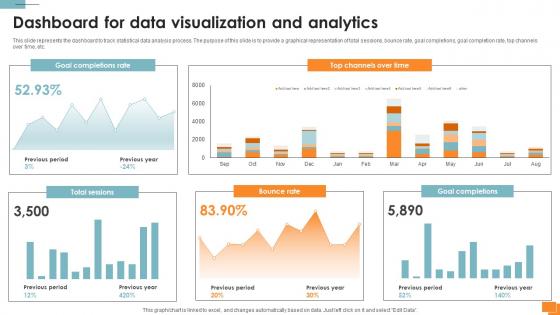
Statistical Tools For Evidence Dashboard For Data Visualization And Analytics
This slide represents the dashboard to track statistical data analysis process. The purpose of this slide is to provide a graphical representation of total sessions, bounce rate, goal completions, goal completion rate, top channels over time, etc. Are you in need of a template that can accommodate all of your creative concepts This one is crafted professionally and can be altered to fit any style. Use it with Google Slides or PowerPoint. Include striking photographs, symbols, depictions, and other visuals. Fill, move around, or remove text boxes as desired. Test out color palettes and font mixtures. Edit and save your work, or work with colleagues. Download Statistical Tools For Evidence Dashboard For Data Visualization And Analytics and observe how to make your presentation outstanding. Give an impeccable presentation to your group and make your presentation unforgettable. This slide represents the dashboard to track statistical data analysis process. The purpose of this slide is to provide a graphical representation of total sessions, bounce rate, goal completions, goal completion rate, top channels over time, etc.
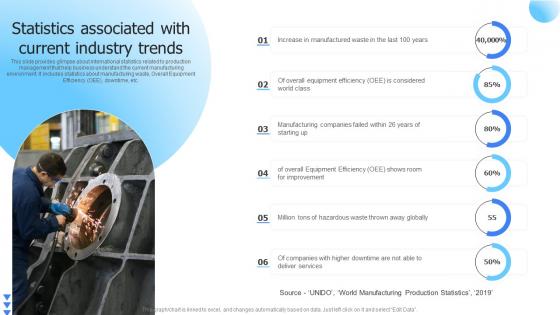
Leveraging Advanced Manufacturing Statistics Associated With Current Industry Trends Rules Pdf
This slide provides glimpse about international statistics related to production management that help business understand the current manufacturing environment. It includes statistics about manufacturing waste, Overall Equipment Efficiency OEE, downtime, etc. Explore a selection of the finest Leveraging Advanced Manufacturing Statistics Associated With Current Industry Trends Rules Pdf here. With a plethora of professionally designed and pre-made slide templates, you can quickly and easily find the right one for your upcoming presentation. You can use our Leveraging Advanced Manufacturing Statistics Associated With Current Industry Trends Rules Pdf to effectively convey your message to a wider audience. Slidegeeks has done a lot of research before preparing these presentation templates. The content can be personalized and the slides are highly editable. Grab templates today from Slidegeeks. This slide provides glimpse about international statistics related to production management that help business understand the current manufacturing environment. It includes statistics about manufacturing waste, Overall Equipment Efficiency OEE, downtime, etc.
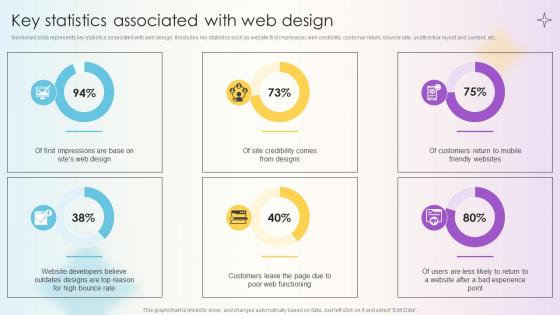
Managing Technical And Non Technical Key Statistics Associated With Web Design
Mentioned slide represents key statistics associated with web design. It includes key statistics such as website first impression, web credibility, customer return, bounce rate, unattractive layout and content, etc. Find highly impressive Managing Technical And Non Technical Key Statistics Associated With Web Design on Slidegeeks to deliver a meaningful presentation. You can save an ample amount of time using these presentation templates. No need to worry to prepare everything from scratch because Slidegeeks experts have already done a huge research and work for you. You need to download Managing Technical And Non Technical Key Statistics Associated With Web Design for your upcoming presentation. All the presentation templates are 100 percent editable and you can change the color and personalize the content accordingly. Download now Mentioned slide represents key statistics associated with web design. It includes key statistics such as website first impression, web credibility, customer return, bounce rate, unattractive layout and content, etc.
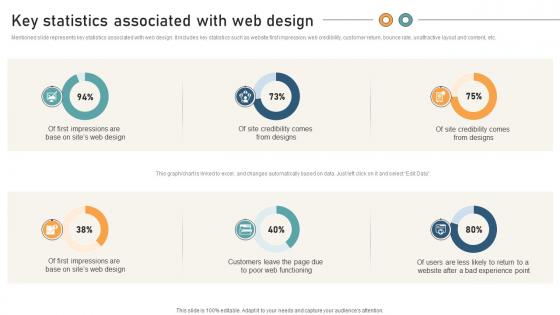
Comprehensive Guide For Website Development Key Statistics Associated With Web Design
Mentioned slide represents key statistics associated with web design. It includes key statistics such as website first impression, web credibility, customer return, bounce rate, unattractive layout and content, etc. Explore a selection of the finest Comprehensive Guide For Website Development Key Statistics Associated With Web Design here. With a plethora of professionally designed and pre-made slide templates, you can quickly and easily find the right one for your upcoming presentation. You can use our Comprehensive Guide For Website Development Key Statistics Associated With Web Design to effectively convey your message to a wider audience. Slidegeeks has done a lot of research before preparing these presentation templates. The content can be personalized and the slides are highly editable. Grab templates today from Slidegeeks. Mentioned slide represents key statistics associated with web design. It includes key statistics such as website first impression, web credibility, customer return, bounce rate, unattractive layout and content, etc.
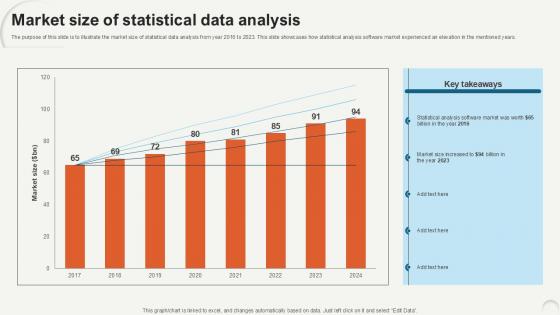
Market Size Of Statistical Data Analytics For Informed Decision Ppt Template
The purpose of this slide is to illustrate the market size of statistical data analysis from year 2016 to 2023. This slide showcases how statistical analysis software market experienced an elevation in the mentioned years. Explore a selection of the finest Market Size Of Statistical Data Analytics For Informed Decision Ppt Template here. With a plethora of professionally designed and pre-made slide templates, you can quickly and easily find the right one for your upcoming presentation. You can use our Market Size Of Statistical Data Analytics For Informed Decision Ppt Template to effectively convey your message to a wider audience. Slidegeeks has done a lot of research before preparing these presentation templates. The content can be personalized and the slides are highly editable. Grab templates today from Slidegeeks. The purpose of this slide is to illustrate the market size of statistical data analysis from year 2016 to 2023. This slide showcases how statistical analysis software market experienced an elevation in the mentioned years.
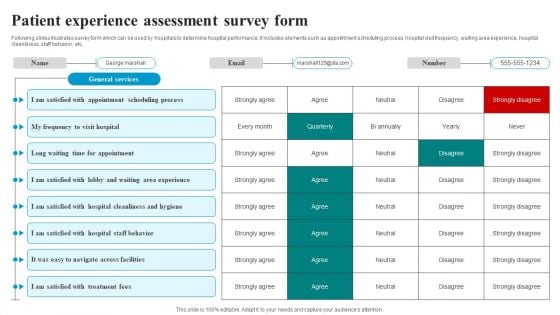
Patient Experience Assessment Survey Form Survey SS
Following slides illustrates survey form which can be used by hospitals to determine hospital performance. It includes elements such as appointment scheduling process, hospital visit frequency, waiting area experience, hospital cleanliness, staff behavior, etc. Showcasing this set of slides titled Patient Experience Assessment Survey Form Survey SS. The topics addressed in these templates are Survey Form, General Services, Number. All the content presented in this PPT design is completely editable. Download it and make adjustments in color, background, font etc. as per your unique business setting.

Statistics Highlighting Monthly Goals Achieved By Production Department Graphics Pdf
Mentioned slide demonstrates monthly production goals accomplished by production and operations department. It includes key elements such as target units to be produced and actual goods produced by business. Showcasing this set of slides titled Statistics Highlighting Monthly Goals Achieved By Production Department Graphics Pdf. The topics addressed in these templates are Goods Produced. All the content presented in this PPT design is completely editable. Download it and make adjustments in color, background, font etc. as per your unique business setting. Mentioned slide demonstrates monthly production goals accomplished by production and operations department. It includes key elements such as target units to be produced and actual goods produced by business.
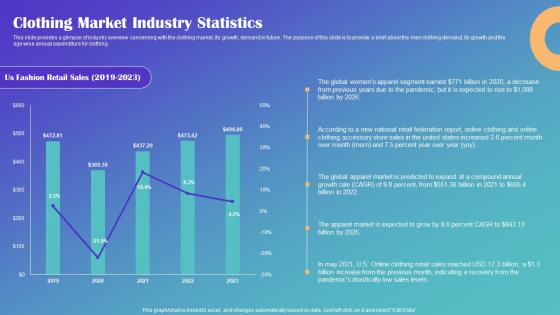
Clothing Market Industry Statistics Drop Shipping Business Plan Sample Pdf
This slide provides a glimpse of industry overview concerning with the clothing market, its growth, demand in future. The purpose of this slide is to provide a brief about the men clothing demand, its growth and the age wise annual expenditure for clothing. The best PPT templates are a great way to save time, energy, and resources. Slidegeeks have 100 percent editable powerpoint slides making them incredibly versatile. With these quality presentation templates, you can create a captivating and memorable presentation by combining visually appealing slides and effectively communicating your message. Download Clothing Market Industry Statistics Drop Shipping Business Plan Sample Pdf from Slidegeeks and deliver a wonderful presentation. This slide provides a glimpse of industry overview concerning with the clothing market, its growth, demand in future. The purpose of this slide is to provide a brief about the men clothing demand, its growth and the age wise annual expenditure for clothing.
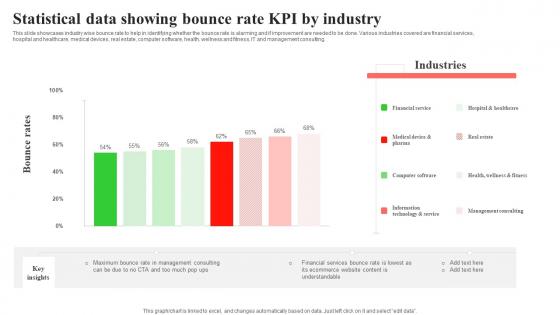
Statistical Data Showing Bounce Rate KPI By Industry Ideas Pdf
This slide showcases industry wise bounce rate to help in identifying whether the bounce rate is alarming and if improvement are needed to be done. Various industries covered are financial services, hospital and healthcare, medical devices, real estate, computer software, health, wellness and fitness, IT and management consulting. Showcasing this set of slides titled Statistical Data Showing Bounce Rate KPI By Industry Ideas Pdf. The topics addressed in these templates are Financial Services, Hospital And Healthcare, Medical Devices. All the content presented in this PPT design is completely editable. Download it and make adjustments in color, background, font etc. as per your unique business setting. This slide showcases industry wise bounce rate to help in identifying whether the bounce rate is alarming and if improvement are needed to be done. Various industries covered are financial services, hospital and healthcare, medical devices, real estate, computer software, health, wellness and fitness, IT and management consulting.
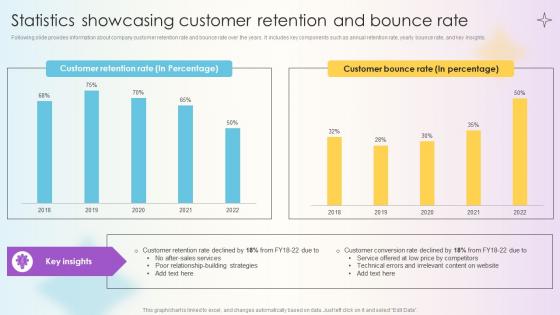
Managing Technical And Non Technical Statistics Showcasing Customer Retention
Following slide provides information about company customer retention rate and bounce rate over the years. It includes key components such as annual retention rate, yearly bounce rate, and key insights. If your project calls for a presentation, then Slidegeeks is your go-to partner because we have professionally designed, easy-to-edit templates that are perfect for any presentation. After downloading, you can easily edit Managing Technical And Non Technical Statistics Showcasing Customer Retention and make the changes accordingly. You can rearrange slides or fill them with different images. Check out all the handy templates Following slide provides information about company customer retention rate and bounce rate over the years. It includes key components such as annual retention rate, yearly bounce rate, and key insights.
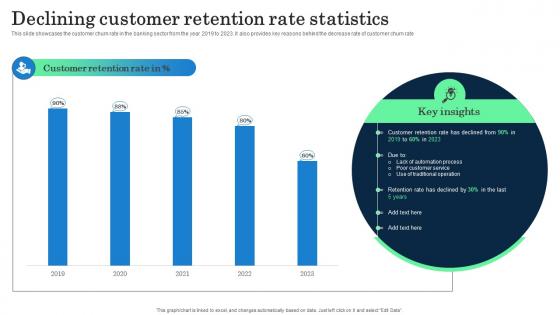
Declining Customer Retention Rate Statistics Incorporating Banking Operational Growth
This slide showcases the customer churn rate in the banking sector from the year 2019 to 2023. it also provides key reasons behind the decrease rate of customer churn rate. Are you in need of a template that can accommodate all of your creative concepts This one is crafted professionally and can be altered to fit any style. Use it with Google Slides or PowerPoint. Include striking photographs, symbols, depictions, and other visuals. Fill, move around, or remove text boxes as desired. Test out color palettes and font mixtures. Edit and save your work, or work with colleagues. Download Declining Customer Retention Rate Statistics Incorporating Banking Operational Growth and observe how to make your presentation outstanding. Give an impeccable presentation to your group and make your presentation unforgettable. This slide showcases the customer churn rate in the banking sector from the year 2019 to 2023. it also provides key reasons behind the decrease rate of customer churn rate
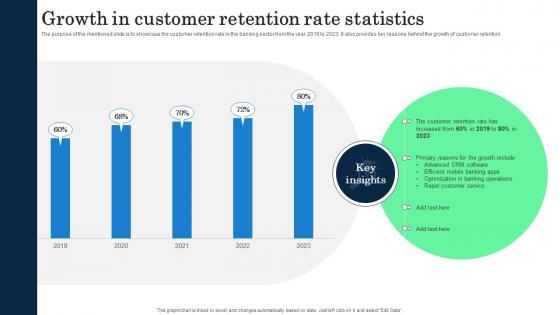
Growth In Customer Retention Rate Statistics Incorporating Banking Operational Growth
The purpose of the mentioned slide is to showcase the customer retention rate in the banking sector from the year 2019 to 2023. it also provides key reasons behind the growth of customer retention. The Growth In Customer Retention Rate Statistics Incorporating Banking Operational Growth is a compilation of the most recent design trends as a series of slides. It is suitable for any subject or industry presentation, containing attractive visuals and photo spots for businesses to clearly express their messages. This template contains a variety of slides for the user to input data, such as structures to contrast two elements, bullet points, and slides for written information. Slidegeeks is prepared to create an impression. The purpose of the mentioned slide is to showcase the customer retention rate in the banking sector from the year 2019 to 2023. it also provides key reasons behind the growth of customer retention
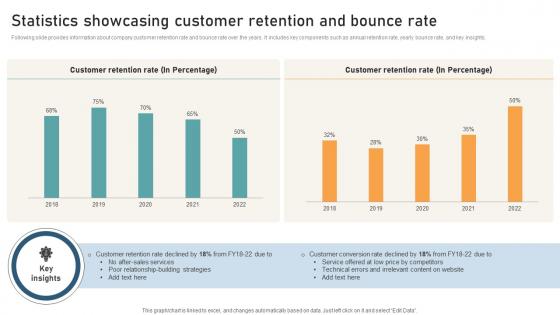
Comprehensive Guide For Website Statistics Showcasing Customer Retention And Bounce
Following slide provides information about company customer retention rate and bounce rate over the years. It includes key components such as annual retention rate, yearly bounce rate, and key insights. If your project calls for a presentation, then Slidegeeks is your go-to partner because we have professionally designed, easy-to-edit templates that are perfect for any presentation. After downloading, you can easily edit Comprehensive Guide For Website Statistics Showcasing Customer Retention And Bounce and make the changes accordingly. You can rearrange slides or fill them with different images. Check out all the handy templates Following slide provides information about company customer retention rate and bounce rate over the years. It includes key components such as annual retention rate, yearly bounce rate, and key insights.
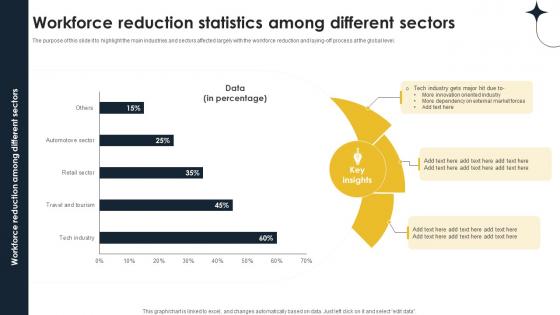
Workforce Reduction Statistics Among Different Implementing Personnel Downsizing Initiative
The purpose of this slide it to highlight the main industries and sectors affected largely with the workforce reduction and laying-off process at the global level. Take your projects to the next level with our ultimate collection of Workforce Reduction Statistics Among Different Implementing Personnel Downsizing Initiative. Slidegeeks has designed a range of layouts that are perfect for representing task or activity duration, keeping track of all your deadlines at a glance. Tailor these designs to your exact needs and give them a truly corporate look with your own brand colors they will make your projects stand out from the rest The purpose of this slide it to highlight the main industries and sectors affected largely with the workforce reduction and laying-off process at the global level.
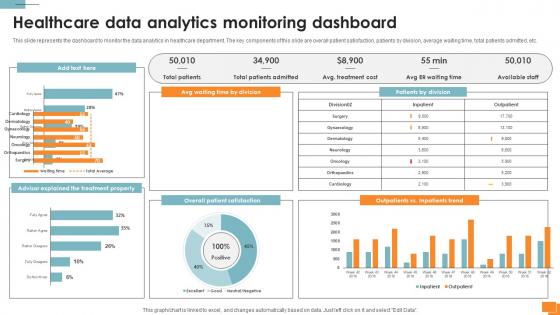
Statistical Tools For Evidence Healthcare Data Analytics Monitoring Dashboard
This slide represents the dashboard to monitor the data analytics in healthcare department. The key components of this slide are overall patient satisfaction, patients by division, average waiting time, total patients admitted, etc. Welcome to our selection of the Statistical Tools For Evidence Healthcare Data Analytics Monitoring Dashboard. These are designed to help you showcase your creativity and bring your sphere to life. Planning and Innovation are essential for any business that is just starting out. This collection contains the designs that you need for your everyday presentations. All of our PowerPoints are 100Percent editable, so you can customize them to suit your needs. This multi-purpose template can be used in various situations. Grab these presentation templates today. This slide represents the dashboard to monitor the data analytics in healthcare department. The key components of this slide are overall patient satisfaction, patients by division, average waiting time, total patients admitted, etc.
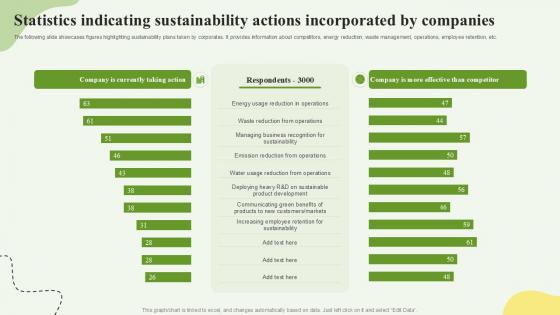
Statistics Indicating Sustainability Actions Incorporated By Companies Ppt Example SS
This slide represents the pyramid showing the performance of the human resource department of an organization. It includes details related to recruitment and selection, talent management, leadership capability, performance culture and strategic advantage. There are so many reasons you need a Statistics Indicating Sustainability Actions Incorporated By Companies Ppt Example SS The first reason is you can not spend time making everything from scratch, Thus, Slidegeeks has made presentation templates for you too. You can easily download these templates from our website easily. This slide represents the pyramid showing the performance of the human resource department of an organization. It includes details related to recruitment and selection, talent management, leadership capability, performance culture and strategic advantage.
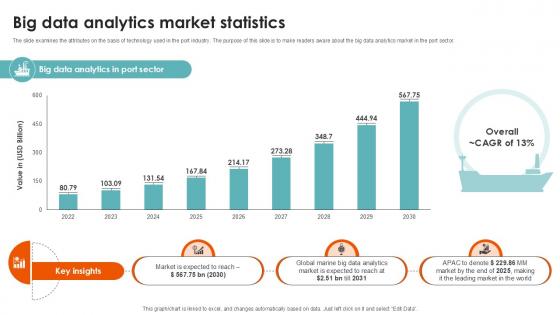
Big Data Analytics Market Statistics Port Terminal Industry Ppt Template
The slide examines the attributes on the basis of technology used in the port industry. The purpose of this slide is to make readers aware about the big data analytics market in the port sector. Boost your pitch with our creative Big Data Analytics Market Statistics Port Terminal Industry Ppt Template. Deliver an awe inspiring pitch that will mesmerize everyone. Using these presentation templates you will surely catch everyones attention. You can browse the ppts collection on our website. We have researchers who are experts at creating the right content for the templates. So you do not have to invest time in any additional work. Just grab the template now and use them. The slide examines the attributes on the basis of technology used in the port industry. The purpose of this slide is to make readers aware about the big data analytics market in the port sector.
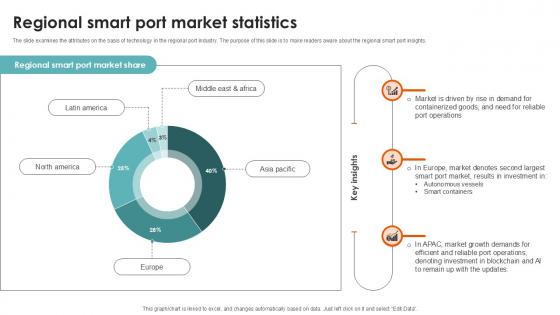
Regional Smart Port Market Statistics Port Terminal Industry Ppt Sample
The slide examines the attributes on the basis of technology in the regional port industry. The purpose of this slide is to make readers aware about the regional smart port insights. Boost your pitch with our creative Regional Smart Port Market Statistics Port Terminal Industry Ppt Sample. Deliver an awe inspiring pitch that will mesmerize everyone. Using these presentation templates you will surely catch everyones attention. You can browse the ppts collection on our website. We have researchers who are experts at creating the right content for the templates. So you do not have to invest time in any additional work. Just grab the template now and use them. The slide examines the attributes on the basis of technology in the regional port industry. The purpose of this slide is to make readers aware about the regional smart port insights.
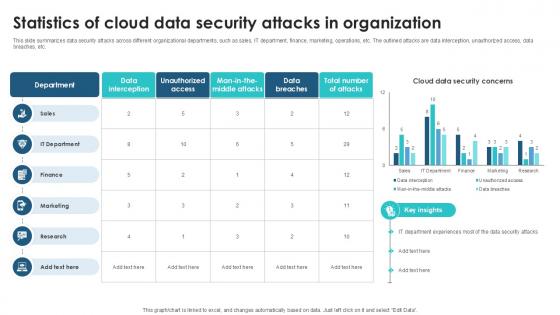
Statistics Of Cloud Data Security Client Side Encryption PPT Slide
This slide summarizes data security attacks across different organizational departments, such as sales, IT department, finance, marketing, operations, etc. The outlined attacks are data interception, unauthorized access, data breaches, etc. This Statistics Of Cloud Data Security Client Side Encryption PPT Slide from Slidegeeks makes it easy to present information on your topic with precision. It provides customization options, so you can make changes to the colors, design, graphics, or any other component to create a unique layout. It is also available for immediate download, so you can begin using it right away. Slidegeeks has done good research to ensure that you have everything you need to make your presentation stand out. Make a name out there for a brilliant performance. This slide summarizes data security attacks across different organizational departments, such as sales, IT department, finance, marketing, operations, etc. The outlined attacks are data interception, unauthorized access, data breaches, etc.
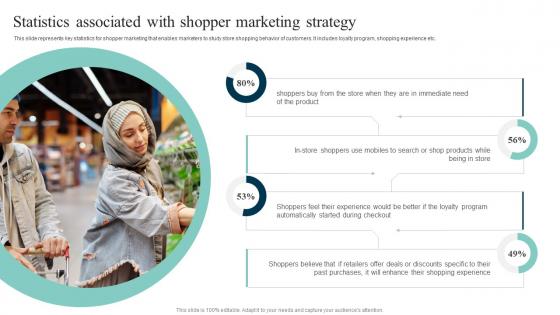
Statistics Associated With Shopper Out Of The Box Shopper Marketing Strategies Inspiration Pdf
This slide represents key statistics for shopper marketing that enables marketers to study store shopping behavior of customers. It includes loyalty program, shopping experience etc. There are so many reasons you need a Statistics Associated With Shopper Out Of The Box Shopper Marketing Strategies Inspiration Pdf. The first reason is you can not spend time making everything from scratch, Thus, Slidegeeks has made presentation templates for you too. You can easily download these templates from our website easily. This slide represents key statistics for shopper marketing that enables marketers to study store shopping behavior of customers. It includes loyalty program, shopping experience etc.
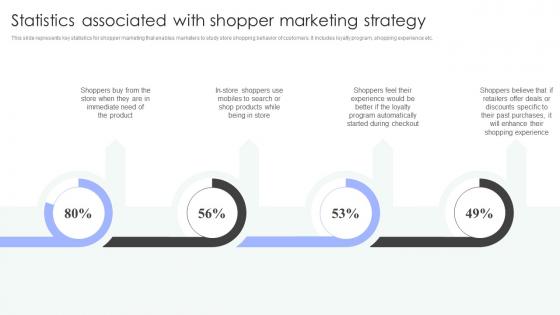
Shopper Marketing Strategy To Enhance Statistics Associated With Shopper Marketing Background Pdf
This slide represents key statistics for shopper marketing that enables marketers to study store shopping behavior of customers. It includes loyalty program, shopping experience etc. There are so many reasons you need a Shopper Marketing Strategy To Enhance Statistics Associated With Shopper Marketing Background Pdf. The first reason is you can not spend time making everything from scratch, Thus, Slidegeeks has made presentation templates for you too. You can easily download these templates from our website easily. This slide represents key statistics for shopper marketing that enables marketers to study store shopping behavior of customers. It includes loyalty program, shopping experience etc.
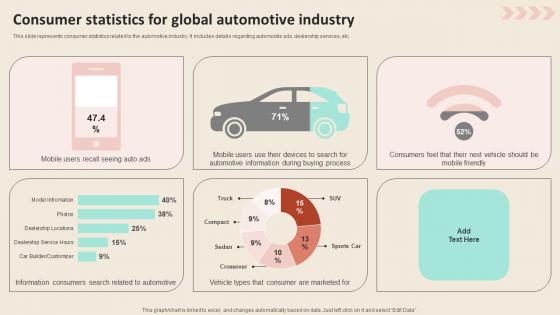
Consumer Statistics For Global Automotive Industry Promotional Strategies To Increase Demonstration PDF
This slide represents consumer statistics related to the automotive industry. It includes details regarding automobile ads, dealership services, etc. There are so many reasons you need a Consumer Statistics For Global Automotive Industry Promotional Strategies To Increase Demonstration PDF. The first reason is you can not spend time making everything from scratch, Thus, Slidegeeks has made presentation templates for you too. You can easily download these templates from our website easily. This slide represents consumer statistics related to the automotive industry. It includes details regarding automobile ads, dealership services, etc.
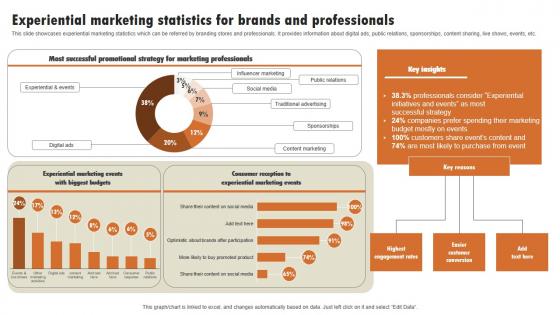
Experiential Marketing Statistics For Brands And Experiential Marketing Technique Designs PDF
This slide showcases experiential marketing statistics which can be referred by branding stores and professionals. It provides information about digital ads, public relations, sponsorships, content sharing, live shows, events, etc. Explore a selection of the finest Experiential Marketing Statistics For Brands And Experiential Marketing Technique Designs PDF here. With a plethora of professionally designed and pre-made slide templates, you can quickly and easily find the right one for your upcoming presentation. You can use our Experiential Marketing Statistics For Brands And Experiential Marketing Technique Designs PDF to effectively convey your message to a wider audience. Slidegeeks has done a lot of research before preparing these presentation templates. The content can be personalized and the slides are highly editable. Grab templates today from Slidegeeks. This slide showcases experiential marketing statistics which can be referred by branding stores and professionals. It provides information about digital ads, public relations, sponsorships, content sharing, live shows, events, etc.
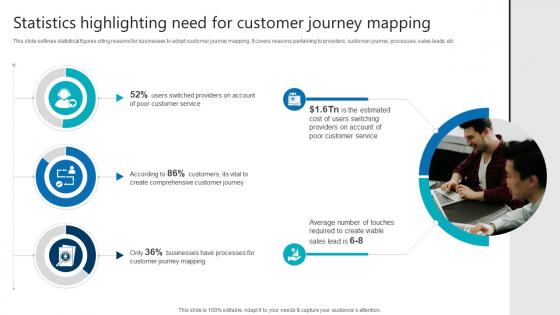
Statistics Highlighting Need For Customer Journey Mapping Product Analytics Implementation Data Analytics V
This slide outlines statistical figures citing reasons for businesses to adopt customer journey mapping. It covers reasons pertaining to providers, customer journey, processes, sales leads, etc Crafting an eye-catching presentation has never been more straightforward. Let your presentation shine with this tasteful yet straightforward Statistics Highlighting Need For Customer Journey Mapping Product Analytics Implementation Data Analytics V template. It offers a minimalistic and classy look that is great for making a statement. The colors have been employed intelligently to add a bit of playfulness while still remaining professional. Construct the ideal Statistics Highlighting Need For Customer Journey Mapping Product Analytics Implementation Data Analytics V that effortlessly grabs the attention of your audience Begin now and be certain to wow your customers This slide outlines statistical figures citing reasons for businesses to adopt customer journey mapping. It covers reasons pertaining to providers, customer journey, processes, sales leads, etc
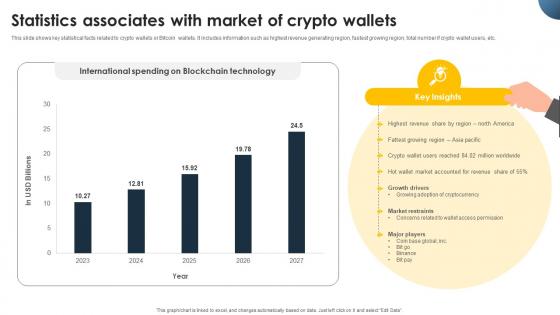
Complete Beginners Guide Statistics Associates With Market Of Crypto Wallets Fin SS V
This slide shows key statistical facts related to crypto wallets or Bitcoin wallets. It includes information such as highest revenue generating region, fastest growing region, total number if crypto wallet users, etc. Create an editable Complete Beginners Guide Statistics Associates With Market Of Crypto Wallets Fin SS V that communicates your idea and engages your audience. Whether you are presenting a business or an educational presentation, pre-designed presentation templates help save time. Complete Beginners Guide Statistics Associates With Market Of Crypto Wallets Fin SS V is highly customizable and very easy to edit, covering many different styles from creative to business presentations. Slidegeeks has creative team members who have crafted amazing templates. So, go and get them without any delay. This slide shows key statistical facts related to crypto wallets or Bitcoin wallets. It includes information such as highest revenue generating region, fastest growing region, total number if crypto wallet users, etc.
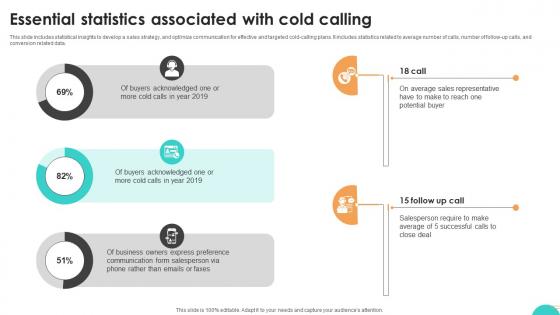
Ultimate Guide To Cold Essential Statistics Associated With Cold Calling SA SS V
This slide includes statistical insights to develop a sales strategy, and optimize communication for effective and targeted cold-calling plans. It includes statistics related to average number of calls, number of follow-up calls, and conversion related data. Formulating a presentation can take up a lot of effort and time, so the content and message should always be the primary focus. The visuals of the PowerPoint can enhance the presenters message, so our Ultimate Guide To Cold Essential Statistics Associated With Cold Calling SA SS V was created to help save time. Instead of worrying about the design, the presenter can concentrate on the message while our designers work on creating the ideal templates for whatever situation is needed. Slidegeeks has experts for everything from amazing designs to valuable content, we have put everything into Ultimate Guide To Cold Essential Statistics Associated With Cold Calling SA SS V. This slide includes statistical insights to develop a sales strategy, and optimize communication for effective and targeted cold-calling plans. It includes statistics related to average number of calls, number of follow-up calls, and conversion related data.
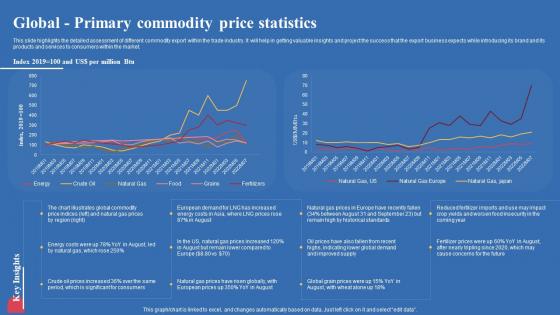
Global Primary Commodity Price Statistics Export Business Plan Summary Pdf
This slide highlights the detailed assessment of different commodity export within the trade industry. It will help in getting valuable insights and project the success that the export business expects while introducing its brand and its products and services to consumers within the market. Are you in need of a template that can accommodate all of your creative concepts This one is crafted professionally and can be altered to fit any style. Use it with Google Slides or PowerPoint. Include striking photographs, symbols, depictions, and other visuals. Fill, move around, or remove text boxes as desired. Test out color palettes and font mixtures. Edit and save your work, or work with colleagues. Download Global Primary Commodity Price Statistics Export Business Plan Summary Pdf and observe how to make your presentation outstanding. Give an impeccable presentation to your group and make your presentation unforgettable. This slide highlights the detailed assessment of different commodity export within the trade industry. It will help in getting valuable insights and project the success that the export business expects while introducing its brand and its products and services to consumers within the market.


 Continue with Email

 Home
Home


