Checkmark Icon
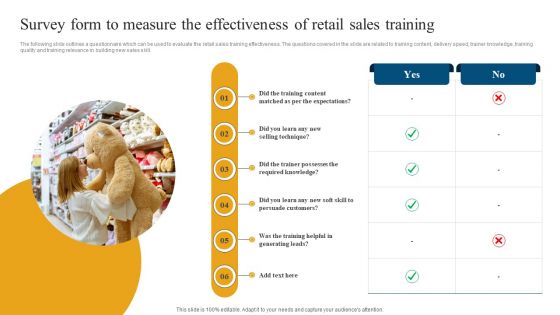
Survey Form To Measure The Effectiveness Of Retail Sales Training Topics PDF
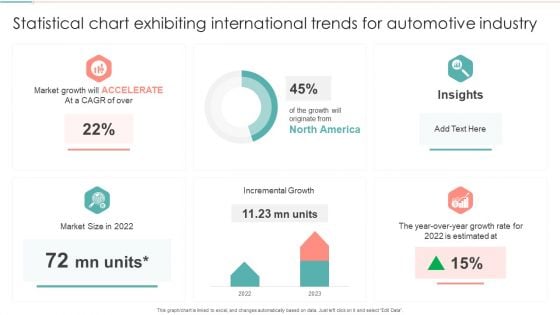
Statistical Chart Exhibiting International Trends For Automotive Industry Mockup PDF
Showcasing this set of slides titled Statistical Chart Exhibiting International Trends For Automotive Industry Mockup PDF. The topics addressed in these templates are Market Growth, Incremental Growth, Growth Estimated. All the content presented in this PPT design is completely editable. Download it and make adjustments in color, background, font etc. as per your unique business setting.
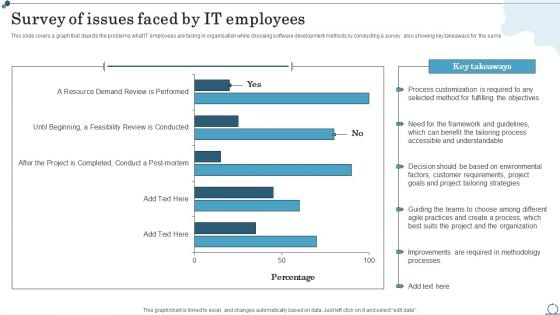
Survey Of Issues Faced By IT Employees Agile IT Methodology In Project Management Diagrams PDF
This slide covers a graph that depicts the problems what IT employees are facing in organisation while choosing software development methods by conducting a survey also showing key takeaways for the same.Get a simple yet stunning designed Survey Of Issues Faced By IT Employees Agile IT Methodology In Project Management Diagrams PDF. It is the best one to establish the tone in your meetings. It is an excellent way to make your presentations highly effective. So, download this PPT today from Slidegeeks and see the positive impacts. Our easy-to-edit Survey Of Issues Faced By IT Employees Agile IT Methodology In Project Management Diagrams PDF can be your go-to option for all upcoming conferences and meetings. So, what are you waiting for Grab this template today.
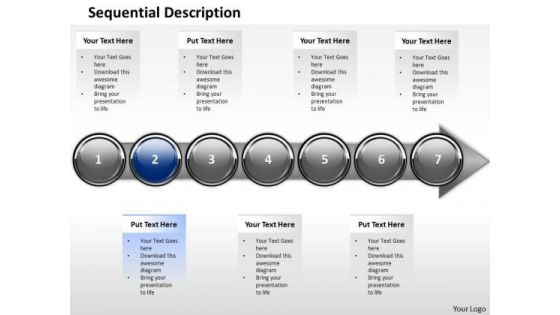
Ppt Arrow Description Of Business Process Using 7 State Diagram Stage 2 PowerPoint Templates
PPT arrow description of business process using 7 state diagram stage 2 PowerPoint Templates-Arrows PowerPoint Diagram is nice for financial PowerPoint Diagram presentations as well as other analysis or business PowerPoint diagram needs. The diagram contains some successful curve effect with a color chart making the sense that an employee from a large corporation is using it to demonstrate the boss that he was doing the right job in the right moment, or you can check the Wish list.-PPT arrow description of business process using 7 state diagram stage 2 PowerPoint Templates-Advertising, Arrow, Background, Banner, Blue, Bookmark, Card, Choice, Concept, Creative, Design, Direction, Flow, Illustration, Infographic, Instruction, Label, Layout, Manual, Marketing, Modern, Next, Number, Offer, One, Options, Order, Page, Paper, Pointer, Process, Product, Promotion, Sequence, Simple, Special, Step, Symbol, Tab, Tag, Template, Three, Tutorial, Two, Vector, Version, Web, Webdesign, Website The impact of your ideas will take time to fade. The images of our Ppt Arrow Description Of Business Process Using 7 State Diagram Stage 2 PowerPoint Templates will help their recall.

Ppt 3d Animated Multicolor Circular Procurement Process PowerPoint Presentation Templates
PPT 3d animated multicolor circular procurement process powerpoint presentation Templates-This PowerPoint Diagram consists of seven colorful sections forming a circle. It signifies different factors to be combined together to complete the process and hence leading to success.-PPT 3d animated multicolor circular procurement process powerpoint presentation Templates-Abstract, Blank, Business, Chart, Circular, Circulation, Cycle, Design, Diagram, Empty, Executive, Icon, Illustration, Management, Model, Numbers, Organization, Procedure, Process Feuds can happen at the workplace. Settle them amicably with our Ppt 3d Animated Multicolor Circular Procurement Process PowerPoint Presentation Templates.
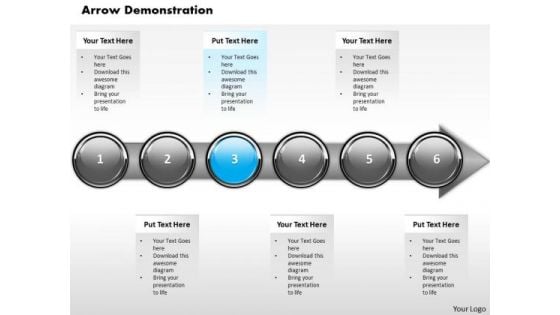
Ppt Homogeneous Demonstration Of Financial Process Using Stage 3 PowerPoint Templates
PPT homogeneous demonstration of financial process using stage 3 PowerPoint Templates-With this pre-designed process arrows diagram you can visualize almost any type of concept, chronological process or steps of your strategies.-PPT homogeneous demonstration of financial process using stage 3 PowerPoint Templates-Abstract, Achievement, Aim, Arrow, Background, Business, Chart, Communication, Company, Competition, Concept, Design, Development, Diagram, Direction, Finance, Financial, Forecast, Forward, Goal, Graph, Graphic, Growth, Icon, Illustration, Increase, Investment, Leader, Leadership, Marketing, Motion, Moving, Orange, Path, Price, Process, Profit, Progress, Shape, Sign, Success, Symbol, Target, Team, Teamwork, Up, Upwards Book you place at the top with our Ppt Homogeneous Demonstration Of Financial Process Using Stage 3 PowerPoint Templates. You will come out on top.
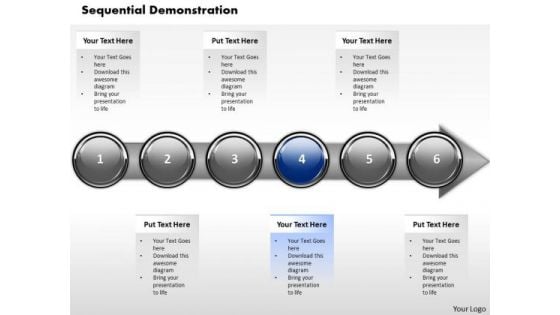
Ppt Horizontal Abstraction Of Financial Process Using Stage 4 PowerPoint Templates
PPT horizontal abstraction of financial process using stage 4 PowerPoint Templates-This diagram can be used in analyzing, designing, documenting or managing a process or program in various fields.-PPT horizontal abstraction of financial process using stage 4 PowerPoint Templates-Abstract, Achievement, Aim, Arrow, Background, Business, Chart, Communication, Company, Competition, Concept, Design, Development, Diagram, Direction, Finance, Financial, Forecast, Forward, Goal, Graph, Graphic, Growth, Icon, Illustration, Increase, Investment, Leader, Leadership, Marketing, Motion, Moving, Orange, Path, Price, Process, Profit, Progress, Shape, Sign, Success, Symbol, Target, Team, Teamwork, Up, Upwards Put in your every bit with our Ppt Horizontal Abstraction Of Financial Process Using Stage 4 PowerPoint Templates. They will give it their all.
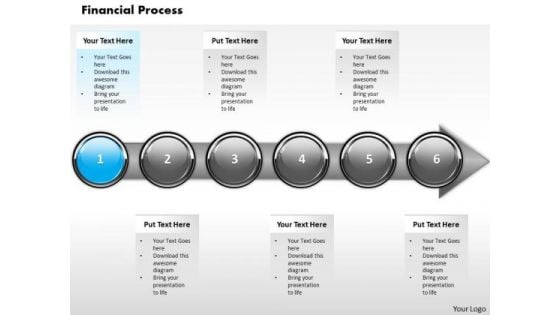
Ppt Sequential Demonstration Of Arrow Process Step 1 PowerPoint Templates
PPT sequential demonstration of arrow process step 1 PowerPoint Templates-With this pre-designed process arrows diagram you can visualize almost any type of concept, chronological process or steps of your strategies-PPT sequential demonstration of arrow process step 1 PowerPoint Templates-Abstract, Achievement, Aim, Arrow, Background, Business, Chart, Communication, Company, Competition, Concept, Design, Development, Diagram, Direction, Finance, Financial, Forecast, Forward, Goal, Graph, Graphic, Growth, Icon, Illustration, Increase, Investment, Leader, Leadership, Marketing, Motion, Moving, Orange, Path, Price, Process, Profit, Progress, Shape, Sign, Success, Symbol, Target, Team, Teamwork, Up, Upwards Accept accolades with our Ppt Sequential Demonstration Of Arrow Process Step 1 PowerPoint Templates. You will come out on top.
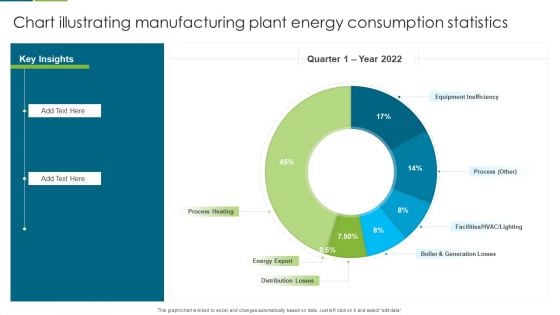
Chart Illustrating Manufacturing Plant Energy Consumption Statistics Slides PDF
This graph or chart is linked to excel, and changes automatically based on data. Just left click on it and select edit data. Pitch your topic with ease and precision using this Chart Illustrating Manufacturing Plant Energy Consumption Statistics Slides PDF. This layout presents information on Equipment Inefficiency, Process Heating, Energy Export. It is also available for immediate download and adjustment. So, changes can be made in the color, design, graphics or any other component to create a unique layout.

Solutions Of Business Problems With The Brainstorm Ppt PowerPoint Presentation Ideas Example File
Presenting this set of slides with name solutions of business problems with the brainstorm ppt powerpoint presentation ideas example file. This is a four stage process. The stages in this process are try to check issue from all direction, describe the problem to your senior, create achievable solution, make a list of right or good solution, select best solution, take steps to start the action. This is a completely editable PowerPoint presentation and is available for immediate download. Download now and impress your audience.
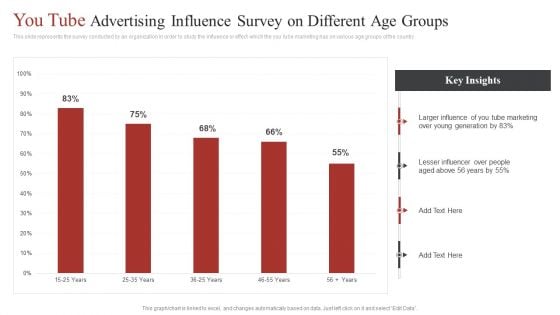
You Tube Advertising Influence Survey On Different Age Groups Ppt Diagram Ppt PDF
This slide represents the survey conducted by an organization in order to study the influence or effect which the you tube marketing has on various age groups of the country. Pitch your topic with ease and precision using this You Tube Advertising Influence Survey On Different Age Groups Ppt Diagram Ppt PDF. This layout presents information on Larger Influence, You Tube Marketing, Young Generation. It is also available for immediate download and adjustment. So, changes can be made in the color, design, graphics or any other component to create a unique layout.
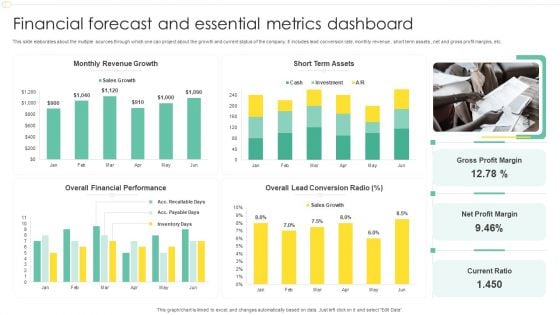
Financial Forecast And Essential Metrics Dashboard Ppt File Show PDF
This slide elaborates about the multiple sources through which one can project about the growth and current status of the company. It includes lead conversion rate, monthly revenue , short term assets , net and gross profit margins, etc. Pitch your topic with ease and precision using this Financial Forecast And Essential Metrics Dashboard Ppt File Show PDF. This layout presents information on Monthly Revenue Growth, Short Term Assets, Overall Financial Performance, Net Profit Margin. It is also available for immediate download and adjustment. So, changes can be made in the color, design, graphics or any other component to create a unique layout.
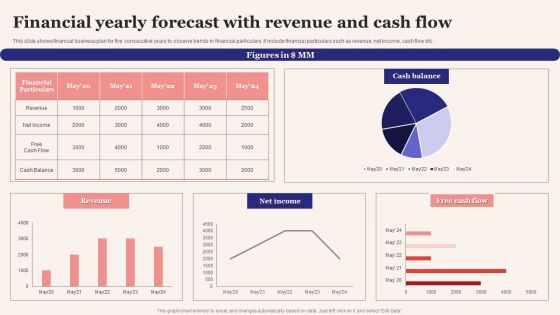
Financial Yearly Forecast With Revenue And Cash Flow Formats PDF
This slide shows financial business plan for five consecutive years to observe trends in financial particulars. It include financial particulars such as revenue, net income, cash flow etc. Pitch your topic with ease and precision using this Financial Yearly Forecast With Revenue And Cash Flow Formats PDF. This layout presents information on Financial Particulars, Cash Balance, Free Cash Flow. It is also available for immediate download and adjustment. So, changes can be made in the color, design, graphics or any other component to create a unique layout.
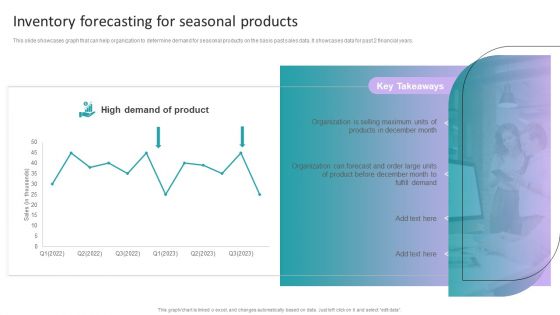
Stock Inventory Acquisition Inventory Forecasting For Seasonal Products Topics PDF
This slide showcases graph that can help organization to determine demand for seasonal products on the basis past sales data. It showcases data for past 2 financial years. Boost your pitch with our creative Stock Inventory Acquisition Inventory Forecasting For Seasonal Products Topics PDF. Deliver an awe-inspiring pitch that will mesmerize everyone. Using these presentation templates you will surely catch everyones attention. You can browse the ppts collection on our website. We have researchers who are experts at creating the right content for the templates. So you dont have to invest time in any additional work. Just grab the template now and use them.
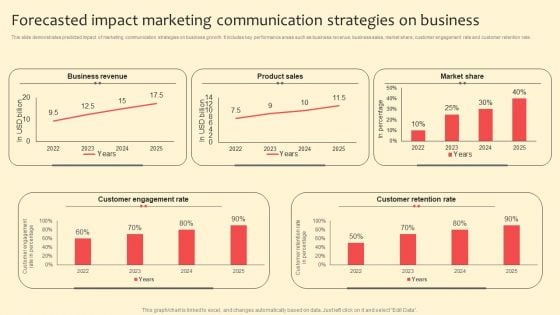
Forecasted Impact Marketing Communication Strategies On Business Structure PDF
This slide demonstrates predicted impact of marketing communication strategies on business growth. It includes key performance areas such as business revenue, business sales, market share, customer engagement rate and customer retention rate. Boost your pitch with our creative Forecasted Impact Marketing Communication Strategies On Business Structure PDF. Deliver an awe inspiring pitch that will mesmerize everyone. Using these presentation templates you will surely catch everyones attention. You can browse the ppts collection on our website. We have researchers who are experts at creating the right content for the templates. So you do not have to invest time in any additional work. Just grab the template now and use them.
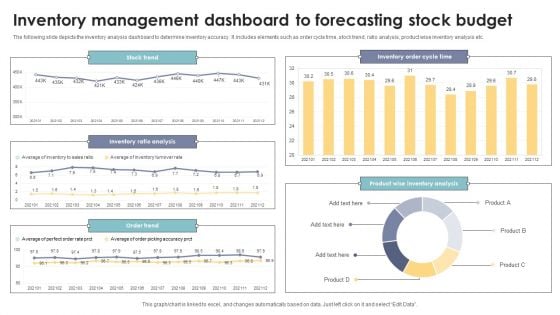
Inventory Management Dashboard To Forecasting Stock Budget Elements PDF
The following slide depicts the inventory analysis dashboard to determine inventory accuracy. It includes elements such as order cycle time, stock trend, ratio analysis, product wise inventory analysis etc. Pitch your topic with ease and precision using this Inventory Management Dashboard To Forecasting Stock Budget Elements PDF. This layout presents information on Inventory Ratio Analysis, Product Wise Inventory Analysis, Stock Trend. It is also available for immediate download and adjustment. So, changes can be made in the color, design, graphics or any other component to create a unique layout.
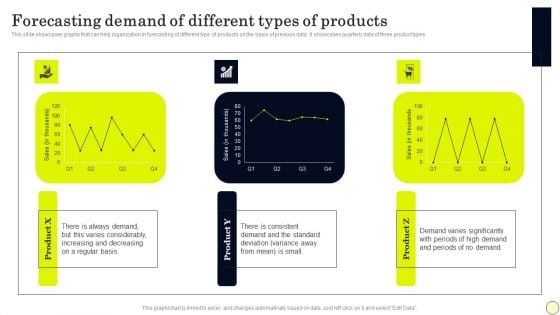
Forecasting Demand Of Different Types Of Products Demonstration PDF
This Forecasting Demand Of Different Types Of Products Demonstration PDF from Slidegeeks makes it easy to present information on your topic with precision. It provides customization options, so you can make changes to the colors, design, graphics, or any other component to create a unique layout. It is also available for immediate download, so you can begin using it right away. Slidegeeks has done good research to ensure that you have everything you need to make your presentation stand out. Make a name out there for a brilliant performance.
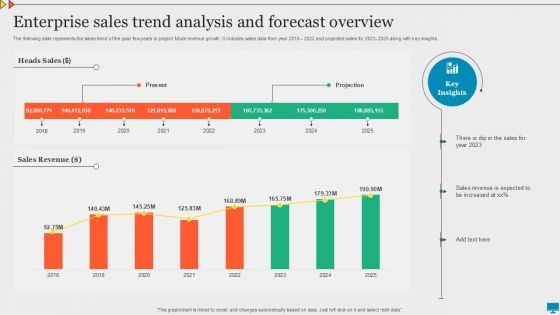
Enterprise Sales Trend Analysis And Forecast Overview Summary PDF
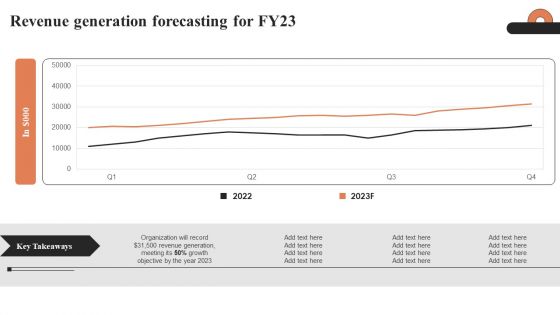
Revenue Generation Forecasting For Fy23 Ppt Portfolio Gallery PDF
Coming up with a presentation necessitates that the majority of the effort goes into the content and the message you intend to convey. The visuals of a PowerPoint presentation can only be effective if it supplements and supports the story that is being told. Keeping this in mind our experts created Revenue Generation Forecasting For Fy23 Ppt Portfolio Gallery PDF to reduce the time that goes into designing the presentation. This way, you can concentrate on the message while our designers take care of providing you with the right template for the situation.
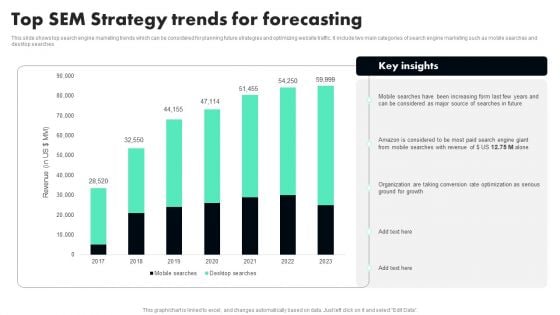
Top SEM Strategy Trends For Forecasting Microsoft PDF
This slide shows top search engine marketing trends which can be considered for planning future strategies and optimizing website traffic. It include two main categories of search engine marketing such as mobile searches and desktop searches. Showcasing this set of slides titled Top SEM Strategy Trends For Forecasting Microsoft PDF. The topics addressed in these templates are Revenue, Major Source, Ground For Growth. All the content presented in this PPT design is completely editable. Download it and make adjustments in color, background, font etc. as per your unique business setting.
Stock Photo Business Marketing Strategy 3d Man With Flag Stock Photo Photos
Disregard Any Foreboding With Our stock photo business marketing strategy 3d man with flag stock photo photos. They Ensure A Bright Forecast. Our Travel Can Be Very Arousing. Develop On The Drive In Them To Excel.
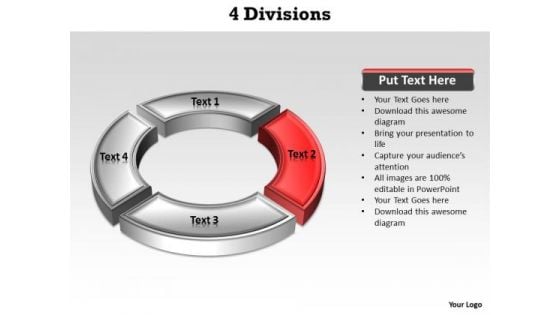
Ppt Red Division Illustrating Second Issue PowerPoint Templates
PPT red division illustrating second issue PowerPoint Templates-This PowerPoint Diagram consists of four divisions forming a circle. This Diagram explains one issue using Red part of division. It signifies disjuncture, disporting, distinguishing, distribution, disunion, conflict, dispute, dissonance etc.-Can be used for presentations on abstract, blank, business, chart, circular, circulation, cycle, design, diagram, empty, executive, icon, illustration, management, model, numbers, organization, procedure, process, resource-PPT red division illustrating second issue PowerPoint Templates Ensure a deal with our Ppt Red Division Illustrating Second Issue PowerPoint Templates. Profits will surely ensue.
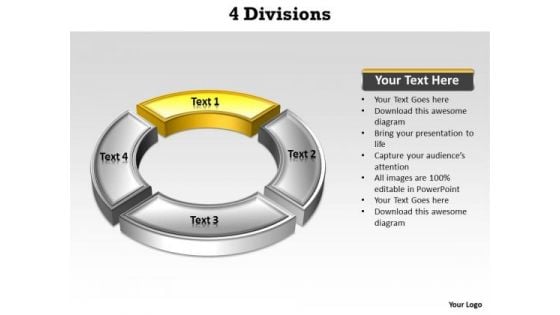
Ppt Yellow Division Illustrating One Issue PowerPoint Templates
PPT yellow division illustrating one issue PowerPoint Templates-This PowerPoint Diagram consists of four divisions forming a circle. This Diagram explains one issue using Yellow part of division. It signifies disjuncture, disporting, distinguishing, distribution, disunion, conflict, dispute, dissonance etc.-Can be used for presentations on abstract, blank, business, chart, circular, circulation, cycle, design, diagram, empty, executive, icon, illustration, management, model, numbers, organization, procedure, process, resource-PPT yellow division illustrating one issue PowerPoint Templates Our Ppt Yellow Division Illustrating One Issue PowerPoint Templates encourage economy of effort. Make it easier to bear the burden.
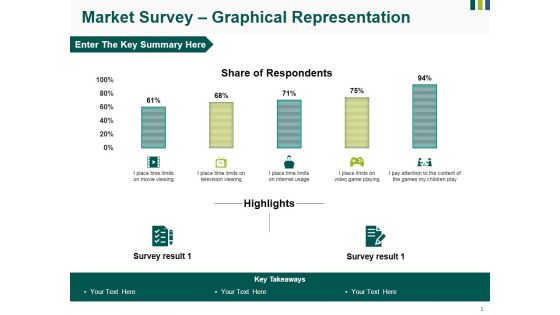
Market Survey Graphical Representation Ppt PowerPoint Presentation Gallery Pictures
This is a market survey graphical representation ppt powerpoint presentation gallery pictures. This is a five stage process. The stages in this process are business, marketing, finance, shares of market, growth strategy.
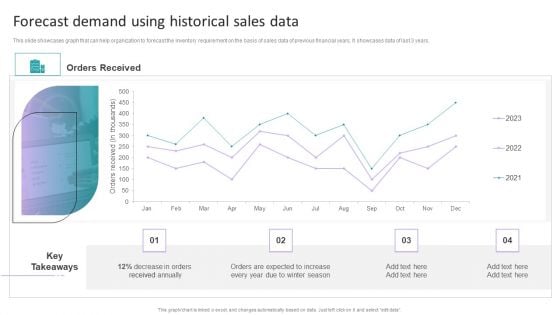
Stock Inventory Acquisition Forecast Demand Using Historical Sales Data Themes PDF
This slide showcases graph that can help organization to forecast the inventory requirement on the basis of sales data of previous financial years. It showcases data of last 3 years. This Stock Inventory Acquisition Forecast Demand Using Historical Sales Data Themes PDF from Slidegeeks makes it easy to present information on your topic with precision. It provides customization options, so you can make changes to the colors, design, graphics, or any other component to create a unique layout. It is also available for immediate download, so you can begin using it right away. Slidegeeks has done good research to ensure that you have everything you need to make your presentation stand out. Make a name out there for a brilliant performance.
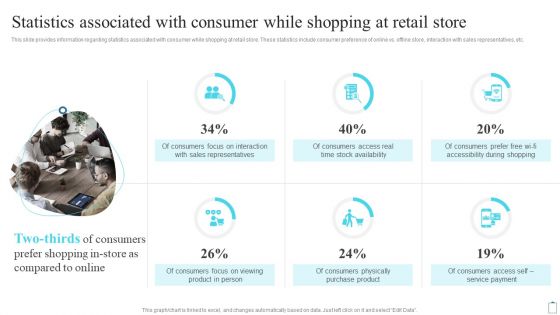
Statistics Associated With Consumer While Shopping At Retail Store Customer Engagement Administration Topics PDF
Are you searching for a Statistics Associated With Consumer While Shopping At Retail Store Customer Engagement Administration Topics PDF that is uncluttered, straightforward, and original Its easy to edit, and you can change the colors to suit your personal or business branding. For a presentation that expresses how much effort you ve put in, this template is ideal With all of its features, including tables, diagrams, statistics, and lists, its perfect for a business plan presentation. Make your ideas more appealing with these professional slides. Download Statistics Associated With Consumer While Shopping At Retail Store Customer Engagement Administration Topics PDF from Slidegeeks today.
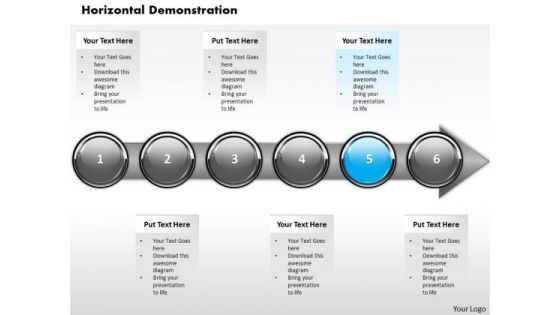
Ppt Consistent Demonstration Of Financial Process Using Stage 5 PowerPoint Templates
PPT consistent demonstration of financial process using stage 5 PowerPoint Templates-Highlight the key components of your entire financial process. Illustrate how each element flows seamlessly onto the next stage.-PPT consistent demonstration of financial process using stage 5 PowerPoint Templates-Abstract, Achievement, Aim, Arrow, Background, Business, Chart, Communication, Company, Competition, Concept, Design, Development, Diagram, Direction, Finance, Financial, Forecast, Forward, Goal, Graph, Graphic, Growth, Icon, Illustration, Increase, Investment, Leader, Leadership, Marketing, Motion, Moving, Orange, Path, Price, Process, Profit, Progress, Shape, Sign, Success, Symbol, Target, Team, Teamwork, Up, Upwards Crush your competition with our Ppt Consistent Demonstration Of Financial Process Using Stage 5 PowerPoint Templates. Just download, type and present.
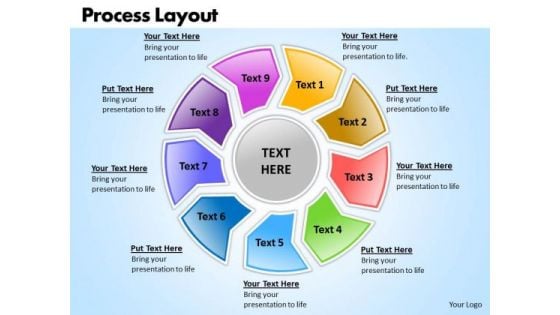
Ppt Circular Nursing Process PowerPoint Presentation Layout Templates
PPT circular nursing process powerpoint presentation layout Templates-This PowerPoint Diagram shows nine Text Boxes together placed to form a circle. This Diagram can be used to show complex processes. This can be used for Presentations on circuitous, complicated, composite, compound, compounded, confused, conglomerate, convoluted, elaborate, entangled etc. An excellent graphic to attract the attention of your audience to improve earnings.-PPT circular nursing process powerpoint presentation layout Templates-Arrow, Art, Blue, Business, Button, Circular, Clip, Design, Diagram, Drop, Element, Glowing, Graph, Graphic, Icon, Illustration, Isolated, Process, Round, Set, Shadow, Sphere, Symbol Give your audience the feast they deserve. Our Ppt Circular Nursing Process PowerPoint Presentation Layout Templates will lay out a delicious spread.
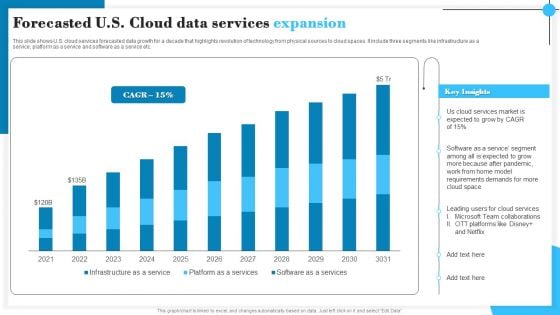
Forecasted U S Cloud Data Services Expansion Demonstration PDF
This slide shows U.S. cloud services forecasted data growth for a decade that highlights revolution of technology from physical sources to cloud spaces. It include three segments like infrastructure as a service, platform as a service and software as a service etc. Presenting Forecasted U S Cloud Data Services Expansion Demonstration PDF to dispense important information. This template comprises six stages. It also presents valuable insights into the topics including Cloud Services, Software, Team Collaborations. This is a completely customizable PowerPoint theme that can be put to use immediately. So, download it and address the topic impactfully.
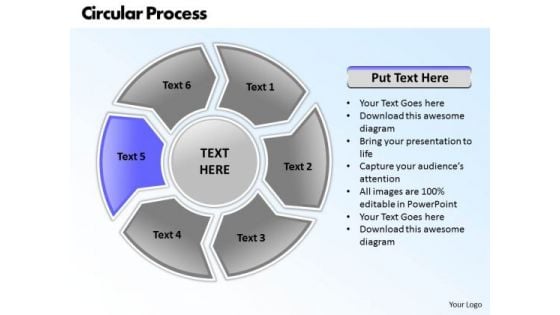
Ppt Circular Military Decision Making Process PowerPoint Presentation 6 Actions Templates
PPT circular military decision making process powerpoint presentation 6 actions Templates-Deliver amazing Presentations with our above Diagram consisting of Six sections forming a circle. It signifies different factors to be combined together to complete the process and hence leading to success. This Diagram can be used for presentations on Decision Making, Public Surveys etc. Create captivating presentations to deliver comparative and weighted arguments. You can apply other 3D Styles and shapes to the slide to enhance your presentations.-PPT circular military decision making process powerpoint presentation 6 actions Templates-Arrow, Art, Blue, Business, Button, Circular, Clip, Design, Diagram, Drop, Element, Glowing, Graph, Graphic, Icon, Illustration, Isolated, Process, Round, Set, Shadow, Sphere, Symbol Our Ppt Circular Military Decision Making Process PowerPoint Presentation 6 Actions Templates compare to a classic dessert. Your audience will have their cake and eat it too.
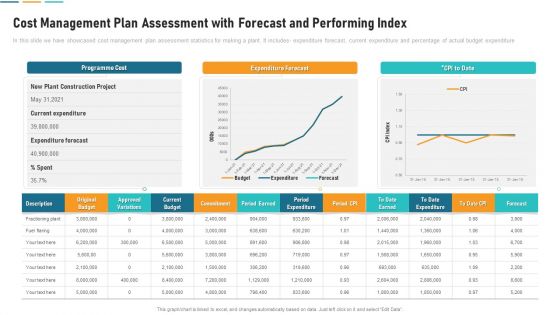
Cost Management Plan Assessment With Forecast And Performing Index Demonstration PDF
In this slide we have showcased cost management plan assessment statistics for making a plant. It includes- expenditure forecast, current expenditure and percentage of actual budget expenditure. Showcasing this set of slides titled cost management plan assessment with forecast and performing index demonstration pdf. The topics addressed in these templates are current expenditure, expenditure forecast, construction project. All the content presented in this PPT design is completely editable. Download it and make adjustments in color, background, font etc. as per your unique business setting.
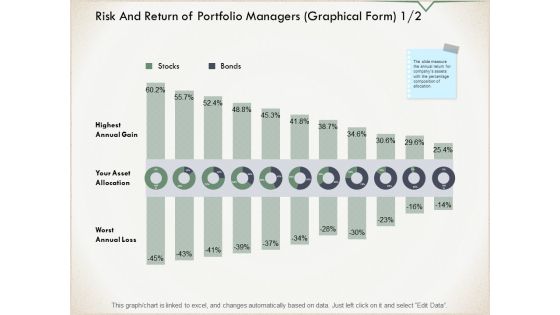
Risk And Return Of Portfolio Managers Graphical Form Chart Ppt PowerPoint Presentation Infographic Template Slides
Presenting this set of slides with name risk and return of portfolio managers graphical form chart ppt powerpoint presentation infographic template slides. The topics discussed in these slides are marketing, business, management, planning, strategy. This is a completely editable PowerPoint presentation and is available for immediate download. Download now and impress your audience.
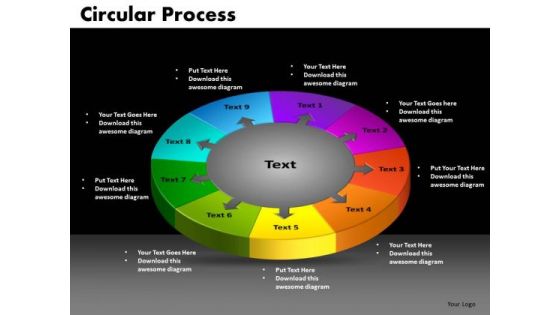
PowerPoint Slide Circular Process Teamwork Ppt Design
PowerPoint Slide Circular Process Teamwork PPT Design-Highlight the key components of your entire manufacturing/ business process. Illustrate how each element flows seamlessly onto the next stage. Emphasise on any critical or key factors within them. Demonstrate how they all combine to form the final product-PowerPoint Slide Circular Process Teamwork PPT Design-This ppt can be used for presentations relating to-Abstract, Arrow, Blank, Business, Chart, Circular, Circulation, Concept, Conceptual, Cycle, Design, Diagram, Empty, Executive, Icon, Illustration, Management, Mba, Model, Numbers, Organization, Procedure, Process Set an example with your views. Place the bar with our PowerPoint Slide Circular Process Teamwork Ppt Design.
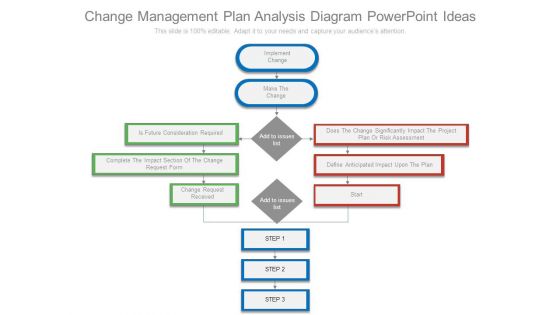
Change Management Plan Analysis Diagram Powerpoint Ideas
This is a change management plan analysis diagram powerpoint ideas. This is a eleven stage process. The stages in this process are implement change, make the change, is future consideration required, complete the impact section of the change request form, change request received, add to issues list, does the change significantly impact the project plan or risk assessment, define anticipated impact upon the plan, start, step.
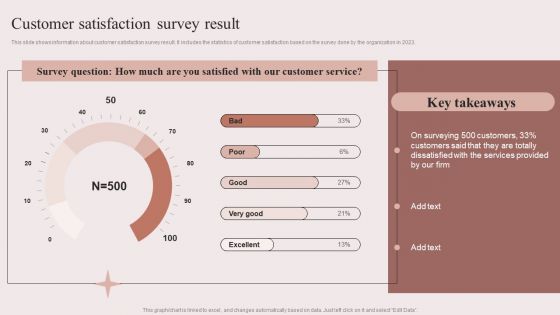
Enhancing Retail Process By Effective Inventory Management Customer Satisfaction Survey Result Graphics PDF
This slide shows information about customer satisfaction survey result. It includes the statistics of customer satisfaction based on the survey done by the organization in 2023. Get a simple yet stunning designed Enhancing Retail Process By Effective Inventory Management Customer Satisfaction Survey Result Graphics PDF. It is the best one to establish the tone in your meetings. It is an excellent way to make your presentations highly effective. So, download this PPT today from Slidegeeks and see the positive impacts. Our easy to edit Enhancing Retail Process By Effective Inventory Management Customer Satisfaction Survey Result Graphics PDF can be your go to option for all upcoming conferences and meetings. So, what are you waiting for Grab this template today.

Business Checklist Vector With Text Holders Ppt Powerpoint Presentation Ideas Elements
This is a business checklist vector with text holders ppt powerpoint presentation ideas elements. This is a three stage process. The stages in this process are checkbox, ballot box, tick box.
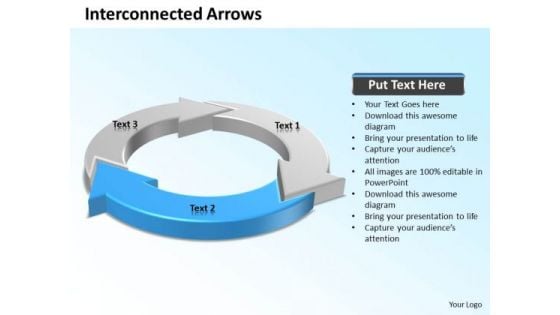
Ppt Blue Arrow Pointer Inwards Circle PowerPoint Templates
PPT blue arrow Pointer inwards circle PowerPoint Templates-This PowerPoint Diagram shows four blue curved arrows combining together to form a kite. It is helpful to describe interrelated issues, Approaches or Methods. It imitates alternation, chain, circle, circuit, course, loop, period, periodicity, revolution, rhythm, ring, rotation, round, run, sequel, sequence, series, succession etc.-Can be used for presentations on arrow, business, clip-art, communication, computer, concept, connect, connection, data, design, earth, electronics, elements, global, icons, illustration, interconnect, internet, isolated, network, node, pc, satellite, sphere, symbol, system, technology, telephone, world, worldwide-PPT blue arrow Pointer inwards circle PowerPoint Templates Our Ppt Blue Arrow Pointer Inwards Circle PowerPoint Templates are quite elevating.They help you ascend the ladder of success.
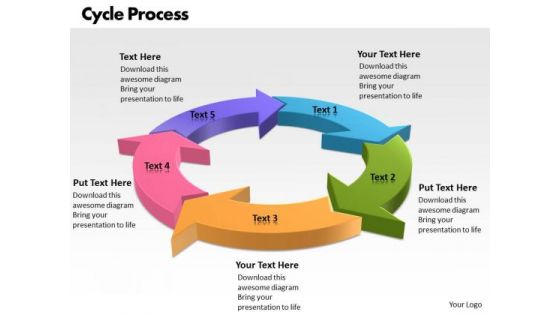
Ppt Factors Of Cycle Communication Process PowerPoint Presentation 5 Stages Templates
PPT factors of cycle communication process powerpoint presentation 5 stages Templates-Use this PowerPoint Diagram to explain the cycle process for communication purpose. It shows five stages attached to each other to form an interconnected Mechanism. It symbolizes affiliation, affinity, alliance, association, connection etc.-PPT factors of cycle communication process powerpoint presentation 5 stages Templates-Cycle, Process, 5 Stages, Arrows, Background, Beautiful, Bright, Business, Circle, Collection, Color, Colorful, Concentric, Concept, Element, Graphic, Green, Group, Icon, Illustration, Image, Render, Round, Sample, Shape, Solution, Style, Success, Symbol, Technology, Wheel Exceed expectations with our Ppt Factors Of Cycle Communication Process PowerPoint Presentation 5 Stages Templates. You will come out on top.
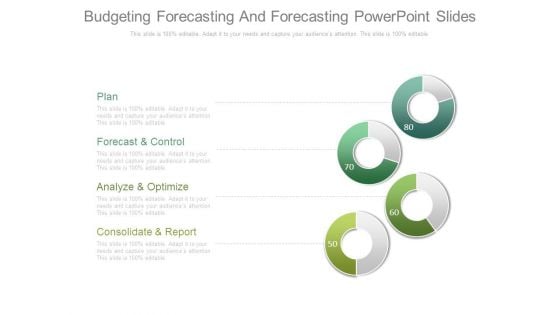
Budgeting Forecasting And Forecasting Powerpoint Slides
This is a budgeting forecasting and forecasting powerpoint slides. This is a four stage process. The stages in this process are plan, forecast and control, analyze and optimize, consolidate and report.
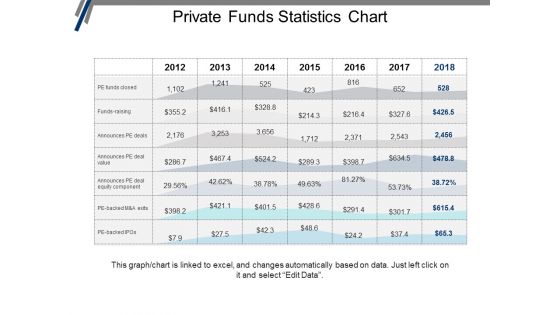
Private Funds Statistics Chart Ppt PowerPoint Presentation Portfolio Graphics Design
This is a private funds statistics chart ppt powerpoint presentation portfolio graphics design. This is a seven stage process. The stages in this process are investment, funding, private equity, venture capital.
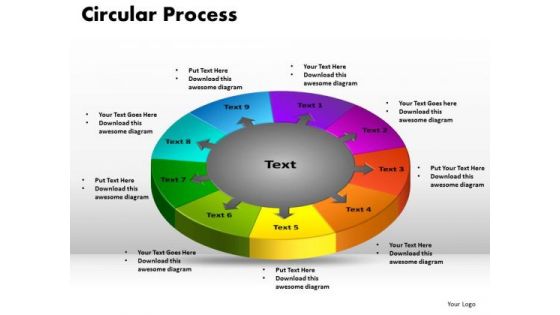
PowerPoint Design Arrows Circular Process Company Ppt Template
PowerPoint Design Arrows Circular Process Company PPT Template-Highlight the key components of your entire manufacturing/ business process. Illustrate how each element flows seamlessly onto the next stage. Emphasise on any critical or key factors within them. Demonstrate how they all combine to form the final product-PowerPoint Design Arrows Circular Process Company PPT Template-This ppt can be used for presentations relating to-Abstract, Arrow, Blank, Business, Chart, Circular, Circulation, Concept, Conceptual, Cycle, Design, Diagram, Empty, Executive, Icon, Illustration, Management, Mba, Model, Numbers, Organization, Procedure, Process Prove yourself with our PowerPoint Design Arrows Circular Process Company Ppt Template. Dont pass up this opportunity to shine.
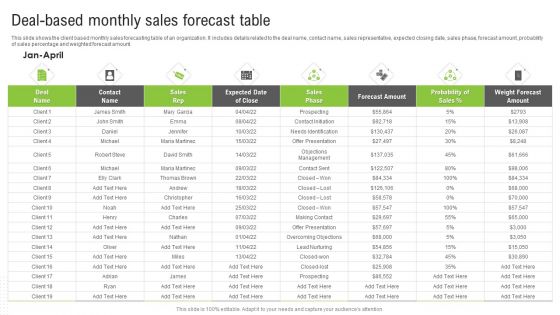
Deal Based Monthly Sales Forecast Table Ppt Portfolio Template PDF
This slide shows the client based monthly sales forecasting table of an organization. It includes details related to the deal name, contact name, sales representative, expected closing date, sales phase, forecast amount, probability of sales percentage and weighted forecast amount. Pitch your topic with ease and precision using this Deal Based Monthly Sales Forecast Table Ppt Portfolio Template PDF. This layout presents information on Sales Rep, Forecast Amount, Weight Forecast Amount. It is also available for immediate download and adjustment. So, changes can be made in the color, design, graphics or any other component to create a unique layout.
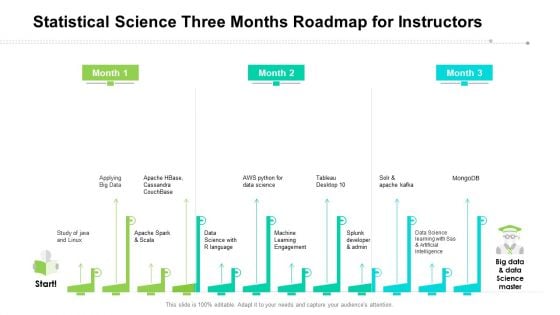
Statistical Science Three Months Roadmap For Instructors Diagrams
Presenting our jaw dropping statistical science three months roadmap for instructors diagrams. You can alternate the color, font size, font type, and shapes of this PPT layout according to your strategic process. This PPT presentation is compatible with Google Slides and is available in both standard screen and widescreen aspect ratios. You can also download this well researched PowerPoint template design in different formats like PDF, JPG, and PNG. So utilize this visually appealing design by clicking the download button given below.
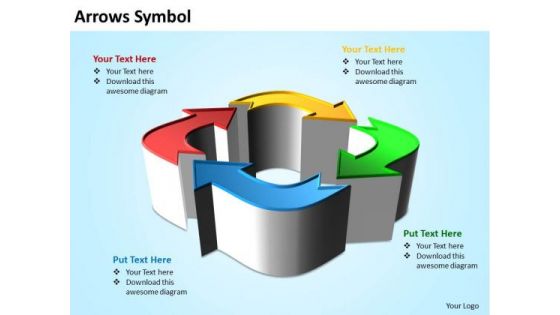
Ppt 3d Arrows Symbol Operations Management PowerPoint Templates
PPT 3d arrows symbol operations management powerpoint Templates-This PowerPoint Diagram Shows 3D Arrows making Square like Object. This Colorful 3D Arrow Diagram will let you explain four different paths to reach the Destination. It signifies the Concept of Recycling, Reuse, Environment etc.-PPT 3d arrows symbol operations management powerpoint Templates Deliver your ideas decisively with our Ppt 3d Arrows Symbol Operations Management PowerPoint Templates. They help you look the audience in the eye.
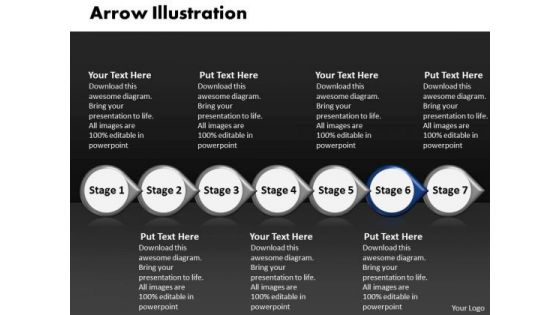
Ppt Arrow Example Of Mechanism Using 7 Stages PowerPoint Templates
PPT arrow example of mechanism using 7 stages PowerPoint Templates-This PowerPoint Diagram represents controls and mechanisms. Use it to illustrate a stepwise process or a phase structure.-PPT arrow example of mechanism using 7 stages PowerPoint Templates-3d, Abstract, Advertisement, Aim, Arrow, Business, Circular, Cursor, Direction, Down, Environment, Form, Glossy, Graphic, Icon, Illustration, Information, Mark, Motion, Perspective, Point, Sale, Shadow, Shape, Shiny, Sign Acquire the endorsement of the audience. The use of our Ppt Arrow Example Of Mechanism Using 7 Stages PowerPoint Templates will go in your favour.
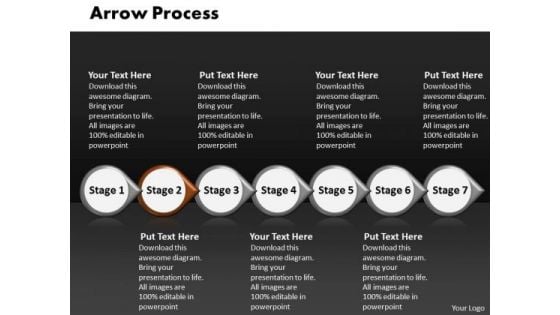
Ppt Arrow Illustration Of Process Using 7 Power Point Stage PowerPoint Templates
PPT arrow illustration of process using 7 power point stage PowerPoint Templates-This PowerPoint Diagram represents controls and mechanisms. Use it to illustrate a stepwise process or a phase structure.-PPT arrow illustration of process using 7 power point stage PowerPoint Templates-3d, Abstract, Advertisement, Aim, Arrow, Business, Circular, Cursor, Direction, Down, Environment, Form, Glossy, Graphic, Icon, Illustration, Information, Mark, Motion, Perspective, Point, Sale, Shadow, Shape, Shiny, Sign Do your bit for the environment. Advise others also with our Ppt Arrow Illustration Of Process Using 7 Power Point Stage PowerPoint Templates.
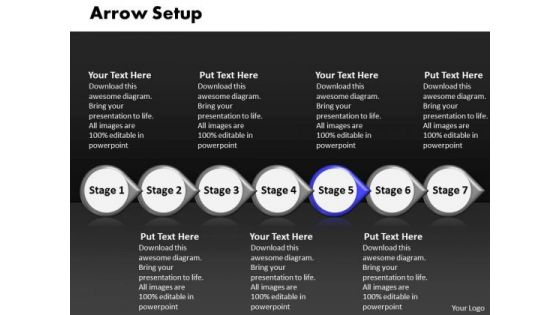
Ppt Arrow Illustration Of Set Up Using 7 Stages PowerPoint Templates
PPT arrow illustration of set up using 7 stages PowerPoint Templates-This PowerPoint Diagram represents controls and mechanisms. Use it to illustrate a stepwise process or a phase structure.-PPT arrow illustration of set up using 7 stages PowerPoint Templates-3d, Abstract, Advertisement, Aim, Arrow, Business, Circular, Cursor, Direction, Down, Environment, Form, Glossy, Graphic, Icon, Illustration, Information, Mark, Motion, Perspective, Point, Sale, Shadow, Shape, Shiny, Sign Our Ppt Arrow Illustration Of Set Up Using 7 Stages PowerPoint Templates will enhance your faith. You will believe in your ability.
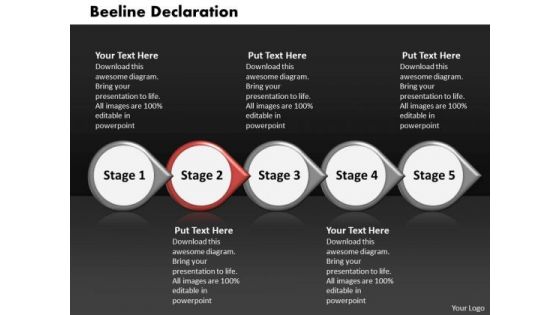
Ppt Beeline Declaration Of 5 Stages Using Curved Arrows PowerPoint 2010 Templates
PPT beeline declaration of 5 stages using curved arrows powerpoint 2010 Templates-This PowerPoint Diagram represents controls and mechanisms. Use it to illustrate a stepwise process or a phase structure.-PPT beeline declaration of 5 stages using curved arrows powerpoint 2010 Templates-3d, Abstract, Advertisement, Aim, Arrow, Business, Circular, Cursor, Direction, Down, Environment, Form, Glossy, Graphic, Icon, Illustration, Information, Mark, Motion, Perspective, Point, Sale, Shadow, Shape, Shiny, Sign Transition to a better presentation with our Ppt Beeline Declaration Of 5 Stages Using Curved Arrows PowerPoint 2010 Templates. Download without worries with our money back guaranteee.
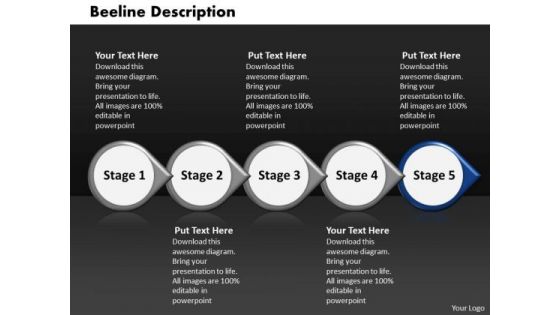
Ppt Beeline Description Of 5 Stages Using Circular Arrows PowerPoint 2010 Templates
PPT beeline description of 5 stages using circular arrows powerpoint 2010 Templates-This PowerPoint Diagram represents controls and mechanisms. Use it to illustrate a stepwise process or a phase structure.-PPT beeline description of 5 stages using circular arrows powerpoint 2010 Templates-3d, Abstract, Advertisement, Aim, Arrow, Business, Circular, Cursor, Direction, Down, Environment, Form, Glossy, Graphic, Icon, Illustration, Information, Mark, Motion, Perspective, Point, Sale, Shadow, Shape, Shiny, Sign Our Ppt Beeline Description Of 5 Stages Using Circular Arrows PowerPoint 2010 Templates are exemplary contributors. They go all out to achieve the common goal.
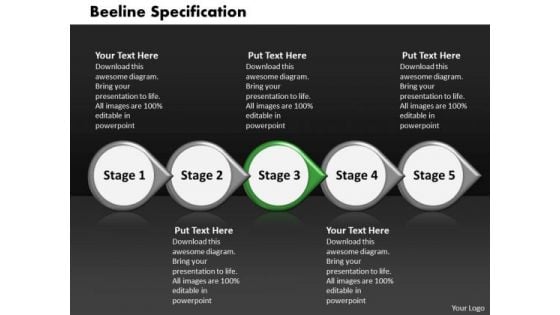
Ppt Beeline Specification Of 5 Stages Using Curved Arrows PowerPoint 2010 Templates
PPT beeline specification of 5 stages using curved arrows powerpoint 2010 Templates-This PowerPoint Diagram represents controls and mechanisms. Use it to illustrate a stepwise process or a phase structure.-PPT beeline specification of 5 stages using curved arrows powerpoint 2010 Templates-3d, Abstract, Advertisement, Aim, Arrow, Business, Circular, Cursor, Direction, Down, Environment, Form, Glossy, Graphic, Icon, Illustration, Information, Mark, Motion, Perspective, Point, Sale, Shadow, Shape, Shiny, Sign Deliver your address faultlessly. Our Ppt Beeline Specification Of 5 Stages Using Curved Arrows PowerPoint 2010 Templates ensure smooth and seamless flow.
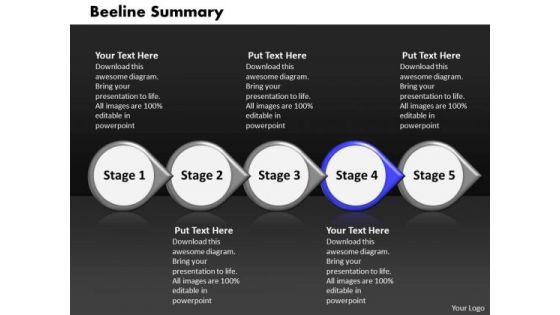
Ppt Beeline Summary Of 5 Stages Using Arrows PowerPoint Templates
PPT beeline summary of 5 stages using arrows PowerPoint Templates-This PowerPoint Diagram represents controls and mechanisms. Use it to illustrate a stepwise process or a phase structure.-PPT beeline summary of 5 stages using arrows PowerPoint Templates-3d, Abstract, Advertisement, Aim, Arrow, Business, Circular, Cursor, Direction, Down, Environment, Form, Glossy, Graphic, Icon, Illustration, Information, Mark, Motion, Perspective, Point, Sale, Shadow, Shape, Shiny, Sign Make your presentation in a hurry with our Ppt Beeline Summary Of 5 Stages Using Arrows PowerPoint Templates. Make sure your presentation gets the attention it deserves.
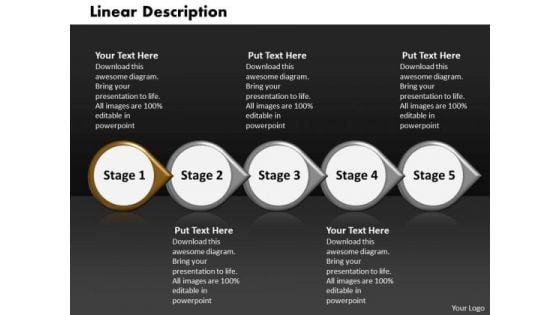
Ppt Linear Description Of 5 Power Point Stage Using Arrows Layouts PowerPoint Templates
PPT linear description of 5 power point stage using arrows layouts PowerPoint Templates-This PowerPoint Diagram represents controls and mechanisms. Use it to illustrate a stepwise process or a phase structure.-PPT linear description of 5 power point stage using arrows layouts PowerPoint Templates-3d, Abstract, Advertisement, Aim, Arrow, Business, Circular, Cursor, Direction, Down, Environment, Form, Glossy, Graphic, Icon, Illustration, Information, Mark, Motion, Perspective, Point, Sale, Shadow, Shape, Shiny, Sign Our Ppt Linear Description Of 5 Power Point Stage Using Arrows Layouts PowerPoint Templates are in the business of asset building. They are committed to empowering clients.

Ppt Straight Description Of 5 Stages Using PowerPoint Graphics Arrows Templates
PPT straight description of 5 stages using powerpoint graphics arrows Templates-This PowerPoint Diagram represents controls and mechanisms. Use it to illustrate a stepwise process or a phase structure.-PPT straight description of 5 stages using powerpoint graphics arrows Templates-3d, Abstract, Advertisement, Aim, Arrow, Business, Circular, Cursor, Direction, Down, Environment, Form, Glossy, Graphic, Icon, Illustration, Information, Mark, Motion, Perspective, Point, Sale, Shadow, Shape, Shiny, Sign Convey your message in an exact manner. Enable accuracy with our Ppt Straight Description Of 5 Stages Using PowerPoint Graphics Arrows Templates.
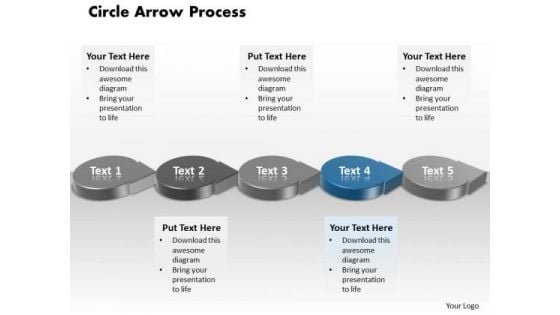
Ppt Blue Circle Arrow Process Flow Ishikawa Diagram PowerPoint Template Templates
PPT blue circle arrow process flow ishikawa diagram powerpoint template Templates-Use this Amazing PowerPoint Diagram to represent five different aspects of life, Business etc. This PowerPoint Diagram shows five Circular Arrows connected to each other. It signifies appearance, attitude, bearing, condition, countenance, demeanor, expression, form, look, manner, mien etc.-PPT blue circle arrow process flow ishikawa diagram powerpoint template Templates-3d, Advertisement, Advertising, Arrow, Border, Business, Circles, Collection, Customer, Design, Element, Icon, Idea, Illustration, Info, Information, Isolated, Label, Light, Location, Needle, New, Notification, Notify, Point, Pointer, Promotion, Role, Rounded With our Ppt Blue Circle Arrow Process Flow Ishikawa Diagram PowerPoint Template Templates your plans will never fall apart. They assist in maintaining close control.
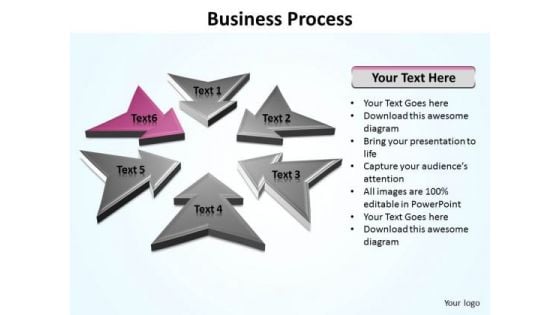
Ppt Direction Arrows Of World Business PowerPoint Templates Process Editable
PPT direction arrows of world business powerpoint templates process editable-Use this arrow diagram to make a brainstorming of the relevant factors that apply to you organization.Summarize with your own conclusions about information.-PPT direction arrows of world business powerpoint templates process editable-Abstract, Achievement, Aim, Arrow, Background, Business, Chart, Communication, Competition, Concept, Design, Direction, Development, Diagram, Direction, Finance, Financial, Forecast, Forward, Goal, Graph, Graphic, Growth, Icon, Illustration, Increase, Investment, Leader, Leadership, Design, Marketing, Price, Process, Profit, Progress, Progress, Shape, Sign, Success, Symbol, Target, Team, Teamwork With our Ppt Direction Arrows Of World Business PowerPoint Templates Process Editable you won't have to feel your way. They will strike a chord straightaway.
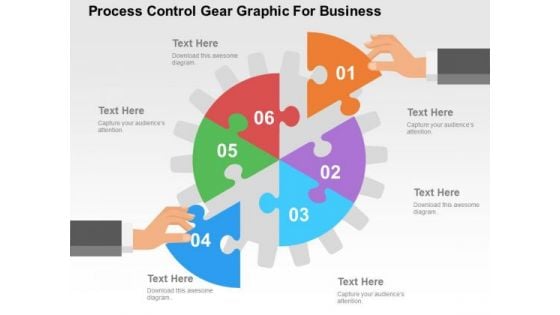
Process Control Gear Graphic For Business PowerPoint Template
Our professionally designed gear diagram is as an effective tool for communicating ideas. It contains graphics of gear with six segments. Convey your views with this diagram slide. It will amplify the strength of your logic.
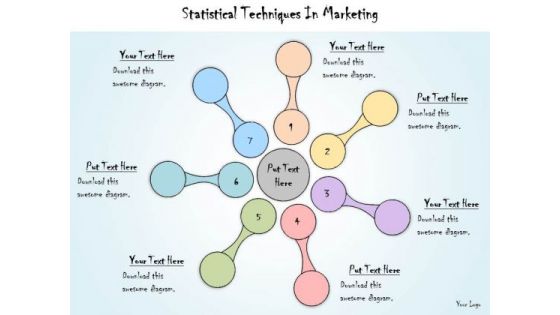
Ppt Slide Statistical Techniques In Marketing 7 Stages Consulting Firms
Break The Deadlock With Our PPT Slide Statistical Techniques In Marketing 7 Stages Consulting Firms Powerpoint Templates. Let The Words Start To Flow.

Achievement And Loss Diagram For Expense Account Forms Ppt PowerPoint Presentation Gallery Graphics PDF
Presenting achievement and loss diagram for expense account forms ppt powerpoint presentation gallery graphics pdf to dispense important information. This template comprises two stages. It also presents valuable insights into the topics including achievement and loss diagram for expense account forms. This is a completely customizable PowerPoint theme that can be put to use immediately. So, download it and address the topic impactfully.
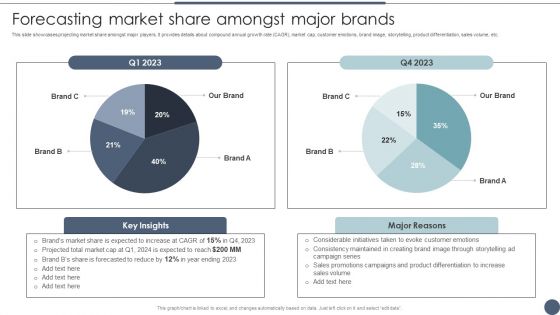
Forecasting Market Share Amongst Major Brands Utilizing Emotional And Rational Branding For Improved Consumer Themes PDF
This slide showcases projecting market share amongst major players. It provides details about compound annual growth rate CAGR, market cap, customer emotions, brand image, storytelling, product differentiation, sales volume, etc. This modern and well-arranged Forecasting Market Share Amongst Major Brands Utilizing Emotional And Rational Branding For Improved Consumer Themes PDF provides lots of creative possibilities. It is very simple to customize and edit with the Powerpoint Software. Just drag and drop your pictures into the shapes. All facets of this template can be edited with Powerpoint no extra software is necessary. Add your own material, put your images in the places assigned for them, adjust the colors, and then you can show your slides to the world, with an animated slide included.
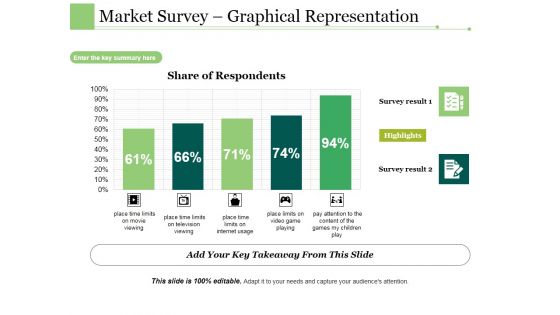
Market Survey Graphical Representation Ppt PowerPoint Presentation Ideas Show
This is a market survey graphical representation ppt powerpoint presentation ideas show. This is a five stage process. The stages in this process are place time limits on movie viewing, place time limits on television viewing, place time limits on internet usage, place limits on video game playing, pay attention to the content of the games my children play.


 Continue with Email

 Home
Home


