Circle Chart
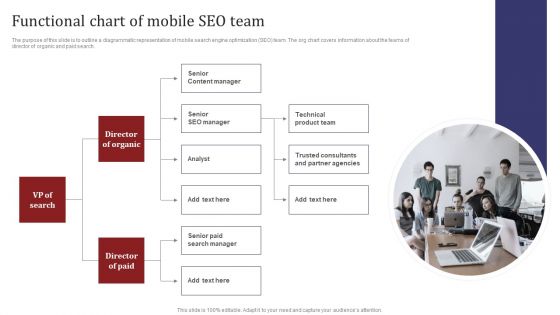
Mobile Search Engine Optimization Plan Functional Chart Of Mobile SEO Team Structure PDF
Want to ace your presentation in front of a live audience Our Mobile Search Engine Optimization Plan Functional Chart Of Mobile SEO Team Structure PDF can help you do that by engaging all the users towards you. Slidegeeks experts have put their efforts and expertise into creating these impeccable powerpoint presentations so that you can communicate your ideas clearly. Moreover, all the templates are customizable, and easy to edit and downloadable. Use these for both personal and commercial use.
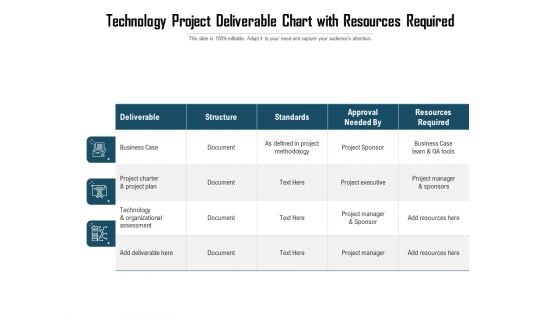
Technology Project Deliverable Chart With Resources Required Ppt PowerPoint Presentation Infographics Structure PDF
Showcasing this set of slides titled technology project deliverable chart with resources required ppt powerpoint presentation infographics structure pdf. The topics addressed in these templates are business case, project charter and project plan, technology and organizational assessment, resources required. All the content presented in this PPT design is completely editable. Download it and make adjustments in color, background, font etc. as per your unique business setting.
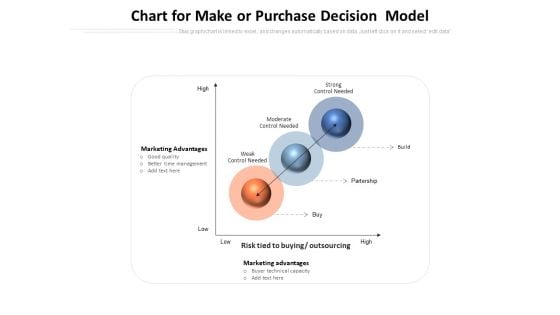
Chart For Make Or Purchase Decision Model Ppt PowerPoint Presentation Portfolio Structure PDF
Presenting this set of slides with name chart for make or purchase decision model ppt powerpoint presentation portfolio structure pdf. This is a three stage process. The stages in this process are marketing advantages, risk tied to buying, outsourcing, strong control needed, moderate control needed, weak control needed. This is a completely editable PowerPoint presentation and is available for immediate download. Download now and impress your audience.
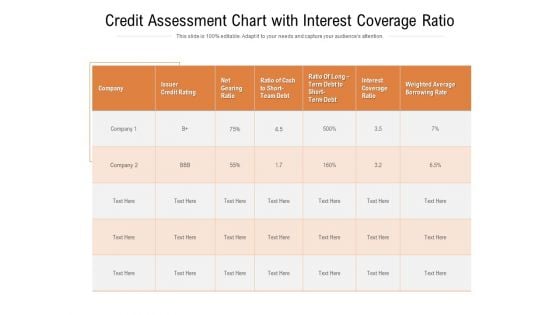
Credit Assessment Chart With Interest Coverage Ratio Ppt PowerPoint Presentation Layouts Structure PDF
Presenting this set of slides with name credit assessment chart with interest coverage ratio ppt powerpoint presentation layouts structure pdf. The topics discussed in these slides are issuer credit rating, net gearing ratio, weighted average borrowing rate, interest coverage ratio, ratio of cash to short team debt, ratio of long term debt to short term debt. This is a completely editable PowerPoint presentation and is available for immediate download. Download now and impress your audience.
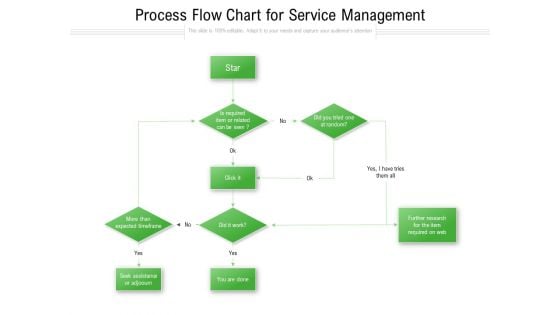
Process Flow Chart For Service Management Ppt PowerPoint Presentation Portfolio Structure PDF
Persuade your audience using this process flow chart for service management ppt powerpoint presentation portfolio structure pdf. This PPT design covers one stages, thus making it a great tool to use. It also caters to a variety of topics including more than, expected timeframe, seek assistance or adjourn, further research for the item required on web, service management. Download this PPT design now to present a convincing pitch that not only emphasizes the topic but also showcases your presentation skills.
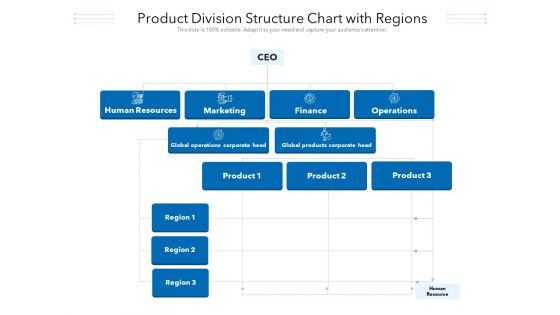
Product Division Structure Chart With Regions Ppt PowerPoint Presentation File Infographic Template PDF
Persuade your audience using this product division structure chart with regions ppt powerpoint presentation file infographic template pdf. This PPT design covers three stages, thus making it a great tool to use. It also caters to a variety of topics including marketing, finance, operations. Download this PPT design now to present a convincing pitch that not only emphasizes the topic but also showcases your presentation skills.
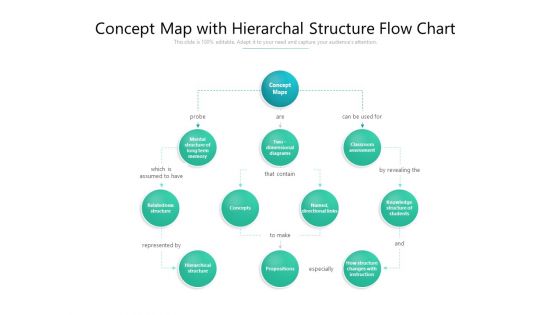
Concept Map With Hierarchal Structure Flow Chart Ppt PowerPoint Presentation File Professional PDF
Persuade your audience using this concept map with hierarchal structure flow chart ppt powerpoint presentation file professional pdf. This PPT design covers one stages, thus making it a great tool to use. It also caters to a variety of topics including hierarchical, propositions, contain. Download this PPT design now to present a convincing pitch that not only emphasizes the topic but also showcases your presentation skills.
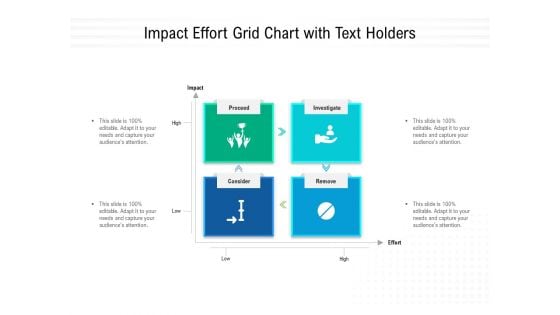
Impact Effort Grid Chart With Text Holders Ppt PowerPoint Presentation Gallery Structure PDF
Persuade your audience using this impact effort grid chart with text holders ppt powerpoint presentation gallery structure pdf. This PPT design covers four stages, thus making it a great tool to use. It also caters to a variety of topics including proceed, investigate, consider, remove. Download this PPT design now to present a convincing pitch that not only emphasizes the topic but also showcases your presentation skills.
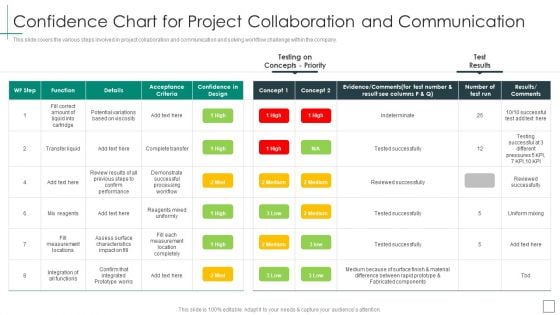
Cross Functional Teams Collaboration Confidence Chart For Project Collaboration Structure PDF
This slide covers the various steps involved in project collaboration and communication and solving workflow challenge within the company. Deliver an awe inspiring pitch with this creative Cross Functional Teams Collaboration Confidence Chart For Project Collaboration Structure PDF bundle. Topics like Acceptance Criteria Details, Potential Variations Based, Reagents Mixed Uniformly can be discussed with this completely editable template. It is available for immediate download depending on the needs and requirements of the user.
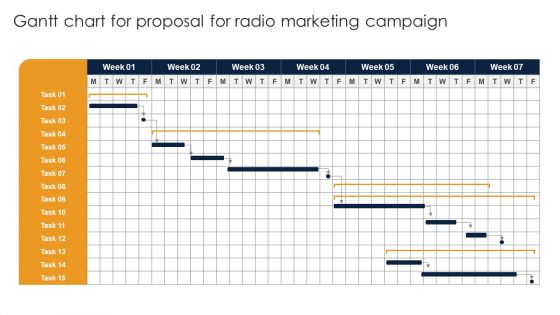
Gantt Chart For Proposal For Radio Marketing Campaign Ppt Layouts Structure PDF
Take your presentations to the next level with our Gantt Chart For Proposal For Radio Marketing Campaign Ppt Layouts Structure PDF template. With its sleek design and seamless editing features, this single-slide PPT template is a game-changer for professionals who want to make an impact. Impress your audience with stunning visuals and engaging content that will capture their attention from start to finish. Get your hands on our template and elevate your presentations to new heights.
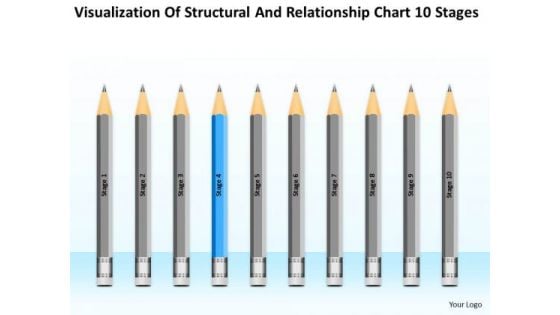
Structural And Relationship Chart 10 Stages Ppt Business Plan Steps PowerPoint Templates
We present our structural and relationship chart 10 stages ppt business plan steps PowerPoint templates.Use our Education PowerPoint Templates because You can Double your output with our PowerPoint Templates and Slides. They make beating deadlines a piece of cake. Download and present our Process and Flows PowerPoint Templates because Our PowerPoint Templates and Slides are created by a hardworking bunch of busybees. Always flitting around with solutions gauranteed to please. Present our Arrows PowerPoint Templates because Our PowerPoint Templates and Slides are the chords of your song. String them along and provide the lilt to your views. Present our Business PowerPoint Templates because Our PowerPoint Templates and Slides are aesthetically designed to attract attention. We gaurantee that they will grab all the eyeballs you need. Use our Shapes PowerPoint Templates because Our PowerPoint Templates and Slides ensures Effective communication. They help you put across your views with precision and clarity.Use these PowerPoint slides for presentations relating to Mark, corporate, business, plan, concept, bright, symbol, diagram, crayon, stack, graphic, finance, stock,analysis, drawing, paint, calculation, accounting, creative, economic, creativity, chart, forecast, design, color, objects, stationary, pencil, education,profit, information, background, investment, figures, ten, business, business process. The prominent colors used in the PowerPoint template are Blue, Gray, Black. Boil it down with our Structural And Relationship Chart 10 Stages Ppt Business Plan Steps PowerPoint Templates. You will come out on top.

Three Piece Pie Chart Measures Business Ppt PowerPoint Presentation Complete Deck With Slides
Improve your presentation delivery using this three piece pie chart measures business ppt powerpoint presentation complete deck with slides. Support your business vision and objectives using this well-structured PPT deck. This template offers a great starting point for delivering beautifully designed presentations on the topic of your choice. Comprising twelve this professionally designed template is all you need to host discussion and meetings with collaborators. Each slide is self-explanatory and equipped with high-quality graphics that can be adjusted to your needs. Therefore, you will face no difficulty in portraying your desired content using this PPT slideshow. This PowerPoint slideshow contains every important element that you need for a great pitch. It is not only editable but also available for immediate download and utilization. The color, font size, background, shapes everything can be modified to create your unique presentation layout. Therefore, download it now.

Gender Comparative Assessment Proportion Pie Chart Ppt PowerPoint Presentation Complete With Slides
Improve your presentation delivery using this gender comparative assessment proportion pie chart ppt powerpoint presentation complete with slides. Support your business vision and objectives using this well-structured PPT deck. This template offers a great starting point for delivering beautifully designed presentations on the topic of your choice. Comprising twelve this professionally designed template is all you need to host discussion and meetings with collaborators. Each slide is self-explanatory and equipped with high-quality graphics that can be adjusted to your needs. Therefore, you will face no difficulty in portraying your desired content using this PPT slideshow. This PowerPoint slideshow contains every important element that you need for a great pitch. It is not only editable but also available for immediate download and utilization. The color, font size, background, shapes everything can be modified to create your unique presentation layout. Therefore, download it now.
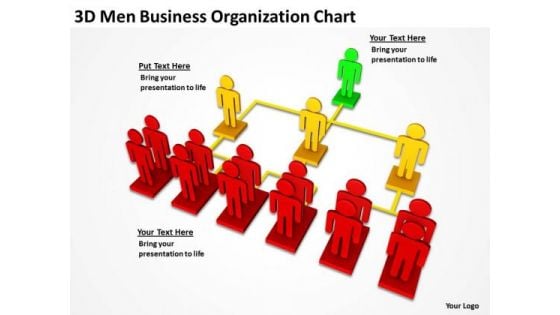
Business Process Flow Diagram Organization Chart PowerPoint Templates Ppt Backgrounds For Slides
We present our business process flow diagram organization chart PowerPoint templates PPT backgrounds for slides.Download our Communication PowerPoint Templates because Our PowerPoint Templates and Slides will let you Leave a lasting impression to your audiences. They possess an inherent longstanding recall factor. Use our Business PowerPoint Templates because you should Experience excellence with our PowerPoint Templates and Slides. They will take your breath away. Download and present our Process and Flows PowerPoint Templates because You canTake a leap off the starting blocks with our PowerPoint Templates and Slides. They will put you ahead of the competition in quick time. Download our Shapes PowerPoint Templates because You can Raise a toast with our PowerPoint Templates and Slides. Spread good cheer amongst your audience. Use our Signs PowerPoint Templates because Our PowerPoint Templates and Slides will provide weight to your words. They will bring out the depth of your thought process.Use these PowerPoint slides for presentations relating to 3d, Business, Businessman, Chart, Communication, Community, Connection, Cooperation, Corporation, Diagram, Domination, Employment, Entrepreneur, Flow, Flowchart, Graphic, Group, Hierarchy, Human, Isolated, Job, Leadership, Level, Management, Manager, Men, Network, Occupation, Office, Organization, Organized, Partnership, People, Person, Planning, Promotion, Recruitment, Relationship, Resources, Solution, Strategy, Structure, Team, Teamwork. The prominent colors used in the PowerPoint template are Green, Yellow, Red. We assure you our business process flow diagram organization chart PowerPoint templates PPT backgrounds for slides are designed by a team of presentation professionals. Use our Communication PowerPoint templates and PPT Slides provide you with a vast range of viable options. Select the appropriate ones and just fill in your text. We assure you our business process flow diagram organization chart PowerPoint templates PPT backgrounds for slides are incredible easy to use. Professionals tell us our Connection PowerPoint templates and PPT Slides look good visually. The feedback we get is that our business process flow diagram organization chart PowerPoint templates PPT backgrounds for slides are specially created by a professional team with vast experience. They diligently strive to come up with the right vehicle for your brilliant Ideas. You can be sure our Corporation PowerPoint templates and PPT Slides will generate and maintain the level of interest you desire. They will create the impression you want to imprint on your audience. Bubble up to the top with our Business Process Flow Diagram Organization Chart PowerPoint Templates Ppt Backgrounds For Slides. You will come out on top.
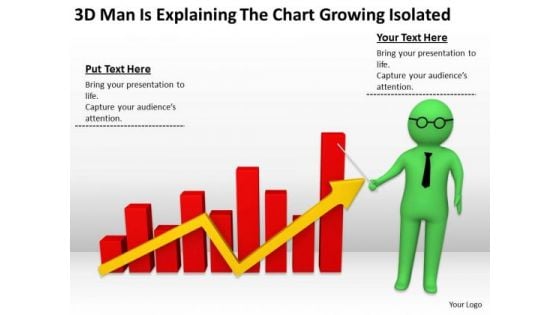
Men In Business 3d Man Is Explaining The Chart Growing Isolated PowerPoint Templates
We present our men in business 3d man is explaining the chart growing isolated PowerPoint templates.Use our People PowerPoint Templates because You can Rise to the occasion with our PowerPoint Templates and Slides. You will bring your audience on their feet in no time. Download our Business PowerPoint Templates because Our PowerPoint Templates and Slides will let Your superior ideas hit the target always and everytime. Present our Arrows PowerPoint Templates because It will Give impetus to the hopes of your colleagues. Our PowerPoint Templates and Slides will aid you in winning their trust. Use our Shapes PowerPoint Templates because You can Rise to the occasion with our PowerPoint Templates and Slides. You will bring your audience on their feet in no time. Download and present our Success PowerPoint Templates because Your success is our commitment. Our PowerPoint Templates and Slides will ensure you reach your goal.Use these PowerPoint slides for presentations relating to Arrow, below, build, business, character, chart, company, concept, corporate, figure, finance, goal, graph, graphic, growing, growth, human, idea, illustration, isolated, manager, market, men, money, office, presentation, profit, progress, puppet, rising, statistics, success, top, up, walking, win. The prominent colors used in the PowerPoint template are Green, Yellow, Red. Presenters tell us our men in business 3d man is explaining the chart growing isolated PowerPoint templates will impress their bosses and teams. Professionals tell us our concept PowerPoint templates and PPT Slides are visually appealing. Professionals tell us our men in business 3d man is explaining the chart growing isolated PowerPoint templates are aesthetically designed to attract attention. We guarantee that they will grab all the eyeballs you need. We assure you our company PowerPoint templates and PPT Slides are readymade to fit into any presentation structure. You can be sure our men in business 3d man is explaining the chart growing isolated PowerPoint templates look good visually. PowerPoint presentation experts tell us our corporate PowerPoint templates and PPT Slides are the best it can get when it comes to presenting. Play your cards well with our Men In Business 3d Man Is Explaining The Chart Growing Isolated PowerPoint Templates. Give your thoughts a good deal.
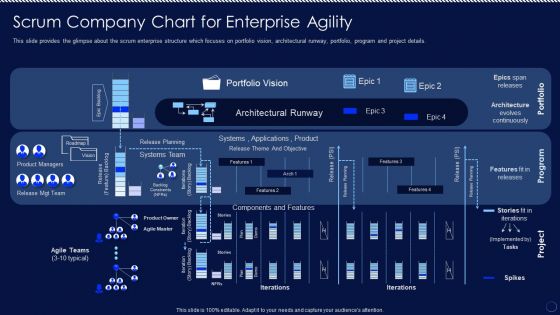
Scrum Company Chart For Enterprise Agility Ppt PowerPoint Presentation Diagram Lists PDF
This slide provides the glimpse about the scrum enterprise structure which focuses on portfolio vision, architectural runway, portfolio, program and project details. Do you have to make sure that everyone on your team knows about any specific topic I yes, then you should give Scrum Company Chart For Enterprise Agility Ppt PowerPoint Presentation Diagram Lists PDF a try. Our experts have put a lot of knowledge and effort into creating this impeccable Scrum Company Chart For Enterprise Agility Ppt PowerPoint Presentation Diagram Lists PDF. You can use this template for your upcoming presentations, as the slides are perfect to represent even the tiniest detail. You can download these templates from the Slidegeeks website and these are easy to edit. So grab these today.
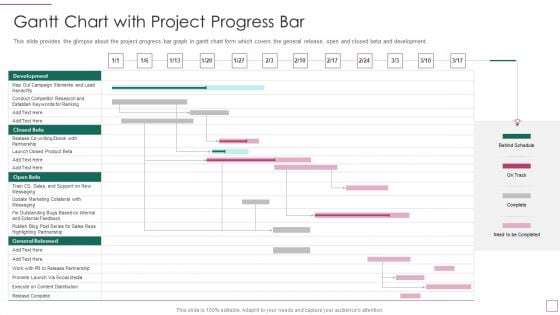
Approach Avoidance Conflict Gantt Chart With Project Progress Bar Topics PDF
This slide provides the glimpse about the project progress bar graph in gantt chart form which covers the general release, open and closed beta and development. Your complex projects can be managed and organized simultaneously using this detailed approach avoidance conflict gantt chart with project progress bar topics pdf template. Track the milestones, tasks, phases, activities, and subtasks to get an updated visual of your project. Share your planning horizon and release plan with this well crafted presentation template. This exemplary template can be used to plot various dependencies to distinguish the tasks in the pipeline and their impact on the schedules and deadlines of the project. Apart from this, you can also share this visual presentation with your team members and stakeholders. It a resourceful tool that can be incorporated into your business structure. Therefore, download and edit it conveniently to add the data and statistics as per your requirement.
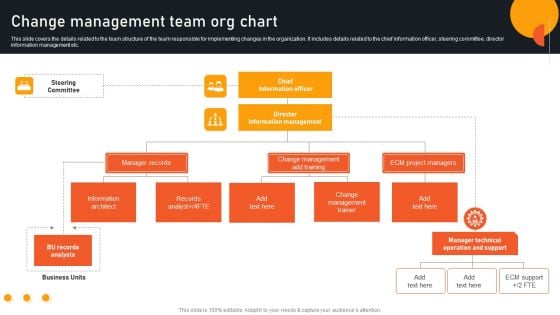
Transform Management Instruction Schedule Change Management Team Org Chart Diagrams PDF
This slide covers the details related to the team structure of the team responsible for implementing changes in the organization. It includes details related to the chief information officer, steering committee, director information management etc. Create an editable Transform Management Instruction Schedule Change Management Team Org Chart Diagrams PDF that communicates your idea and engages your audience. Whether youre presenting a business or an educational presentation, pre designed presentation templates help save time. Transform Management Instruction Schedule Change Management Team Org Chart Diagrams PDF is highly customizable and very easy to edit, covering many different styles from creative to business presentations. Slidegeeks has creative team members who have crafted amazing templates. So, go and get them without any delay.
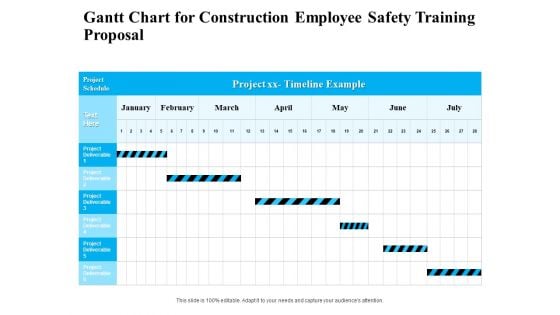
Employee Safety Health Training Program Gantt Chart For Construction Employee Training Proposal Rules PDF
Manage your complex projects and organize them simultaneously with this detailed Gantt Chart PowerPoint Template. Track your milestones, tasks, phases, activities, subtasks amongst other constituents that will give you an updated visual of your project. Reflect your planning horizon and capture your release plan in one view with this Gantt Chart PowerPoint presentation template. You can plot various dependencies directly on this Timeline PowerPoint Presentation Layout to see which tasks are still in the pipeline and how the delays in them are impacting the schedules and deadlines of the project. Apart from this, you can also share this updated visual with your team members and stakeholders, thus making it a resourceful tool to be incorporated in your business structure. Not only this but also the editable layout of this slide helps you to add your data and statistics at your convenience.
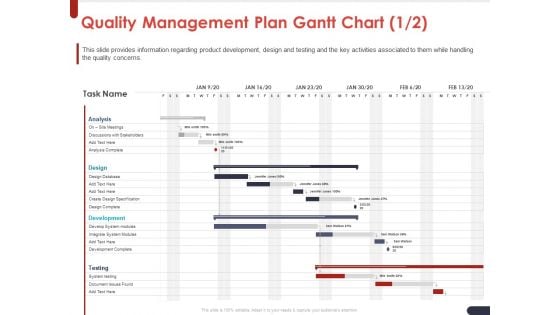
Project Quality Planning And Controlling Quality Management Plan Gantt Chart Design Mockup PDF
Manage your complex projects and organize them simultaneously with this detailed Gantt Chart PowerPoint Template. Track your milestones, tasks, phases, activities, subtasks amongst other constituents that will give you an updated visual of your project. Reflect your planning horizon and capture your release plan in one view with this Gantt Chart PowerPoint presentation template. You can plot various dependencies directly on this Timeline PowerPoint Presentation Layout to see which tasks are still in the pipeline and how the delays in them are impacting the schedules and deadlines of the project. Apart from this, you can also share this updated visual with your team members and stakeholders, thus making it a resourceful tool to be incorporated in your business structure. Not only this but also the editable layout of this slide helps you to add your data and statistics at your convenience.
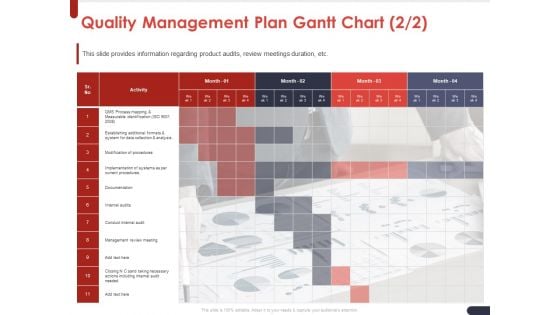
Project Quality Planning And Controlling Quality Management Plan Gantt Chart Mockup PDF
Manage your complex projects and organize them simultaneously with this detailed Gantt Chart PowerPoint Template. Track your milestones, tasks, phases, activities, subtasks amongst other constituents that will give you an updated visual of your project. Reflect your planning horizon and capture your release plan in one view with this Gantt Chart PowerPoint presentation template. You can plot various dependencies directly on this Timeline PowerPoint Presentation Layout to see which tasks are still in the pipeline and how the delays in them are impacting the schedules and deadlines of the project. Apart from this, you can also share this updated visual with your team members and stakeholders, thus making it a resourceful tool to be incorporated in your business structure. Not only this but also the editable layout of this slide helps you to add your data and statistics at your convenience.
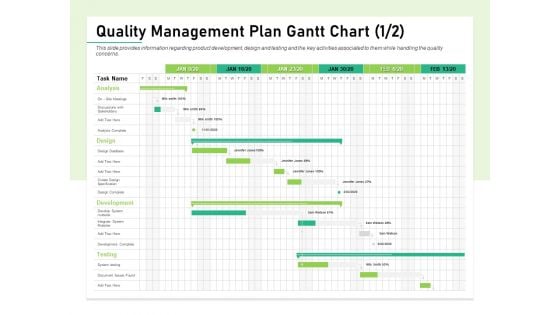
Quality Management Plan QMP Quality Management Plan Gantt Chart Design Clipart PDF
Manage your complex projects and organize them simultaneously with this detailed Gantt Chart PowerPoint Template. Track your milestones, tasks, phases, activities, subtasks amongst other constituents that will give you an updated visual of your project. Reflect your planning horizon and capture your release plan in one view with this Gantt Chart PowerPoint presentation template. You can plot various dependencies directly on this Timeline PowerPoint Presentation Layout to see which tasks are still in the pipeline and how the delays in them are impacting the schedules and deadlines of the project. Apart from this, you can also share this updated visual with your team members and stakeholders, thus making it a resourceful tool to be incorporated in your business structure. Not only this but also the editable layout of this slide helps you to add your data and statistics at your convenience.
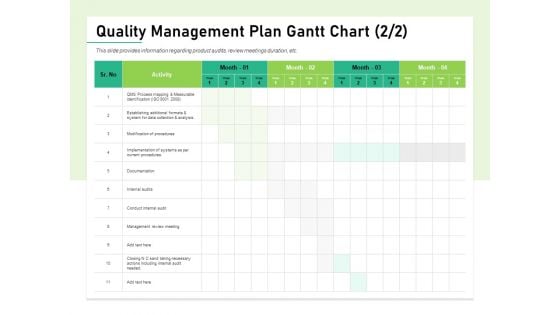
Quality Management Plan QMP Quality Management Plan Gantt Chart Mockup PDF
Manage your complex projects and organize them simultaneously with this detailed Gantt Chart PowerPoint Template. Track your milestones, tasks, phases, activities, subtasks amongst other constituents that will give you an updated visual of your project. Reflect your planning horizon and capture your release plan in one view with this Gantt Chart PowerPoint presentation template. You can plot various dependencies directly on this Timeline PowerPoint Presentation Layout to see which tasks are still in the pipeline and how the delays in them are impacting the schedules and deadlines of the project. Apart from this, you can also share this updated visual with your team members and stakeholders, thus making it a resourceful tool to be incorporated in your business structure. Not only this but also the editable layout of this slide helps you to add your data and statistics at your convenience.
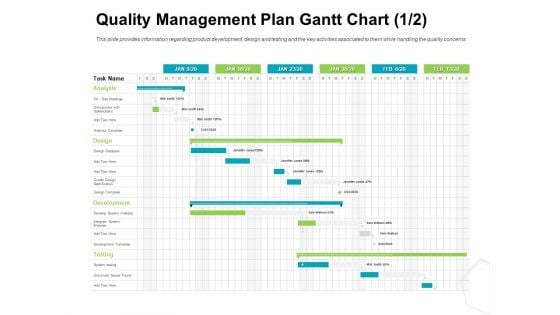
Project Quality Management Plan Quality Management Plan Gantt Chart Design Template PDF
Manage your complex projects and organize them simultaneously with this detailed Gantt Chart PowerPoint Template. Track your milestones, tasks, phases, activities, subtasks amongst other constituents that will give you an updated visual of your project. Reflect your planning horizon and capture your release plan in one view with this Gantt Chart PowerPoint presentation template. You can plot various dependencies directly on this Timeline PowerPoint Presentation Layout to see which tasks are still in the pipeline and how the delays in them are impacting the schedules and deadlines of the project. Apart from this, you can also share this updated visual with your team members and stakeholders, thus making it a resourceful tool to be incorporated in your business structure. Not only this but also the editable layout of this slide helps you to add your data and statistics at your convenience.
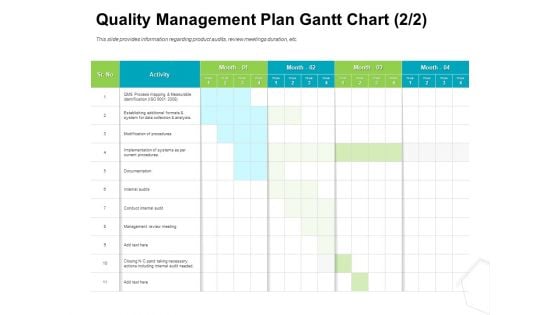
Project Quality Management Plan Quality Management Plan Gantt Chart Graphics PDF
Manage your complex projects and organize them simultaneously with this detailed Gantt Chart PowerPoint Template. Track your milestones, tasks, phases, activities, subtasks amongst other constituents that will give you an updated visual of your project. Reflect your planning horizon and capture your release plan in one view with this Gantt Chart PowerPoint presentation template. You can plot various dependencies directly on this Timeline PowerPoint Presentation Layout to see which tasks are still in the pipeline and how the delays in them are impacting the schedules and deadlines of the project. Apart from this, you can also share this updated visual with your team members and stakeholders, thus making it a resourceful tool to be incorporated in your business structure. Not only this but also the editable layout of this slide helps you to add your data and statistics at your convenience.
Conversion Rate Optimization Gantt Chart For Conversion Rate Enhancement Proposal Ppt Icon Example PDF
Manage your complex projects and organize them simultaneously with this detailed Gantt Chart PowerPoint Template. Track your milestones, tasks, phases, activities, subtasks amongst other constituents that will give you an updated visual of your project. Reflect your planning horizon and capture your release plan in one view with this Gantt Chart PowerPoint presentation template. You can plot various dependencies directly on this Timeline PowerPoint Presentation Layout to see which tasks are still in the pipeline and how the delays in them are impacting the schedules and deadlines of the project. Apart from this, you can also share this updated visual with your team members and stakeholders, thus making it a resourceful tool to be incorporated in your business structure. Not only this but also the editable layout of this slide helps you to add your data and statistics at your convenience.
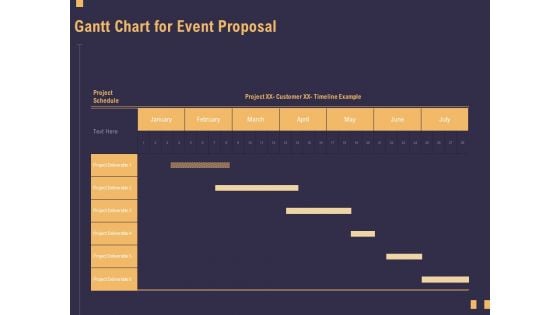
Business Event Planning Gantt Chart For Event Proposal Ppt Ideas Tips PDF
Manage your complex projects and organize them simultaneously with this detailed Gantt Chart PowerPoint Template. Track your milestones, tasks, phases, activities, subtasks amongst other constituents that will give you an updated visual of your project. Reflect your planning horizon and capture your release plan in one view with this Gantt Chart PowerPoint presentation template. You can plot various dependencies directly on this Timeline PowerPoint Presentation Layout to see which tasks are still in the pipeline and how the delays in them are impacting the schedules and deadlines of the project. Apart from this, you can also share this updated visual with your team members and stakeholders, thus making it a resourceful tool to be incorporated in your business structure. Not only this but also the editable layout of this slide helps you to add your data and statistics at your convenience.
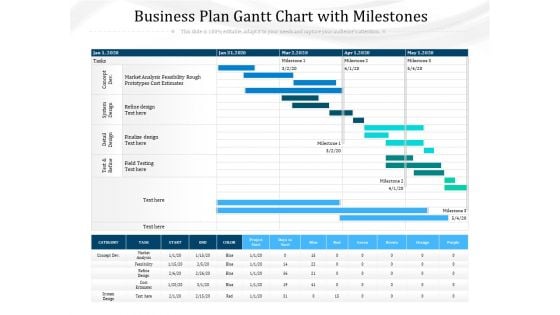
Business Plan Gantt Chart With Milestones Ppt PowerPoint Presentation Gallery Samples PDF
Manage your complex projects and organize them simultaneously with this detailed Gantt Chart PowerPoint Template. Track your milestones, tasks, phases, activities, subtasks amongst other constituents that will give you an updated visual of your project. Reflect your planning horizon and capture your release plan in one view with this Gantt Chart PowerPoint presentation template. You can plot various dependencies directly on this Timeline PowerPoint Presentation Layout to see which tasks are still in the pipeline and how the delays in them are impacting the schedules and deadlines of the project. Apart from this, you can also share this updated visual with your team members and stakeholders, thus making it a resourceful tool to be incorporated in your business structure. Not only this but also the editable layout of this slide helps you to add your data and statistics at your convenience.
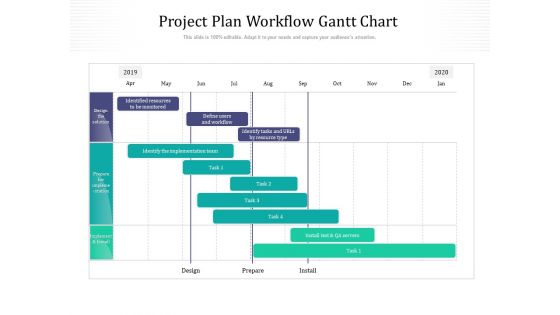
Project Plan Workflow Gantt Chart Ppt PowerPoint Presentation File Model PDF
Manage your complex projects and organize them simultaneously with this detailed Gantt Chart PowerPoint Template. Track your milestones, tasks, phases, activities, subtasks amongst other constituents that will give you an updated visual of your project. Reflect your planning horizon and capture your release plan in one view with this Gantt Chart PowerPoint presentation template. You can plot various dependencies directly on this Timeline PowerPoint Presentation Layout to see which tasks are still in the pipeline and how the delays in them are impacting the schedules and deadlines of the project. Apart from this, you can also share this updated visual with your team members and stakeholders, thus making it a resourceful tool to be incorporated in your business structure. Not only this but also the editable layout of this slide helps you to add your data and statistics at your convenience.
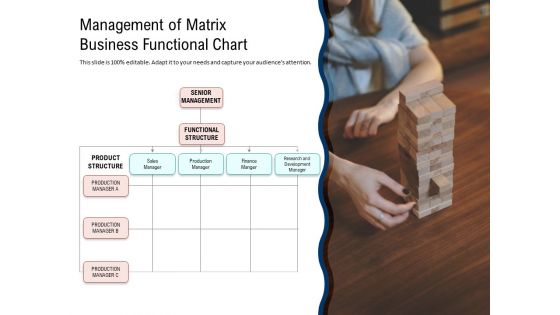
Management Of Matrix Business Functional Chart Ppt PowerPoint Presentation Show Visual Aids PDF
Pitch your topic with ease and precision using this management of matrix business functional chart ppt powerpoint presentation show visual aids pdf. This layout presents information on finance manger, production manager, sales manager, functional structure, product structure. It is also available for immediate download and adjustment. So, changes can be made in the color, design, graphics or any other component to create a unique layout.
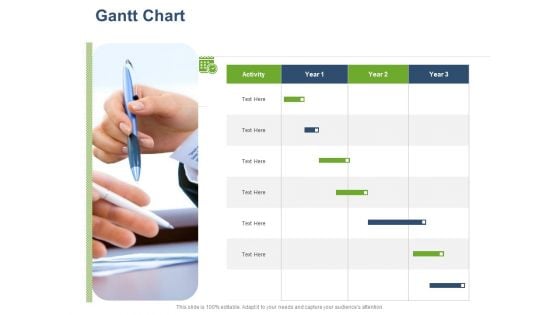
Online Banking Administration Procedure Gantt Chart Ppt Inspiration Master Slide PDF
Manage your complex projects and organize them simultaneously with this detailed Gantt Chart PowerPoint Template. Track your milestones, tasks, phases, activities, subtasks amongst other constituents that will give you an updated visual of your project. Reflect your planning horizon and capture your release plan in one view with this Gantt Chart PowerPoint presentation template. You can plot various dependencies directly on this Timeline PowerPoint Presentation Layout to see which tasks are still in the pipeline and how the delays in them are impacting the schedules and deadlines of the project. Apart from this, you can also share this updated visual with your team members and stakeholders, thus making it a resourceful tool to be incorporated in your business structure. Not only this but also the editable layout of this slide helps you to add your data and statistics at your convenience.
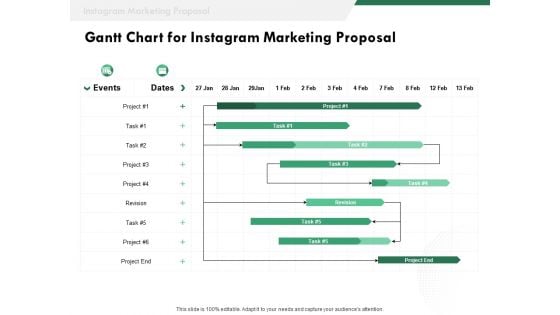
SMM Gantt Chart For Instagram Marketing Proposal Ppt Professional Backgrounds PDF
Manage your complex projects and organize them simultaneously with this detailed Gantt Chart PowerPoint Template. Track your milestones, tasks, phases, activities, subtasks amongst other constituents that will give you an updated visual of your project. Reflect your planning horizon and capture your release plan in one view with this Gantt Chart PowerPoint presentation template. You can plot various dependencies directly on this Timeline PowerPoint Presentation Layout to see which tasks are still in the pipeline and how the delays in them are impacting the schedules and deadlines of the project. Apart from this, you can also share this updated visual with your team members and stakeholders, thus making it a resourceful tool to be incorporated in your business structure. Not only this but also the editable layout of this slide helps you to add your data and statistics at your convenience.
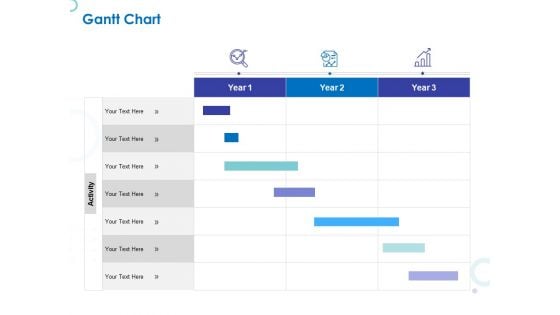
Web Banking For Financial Transactions Gantt Chart Ppt Slides Graphics Download PDF
Manage your complex projects and organize them simultaneously with this detailed Gantt Chart PowerPoint Template. Track your milestones, tasks, phases, activities, subtasks amongst other constituents that will give you an updated visual of your project. Reflect your planning horizon and capture your release plan in one view with this Gantt Chart PowerPoint presentation template. You can plot various dependencies directly on this Timeline PowerPoint Presentation Layout to see which tasks are still in the pipeline and how the delays in them are impacting the schedules and deadlines of the project. Apart from this, you can also share this updated visual with your team members and stakeholders, thus making it a resourceful tool to be incorporated in your business structure. Not only this but also the editable layout of this slide helps you to add your data and statistics at your convenience.
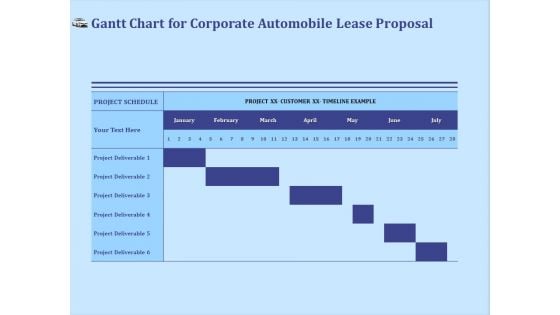
Vehicle Leasing Gantt Chart For Corporate Automobile Lease Proposal Portrait PDF
Manage your complex projects and organize them simultaneously with this detailed Gantt Chart PowerPoint Template. Track your milestones, tasks, phases, activities, subtasks amongst other constituents that will give you an updated visual of your project. Reflect your planning horizon and capture your release plan in one view with this Gantt Chart PowerPoint presentation template. You can plot various dependencies directly on this Timeline PowerPoint Presentation Layout to see which tasks are still in the pipeline and how the delays in them are impacting the schedules and deadlines of the project. Apart from this, you can also share this updated visual with your team members and stakeholders, thus making it a resourceful tool to be incorporated in your business structure. Not only this but also the editable layout of this slide helps you to add your data and statistics at your convenience.
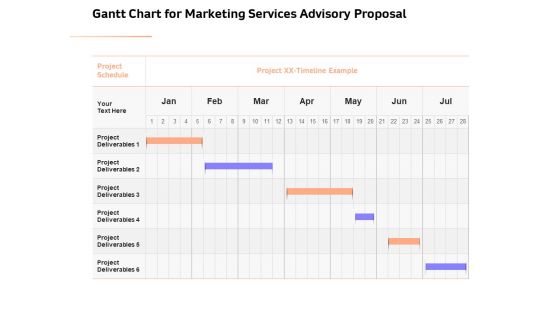
Sales Strategy Consulting Gantt Chart For Marketing Services Advisory Proposal Elements PDF
Manage your complex projects and organize them simultaneously with this detailed Gantt Chart PowerPoint Template. Track your milestones, tasks, phases, activities, subtasks amongst other constituents that will give you an updated visual of your project. Reflect your planning horizon and capture your release plan in one view with this Gantt Chart PowerPoint presentation template. You can plot various dependencies directly on this Timeline PowerPoint Presentation Layout to see which tasks are still in the pipeline and how the delays in them are impacting the schedules and deadlines of the project. Apart from this, you can also share this updated visual with your team members and stakeholders, thus making it a resourceful tool to be incorporated in your business structure. Not only this but also the editable layout of this slide helps you to add your data and statistics at your convenience.
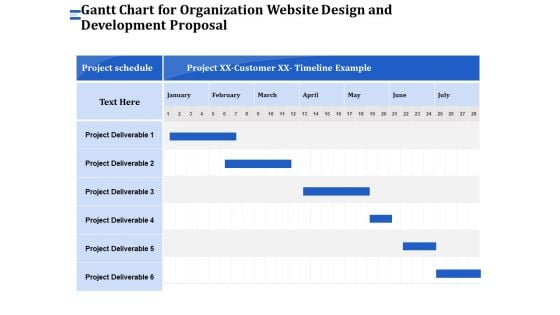
Firm Webpage Builder And Design Gantt Chart For Organization Website Design And Development Proposal Designs PDF
Manage your complex projects and organize them simultaneously with this detailed Gantt Chart PowerPoint Template. Track your milestones, tasks, phases, activities, subtasks amongst other constituents that will give you an updated visual of your project. Reflect your planning horizon and capture your release plan in one view with this Gantt Chart PowerPoint presentation template. You can plot various dependencies directly on this Timeline PowerPoint Presentation Layout to see which tasks are still in the pipeline and how the delays in them are impacting the schedules and deadlines of the project. Apart from this, you can also share this updated visual with your team members and stakeholders, thus making it a resourceful tool to be incorporated in your business structure. Not only this but also the editable layout of this slide helps you to add your data and statistics at your convenience.
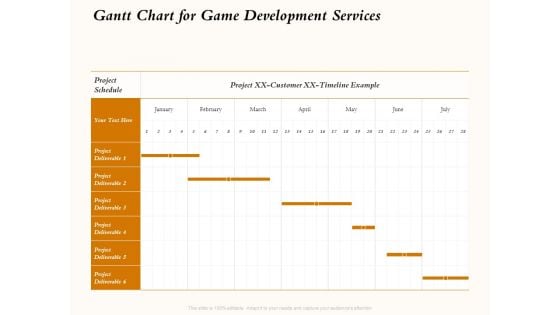
Three Dimensional Games Proposal Gantt Chart For Game Development Services Inspiration PDF
Manage your complex projects and organize them simultaneously with this detailed Gantt Chart PowerPoint Template. Track your milestones, tasks, phases, activities, subtasks amongst other constituents that will give you an updated visual of your project. Reflect your planning horizon and capture your release plan in one view with this Gantt Chart PowerPoint presentation template. You can plot various dependencies directly on this Timeline PowerPoint Presentation Layout to see which tasks are still in the pipeline and how the delays in them are impacting the schedules and deadlines of the project. Apart from this, you can also share this updated visual with your team members and stakeholders, thus making it a resourceful tool to be incorporated in your business structure. Not only this but also the editable layout of this slide helps you to add your data and statistics at your convenience.
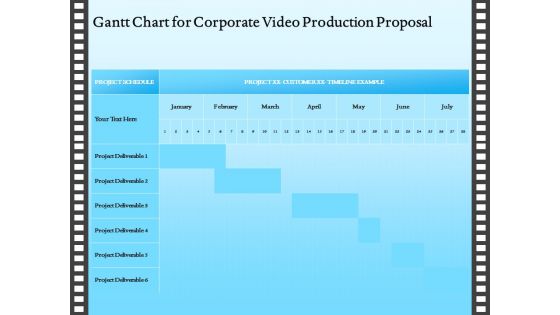
Corporate Video Gantt Chart For Corporate Video Production Proposal Ppt Gallery Outline PDF
Manage your complex projects and organize them simultaneously with this detailed Gantt Chart PowerPoint Template. Track your milestones, tasks, phases, activities, subtasks amongst other constituents that will give you an updated visual of your project. Reflect your planning horizon and capture your release plan in one view with this Gantt Chart PowerPoint presentation template. You can plot various dependencies directly on this Timeline PowerPoint Presentation Layout to see which tasks are still in the pipeline and how the delays in them are impacting the schedules and deadlines of the project. Apart from this, you can also share this updated visual with your team members and stakeholders, thus making it a resourceful tool to be incorporated in your business structure. Not only this but also the editable layout of this slide helps you to add your data and statistics at your convenience.
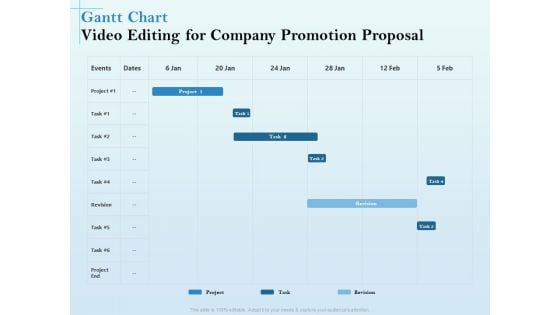
Business Marketing Video Making Gantt Chart Video Editing For Company Promotion Proposal Rules PDF
Manage your complex projects and organize them simultaneously with this detailed Gantt Chart PowerPoint Template. Track your milestones, tasks, phases, activities, subtasks amongst other constituents that will give you an updated visual of your project. Reflect your planning horizon and capture your release plan in one view with this Gantt Chart PowerPoint presentation template. You can plot various dependencies directly on this Timeline PowerPoint Presentation Layout to see which tasks are still in the pipeline and how the delays in them are impacting the schedules and deadlines of the project. Apart from this, you can also share this updated visual with your team members and stakeholders, thus making it a resourceful tool to be incorporated in your business structure. Not only this but also the editable layout of this slide helps you to add your data and statistics at your convenience.
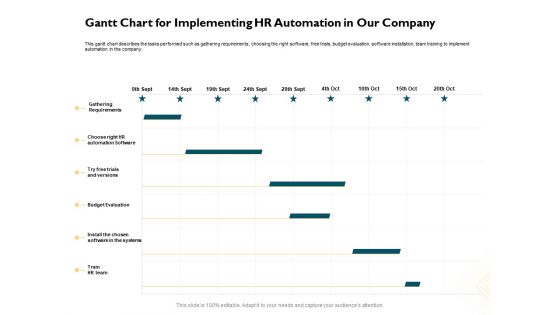
Automatically Controlling Process Gantt Chart For Implementing HR Automation In Our Company Mockup PDF
Manage your complex projects and organize them simultaneously with this detailed Gantt Chart PowerPoint Template. Track your milestones, tasks, phases, activities, subtasks amongst other constituents that will give you an updated visual of your project. Reflect your planning horizon and capture your release plan in one view with this Gantt Chart PowerPoint presentation template. You can plot various dependencies directly on this Timeline PowerPoint Presentation Layout to see which tasks are still in the pipeline and how the delays in them are impacting the schedules and deadlines of the project. Apart from this, you can also share this updated visual with your team members and stakeholders, thus making it a resourceful tool to be incorporated in your business structure. Not only this but also the editable layout of this slide helps you to add your data and statistics at your convenience.
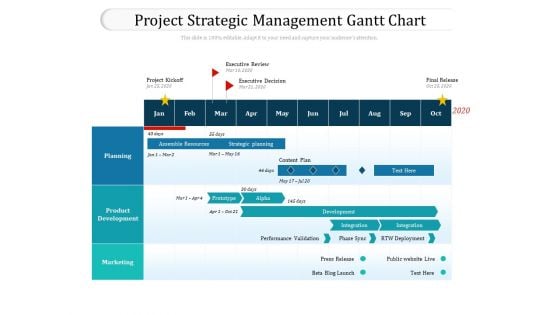
Project Strategic Management Gantt Chart Ppt PowerPoint Presentation Gallery Templates PDF
Manage your complex projects and organize them simultaneously with this detailed Gantt Chart PowerPoint Template. Track your milestones, tasks, phases, activities, subtasks amongst other constituents that will give you an updated visual of your project. Reflect your planning horizon and capture your release plan in one view with this Gantt Chart PowerPoint presentation template. You can plot various dependencies directly on this Timeline PowerPoint Presentation Layout to see which tasks are still in the pipeline and how the delays in them are impacting the schedules and deadlines of the project. Apart from this, you can also share this updated visual with your team members and stakeholders, thus making it a resourceful tool to be incorporated in your business structure. Not only this but also the editable layout of this slide helps you to add your data and statistics at your convenience.
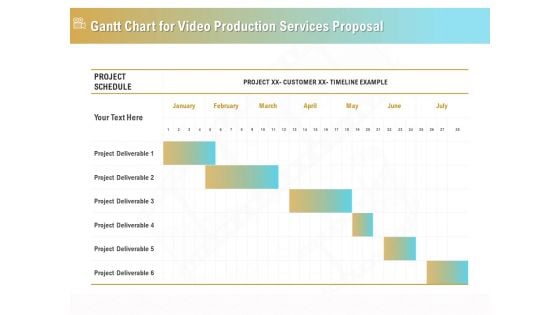
Movie Making Solutions Gantt Chart For Video Production Services Proposal Ideas PDF
Manage your complex projects and organize them simultaneously with this detailed Gantt Chart PowerPoint Template. Track your milestones, tasks, phases, activities, subtasks amongst other constituents that will give you an updated visual of your project. Reflect your planning horizon and capture your release plan in one view with this Gantt Chart PowerPoint presentation template. You can plot various dependencies directly on this Timeline PowerPoint Presentation Layout to see which tasks are still in the pipeline and how the delays in them are impacting the schedules and deadlines of the project. Apart from this, you can also share this updated visual with your team members and stakeholders, thus making it a resourceful tool to be incorporated in your business structure. Not only this but also the editable layout of this slide helps you to add your data and statistics at your convenience.
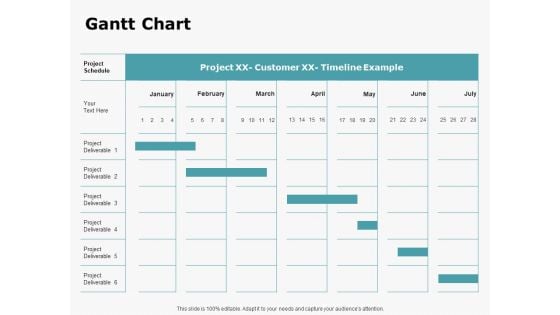
HR Outsourcing Service Proposal Gantt Chart Ppt Infographic Template Visuals PDF
Manage your complex projects and organize them simultaneously with this detailed Gantt Chart PowerPoint Template. Track your milestones, tasks, phases, activities, subtasks amongst other constituents that will give you an updated visual of your project. Reflect your planning horizon and capture your release plan in one view with this Gantt Chart PowerPoint presentation template. You can plot various dependencies directly on this Timeline PowerPoint Presentation Layout to see which tasks are still in the pipeline and how the delays in them are impacting the schedules and deadlines of the project. Apart from this, you can also share this updated visual with your team members and stakeholders, thus making it a resourceful tool to be incorporated in your business structure. Not only this but also the editable layout of this slide helps you to add your data and statistics at your convenience.
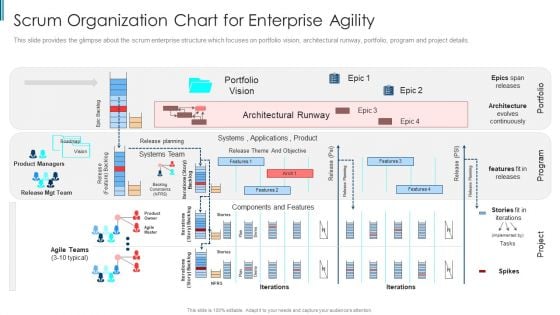
Scrum Staff Organization Map IT Scrum Organization Chart For Enterprise Agility Themes PDF
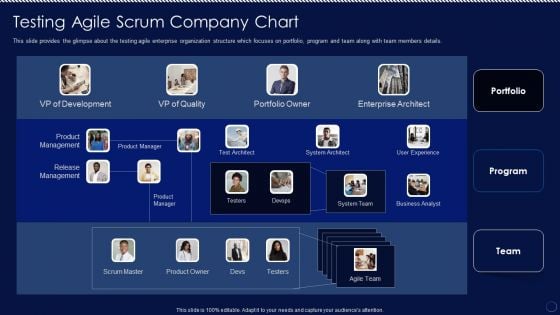
Testing Agile Scrum Company Chart Ppt PowerPoint Presentation File Gallery PDF
This slide provides the glimpse about the testing agile enterprise organization structure which focuses on portfolio, program and team along with team members details. Do you have an important presentation coming up Are you looking for something that will make your presentation stand out from the rest Look no further than Testing Agile Scrum Company Chart Ppt PowerPoint Presentation File Gallery PDF. With our professional designs, you can trust that your presentation will pop and make delivering it a smooth process. And with Slidegeeks, you can trust that your presentation will be unique and memorable. So why wait Grab Testing Agile Scrum Company Chart Ppt PowerPoint Presentation File Gallery PDF today and make your presentation stand out from the rest.
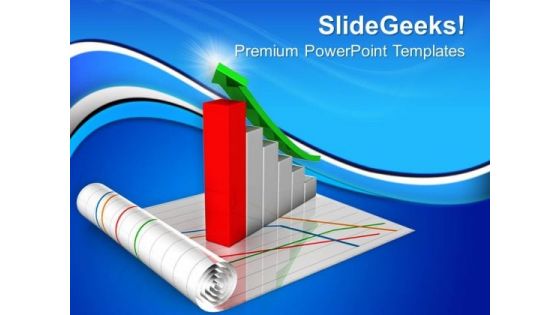
Bar Graph X Y Chart Shows Growth PowerPoint Templates Ppt Backgrounds For Slides 0413
We present our Bar Graph X Y Chart Shows Growth PowerPoint Templates PPT Backgrounds For Slides 0413.Download and present our Arrows PowerPoint Templates because It will Raise the bar of your Thoughts. They are programmed to take you to the next level. Present our Business PowerPoint Templates because Our PowerPoint Templates and Slides will provide weight to your words. They will bring out the depth of your thought process. Present our Success PowerPoint Templates because Our PowerPoint Templates and Slides are innately eco-friendly. Their high recall value negate the need for paper handouts. Use our Shapes PowerPoint Templates because Our PowerPoint Templates and Slides will effectively help you save your valuable time. They are readymade to fit into any presentation structure. Present our Signs PowerPoint Templates because you can Break through with our PowerPoint Templates and Slides. Bring down the mental barriers of your audience.Use these PowerPoint slides for presentations relating to Bar graph X Y chart shows growth, arrows, success, business, shapes, signs. The prominent colors used in the PowerPoint template are Red, Gray, Green. Equalize the equation with our Bar Graph X Y Chart Shows Growth PowerPoint Templates Ppt Backgrounds For Slides 0413. Get the audience on board with you.
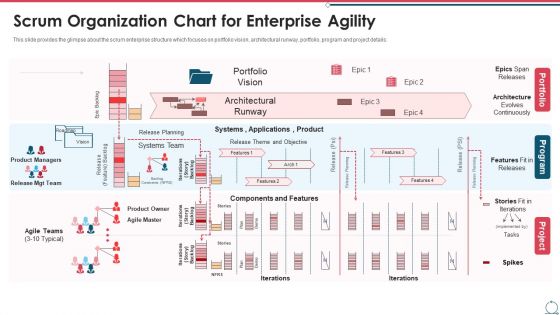
Building An Agile Development Scrum Team Scrum Organization Chart For Enterprise Agility Brochure PDF
This slide provides the glimpse about the scrum enterprise structure which focuses on portfolio vision, architectural runway, portfolio, program and project details. Deliver an awe inspiring pitch with this creative building an agile development scrum team scrum organization chart for enterprise agility brochure pdf bundle. Topics like portfolio vision, architectural, planning, agile teams can be discussed with this completely editable template. It is available for immediate download depending on the needs and requirements of the user.
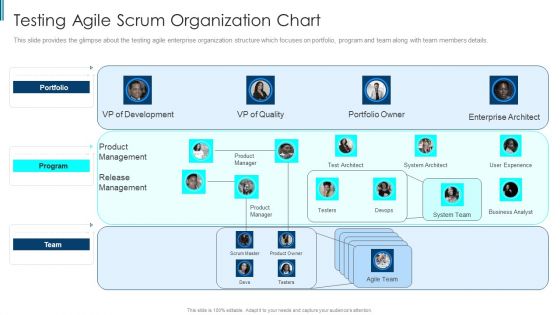
Scrum Staff Organization Map IT Testing Agile Scrum Organization Chart Microsoft PDF
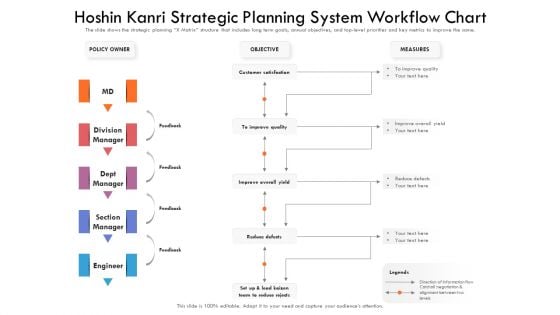
Hoshin Kanri Strategic Planning System Workflow Chart Ppt PowerPoint Presentation Gallery Show PDF
The slide shows the strategic planning X Matrix structure that includes long term goals, annual objectives, and top-level priorities and key metrics to improve the same. Showcasing this set of slides titled hoshin kanri strategic planning system workflow chart ppt powerpoint presentation gallery show pdf. The topics addressed in these templates are policy owner, objective, measures. All the content presented in this PPT design is completely editable. Download it and make adjustments in color, background, font etc. as per your unique business setting.
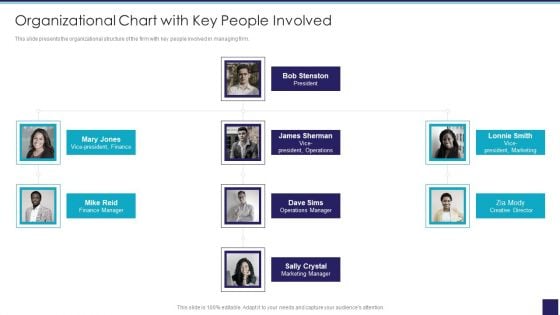
Organizational Issue Resolution Tool Organizational Chart With Key People Involved Graphics PDF
This slide presents the organizational structure of the firm with key people involved in managing firm. Presenting Organizational Issue Resolution Tool Organizational Chart With Key People Involved Graphics PDF to provide visual cues and insights. Share and navigate important information on one stage that need your due attention. This template can be used to pitch topics like Finance Manager, President, Marketing, Operations Manager. In addtion, this PPT design contains high resolution images, graphics, etc, that are easily editable and available for immediate download.
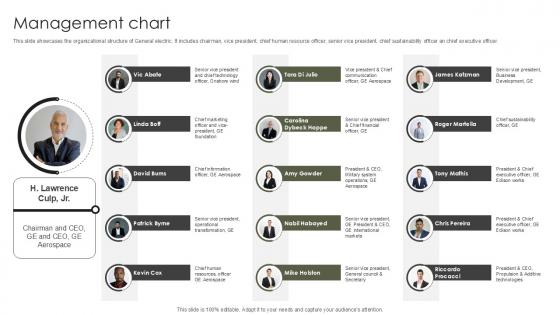
Management Chart Military Aircraft Engine Manufacturing PPT Presentation CP SS V
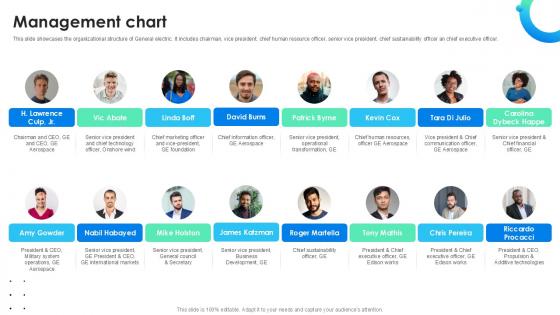
This slide showcases the organizational structure of General electric. It includes chairman, vice president, chief human resource officer, senior vice president, chief sustainability officer an chief executive officer. The Management Chart Military Aircraft Engine Manufacturing PPT Presentation CP SS V is a compilation of the most recent design trends as a series of slides. It is suitable for any subject or industry presentation, containing attractive visuals and photo spots for businesses to clearly express their messages. This template contains a variety of slides for the user to input data, such as structures to contrast two elements, bullet points, and slides for written information. Slidegeeks is prepared to create an impression. This slide showcases the organizational structure of General electric. It includes chairman, vice president, chief human resource officer, senior vice president, chief sustainability officer an chief executive officer.
Management Chart Global Energy Company Profile PPT Sample CP SS V
This slide showcases the organizational structure of General electric. It includes chairman, vice president, chief human resource officer, senior vice president, chief sustainability officer an chief executive officer. The Management Chart Global Energy Company Profile PPT Sample CP SS V is a compilation of the most recent design trends as a series of slides. It is suitable for any subject or industry presentation, containing attractive visuals and photo spots for businesses to clearly express their messages. This template contains a variety of slides for the user to input data, such as structures to contrast two elements, bullet points, and slides for written information. Slidegeeks is prepared to create an impression. This slide showcases the organizational structure of General electric. It includes chairman, vice president, chief human resource officer, senior vice president, chief sustainability officer an chief executive officer.
Statistical Analysis Of Circular Chart 5 Steps Ppt Business Plan PowerPoint Slide
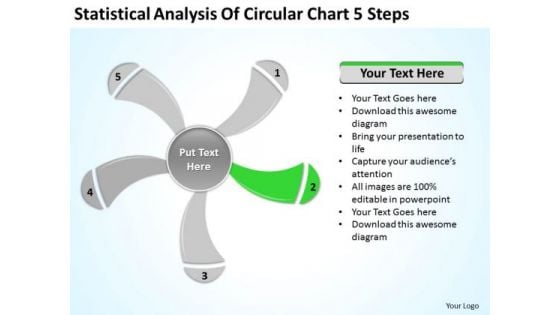
We present our statistical analysis of circular chart 5 steps ppt business plan PowerPoint Slide.Download and present our Business PowerPoint Templates because Our PowerPoint Templates and Slides will definately Enhance the stature of your presentation. Adorn the beauty of your thoughts with their colourful backgrounds. Use our Signs PowerPoint Templates because Our PowerPoint Templates and Slides will give good value for money. They also have respect for the value of your time. Download our Shapes PowerPoint Templates because Our PowerPoint Templates and Slides team portray an attitude of elegance. Personify this quality by using them regularly. Use our Metaphors-Visual Concepts PowerPoint Templates because Our PowerPoint Templates and Slides will effectively help you save your valuable time. They are readymade to fit into any presentation structure. Use our Process and Flows PowerPoint Templates because our PowerPoint Templates and Slides are the string of your bow. Fire of your ideas and conquer the podium.Use these PowerPoint slides for presentations relating to graphically, graphic, vector, layout, business, computation, sign, infochart, visual, symbol, template, diagram, calculations, sector, data, revenue, schedule, element, analysis, drawing, report, technology, contour, classification, graph, modern, illustration, icon, comparison, object, chart, collection, science, color, growth, composition, professional, set, education, math, profits, information, symmetry, statistic, structure, infographics, button. The prominent colors used in the PowerPoint template are Green, Gray, White. Get a blue-chip client list with your ideas. Attract the best customers with our Statistical Analysis Of Circular Chart 5 Steps Ppt Business Plan PowerPoint Slide.
Organizational Chart Global Consulting And Technology Services Company Profile CP SS V
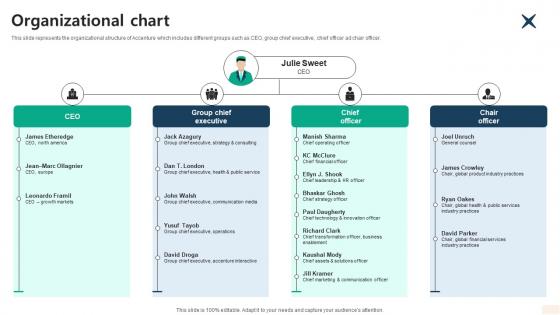
This slide represents the organizational structure of Accenture which includes different groups such as CEO, group chief executive, chief officer ad chair officer.Welcome to our selection of the Organizational Chart Global Consulting And Technology Services Company Profile CP SS V. These are designed to help you showcase your creativity and bring your sphere to life. Planning and Innovation are essential for any business that is just starting out. This collection contains the designs that you need for your everyday presentations. All of our PowerPoints are 100 percent editable, so you can customize them to suit your needs. This multi-purpose template can be used in various situations. Grab these presentation templates today. This slide represents the organizational structure of Accenture which includes different groups such as CEO, group chief executive, chief officer ad chair officer.
Organisation Chart Food And Beverages Company Profile Ppt Template CP SS V
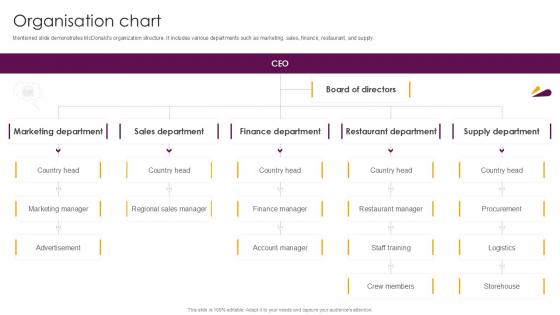
Mentioned slide demonstrates McDonalds organization structure. It includes various departments such as marketing, sales, finance, restaurant, and supply. This Organisation Chart Food And Beverages Company Profile Ppt Template CP SS V from Slidegeeks makes it easy to present information on your topic with precision. It provides customization options, so you can make changes to the colors, design, graphics, or any other component to create a unique layout. It is also available for immediate download, so you can begin using it right away. Slidegeeks has done good research to ensure that you have everything you need to make your presentation stand out. Make a name out there for a brilliant performance. Mentioned slide demonstrates McDonalds organization structure. It includes various departments such as marketing, sales, finance, restaurant, and supply.
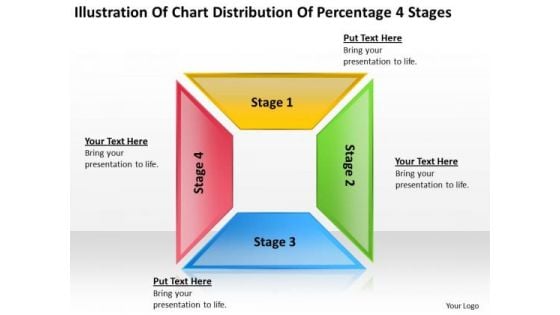
Chart Distribution Percentage 4 Stages Simple Business Plan Outline PowerPoint Slides
We present our chart distribution percentage 4 stages simple business plan outline PowerPoint Slides.Download our Process and Flows PowerPoint Templates because You can Be the puppeteer with our PowerPoint Templates and Slides as your strings. Lead your team through the steps of your script. Download and present our Marketing PowerPoint Templates because Our PowerPoint Templates and Slides are conceived by a dedicated team. Use them and give form to your wondrous ideas. Download our Success PowerPoint Templates because You are an avid believer in ethical practices. Highlight the benefits that accrue with our PowerPoint Templates and Slides. Use our Business PowerPoint Templates because They will bring a lot to the table. Their alluring flavours will make your audience salivate. Present our Shapes PowerPoint Templates because our PowerPoint Templates and Slides are the string of your bow. Fire of your ideas and conquer the podium.Use these PowerPoint slides for presentations relating to Diagram, chart, vector, cube, wallpaper, square, schema, green, business, concept, yellow, brochure, scheme, simply, drawing, abstract, graph, four, illustration, flyer, pink, round, backdrop, design, color, blue, tab, poster, background, image, ground, pattern, structure . The prominent colors used in the PowerPoint template are Yellow, Green, Blue. Raise the bar with our Chart Distribution Percentage 4 Stages Simple Business Plan Outline PowerPoint Slides. You will come out on top.
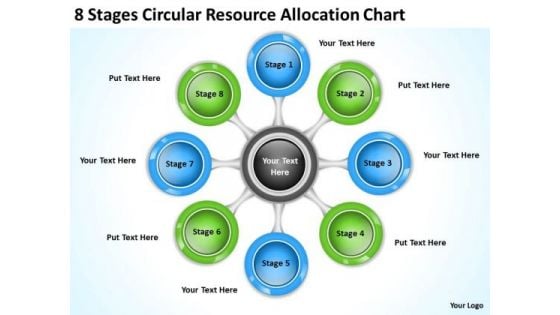
Business Plan Diagram 8 Stages Circular Resource Allocation Chart PowerPoint Slides
We present our business plan diagram 8 stages circular resource allocation chart PowerPoint Slides.Download and present our Arrows PowerPoint Templates because Watching this your Audience will Grab their eyeballs, they wont even blink. Use our Business PowerPoint Templates because Our PowerPoint Templates and Slides will generate and maintain the level of interest you desire. They will create the impression you want to imprint on your audience. Download our Process and Flows PowerPoint Templates because Our PowerPoint Templates and Slides will Activate the energies of your audience. Get their creative juices flowing with your words. Use our Shapes PowerPoint Templates because You can Channelise the thoughts of your team with our PowerPoint Templates and Slides. Urge them to focus on the goals you have set. Present our Advertising PowerPoint Templates because Our PowerPoint Templates and Slides will let you Hit the right notes. Watch your audience start singing to your tune.Use these PowerPoint slides for presentations relating to Administration, Arrow, Box, Business, Chain, Chart, Color, Concept, Connect, Connection, Connectivity, Corporate, Data, Design, Diagram, Financial, Flow, Flowchart, Glassy, Global, Glossy, Graph, Graphical, Group, Hierarchy, Highlight, Important, Ladder, Manager, Office, Officer, Organization, Organize, Plan, Process, Rectangle, Relation, Steps, Structure, Supervisor, Teamwork. The prominent colors used in the PowerPoint template are Green, Blue, Gray. Enhance your chances of asset creation. Diversify your base with our Business Plan Diagram 8 Stages Circular Resource Allocation Chart PowerPoint Slides.
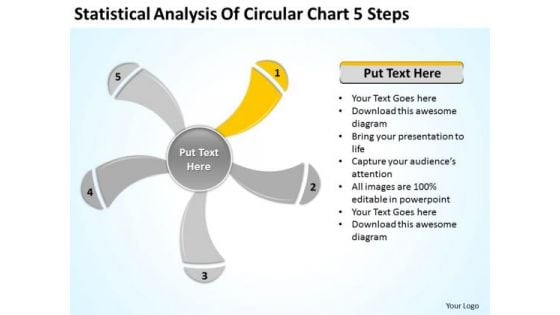
Statistical Analysis Of Circular Chart 5 Steps Ppt Business Plan PowerPoint Slides
We present our statistical analysis of circular chart 5 steps ppt business plan PowerPoint Slides.Download and present our Business PowerPoint Templates because Timeline crunches are a fact of life. Meet all deadlines using our PowerPoint Templates and Slides. Present our Signs PowerPoint Templates because You can Zap them with our PowerPoint Templates and Slides. See them reel under the impact. Use our Shapes PowerPoint Templates because It can Bubble and burst with your ideas. Download our Metaphors-Visual Concepts PowerPoint Templates because You can Create a matrix with our PowerPoint Templates and Slides. Feel the strength of your ideas click into place. Present our Process and Flows PowerPoint Templates because Our PowerPoint Templates and Slides has conjured up a web of all you need with the help of our great team. Use them to string together your glistening ideas.Use these PowerPoint slides for presentations relating to graphically, graphic, vector, layout, business, computation, sign, infochart, visual, symbol, template, diagram, calculations, sector, data, revenue, schedule, element, analysis, drawing, report, technology, contour, classification, graph, modern, illustration, icon, comparison, object, chart, collection, science, color, growth, composition, professional, set, education, math, profits, information, symmetry, statistic, structure, infographics, button. The prominent colors used in the PowerPoint template are Yellow, Gray, White. Use our Statistical Analysis Of Circular Chart 5 Steps Ppt Business Plan PowerPoint Slides to brainstorm. You will be amazed at the ideas that emerge.
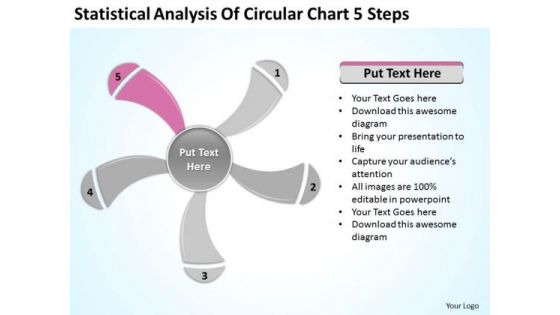
Statistical Analysis Of Circular Chart 5 Steps Ppt Outline For Business Plan PowerPoint Slides
We present our statistical analysis of circular chart 5 steps ppt outline for business plan PowerPoint Slides.Present our Business PowerPoint Templates because Our PowerPoint Templates and Slides will definately Enhance the stature of your presentation. Adorn the beauty of your thoughts with their colourful backgrounds. Download our Signs PowerPoint Templates because They will Put the wind in your sails. Skim smoothly over the choppy waters of the market. Download our Shapes PowerPoint Templates because Our PowerPoint Templates and Slides come in all colours, shades and hues. They help highlight every nuance of your views. Download and present our Metaphors-Visual Concepts PowerPoint Templates because Our PowerPoint Templates and Slides will let your words and thoughts hit bullseye everytime. Download and present our Process and Flows PowerPoint Templates because Our PowerPoint Templates and Slides will help you be quick off the draw. Just enter your specific text and see your points hit home.Use these PowerPoint slides for presentations relating to graphically, graphic, vector, layout, business, computation, sign, infochart, visual, symbol, template, diagram, calculations, sector, data, revenue, schedule, element, analysis, drawing, report, technology, contour, classification, graph, modern, illustration, icon, comparison, object, chart, collection, science, color, growth, composition, professional, set, education, math, profits, information, symmetry, statistic, structure, infographics, button. The prominent colors used in the PowerPoint template are Pink, Gray, White. Our Statistical Analysis Of Circular Chart 5 Steps Ppt Outline For Business Plan PowerPoint Slides will ensure you get a good grade. You will be glad you tried us out.
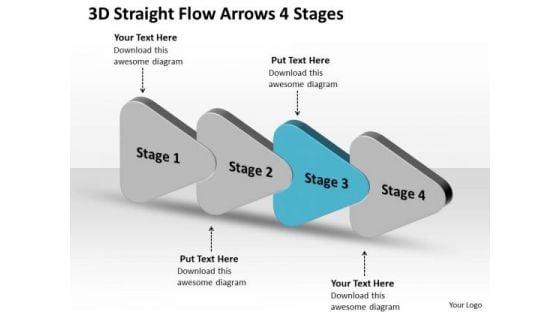
3d Straight Flow Arrows 4 Stages Ppt Work Process Chart PowerPoint Templates
We present our 3d straight flow arrows 4 stages ppt work process chart PowerPoint templates. Use our Business PowerPoint Templates because, Stable ideas are the building blocks of a successful structure. Use our Design PowerPoint Templates because, Puzzles or Jigsaw Template: - It is all there in bits and pieces. Use our Signs PowerPoint Templates because, are the Tools of the Trade. Use our Shapes PowerPoint Templates because, Build on your foundation or prepare for change ahead to enhance the future. Use our Process and Flows PowerPoint Templates because; Use this impressive template to unravel your recipe for a mouthwatering result. Use these PowerPoint slides for presentations relating to abstract, arrow, arrows, business, chart, design, development, diagram, direction, element, flow, flowchart, graph, linear, management, model, motion, organization, plan, process, program, section, segment, set, sign, solution, strategy, symbol, technology. The prominent colors used in the PowerPoint template are Blue, Gray, and Black Blow away concerns with our 3d Straight Flow Arrows 4 Stages Ppt Work Process Chart PowerPoint Templates. You will come out on top.


 Continue with Email

 Home
Home


