Circle Diagram
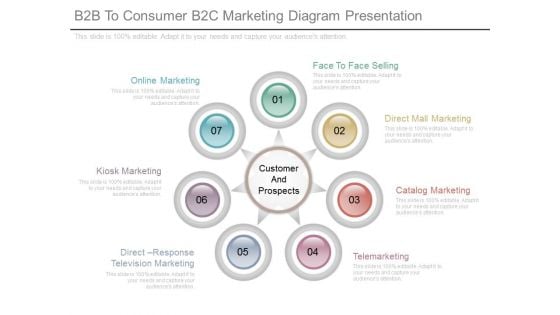
B2b To Consumer B2c Marketing Diagram Presentation
This is a b2b to consumer b2c marketing diagram presentation. This is a seven stage process. The stages in this process are customer and prospects, online marketing, kiosk marketing, direct response television marketing, telemarketing, catalog marketing, direct mall marketing, face to face selling.
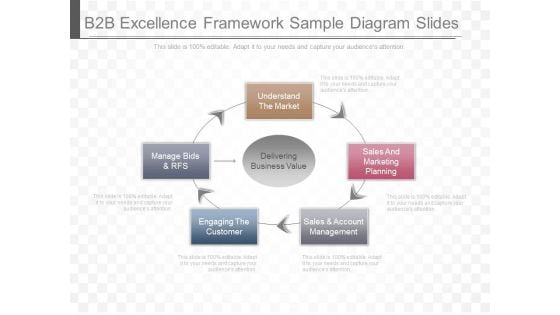
B2B Excellence Framework Sample Diagram Slides
This is a b2b excellence framework sample diagram slides. This is a five stage process. The stages in this process are delivering business value, understand the market, sales and marketing planning, sales and account management, engaging the customer, manage bids and rfs.
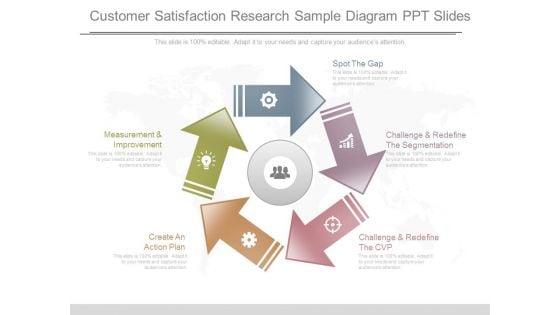
Customer Satisfaction Research Sample Diagram Ppt Slides
This is a customer satisfaction research sample diagram ppt slides. This is a five stage process. The stages in this process are spot the gap, challenge and redefine the segmentation, challenge and redefine the cvp, create an action plan, measurement and improvement.
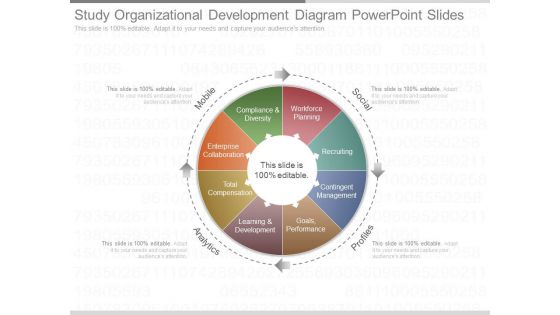
Study Organizational Development Diagram Powerpoint Slides
This is a study organizational development diagram powerpoint slides. This is a four stage process. The stages in this process are mobile, social, profiles, analytics, compliance and diversity, workforce planning, enterprise collaboration, recruiting, total compensation, contingent management, learning and development, goals performance.
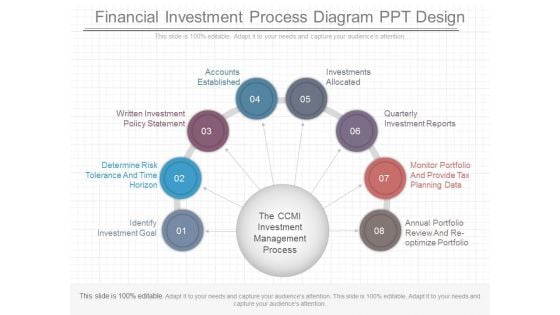
Financial Investment Process Diagram Ppt Design
This is a financial investment process diagram ppt design. This is a eight stage process. The stages in this process are identify investment goal, determine risk tolerance and time horizon, written investment policy statement, accounts established, investments allocated, quarterly investment reports, monitor portfolio and provide tax planning data, annual portfolio review and re optimize portfolio.
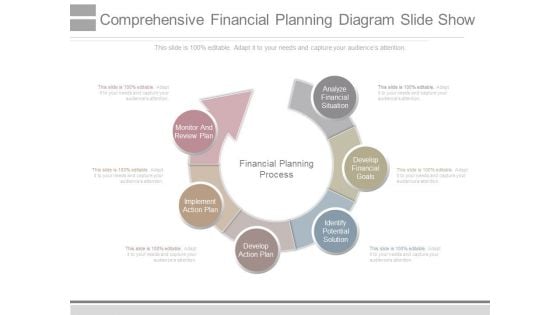
Comprehensive Financial Planning Diagram Slide Show
This is a comprehensive financial planning diagram slide show. This is a six stage process. The stages in this process are monitor and review plan, implement action plan, develop action plan, identify potential solution, develop financial goals, analyze financial situation, financial planning process.

Integrated Talent Management Sample Diagram Powerpoint Templates
This is a integrated talent management sample diagram powerpoint templates. This is a four stage process. The stages in this process are workforce planning, recruiting and onboarding, analytics, mobile, profiles, social, learning and development, compliance and diversity, total compensation, enterprise collaboration, contingent management, goals performance and succession.
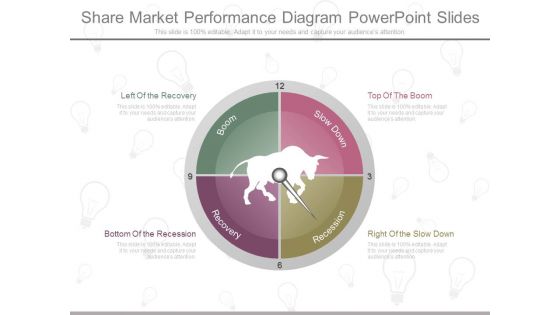
Share Market Performance Diagram Powerpoint Slides
This is a share market performance diagram powerpoint slides. This is a four stage process. The stages in this process are left of the recovery, bottom of the recession, top of the boom, right of the slow down, boom, recovery, recession.

Marketing Research Internet Diagram Powerpoint Guide
This is a marketing research internet diagram powerpoint guide. This is a nine stage process. The stages in this process are price analysis, domestic international competitors, target market analysis, competitive analysis, location analysis report, swot analysis report, marketing plans, market research analysis reports, identify trends, market research.
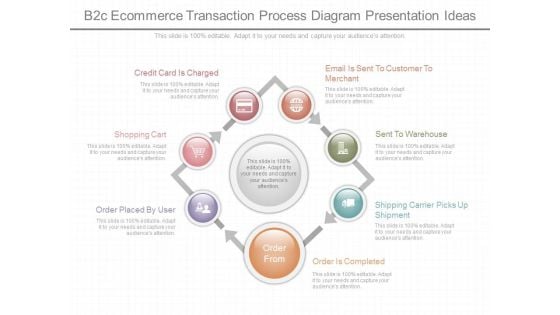
B2c Ecommerce Transaction Process Diagram Presentation Ideas
This is a b2c ecommerce transaction process diagram presentation ideas. This is a seven stage process. The stages in this process are credit card is charged, shopping cart, order placed by user, order from order is completed, shipping carrier picks up shipment, sent to warehouse, email is sent to customer to merchant.
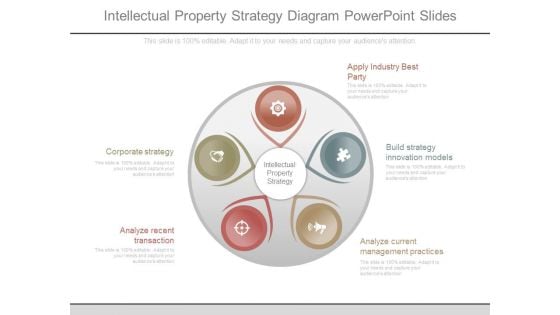
Intellectual Property Strategy Diagram Powerpoint Slides
This is a intellectual property strategy diagram powerpoint slides. This is a five stage process. The stages in this process are intellectual property strategy, corporate strategy, analyze recent transaction, apply industry best party, build strategy innovation models, analyze current management practices.

Change Analysis Framework Sample Diagram Design
This is a change analysis framework sample diagram design. This is a six stage process. The stages in this process are planning the change program, equipping mangers to support their team, communicating the change, creating the compelling case for change, building change team capability, managing the change program.
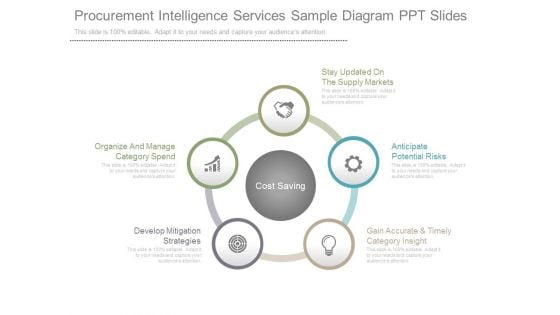
Procurement Intelligence Services Sample Diagram Ppt Slides
This is a procurement intelligence services sample diagram ppt slides. This is a five stage process. The stages in this process are cost saving, stay updated on the supply markets, anticipate potential risks, gain accurate and timely category insight, organize and manage category spend, develop mitigation strategies.
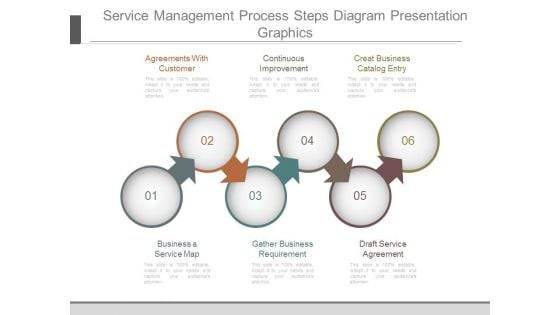
Service Management Process Steps Diagram Presentation Graphics
This is a service management process steps diagram presentation graphics. This is a six stage process. The stages in this process are agreements with customer, continuous improvement, creat business catalog entry, draft service agreement, gather business requirement, business a service map.
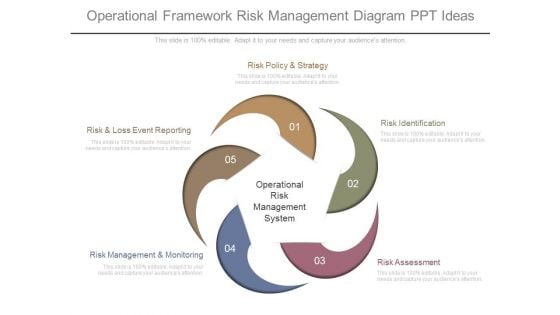
Operational Framework Risk Management Diagram Ppt Ideas
This is a operational framework risk management diagram ppt ideas. This is a five stage process. The stages in this process are risk policy and strategy, risk and loss event reporting, risk management and monitoring, operational risk management system, risk identification, risk assessment.
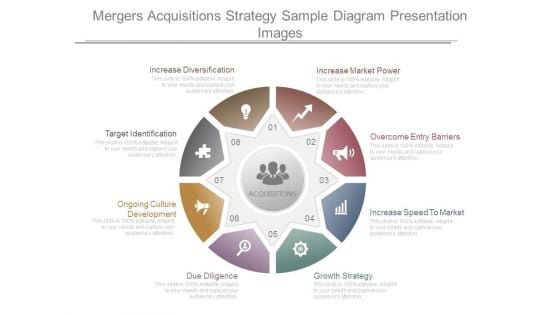
Mergers Acquisitions Strategy Sample Diagram Presentation Images
This is a mergers acquisitions strategy sample diagram presentation images. This is a eight stage process. The stages in this process are increase market power, overcome entry barriers, increase speed to market, growth strategy, due diligence, ongoing culture development, target identification, increase diversification.
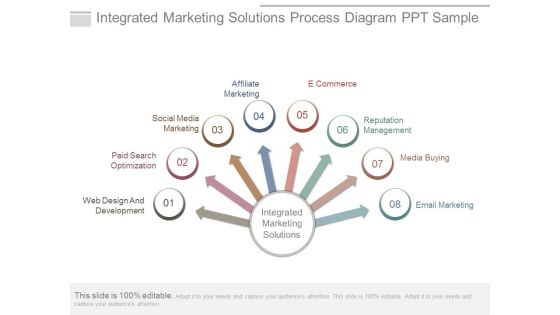
Integrated Marketing Solutions Process Diagram Ppt Sample
This is a integrated marketing solutions process diagram ppt sample. This is a eight stage process. The stages in this process are email marketing, media buying, reputation management, e commerce, affiliate marketing, social media marketing, paid search optimization, web design and development, integrated marketing solutions.
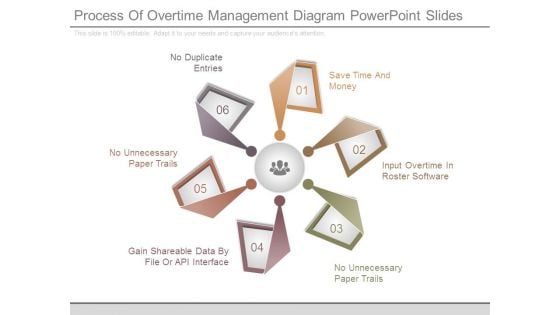
Process Of Overtime Management Diagram Powerpoint Slides
This is a process of overtime management diagram powerpoint slides. This is a six stage process. The stages in this process are no duplicate entries, no unnecessary paper trails, gain shareable data by file or api interface, save time and money, input overtime in roster software, no unnecessary paper trails.
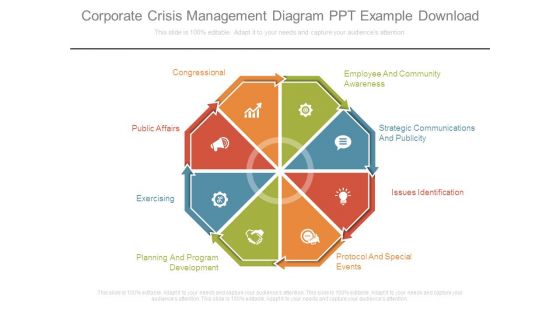
Corporate Crisis Management Diagram Ppt Example Download
This is a corporate crisis management diagram ppt example download. This is a eight stage process. The stages in this process are congressional, public affairs, exercising, planning and program development, protocol and special events, issues identification, strategic communications and publicity, employee and community, awareness.
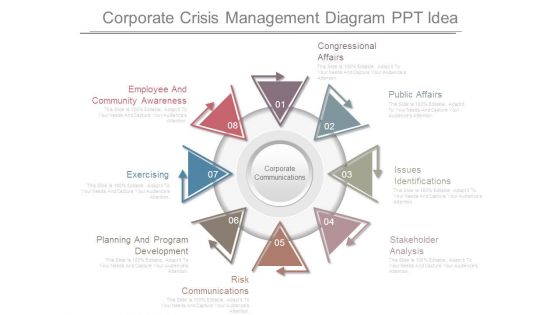
Corporate Crisis Management Diagram Ppt Idea
This is a corporate crisis management diagram ppt idea. This is a eight stage process. The stages in this process are corporate communications, employee and community awareness, exercising, planning and program development, risk communications, stakeholder analysis, issues identifications, public affairs, congressional affairs.
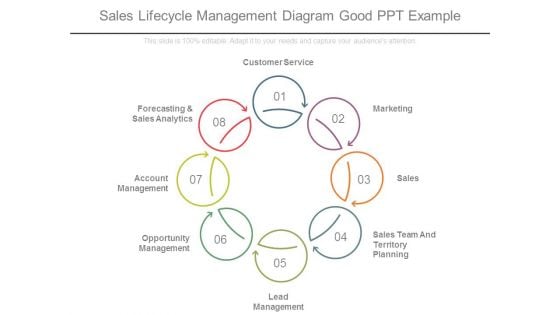
Sales Lifecycle Management Diagram Good Ppt Example
This is a sales lifecycle management diagram good ppt example. This is a eight stage process. The stages in this process are customer service, marketing, sales, sales team and territory planning, lead management, opportunity management, account management, forecasting and sales analytics.
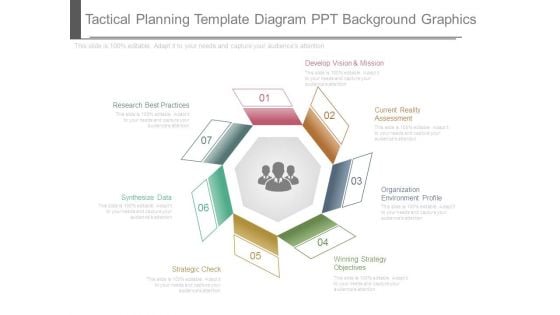
Tactical Planning Template Diagram Ppt Background Graphics
This is a tactical planning template diagram ppt background graphics. This is a seven stage process. The stages in this process are research best practices, develop vision and mission, current reality assessment, synthesize data, strategic check, winning strategy objectives, organization environment profile.
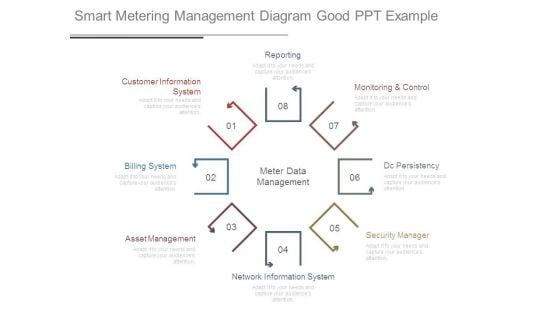
Smart Metering Management Diagram Good Ppt Example
This is a smart metering management diagram good ppt example. This is a eight stage process. The stages in this process are reporting, customer information system, billing system, asset management, network information system, security manager, dc persistency, monitoring and control, meter data management.
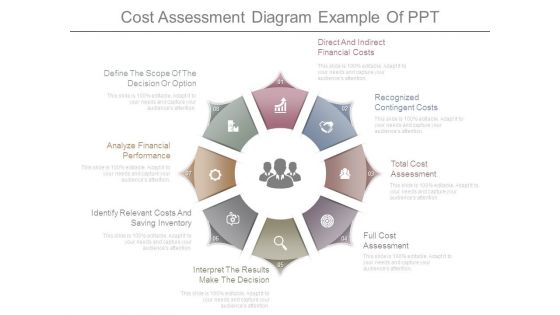
Cost Assessment Diagram Example Of Ppt
This is a cost assessment diagram example of ppt. This is a eight stage process. The stages in this process are define the scope of the decision or option, analyze financial performance, identify relevant costs and saving inventory, interpret the results make the decision, full cost assessment, total cost assessment, recognized contingent costs, direct and indirect financial costs.
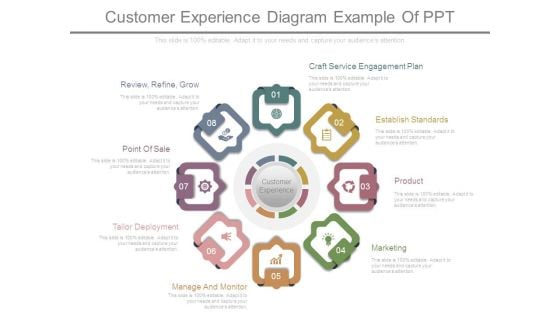
Customer Experience Diagram Example Of Ppt
This is a customer experience diagram example of ppt. This is a eight stage process. The stages in this process are customer experience, review, refine, grow, point of sale, tailor deployment, manage and monitor, craft service engagement plan, establish standards, product, marketing.
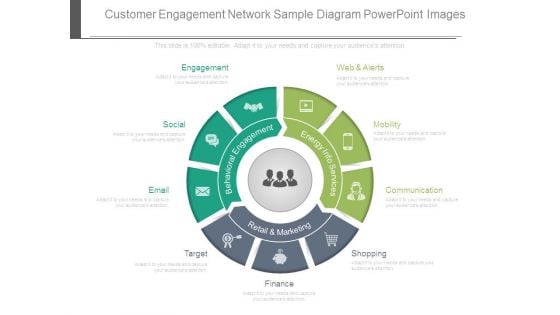
Customer Engagement Network Sample Diagram Powerpoint Images
This is a customer engagement network sample diagram powerpoint images. This is a three stage process. The stages in this process are retail and marketing, behavioral engagement, enjoy info services, engagement, social, email, target, finance, shopping, communication, mobility, web and alerts.
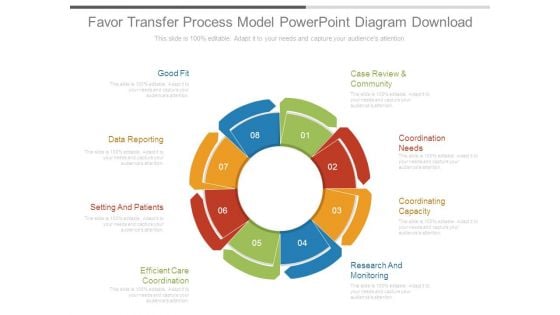
Favor Transfer Process Model Powerpoint Diagram Download
This is a favor transfer process model powerpoint diagram download. This is a eight stage process. The stages in this process are good fit, data reporting, setting and patients, efficient care coordination, research and monitoring, coordinating capacity, coordination needs, case review and community.

Problem Solving Skills Diagram Powerpoint Presentation Examples
This is a problem solving skills diagram powerpoint presentation examples. This is a six stage process. The stages in this process are define the problem, design a solution, settle on a course of action, troubleshoot the problem, adjust future actions, take action.
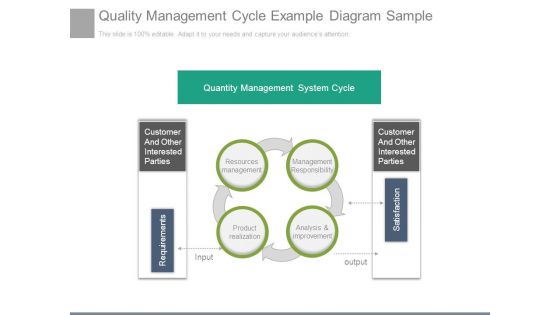
Quality Management Cycle Example Diagram Sample
This is a quality management cycle example diagram sample. This is a four stage process. The stages in this process are quantity management system cycle, customer and other interested parties, requirements, resources management, management responsibility, analysis and improvement, product realization, satisfaction.
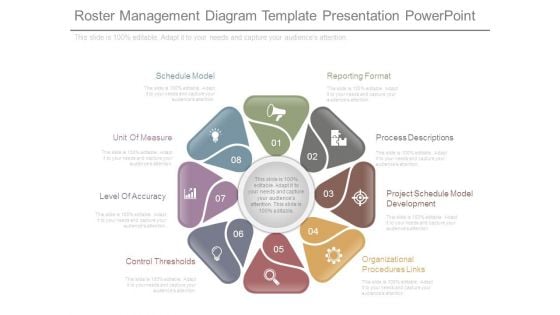
Roster Management Diagram Template Presentation Powerpoint
This is a roster management diagram template presentation powerpoint. This is a eight stage process. The stages in this process are schedule model, unit of measure, level of accuracy, control thresholds, organizational procedures links, project schedule model development, process descriptions, reporting format.
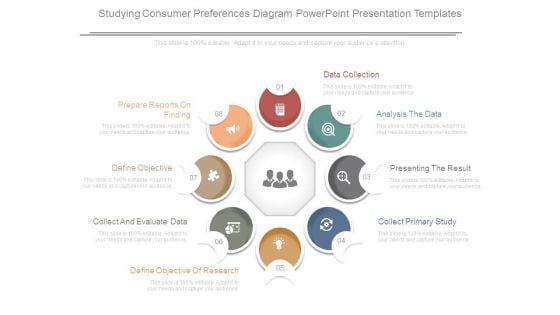
Studying Consumer Preferences Diagram Powerpoint Presentation Templates
This is a studying consumer preferences diagram powerpoint presentation templates. This is a eight stage process. The stages in this process are prepare reports on finding, define objective, collect and evaluate data, define objective of research, collect primary study, presenting the result, analysis the data, data collection.
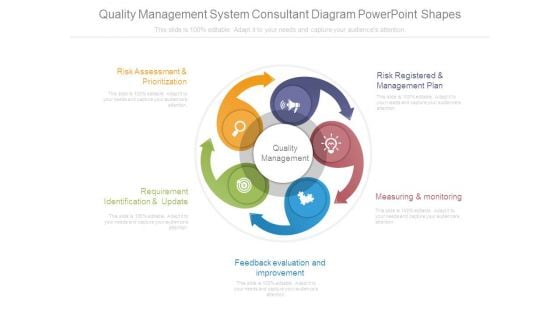
Quality Management System Consultant Diagram Powerpoint Shapes
This is a quality management system consultant diagram powerpoint shapes. This is a five stage process. The stages in this process are risk assessment and prioritization, requirement identification and update, feedback evaluation and improvement, measuring and monitoring, risk registered and management plan.
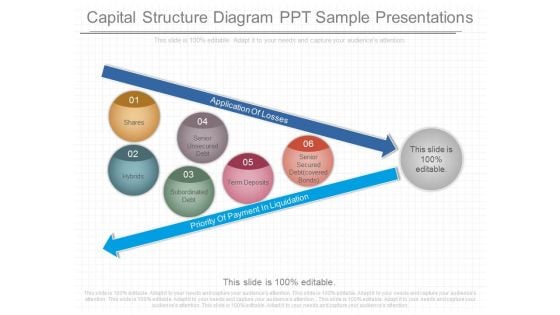
Capital Structure Diagram Ppt Sample Presentations
This is a capital structure diagram ppt sample presentations. This is a six stage process. The stages in this process are application of losses, shares, hybrids, senior unsecured debt, subordinated debt, term deposits, senior secured debt covered bonds, priority of payment in liquidation.
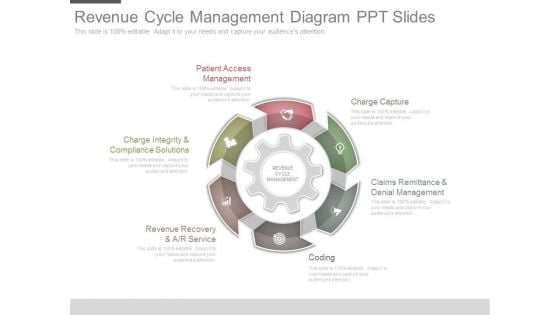
Revenue Cycle Management Diagram Ppt Slides
This is a revenue cycle management diagram ppt slides. This is a six stage process. The stages in this process are charge capture, claims remittance and denial management, coding, revenue recovery and a r service, charge integrity and compliance solutions, patient access management, revenue cycle management.
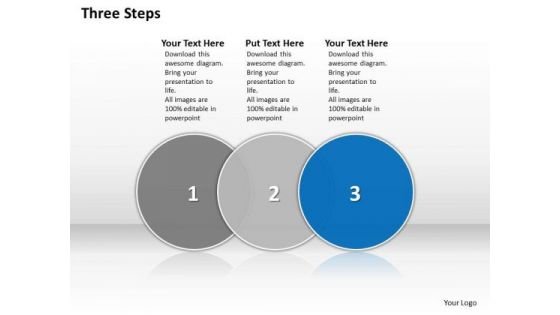
Ppt Circular Interpretation Of 3 State Diagram Describing Plan PowerPoint Templates
PPT circular interpretation of 3 state diagram describing plan PowerPoint Templates-The above template displays a diagram of three Circular text boxes attached in Horizontal manner. The Blue Circular Box Highlighted in the Diagram Implies that third stage is under processing. Use this diagram to make your Business PPT more attractive and interesting. Deliver this amazing presentation slide to mesmerize your audience. You can change color, size and orientation of any icon to your liking.-PPT circular interpretation of 3 state diagram describing plan PowerPoint Templates-3, Advice, Analysis, Analyze, Answer, Area, Career, Chart, Choice, Circles, Concept, Determination, Diagram, Graph, Idea, Illustration, Intersect, Measurement, Opportunities, Options, Overlap, Overlapped, Overlapping, Passion, Passionate, Prioritize, Priority, Profession Design exclusive presentations with our Ppt Circular Interpretation Of 3 State Diagram Describing Plan PowerPoint Templates. Dont waste time struggling with PowerPoint. Let us do it for you.
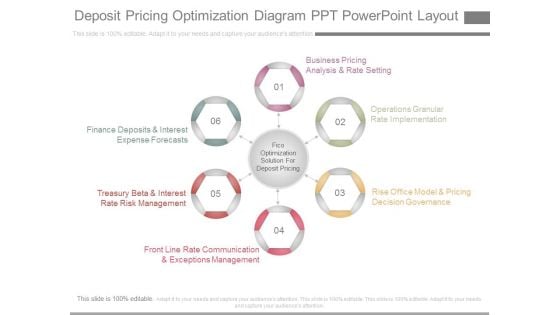
Deposit Pricing Optimization Diagram Ppt Powerpoint Layout
This is a deposit pricing optimization diagram ppt powerpoint layout. This is a six stage process. The stages in this process are business pricing analysis and rate setting, operations granular rate implementation, rise office model and pricing decision governance, front line rate communication and exceptions management, treasury beta and interest rate risk management, finance deposits and interest expense forecasts, fico optimization solution for deposit pricing.
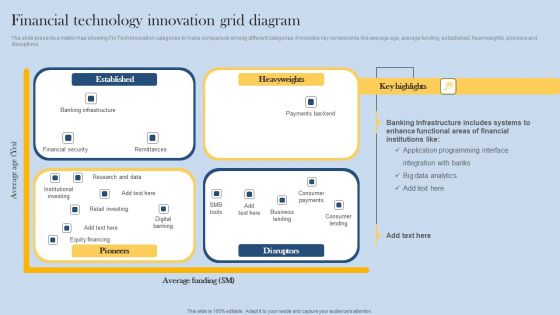
Financial Technology Innovation Grid Diagram Inspiration PDF
The slide presents a matrix map showing Fin Tech innovation categories to make comparison among different categories. It includes key components like average age, average funding, established, heavyweights, pioneers and disruptions. Presenting Financial Technology Innovation Grid Diagram Inspiration PDF to dispense important information. This template comprises four stages. It also presents valuable insights into the topics including Established, Heavyweights, Research Data. This is a completely customizable PowerPoint theme that can be put to use immediately. So, download it and address the topic impactfully.
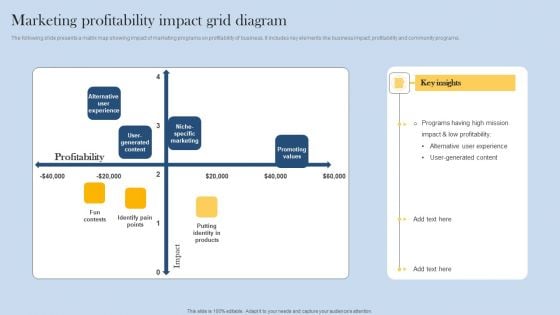
Marketing Profitability Impact Grid Diagram Ideas PDF
The following slide presents a matrix map showing impact of marketing programs on profitability of business. It includes key elements like business impact, profitability and community programs. Presenting Marketing Profitability Impact Grid Diagram Ideas PDF to dispense important information. This template comprises one stages. It also presents valuable insights into the topics including Profitability, Promoting Values, Niche Specific Marketing. This is a completely customizable PowerPoint theme that can be put to use immediately. So, download it and address the topic impactfully.
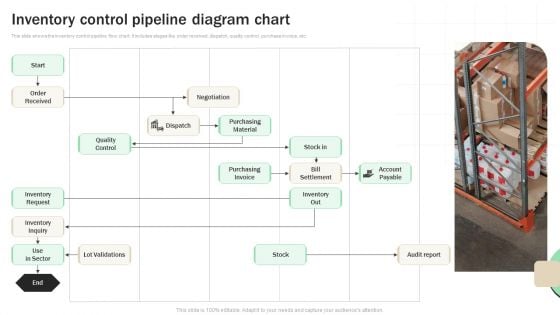
Inventory Control Pipeline Diagram Chart Structure PDF
This slide shows the inventory control pipeline flow chart. It includes stages like order received, dispatch, quality control, purchase invoice, etc. Pitch your topic with ease and precision using this Inventory Control Pipeline Diagram Chart Structure PDF. This layout presents information on Inventory Request, Inventory Inquiry, Quality Control . It is also available for immediate download and adjustment. So, changes can be made in the color, design, graphics or any other component to create a unique layout.

Business Analysis Levels Sample Diagram Examples Slides
This is a business analysis levels sample diagram examples slides. This is a one stage process. The stages in this process are business analysis, strategic, operational, tactical, vision goal objective, structure polices, i want, you want, we weant, they want, opportunities, problems, application architecture, text, cep, vp marketing, vp proctive, sales manager, project manager, vpit, prodect owner, sme.
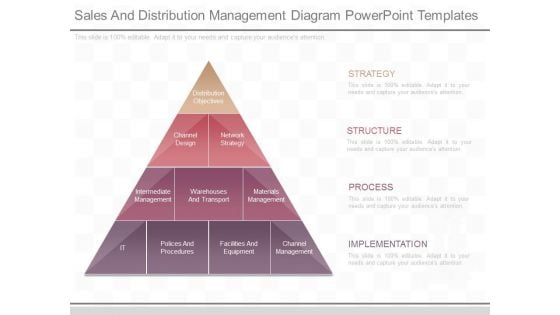
Sales And Distribution Management Diagram Powerpoint Templates
This is a sales and distribution management diagram powerpoint templates. This is a four stage process. The stages in this process are strategy, structure, process, implementation, distribution objectives, channel design, network strategy, intermediate management, warehouses and transport, materials management, it, polices and procedures, facilities and equipment, channel management.
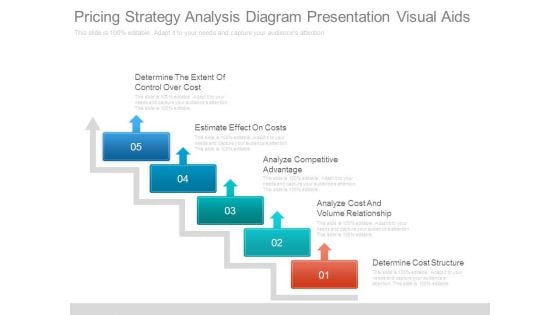
Pricing Strategy Analysis Diagram Presentation Visual Aids
This is a pricing strategy analysis diagram presentation visual aids. This is a five stage process. The stages in this process are determine the extent of control over cost, estimate effect on costs, analyze competitive advantage, analyze cost and volume relationship, determine cost structure.
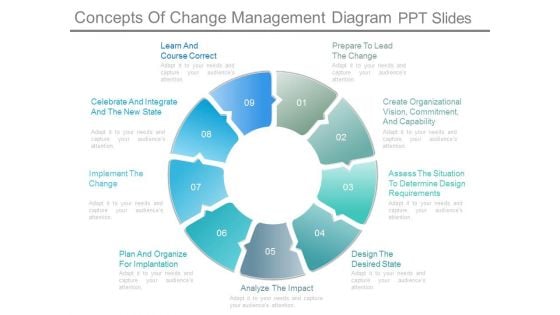
Concepts Of Change Management Diagram Ppt Slides
This is a concepts of change management diagram ppt slides. This is a nine stage process. The stages in this process are learn and course correct, prepare to lead the change, create organizational vision, commitment, and capability, assess the situation to determine design requirements, design the desired state, analyze the impact, plan and organize for implantation, implement the change, celebrate and integrate and the new state.
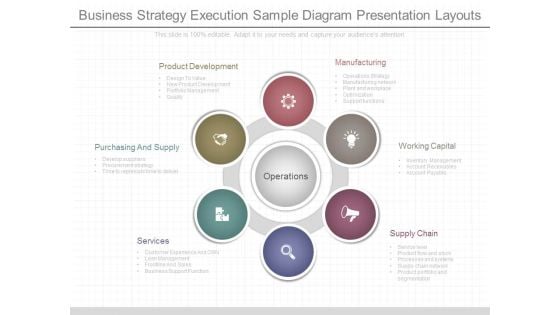
Business Strategy Execution Sample Diagram Presentation Layouts
This is a business strategy execution sample diagram presentation layouts. This is a six stage process. The stages in this process are manufacturing, operations strategy, manufacturing network, plant and workplace, optimization, support functions, working capital, inventory management, account receivables, account payable, supply chain, service level, product flow and stock, processes and systems, supply chain network, product portfolio and segmentation, services, customer experience and crn, lean management, frontline and sales, business support function, purchasing and supply, develop suppliers, procurement strategy, time to replenish time to deliver, product development, design to value, new product development, portfolio management, quality, operations.
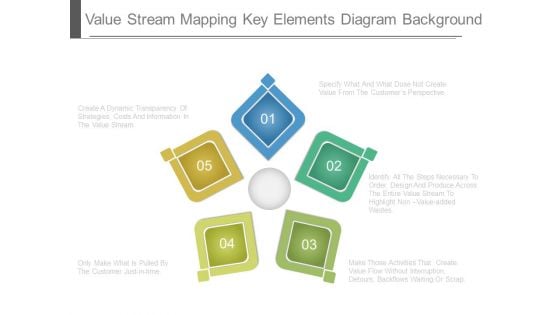
Value Stream Mapping Key Elements Diagram Background
This is a value stream mapping key elements diagram background. This is a five stage process. The stages in this process are specify what and what dose not create value from the customer perspective, identify all the steps necessary to order design and produce across the entire value stream to highlight non value added wastes, make those activities that create value flow without interruption detours backflows waiting or scrap, only make what is pulled by the customer just in time, create a dynamic transparency of strategies costs and information in the value stream.
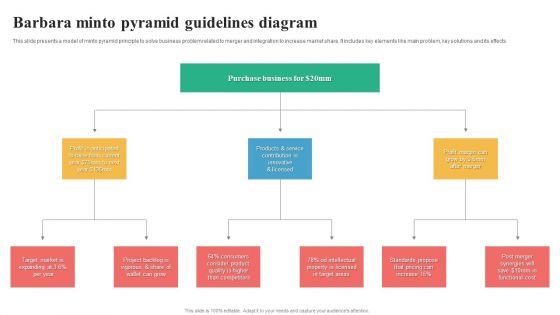
Barbara Minto Pyramid Guidelines Diagram Graphics PDF
This slide presents a model of minto pyramid principle to solve business problem related to merger and integration to increase market share. It includes key elements like main problem, key solutions and its effects. Presenting Barbara Minto Pyramid Guidelines Diagram Graphics PDF to dispense important information. This template comprises Six stages. It also presents valuable insights into the topics including Target Market, Project Backlog, Consumers Consider Product. This is a completely customizable PowerPoint theme that can be put to use immediately. So, download it and address the topic impactfully.
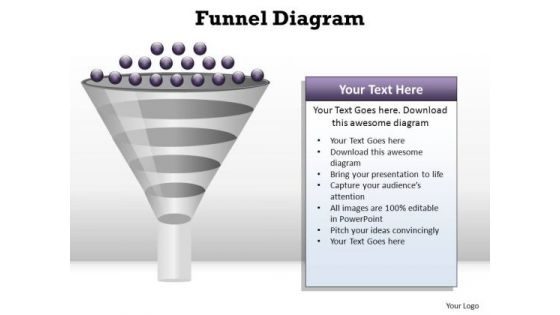
PowerPoint Process Download Funnel Diagram Ppt Template
PowerPoint Process Download Funnel Diagram PPT Template-Explore the various directions and layers existing in your in your plans and processes. Unravel the desired and essential elements of your overall strategy. Explain the relevance of the different layers and stages and directions in getting down to your core competence, ability and desired result.-These amazing PowerPoint pre-designed slides and PowerPoint templates have been carefully created by our team of experts to help you impress your audience. Our stunning collection of Powerpoint slides are 100% editable and can easily fit in any PowerPoint presentations. By using these animations and graphics in PowerPoint and you can easily make professional presentations. Any text can be entered at any point in the PowerPoint template or slide. Just DOWNLOAD our awesome PowerPoint templates and you are ready to go. Use our PowerPoint Process Download Funnel Diagram Ppt Template to meet deadlines. They are readymade to fit into any presentation structure.
Process Stages Line Diagram PowerPoint Slides
Process Stages Line Diagram PowerPoint Slides-These high quality powerpoint pre-designed slides and powerpoint templates have been carefully created by our professional team to help you impress your audience. All slides have been created and are 100% editable in powerpoint. Each and every property of any graphic - color, size, orientation, shading, outline etc. can be modified to help you build an effective powerpoint presentation. Any text can be entered at any point in the powerpoint template or slide. Simply DOWNLOAD, TYPE and PRESENT!These PowerPoint Presentation slides can be used for themes relating to--Business, businessman, chain, chart, communication, community, company, concept, connection, contact, corporate, creativity, data, database, diagram, draw, drawing, education, executive, flow, flowchart, global, graphic, group, illustration, internet, isolated, job, manager, meeting, net, network, networking, office, organization, people, person, plan, presentation, relationship, screen, social, structure, success, team, teamwork, web, white, work, writing Fence in problems with our Process Stages Line Diagram PowerPoint Slides. Try us out and see what a difference our templates make.
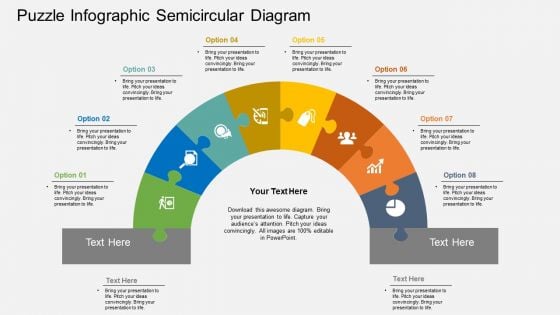
Puzzle Infographic Semicircular Diagram PowerPoint Template
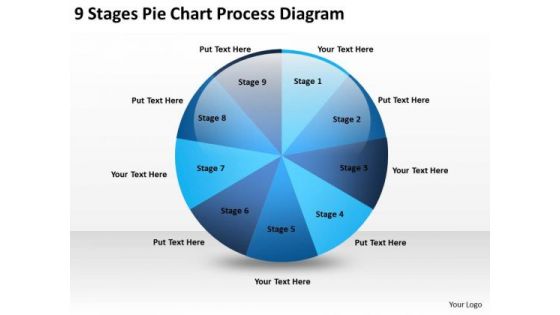
9 Stages Pie Chart Process Diagram How Do You Write Business Plan PowerPoint Slides
We present our 9 stages pie chart process diagram how do you write business plan PowerPoint Slides.Present our Process and Flows PowerPoint Templates because You can Zap them with our PowerPoint Templates and Slides. See them reel under the impact. Use our Circle Charts PowerPoint Templates because You can Create a matrix with our PowerPoint Templates and Slides. Feel the strength of your ideas click into place. Use our Business PowerPoint Templates because Our PowerPoint Templates and Slides are designed to help you succeed. They have all the ingredients you need. Present our Success PowerPoint Templates because Your audience will believe you are the cats whiskers. Download our Future PowerPoint Templates because Our PowerPoint Templates and Slides will give you great value for your money. Be assured of finding the best projection to highlight your words. Use these PowerPoint slides for presentations relating to Pie, chart, business, market, slice, isometric, display, perspective, green, corporate, blank, concept, sign, presentation, symbol, diagram,circle, graphic, finance, data, stock, element, bank, report, marketing, abstract, management, graph, modern, illustration, icon, motion, company,organization, information, environment, banking, financial. The prominent colors used in the PowerPoint template are Blue, Blue light, Blue navy. Add class with our 9 Stages Pie Chart Process Diagram How Do You Write Business Plan PowerPoint Slides. You will come out on top.
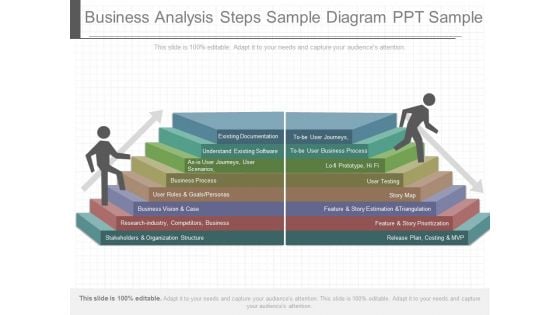
Business Analysis Steps Sample Diagram Ppt Sample
This is a business analysis steps sample diagram ppt sample. This is a two stage process. The stages in this process are existing documentation, understand existing software, as is user journeys user scenarios, business process, user roles and goals personas, business vision and case, research industry competitors business, stakeholders and organization structure, to be user journeys, to be user business process, lo fi prototype hi fi, user testing, story map, feature and story estimation and triangulation, feature and story prioritization, release plan, costing and mvp.
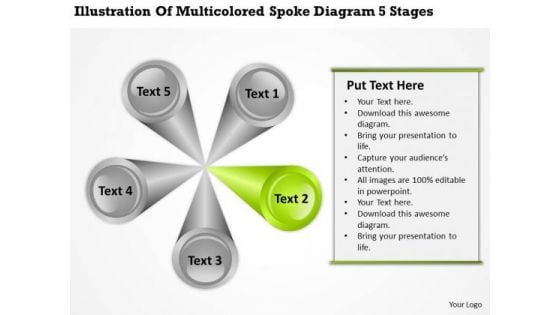
Illustration Of Multicolored Spoke Diagram 5 Stages Business Plan Excel PowerPoint Templates
We present our illustration of multicolored spoke diagram 5 stages business plan excel PowerPoint templates.Use our Marketing PowerPoint Templates because our bewitching PowerPoint Templates and Slides will delight your audience with the magic of your words. Present our Circle Charts PowerPoint Templates because Our PowerPoint Templates and Slides are specially created by a professional team with vast experience. They diligently strive to come up with the right vehicle for your brilliant Ideas. Download our Process and Flows PowerPoint Templates because Our PowerPoint Templates and Slides will effectively help you save your valuable time. They are readymade to fit into any presentation structure. Use our Business PowerPoint Templates because Our PowerPoint Templates and Slides are the chords of your song. String them along and provide the lilt to your views. Use our Shapes PowerPoint Templates because You should Throw the gauntlet with our PowerPoint Templates and Slides. They are created to take up any challenge.Use these PowerPoint slides for presentations relating to arrow, blue, chart, chevron, circle, circular, diagram, graphic, green, hub, icon, illustration, isometric, pie, pieces, process, purple, red, round, set, slices, stages, vector, wheel, yellow. The prominent colors used in the PowerPoint template are Green, Gray, Black. Breathe deep and easy with our Illustration Of Multicolored Spoke Diagram 5 Stages Business Plan Excel PowerPoint Templates. They remove any constriction you experience.
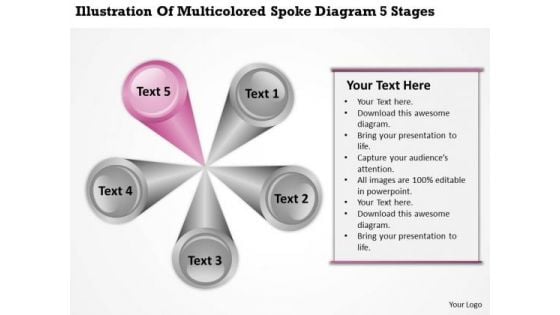
Multicolored Spoke Diagram 5 Stages Ppt Insurance Agency Business Plan PowerPoint Templates
We present our multicolored spoke diagram 5 stages ppt insurance agency business plan PowerPoint templates.Use our Marketing PowerPoint Templates because Our PowerPoint Templates and Slides will provide you a launch platform. Give a lift off to your ideas and send them into orbit. Use our Circle Charts PowerPoint Templates because Our PowerPoint Templates and Slides are topically designed to provide an attractive backdrop to any subject. Use our Process and Flows PowerPoint Templates because It will mark the footprints of your journey. Illustrate how they will lead you to your desired destination. Use our Business PowerPoint Templates because Our PowerPoint Templates and Slides have the Brilliant backdrops. Guaranteed to illuminate the minds of your audience. Present our Shapes PowerPoint Templates because Our PowerPoint Templates and Slides will let Your superior ideas hit the target always and everytime.Use these PowerPoint slides for presentations relating to arrow, blue, chart, chevron, circle, circular, diagram, graphic, green, hub, icon, illustration, isometric, pie, pieces, process, purple, red, round, set, slices, stages, vector, wheel, yellow. The prominent colors used in the PowerPoint template are Pink, Gray, Black. Choreograph your act with our Multicolored Spoke Diagram 5 Stages Ppt Insurance Agency Business Plan PowerPoint Templates. Your thoughts will automatically educate and entertain.
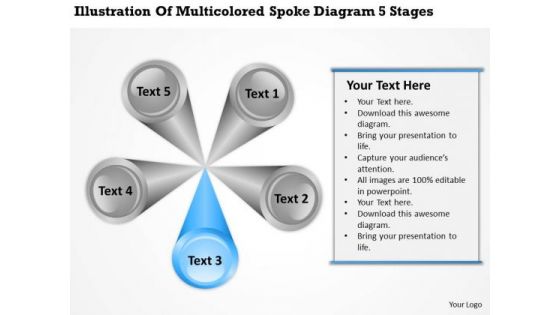
Multicolored Spoke Diagram 5 Stages Writing Business Plan Template PowerPoint Slides
We present our multicolored spoke diagram 5 stages writing business plan template PowerPoint Slides.Use our Marketing PowerPoint Templates because Our PowerPoint Templates and Slides are truly out of this world. Even the MIB duo has been keeping tabs on our team. Download and present our Circle Charts PowerPoint Templates because Our PowerPoint Templates and Slides will let your team Walk through your plans. See their energy levels rise as you show them the way. Download our Process and Flows PowerPoint Templates because you should Experience excellence with our PowerPoint Templates and Slides. They will take your breath away. Present our Business PowerPoint Templates because You can Score a slam dunk with our PowerPoint Templates and Slides. Watch your audience hang onto your every word. Download our Shapes PowerPoint Templates because Our PowerPoint Templates and Slides are created with admirable insight. Use them and give your group a sense of your logical mind.Use these PowerPoint slides for presentations relating to arrow, blue, chart, chevron, circle, circular, diagram, graphic, green, hub, icon, illustration, isometric, pie, pieces, process, purple, red, round, set, slices, stages, vector, wheel, yellow. The prominent colors used in the PowerPoint template are Blue, Gray, Black. Give the right exposure to your ideas. Our Multicolored Spoke Diagram 5 Stages Writing Business Plan Template PowerPoint Slides will enhance their clarity.
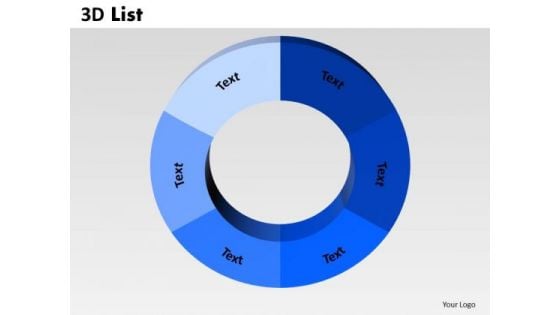
Strategic Management 3d List Circular Business Diagram
Double Your Chances With Our Strategic_Management_3D_List_Circular_Business_Diagram Powerpoint Templates. The Value Of Your Thoughts Will Increase Two-Fold.
Circular Core Diagram With Icons Powerpoint Template
Visually support your presentation with our above template of circular core diagram. This slide has been professionally designed to present four steps in circular order. This template offers an excellent background to build impressive presentation.
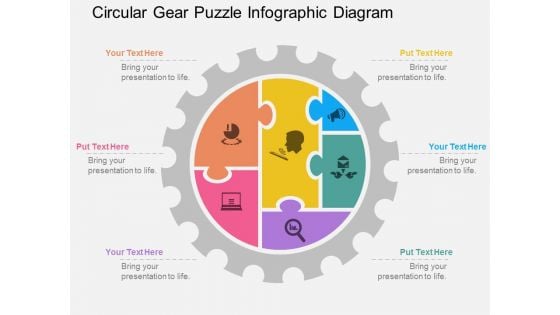
Circular Gear Puzzle Infographic Diagram Powerpoint Template
This PowerPoint template has been designed with circular gear puzzle infographic diagram. It contains technology and communication icons. Download this business slide for global technology and social media related topics.

Circular Matrix Diagram Business Agenda Ppt PowerPoint Presentation Complete Deck
Boost your confidence and team morale with this well-structured circular matrix diagram business agenda ppt powerpoint presentation complete deck. This prefabricated set gives a voice to your presentation because of its well-researched content and graphics. Our experts have added all the components very carefully, thus helping you deliver great presentations with a single click. Not only that, it contains a set of twelve slides that are designed using the right visuals, graphics, etc. Various topics can be discussed, and effective brainstorming sessions can be conducted using the wide variety of slides added in this complete deck. Apart from this, our PPT design contains clear instructions to help you restructure your presentations and create multiple variations. The color, format, design anything can be modified as deemed fit by the user. Not only this, it is available for immediate download. So, grab it now.
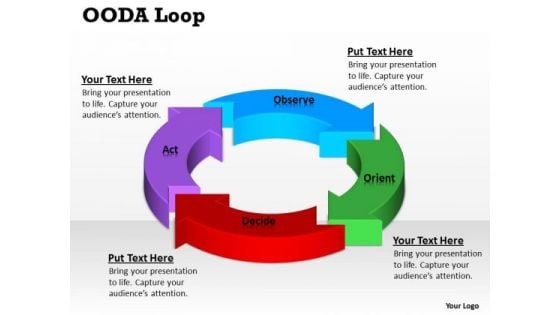
Strategic Management Ooda Loop Consulting Diagram
Delight Them With Our Strategic_Management_OODA_Loop_Consulting_Diagram Powerpoint Templates.
8 Plans For Target Achievement Arrows Venn Diagram PowerPoint Slides
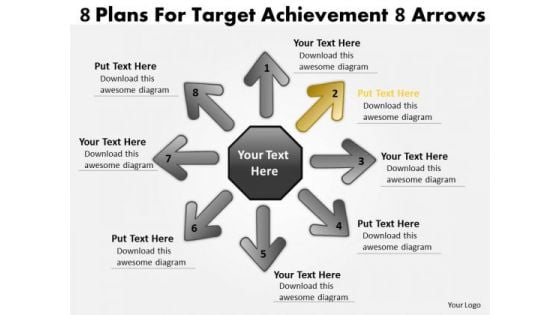
We present our 8 plans for target achievement arrows Venn Diagram PowerPoint Slides.Present our Symbol PowerPoint Templates because forward thinking is the way to go. Present our Process and Flows PowerPoint Templates because you can Show them how to churn out fresh ideas. Use our Arrows PowerPoint Templates because you know what it takes to keep it fit and healthy. Present our Communication PowerPoint Templates because all for one and one for all. Use our Business PowerPoint Templates because watch the excitement levels rise as they realise their worth.Use these PowerPoint slides for presentations relating to Abstract, Arrow, Background, Buttons, Circle, Clean, Communication, Concept, Conceptual, Design, Diagram, Direction, Elements, Exchange, Flow, Flowchart, Graph, Graphic, Icon, Illustration, Internet, Precise, Process, Red, Sign, Symbol, Template, Ultimate Simple, Web Graphics, Web Icons. The prominent colors used in the PowerPoint template are Yellow, Gray, Black. PowerPoint presentation experts tell us our 8 plans for target achievement arrows Venn Diagram PowerPoint Slides are visually appealing. People tell us our Circle PowerPoint templates and PPT Slides will help you be quick off the draw. Just enter your specific text and see your points hit home. People tell us our 8 plans for target achievement arrows Venn Diagram PowerPoint Slides are Zippy. Presenters tell us our Conceptual PowerPoint templates and PPT Slides are Playful. Customers tell us our 8 plans for target achievement arrows Venn Diagram PowerPoint Slides are Liberated. The feedback we get is that our Background PowerPoint templates and PPT Slides are Pleasant. Win accolades with our 8 Plans For Target Achievement Arrows Venn Diagram PowerPoint Slides. You will come out on top.


 Continue with Email

 Home
Home


