Circle Graph
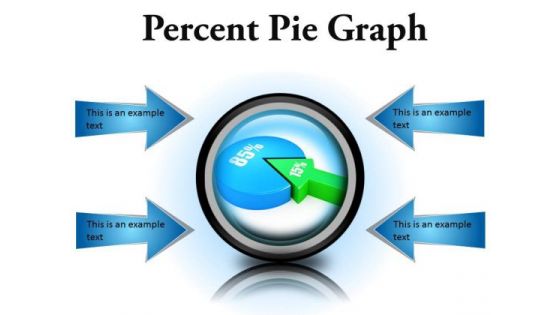
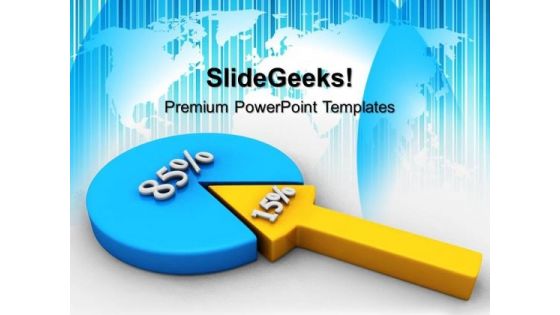
Percent Pie Graph Business PowerPoint Presentation Slides Cc
Microsoft PowerPoint Slides and Backgrounds with fifteen and eighty five percent proportion pie chart Record growth with our Percent Pie Graph Business PowerPoint Presentation Slides Cc. Download without worries with our money back guaranteee.
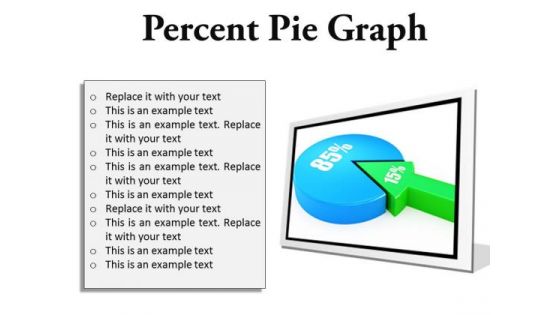
Percent Pie Graph Business PowerPoint Presentation Slides F
Microsoft PowerPoint Slides and Backgrounds with fifteen and eighty five percent proportion pie chart Prove your equity with our Percent Pie Graph Business PowerPoint Presentation Slides F. Display the sound judgement of your thoughts.
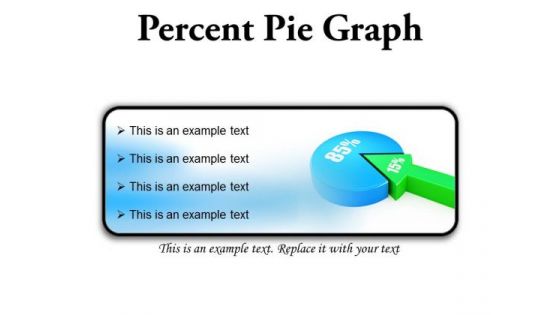
Percent Pie Graph Business PowerPoint Presentation Slides R
Microsoft PowerPoint Slides and Backgrounds with fifteen and eighty five percent proportion pie chart Our Percent Pie Graph Business PowerPoint Presentation Slides R are designed by an avant-garde team. They are always abreast of the state of the art.
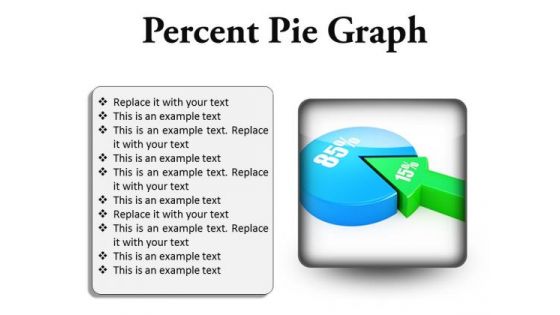
Percent Pie Graph Business PowerPoint Presentation Slides S
Microsoft PowerPoint Slides and Backgrounds with fifteen and eighty five percent proportion pie chart Put your ideas out to farm. Our Percent Pie Graph Business PowerPoint Presentation Slides S will get your plans to grow.
Percentage Pie Graph Marketing PowerPoint Templates And PowerPoint Themes 0412
Microsoft Powerpoint Templates and Background with percent proportion pie chart Enthuse your audience with your ideas. Our Percentage Pie Graph Marketing PowerPoint Templates And PowerPoint Themes 0412 will generate keenness.
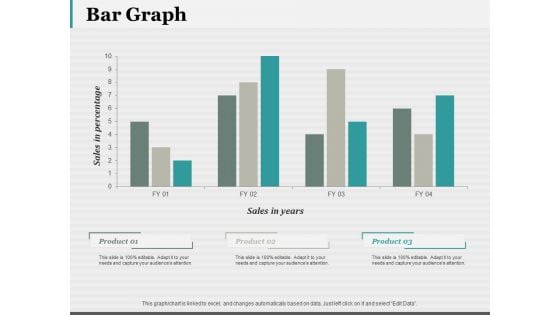
Bar Graph 7 QC Tools Ppt PowerPoint Presentation Styles Structure
This is a bar graph 7 qc tools ppt powerpoint presentation styles structure. This is a three stage process. The stages in this process are bar graph, finance, marketing, analysis, investment.
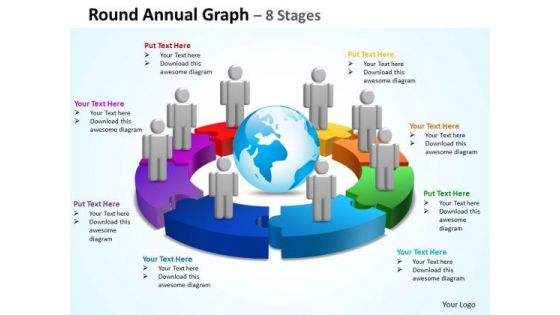
Business Diagram Round Annual Graph 8 Stages Marketing Diagram
Document Your Views On Our Business Diagram Round Annual Graph 8 Stages Marketing Diagram Powerpoint Templates. They Will Create A Strong Impression.

Business Graph Success PowerPoint Templates And PowerPoint Themes 0812
Business Graph Success PowerPoint Templates And PowerPoint Themes 0812-Microsoft Powerpoint Templates and Background with business graph Use our Business Graph Success PowerPoint Templates And PowerPoint Themes 0812 to meet deadlines. They are readymade to fit into any presentation structure.
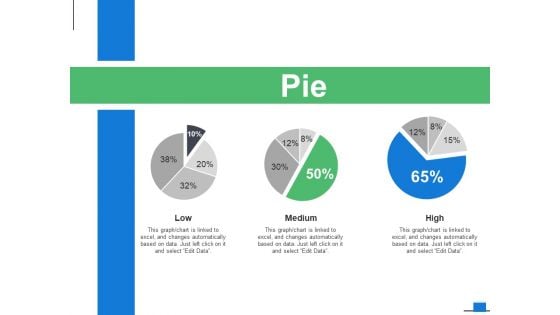
Pie Financial Graph Ppt PowerPoint Presentation Gallery Gridlines
This is a pie financial graph ppt powerpoint presentation gallery gridlines. This is a three stage process. The stages in this process are finance, marketing, management, investment, analysis.

Stock Photo Pie Graph For Business Performance Ppt Template
Our Stock Photo Pie Graph For Business Performance PPT template Powerpoint Templates Allow You To Do It With Ease. Just Like Picking The Low Hanging Fruit.
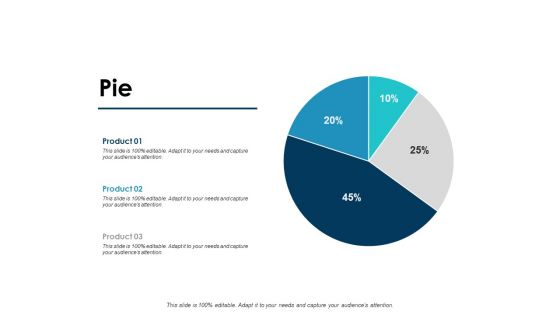
Pie Financial Graph Ppt PowerPoint Presentation Model Gridlines
This is a pie financial graph ppt powerpoint presentation model gridlines. This is a three stage process. The stages in this process are finance, marketing, management, investment, analysis.
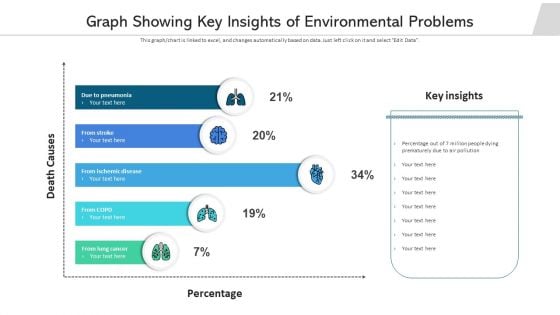
Graph Showing Key Insights Of Environmental Problems Structure PDF
Pitch your topic with ease and precision using this graph showing key insights of environmental problems structure pdf. This layout presents information on graph showing key insights of environmental problems. It is also available for immediate download and adjustment. So, changes can be made in the color, design, graphics or any other component to create a unique layout.
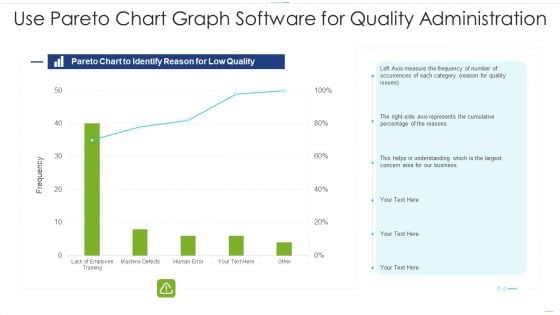
Use Pareto Chart Graph Software For Quality Administration Structure PDF
Pitch your topic with ease and precision using this use pareto chart graph software for quality administration structure pdf. This layout presents information on use pareto chart graph software for quality administration. It is also available for immediate download and adjustment. So, changes can be made in the color, design, graphics or any other component to create a unique layout.
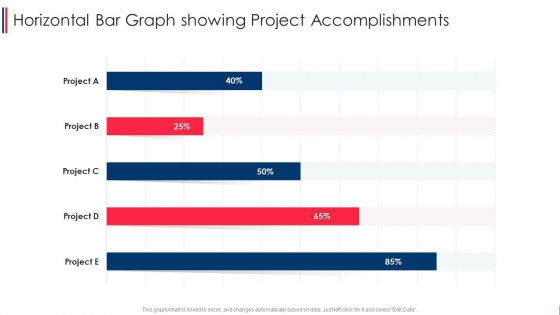
Horizontal Bar Graph Showing Project Accomplishments Structure PDF
Showcasing this set of slides titled horizontal bar graph showing project accomplishments structure pdf. The topics addressed in these templates are horizontal bar graph showing project accomplishments. All the content presented in this PPT design is completely editable. Download it and make adjustments in color, background, font etc. as per your unique business setting.
Pie Graph On Screen Vector Icon Ppt PowerPoint Presentation Pictures
Presenting this set of slides with name pie graph on screen vector icon ppt powerpoint presentation pictures. The topics discussed in these slides are pie graph on screen vector icon. This is a completely editable PowerPoint presentation and is available for immediate download. Download now and impress your audience.
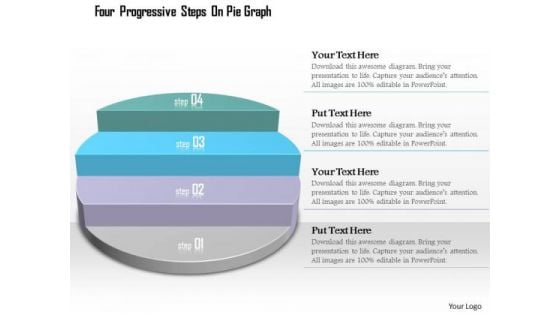
Business Diagram Four Progressive Steps On Pie Graph Presentation Template
This diagram displays progressive steps on pie chart. It contains graphic of pie graph with four steps. Use this diagram, in your presentations to express views on process, steps, stages, progress, targets, goals, success and achievements. Give professional appearance to your presentations using this business slide.
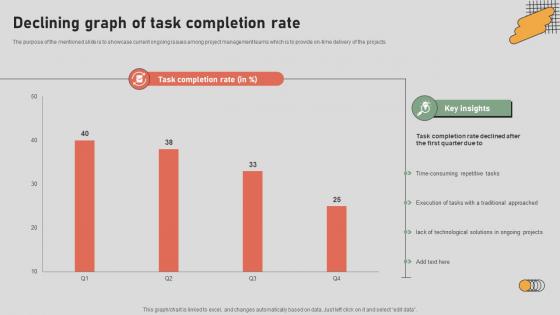
The Digital Project Managers Declining Graph Of Task Completion Rate
The purpose of the mentioned slide is to showcase current ongoing issues among project management teams which is to provide on-time delivery of the projects. Whether you have daily or monthly meetings, a brilliant presentation is necessary. The Digital Project Managers Declining Graph Of Task Completion Rate can be your best option for delivering a presentation. Represent everything in detail using The Digital Project Managers Declining Graph Of Task Completion Rate and make yourself stand out in meetings. The template is versatile and follows a structure that will cater to your requirements. All the templates prepared by Slidegeeks are easy to download and edit. Our research experts have taken care of the corporate themes as well. So, give it a try and see the results. The purpose of the mentioned slide is to showcase current ongoing issues among project management teams which is to provide on-time delivery of the projects.
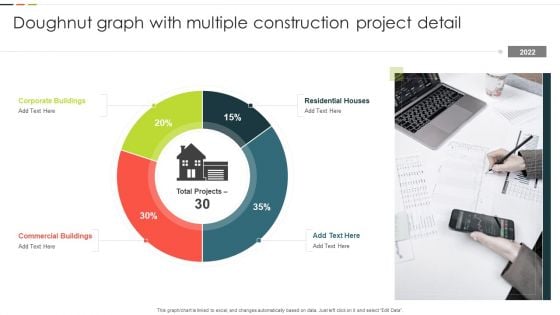
Doughnut Graph With Multiple Construction Project Detail Structure PDF
This graph or chart is linked to excel, and changes automatically based on data. Just left click on it and select Edit Data. Showcasing this set of slides titled Doughnut Graph With Multiple Construction Project Detail Structure PDF. The topics addressed in these templates are Corporate Buildings, Residential Houses, Commercial Buildings. All the content presented in this PPT design is completely editable. Download it and make adjustments in color, background, font etc. as per your unique business setting.
Consumer Support Department Monthly Complaints Tracking Graph Diagrams PDF
Presenting onsumer Support Department Monthly Complaints Tracking Graph Diagrams PDF to dispense important information. This template comprises Three stages. It also presents valuable insights into the topics including Department Monthly, Complaints Tracking Graph. This is a completely customizable PowerPoint theme that can be put to use immediately. So, download it and address the topic impactfully.
Distributed Network Graph Algorithm Ppt Powerpoint Presentation Outline Master Slide
This is a distributed network graph algorithm ppt powerpoint presentation outline master slide. This is a four stage process. The stages in this process are scatter plot, probability plots, plot diagram.
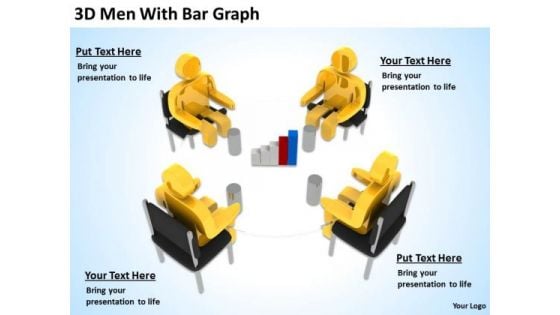
Business People Vector 3d Men With Bar Graph PowerPoint Slides
We present our business people vector 3d men with bar graph PowerPoint Slides.Use our People PowerPoint Templates because Our PowerPoint Templates and Slides are a sure bet. Gauranteed to win against all odds. Download and present our Business PowerPoint Templates because Our PowerPoint Templates and Slides will bullet point your ideas. See them fall into place one by one. Download and present our Flow Charts PowerPoint Templates because Our PowerPoint Templates and Slides are created by a hardworking bunch of busybees. Always flitting around with solutions gauranteed to please. Download our Marketing PowerPoint Templates because It can Bubble and burst with your ideas. Use our Shapes PowerPoint Templates because Our PowerPoint Templates and Slides will let you Leave a lasting impression to your audiences. They possess an inherent longstanding recall factor.Use these PowerPoint slides for presentations relating to 3d, accounting, analysis, bar, business, cartoon,cash, character, chart, clipart, committee, company, concept, corporate,council, directors, display, document, economics, executive, figure, finance,financial, goal, graph, group, growth, guy, human, humanoid, man, management,market, meeting, money, office, percentage, performance, pie, presentation, report,room, statistics, table, team. The prominent colors used in the PowerPoint template are Yellow, Black, Gray. Professionals tell us our business people vector 3d men with bar graph PowerPoint Slides have awesome images to get your point across. Professionals tell us our analysis PowerPoint templates and PPT Slides will help you be quick off the draw. Just enter your specific text and see your points hit home. People tell us our business people vector 3d men with bar graph PowerPoint Slides effectively help you save your valuable time. Customers tell us our bar PowerPoint templates and PPT Slides are effectively colour coded to prioritise your plans They automatically highlight the sequence of events you desire. The feedback we get is that our business people vector 3d men with bar graph PowerPoint Slides will generate and maintain the level of interest you desire. They will create the impression you want to imprint on your audience. Use our business PowerPoint templates and PPT Slides have awesome images to get your point across. Upgrade your presentation with our Business People Vector 3d Men With Bar Graph PowerPoint Slides. Download without worries with our money back guaranteee.
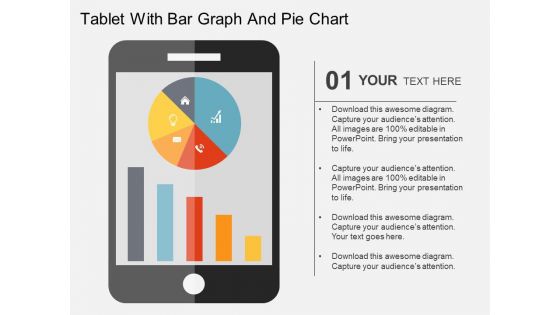
Tablet With Bar Graph And Pie Chart Powerpoint Templates
This business slide has been designed with business graphs on computer tablet. You may download this PPT slide to display statistical analysis. This slide will help you to sequence your thoughts.
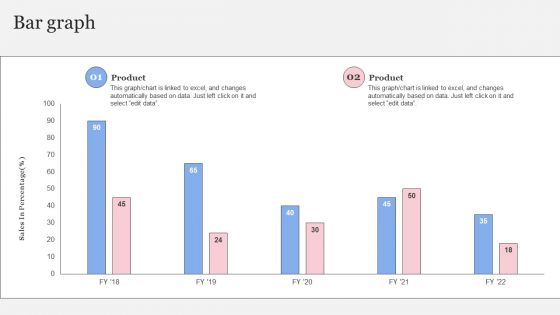
Complete Brand Promotion Playbook Bar Graph Structure PDF
Deliver an awe inspiring pitch with this creative Complete Brand Promotion Playbook Bar Graph Structure PDF bundle. Topics like Product, Automatically, Excel Changes can be discussed with this completely editable template. It is available for immediate download depending on the needs and requirements of the user.
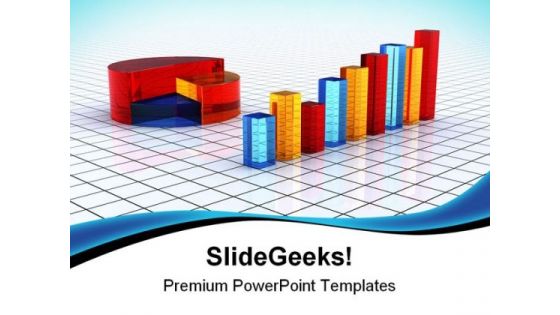
Transparent Colorful Graph Business PowerPoint Templates And PowerPoint Backgrounds 0811
Microsoft PowerPoint Template and Background with transparent colorful bars and pie You will rarely find fault with our Transparent Colorful Graph Business PowerPoint Templates And PowerPoint Backgrounds 0811. They are designed by a fastidious team.
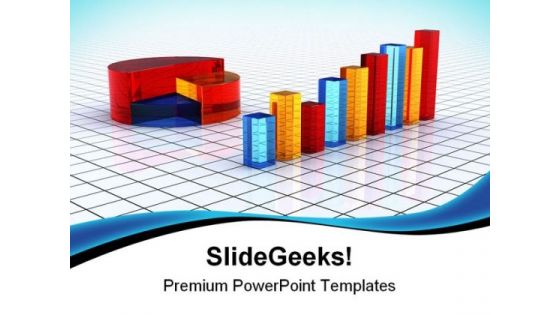
Transparent Colorful Graph Business PowerPoint Themes And PowerPoint Slides 0811
Microsoft PowerPoint Theme and Slide with transparent colorful bars and pie Continue on your path to success with our Transparent Colorful Graph Business PowerPoint Themes And PowerPoint Slides 0811. You will come out on top.
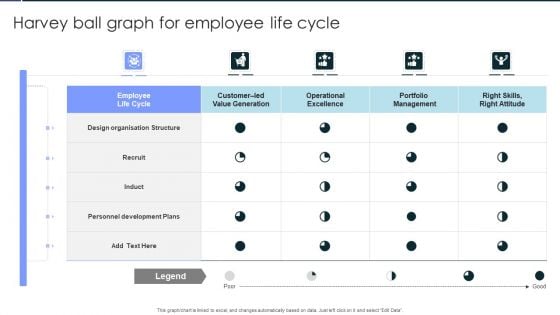
Harvey Ball Graph For Employee Life Cycle Pictures PDF
Pitch your topic with ease and precision using this Harvey Ball Graph For Employee Life Cycle Pictures PDF. This layout presents information on Employee Life Cycle, Design Organisation Structure, Personnel Development Plans . It is also available for immediate download and adjustment. So, changes can be made in the color, design, graphics or any other component to create a unique layout.

Business Graph Up PowerPoint Templates And PowerPoint Themes 1012
Business Graph Up PowerPoint Templates And PowerPoint Themes 1012-This PowerPoint Template shows the Bar Graph with increasing percentage which signifies the Financial Growth. The Template signifies the concept of Team Work, Team Leader etc. The structure of our templates allows you to effectively highlight the key issues concerning the growth of your business.-Business Graph Up PowerPoint Templates And PowerPoint Themes 1012-This PowerPoint template can be used for presentations relating to-Business graph, success, arrows, business, signs, shapes Disentangle the web with our Business Graph Up PowerPoint Templates And PowerPoint Themes 1012. Seperate the various strands of thought.

Growth Graph Moving Up PowerPoint Templates And PowerPoint Themes 1012
Growth Graph Moving Up PowerPoint Templates And PowerPoint Themes 1012-This PowerPoint Template shows the Bar Graph with increasing percentage which signifies the Financial Growth. The Template signifies the concept of Team Work, Team Leader etc. The structure of our templates allows you to effectively highlight the key issues concerning the growth of your business.-Growth Graph Moving Up PowerPoint Templates And PowerPoint Themes 1012-This PowerPoint template can be used for presentations relating to-Business graph with rising arrow, success, business, arrows, marketing, finance Our Growth Graph Moving Up PowerPoint Templates And PowerPoint Themes 1012 are clear to even the farthest. They are designed for distance.
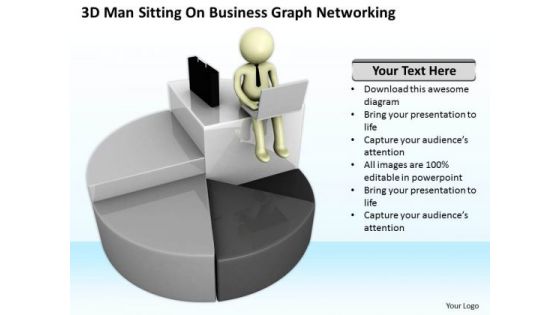
Successful Business People World PowerPoint Templates Graph Networking Slides
We present our successful business people world powerpoint templates graph networking Slides.Download our People PowerPoint Templates because Our PowerPoint Templates and Slides will Activate the energies of your audience. Get their creative juices flowing with your words. Use our Business PowerPoint Templates because Our PowerPoint Templates and Slides will give good value for money. They also have respect for the value of your time. Download and present our Pie charts PowerPoint Templates because You can Zap them with our PowerPoint Templates and Slides. See them reel under the impact. Present our Sales PowerPoint Templates because You can Create a matrix with our PowerPoint Templates and Slides. Feel the strength of your ideas click into place. Download and present our Marketing PowerPoint Templates because Our PowerPoint Templates and Slides will let your team Walk through your plans. See their energy levels rise as you show them the way.Use these PowerPoint slides for presentations relating to 3d, accounting, activity, background, businessman, chart, concept, corporate, diagram, financial, pie charts, growth, illustration, investing, investment, isolated, man, manager, market, money, people, sales, stats, strategy, succeed, success, tie, white. The prominent colors used in the PowerPoint template are Black, White, Gray. Get an added advantage with our Successful Business People World PowerPoint Templates Graph Networking Slides. Your thoughts will leap off the blocks.
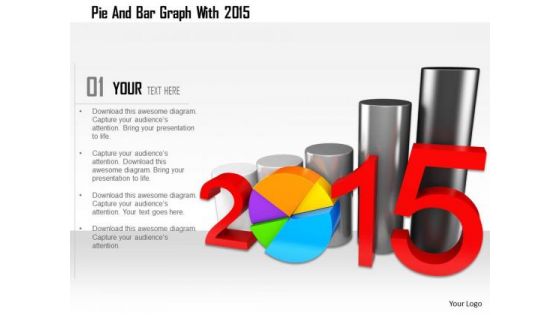
Stock Photo Pie And Bar Graph With 2015 PowerPoint Slide
This Power Point image template slide has been crafted with graphic of pie and bar graph and 2015 year text. This PPT slide contains the concept of business and financial analysis. Use this image slide and build quality presentation for your viewers.
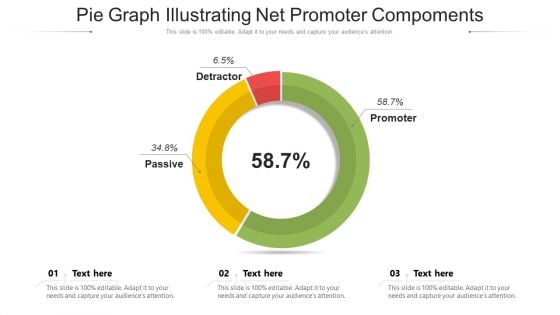
Pie Graph Illustrating Net Promoter Compoments Ppt Outline Mockup PDF
Pitch your topic with ease and precision using this pie graph illustrating net promoter compoments ppt outline mockup pdf. This layout presents information on detractors, passives, promoters. It is also available for immediate download and adjustment. So, changes can be made in the color, design, graphics or any other component to create a unique layout.
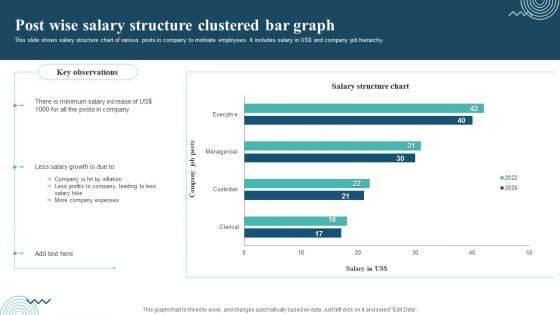
Post Wise Salary Structure Clustered Bar Graph Professional PDF
This slide shows salary structure chart of various posts in company to motivate employees. It includes salary in US dollar and company job hierarchy. Showcasing this set of slides titled Post Wise Salary Structure Clustered Bar Graph Professional PDF. The topics addressed in these templates are Minimum Salary Increase, Less Salary Growth, Company Expenses. All the content presented in this PPT design is completely editable. Download it and make adjustments in color, background, font etc. as per your unique business setting.

Money Graph Business PowerPoint Templates And PowerPoint Themes 1012
Money Graph Business PowerPoint Templates And PowerPoint Themes 1012-Visually support your Microsoft office PPT Presentation with our above template illustrating rising money chart. This image has been professionally designed to emphasize the business success concept. Our unique image makes your presentations professional showing that you care about even the smallest details. The structure of our templates allows you to effectively highlight the key issues concerning the growth of your business.-Money Graph Business PowerPoint Templates And PowerPoint Themes 1012-This PowerPoint template can be used for presentations relating to-Money graph, business, success, finance, money, marketing Exult in the comfort of our Money Graph Business PowerPoint Templates And PowerPoint Themes 1012. Experience the convenience they deliver.
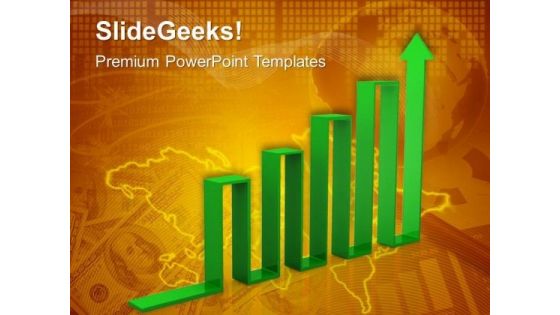
Arrow Graph Success PowerPoint Templates And PowerPoint Themes 1012
Arrow Graph Success PowerPoint Templates And PowerPoint Themes 1012-This PowerPoint Template shows arrow graph with increase. This image signifies the Financial or Business Growth. The Template assumes business concept. Use this template for Global Business. The structure of our templates allows you to effectively highlight the key issues concerning the growth of your business.-Arrow Graph Success PowerPoint Templates And PowerPoint Themes 1012-This PowerPoint template can be used for presentations relating to-Arrow to success, business, marketing, finance, arrows, success Guard against boring presentations with our Arrow Graph Success PowerPoint Templates And PowerPoint Themes 1012. Try us out and see what a difference our templates make.
Doughnut Graph Icon Highlighting IT Team Structure Structure PDF
Presenting Doughnut Graph Icon Highlighting IT Team Structure Structure PDF to dispense important information. This template comprises four stages. It also presents valuable insights into the topics including Doughnut Graph, Icon Highlighting, IT Team Structure. This is a completely customizable PowerPoint theme that can be put to use immediately. So, download it and address the topic impactfully.
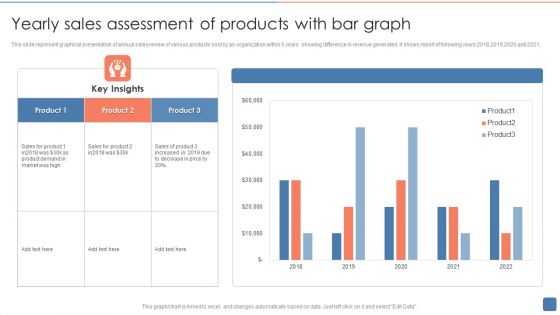
Yearly Sales Assessment Of Products With Bar Graph Structure PDF
This slide represent graphical presentation of annual sales review of various products sold by an organization within 5 years showing difference in revenue generated .It shows report of following years 2018,2019,2020,and 2021. Showcasing this set of slides titled Yearly Sales Assessment Of Products With Bar Graph Structure PDF. The topics addressed in these templates are Product, Sales Of Product, Product Demand. All the content presented in this PPT design is completely editable. Download it and make adjustments in color, background, font etc. as per your unique business setting.
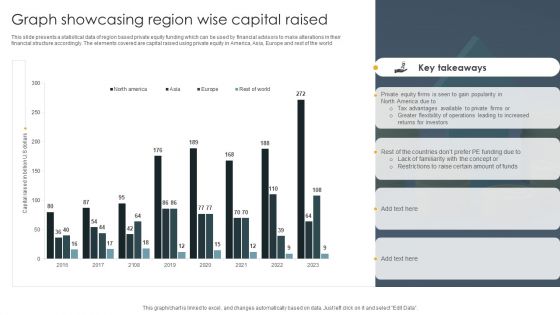
Graph Showcasing Region Wise Capital Raised Demonstration PDF
This slide presents a statistical data of region based private equity funding which can be used by financial advisors to make alterations in their financial structure accordingly. The elements covered are capital raised using private equity in America, Asia, Europe and rest of the world. Showcasing this set of slides titled Graph Showcasing Region Wise Capital Raised Demonstration PDF. The topics addressed in these templates are Investors, Tax Advantages, Private Equity. All the content presented in this PPT design is completely editable. Download it and make adjustments in color, background, font etc. as per your unique business setting.
Bar Graph Business PowerPoint Templates And PowerPoint Themes 1012
Bar Graph Business PowerPoint Templates And PowerPoint Themes 1012-This PowerPoint Template shows the Bar Graph with increasing percentage which signifies the Financial Growth. The Template signifies the concept of business growth. The structure of our templates allows you to effectively highlight the key issues concerning the growth of your business. Our PPT images are so ideally designed that it reveals the very basis of our PPT template are an effective tool to make your clients understand.-Bar Graph Business PowerPoint Templates And PowerPoint Themes 1012-This PowerPoint template can be used for presentations relating to-Financial bar graph chart, technology, money, business, finance, marketing Handle a delicate situation with our Bar Graph Business PowerPoint Templates And PowerPoint Themes 1012. Just download, type and present.
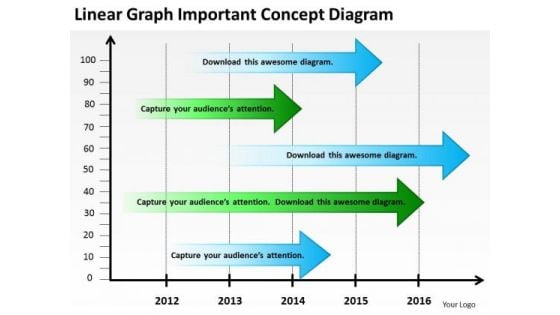
Graph Important Concept Diagram Business Plan Template PowerPoint Templates
We present our graph important concept diagram business plan template PowerPoint templates.Use our Arrows PowerPoint Templates because Watching this your Audience will Grab their eyeballs, they wont even blink. Present our Finance PowerPoint Templates because Our PowerPoint Templates and Slides will Activate the energies of your audience. Get their creative juices flowing with your words. Download our Marketing PowerPoint Templates because Our PowerPoint Templates and Slides are topically designed to provide an attractive backdrop to any subject. Use our Signs PowerPoint Templates because Our PowerPoint Templates and Slides are specially created by a professional team with vast experience. They diligently strive to come up with the right vehicle for your brilliant Ideas. Use our Business PowerPoint Templates because It will get your audience in sync.Use these PowerPoint slides for presentations relating to chart, bar, data, pie, percent, forecasting, economy, white, achievement, future, business, arrow, sign, line, symbol, diagram, styles, finance, stock, report, marketing, gray, analyzing, shape, abstract, graph, modern, economic, up, money, solution, design, making, growth, moving, grid, progress, artistic, profit, inspiration, background, investment, successful, financial, concepts, structure, ideas. The prominent colors used in the PowerPoint template are Blue, Green, Black. Advertise yourbelief in your ability. Our Graph Important Concept Diagram Business Plan Template PowerPoint Templates will help back up your boast.
Pie Graph Icon Ppt PowerPoint Presentation Complete Deck With Slides
If designing a presentation takes a lot of your time and resources and you are looking for a better alternative, then this Pie Graph Icon Ppt PowerPoint Presentation Complete Deck With Slides is the right fit for you. This is a prefabricated set that can help you deliver a great presentation on the topic. All the twelve slides included in this sample template can be used to present a birds-eye view of the topic. These slides are also fully editable, giving you enough freedom to add specific details to make this layout more suited to your business setting. Apart from the content, all other elements like color, design, theme are also replaceable and editable. This helps in designing a variety of presentations with a single layout. Not only this, you can use this PPT design in formats like PDF, PNG, and JPG once downloaded. Therefore, without any further ado, download and utilize this sample presentation as per your liking.
Directed Acyclic Graph In Powerpoint And Google Slides Cpb
Presenting our innovatively designed set of slides titled Directed Acyclic Graph In Powerpoint And Google Slides Cpb. This completely editable PowerPoint graphic exhibits Directed Acyclic Graph that will help you convey the message impactfully. It can be accessed with Google Slides and is available in both standard screen and widescreen aspect ratios. Apart from this, you can download this well-structured PowerPoint template design in different formats like PDF, JPG, and PNG. So, click the download button now to gain full access to this PPT design. Our Directed Acyclic Graph In Powerpoint And Google Slides Cpb are topically designed to provide an attractive backdrop to any subject. Use them to look like a presentation pro.
Loanable Funds Market Graph In Powerpoint And Google Slides Cpb
Presenting our innovatively designed set of slides titled Loanable Funds Market Graph In Powerpoint And Google Slides Cpb. This completely editable PowerPoint graphic exhibits Loanable Funds Market Graph that will help you convey the message impactfully. It can be accessed with Google Slides and is available in both standard screen and widescreen aspect ratios. Apart from this, you can download this well structured PowerPoint template design in different formats like PDF, JPG, and PNG. So, click the download button now to gain full access to this PPT design. Our Loanable Funds Market Graph In Powerpoint And Google Slides Cpb are topically designed to provide an attractive backdrop to any subject. Use them to look like a presentation pro.
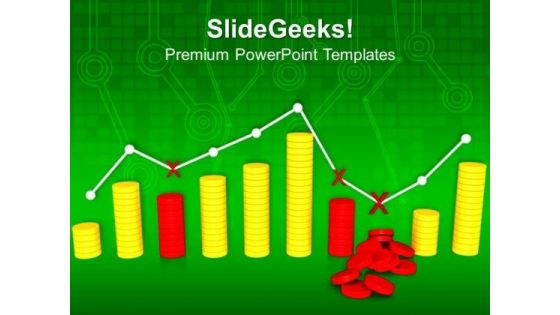
Graph With Business Fluctuations PowerPoint Templates And PowerPoint Themes 1012
Graph With Business Fluctuations PowerPoint Templates And PowerPoint Themes 1012-Emphatically define your message with our above template which contains a graphic of stack of coins with business graph showing fluctuations. This image represents the concept of business failure and success. Use this template for Business and Marketing purposes. The structure of our templates allows you to effectively highlight the key issues concerning the growth of your business.-Graph With Business Fluctuations PowerPoint Templates And PowerPoint Themes 1012-This PowerPoint template can be used for presentations relating to-Graph with fluctuations, business, finance, success, marketing, leadership On the face of it our Graph With Business Fluctuations PowerPoint Templates And PowerPoint Themes 1012 may appear quite simple. It takes a lot of effort to keep it that way.
Continuous Glucose Monitoring Graph In Powerpoint And Google Slides Cpb
Presenting our innovatively designed set of slides titled Continuous Glucose Monitoring Graph In Powerpoint And Google Slides Cpb. This completely editable PowerPoint graphic exhibits Continuous Glucose Monitoring Graph that will help you convey the message impactfully. It can be accessed with Google Slides and is available in both standard screen and widescreen aspect ratios. Apart from this, you can download this well structured PowerPoint template design in different formats like PDF, JPG, and PNG. So, click the download button now to gain full access to this PPT design. Our Continuous Glucose Monitoring Graph In Powerpoint And Google Slides Cpb are topically designed to provide an attractive backdrop to any subject. Use them to look like a presentation pro.
Crude Oil Graph In Powerpoint And Google Slides Cpb
Presenting our innovatively designed set of slides titled Crude Oil Graph In Powerpoint And Google Slides Cpb. This completely editable PowerPoint graphic exhibits Crude Oil Graph that will help you convey the message impactfully. It can be accessed with Google Slides and is available in both standard screen and widescreen aspect ratios. Apart from this, you can download this well structured PowerPoint template design in different formats like PDF, JPG, and PNG. So, click the download button now to gain full access to this PPT design. Our Crude Oil Graph In Powerpoint And Google Slides Cpb are topically designed to provide an attractive backdrop to any subject. Use them to look like a presentation pro.
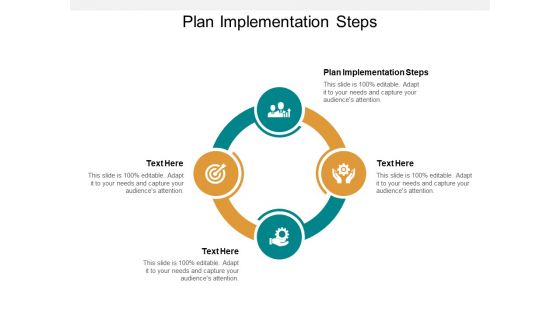
Plan Implementation Steps Ppt PowerPoint Presentation Diagram Graph Charts Cpb
Presenting this set of slides with name plan implementation steps ppt powerpoint presentation diagram graph charts cpb. This is an editable Powerpoint four stages graphic that deals with topics like plan implementation steps to help convey your message better graphically. This product is a premium product available for immediate download and is 100 percent editable in Powerpoint. Download this now and use it in your presentations to impress your audience.
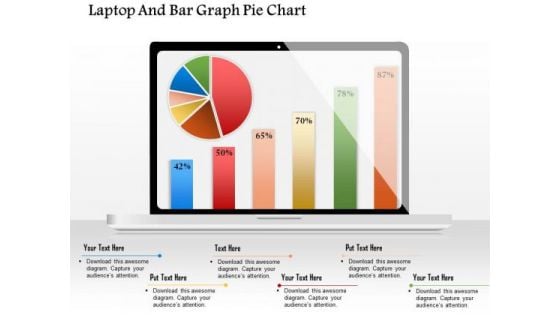
Business Diagram Laptop And Bar Graph Pie Chart Presentation Template
This Power Point template has been designed with graphic of target dart. This PPT diagram contains the concept of information communication. Use this PPT in your business communication related presentations.
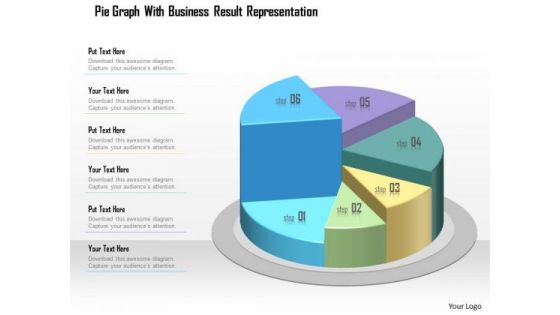
Business Diagram Pie Graph With Business Result Representation Presentation Template
This business diagram displays graphic of pie chart. This business slide contains the concept of business data representation. Use this diagram to build professional presentation for your viewers.
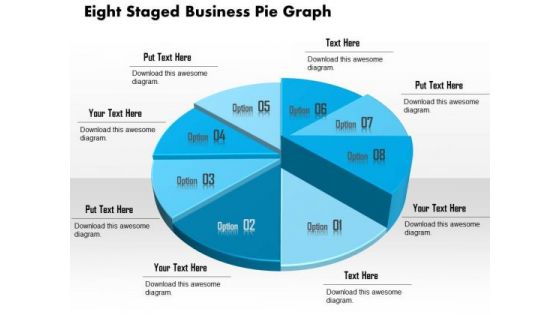
Business Diagram Eight Staged Business Pie Graph Presentation Template
This business slide displays eight staged pie chart. This diagram is a data visualization tool that gives you a simple way to present statistical information. This slide helps your audience examine and interpret the data you present.
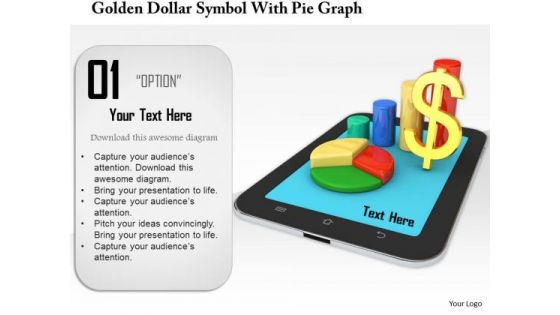
Stock Photo Golden Dollar Symbol With Pie Graph PowerPoint Slide
This Power Point template has been crafted with graphic of golden dollar symbol and pie chart on a tablet. Display the concept of financial data analysis with this image. Use this image to present financial reports in business presentations.
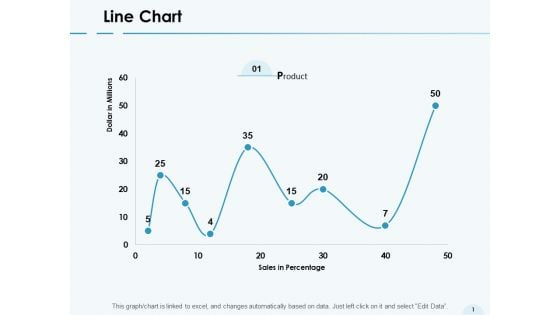
Line Chart Graph Ppt PowerPoint Presentation Gallery Structure
Presenting this set of slides with name line chart graph ppt powerpoint presentation gallery structure. The topics discussed in these slides are marketing, business, management, planning, strategy. This is a completely editable PowerPoint presentation and is available for immediate download. Download now and impress your audience.
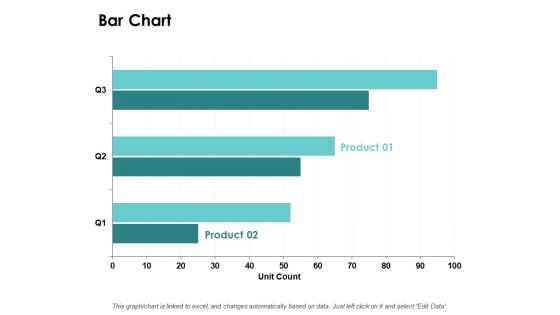
Bar Chart Graph Ppt PowerPoint Presentation Outline Structure
Presenting this set of slides with name bar chart graph ppt powerpoint presentation outline structure. The topics discussed in these slides are marketing, business, management, planning, strategy. This is a completely editable PowerPoint presentation and is available for immediate download. Download now and impress your audience.
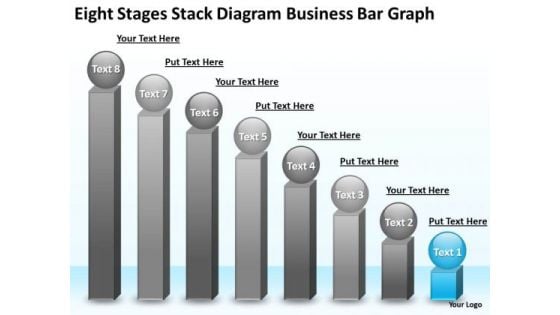
PowerPoint Templates Free Download Bar Graph Business Plan Structure
We present our powerpoint templates free download bar graph business plan structure.Download our Finance PowerPoint Templates because our PowerPoint Templates and Slides will give your ideas the shape. Download and present our Leadership PowerPoint Templates because Our PowerPoint Templates and Slides will weave a web of your great ideas. They are gauranteed to attract even the most critical of your colleagues. Download and present our Business PowerPoint Templates because Our PowerPoint Templates and Slides will provide you the cutting edge. Slice through the doubts in the minds of your listeners. Use our Success PowerPoint Templates because Our PowerPoint Templates and Slides are the chords of your song. String them along and provide the lilt to your views. Use our Spheres PowerPoint Templates because our PowerPoint Templates and Slides will give your ideas the shape.Use these PowerPoint slides for presentations relating to Concepts, Leadership, Success, Human, Achievement, Wink, Business, Ball, Three-Dimensional, Sign, Template, Diagram, Change, Character, Graphic, Stock, Development, Shape, Graph, Finances, Steps, Chart, Sphere, Examining, Up, Nice, Planning, Face, Growth, Person, Progress, Increases, Improvement, Image, Mimicry, Financial, Staircase. The prominent colors used in the PowerPoint template are Blue, Gray, Black. Attack doubts with our PowerPoint Templates Free Download Bar Graph Business Plan Structure. You will come out on top.
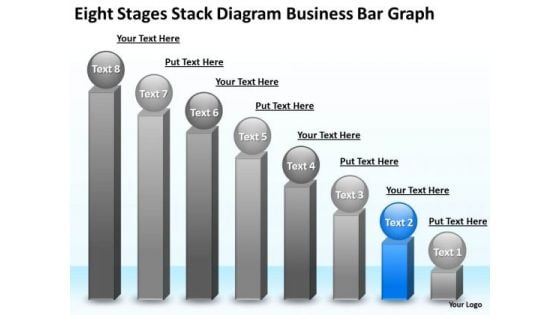
Business PowerPoint Presentation Bar Graph Strategic Planning Slides
We present our business powerpoint presentation bar graph strategic planning Slides.Download and present our Business PowerPoint Templates because Our PowerPoint Templates and Slides will let Your superior ideas hit the target always and everytime. Use our Spheres PowerPoint Templates because They will Put the wind in your sails. Skim smoothly over the choppy waters of the market. Present our Competition PowerPoint Templates because Our PowerPoint Templates and Slides will Embellish your thoughts. They will help you illustrate the brilliance of your ideas. Download and present our Shapes PowerPoint Templates because Our PowerPoint Templates and Slides will give you great value for your money. Be assured of finding the best projection to highlight your words. Download our Success PowerPoint Templates because Our PowerPoint Templates and Slides will effectively help you save your valuable time. They are readymade to fit into any presentation structure. Use these PowerPoint slides for presentations relating to bar, graph, statistics, economy, render, success, representation, diagram, graphic, achievment, obstruction, chevron, accounting, finances, energy eco, steps, figure, tall, barrier, strategy, ladder, up, planning, high, climb, stripes, growth, maintenance, profit, successful, repair, return, gradient, sustainability, financial, construction, upwards, increasing. The prominent colors used in the PowerPoint template are Blue, Gray, White. Meet your audience on equal terms. Level the field with our Business PowerPoint Presentation Bar Graph Strategic Planning Slides.

Adjacency Matrix Directed Graph In Powerpoint And Google Slides Cpb
Presenting our innovatively-designed set of slides titled Adjacency Matrix Directed Graph In Powerpoint And Google Slides Cpb. This completely editable PowerPoint graphic exhibits Adjacency Matrix Directed Graph that will help you convey the message impactfully. It can be accessed with Google Slides and is available in both standard screen and widescreen aspect ratios. Apart from this, you can download this well-structured PowerPoint template design in different formats like PDF, JPG, and PNG. So, click the download button now to gain full access to this PPT design. Introducing our dynamic PowerPoint PPT presentation on Current and Future Plans, meticulously crafted to guide businesses towards success. Unveil the latest trends and future finance strategies shaping industries, with a special focus on manufacturing and automotive sectors. Navigate through a comprehensive roadmap designed specifically for small businesses, offering strategic insights to ensure growth and resilience. Dive into the world of key performance indicators KPIs tailored for the evolving landscape of the e-commerce industry. Equip yourself with the knowledge needed to stay ahead, as this presentation seamlessly blends current insights with forward-thinking strategies, providing a holistic view for businesses striving to thrive in an ever-changing market. Elevate your business acumen with this indispensable tool for strategic planning.
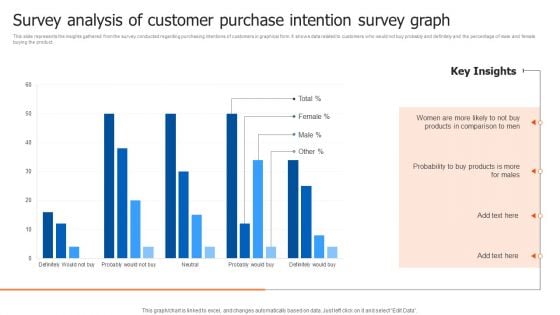
Survey Analysis Of Customer Purchase Intention Survey Graph Structure PDF
This slide represents the insights gathered from the survey conducted regarding purchasing intentions of customers in graphical form. It shows data related to customers who would not buy probably and definitely and the percentage of male and female buying the product. Pitch your topic with ease and precision using this Survey Analysis Of Customer Purchase Intention Survey Graph Structure PDF. This layout presents information on Probability, Products, Key Insights. It is also available for immediate download and adjustment. So, changes can be made in the color, design, graphics or any other component to create a unique layout.
Growth Graph Business Success PowerPoint Templates And PowerPoint Themes 1112
We present our Growth Graph Business Success PowerPoint Templates And PowerPoint Themes 1112.Use our Marketing PowerPoint Templates because, It is in your DNA to analyse possible causes to the minutest detail. Use our Money PowerPoint Templates because,Saves your time a prized possession, an ideal aid to give an ideal presentation. Use our Business PowerPoint Templates because, Amplify on your views and plans for getting ahead and then the manner in which you intend staying ahead. Use our Success PowerPoint Templates because, Illustrate your plans on using the many social media modes available to inform soceity at large of the benefits of your product. Use our Finance PowerPoint Templates because, Business ethics is an essential element in your growth.Use these PowerPoint slides for presentations relating to Business growth , success, marketing, money, business, finance. The prominent colors used in the PowerPoint template are Gray, White, Black Open up the windows of your mind. Unlatch them with our Growth Graph Business Success PowerPoint Templates And PowerPoint Themes 1112.
Pie Graph Made With Puzzles And Business Icons PowerPoint Template
Create dynamic presentations with our professional template containing graphics of pie graph. Use this diagram to exhibit marketing strategy. Download this template to leave permanent impression on your audience.
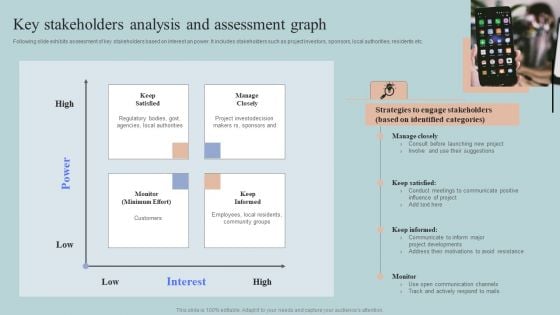
Key Stakeholders Analysis And Assessment Graph Structure PDF
Following slide exhibits assessment of key stakeholders based on interest an power. It includes stakeholders such as project investors, sponsors, local authorities, residents etc. Coming up with a presentation necessitates that the majority of the effort goes into the content and the message you intend to convey. The visuals of a PowerPoint presentation can only be effective if it supplements and supports the story that is being told. Keeping this in mind our experts created Key Stakeholders Analysis And Assessment Graph Structure PDF to reduce the time that goes into designing the presentation. This way, you can concentrate on the message while our designers take care of providing you with the right template for the situation.

Business Diagram Business Bar Graph For Data Analysis Presentation Template
This business slide displays pie charts with percentage ratios. This diagram is a data visualization tool that gives you a simple way to present statistical information. This slide helps your audience examines and interprets the data you present.


 Continue with Email

 Home
Home


