Circle Infographic
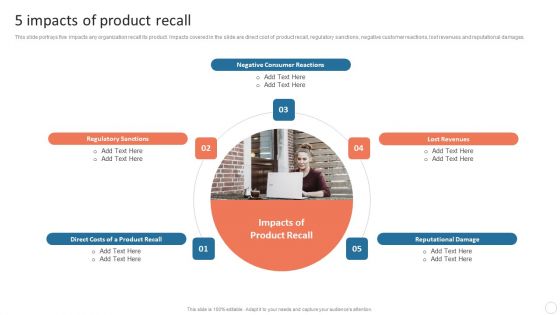
Quality Control Plan 5 Impacts Of Product Recall Infographics PDF
This slide portrays five impacts any organization recall its product. Impacts covered in the slide are direct cost of product recall, regulatory sanctions, negative customer reactions, lost revenues and reputational damages. Find a pre-designed and impeccable Quality Control Plan 5 Impacts Of Product Recall Infographics PDF. The templates can ace your presentation without additional effort. You can download these easy-to-edit presentation templates to make your presentation stand out from others. So, what are you waiting for Download the template from Slidegeeks today and give a unique touch to your presentation.
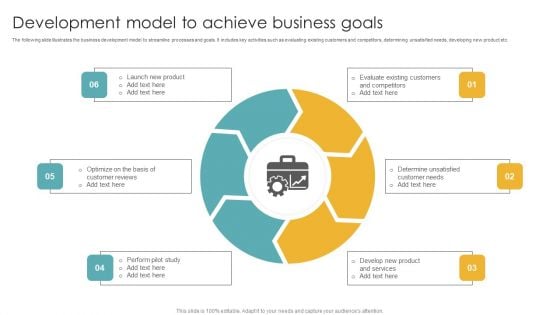
Development Model To Achieve Business Goals Infographics PDF
The following slide illustrates the business development model to streamline processes and goals. It includes key activities such as evaluating existing customers and competitors, determining unsatisfied needs, developing new product etc. Persuade your audience using this Development Model To Achieve Business Goals Infographics PDF. This PPT design covers six stages, thus making it a great tool to use. It also caters to a variety of topics including Evaluate Existing Customers, Determine Unsatisfied, Develop New Product. Download this PPT design now to present a convincing pitch that not only emphasizes the topic but also showcases your presentation skills.
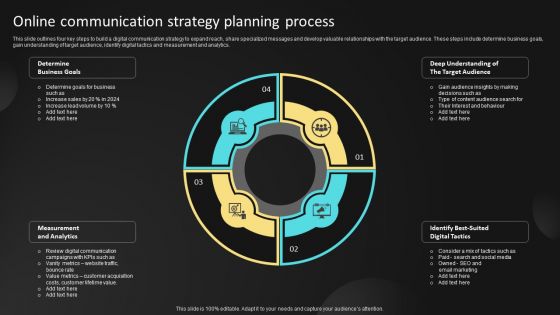
Online Communication Strategy Planning Process Ppt Styles Infographics PDF
This slide outlines four key steps to build a digital communication strategy to expand reach, share specialized messages and develop valuable relationships with the target audience. These steps include determine business goals, gain understanding of target audience, identify digital tactics and measurement and analytics. Presenting Online Communication Strategy Planning Process Ppt Styles Infographics PDF to dispense important information. This template comprises four stages. It also presents valuable insights into the topics including Determine Business Goals, Identify Best Suited, Digital Tactics, Measurement And Analytics, Deep Understanding, The Target Audience. This is a completely customizable PowerPoint theme that can be put to use immediately. So, download it and address the topic impactfully.
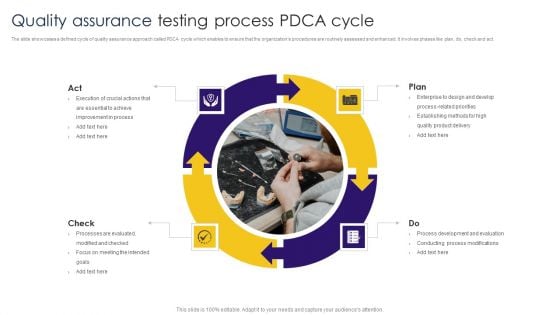
Quality Assurance Testing Process Pdca Cycle Ppt Infographics Images PDF
The slide showcases a defined cycle of quality assurance approach called pdca cycle which enables to ensure that the organizations procedures are routinely assessed and enhanced. it involves phases like plan, do, check and act. presenting Quality Assurance Testing Process Pdca Cycle Ppt Infographics Images PDF to dispense important information. this template comprises four stages. it also presents valuable insights into the topics including Act, Plan, Check, Do, Process Development. this is a completely customizable powerpoint theme that can be put to use immediately. so, download it and address the topic impactfully.
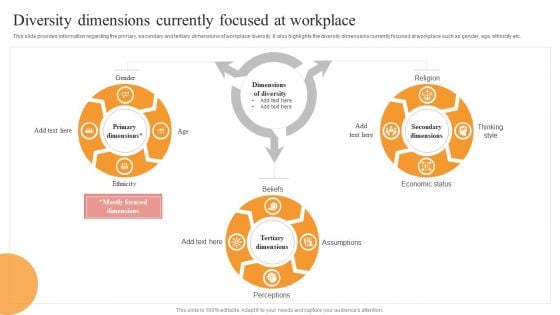
Diversity Dimensions Currently Focused At Workplace Infographics PDF
This slide provides information regarding the primary, secondary and tertiary dimensions of workplace diversity. It also highlights the diversity dimensions currently focused at workplace such as gender, age, ethnicity etc. Slidegeeks is one of the best resources for PowerPoint templates. You can download easily and regulate Diversity Dimensions Currently Focused At Workplace Infographics PDF for your personal presentations from our wonderful collection. A few clicks is all it takes to discover and get the most relevant and appropriate templates. Use our Templates to add a unique zing and appeal to your presentation and meetings. All the slides are easy to edit and you can use them even for advertisement purposes.
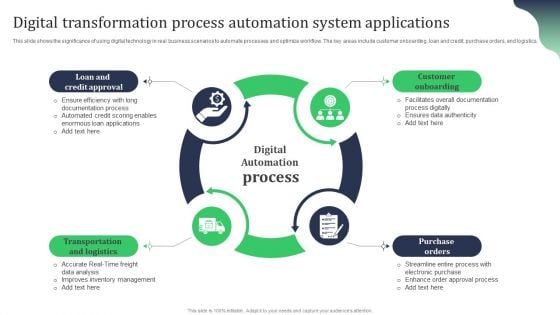
Digital Transformation Process Automation System Applications Infographics PDF
This slide shows the significance of using digital technology in real business scenarios to automate processes and optimize workflow. The key areas include customer onboarding, loan and credit, purchase orders, and logistics. Presenting Digital Transformation Process Automation System Applications Infographics PDF to dispense important information. This template comprises four stages. It also presents valuable insights into the topics including Loan And Credit Approval, Transportation And Logistics, Customer Onboarding, Purchase Orders. This is a completely customizable PowerPoint theme that can be put to use immediately. So, download it and address the topic impactfully.
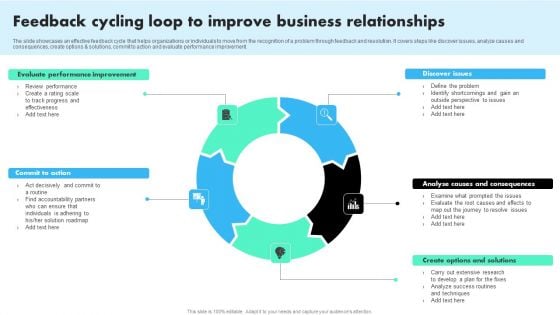
Feedback Cycling Loop To Improve Business Relationships Infographics PDF
The slide showcases an effective feedback cycle that helps organizations or individuals to move from the recognition of a problem through feedback and resolution. It covers steps like discover issues, analyze causes and consequences, create options and solutions, commit to action and evaluate performance improvement. Persuade your audience using this Feedback Cycling Loop To Improve Business Relationships Infographics PDF. This PPT design covers five stages, thus making it a great tool to use. It also caters to a variety of topics including Evaluate Performance Improvement, Commit Action, Discover Issues. Download this PPT design now to present a convincing pitch that not only emphasizes the topic but also showcases your presentation skills.
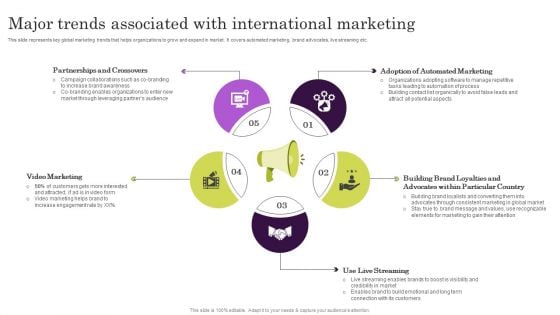
Major Trends Associated With International Marketing Ppt Infographics Guidelines PDF
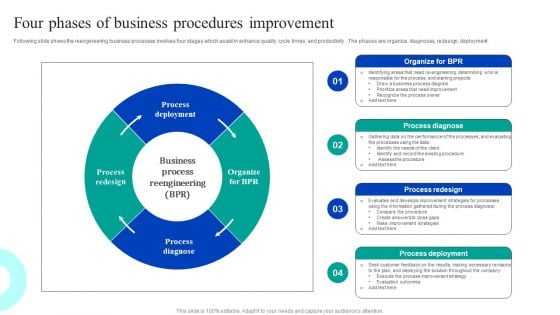
Four Phases Of Business Procedures Improvement Infographics PDF
Following slide shows the reengineering business processes involves four stages which assist in enhance quality, cycle times, and productivity . The phases are organize, diagnoses, redesign, deployment. Persuade your audience using this Four Phases Of Business Procedures Improvement Infographics PDF. This PPT design covers four stages, thus making it a great tool to use. It also caters to a variety of topics including Process Diagnose, Process Redesign, Process Deployment. Download this PPT design now to present a convincing pitch that not only emphasizes the topic but also showcases your presentation skills.
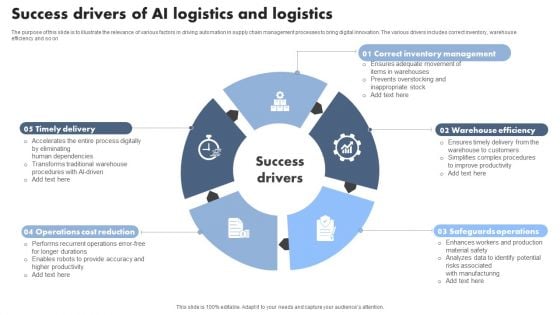
Success Drivers Of AI Logistics And Logistics Infographics PDF
The purpose of this slide is to illustrate the relevance of various factors in driving automation in supply chain management processes to bring digital innovation. The various drivers includes correct inventory, warehouse efficiency and so on. Presenting Success Drivers Of AI Logistics And Logistics Infographics PDF to dispense important information. This template comprises five stages. It also presents valuable insights into the topics including Correct Inventory Management, Warehouse Efficiency, Safeguards Operations. This is a completely customizable PowerPoint theme that can be put to use immediately. So, download it and address the topic impactfully.
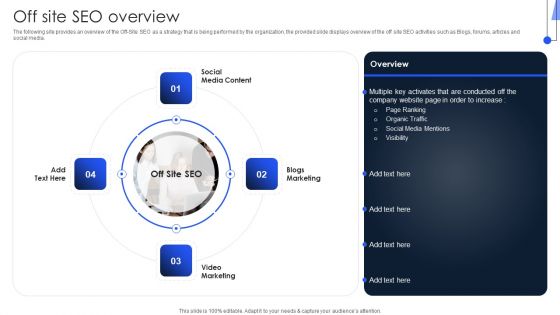
Implementing Marketing Strategies Off Site Seo Overview Infographics PDF
The following site provides an overview of the Off-Site SEO as a strategy that is being performed by the organization, the provided slide displays overview of the off site SEO activities such as Blogs, forums, articles and social media. Are you in need of a template that can accommodate all of your creative concepts This one is crafted professionally and can be altered to fit any style. Use it with Google Slides or PowerPoint. Include striking photographs, symbols, depictions, and other visuals. Fill, move around, or remove text boxes as desired. Test out color palettes and font mixtures. Edit and save your work, or work with colleagues. Download Implementing Marketing Strategies Off Site Seo Overview Infographics PDF and observe how to make your presentation outstanding. Give an impeccable presentation to your group and make your presentation unforgettable.
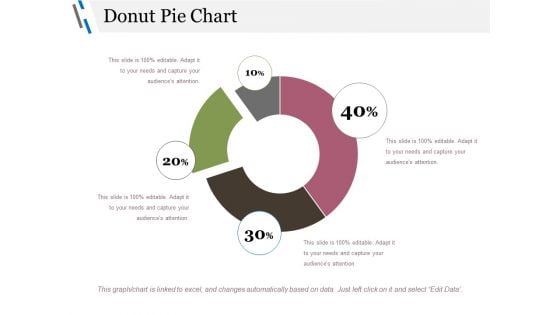
Donut Pie Chart Ppt PowerPoint Presentation Gallery Infographics
This is a donut pie chart ppt powerpoint presentation gallery infographics. This is a four stage process. The stages in this process are chart, business, management, percentage, process.
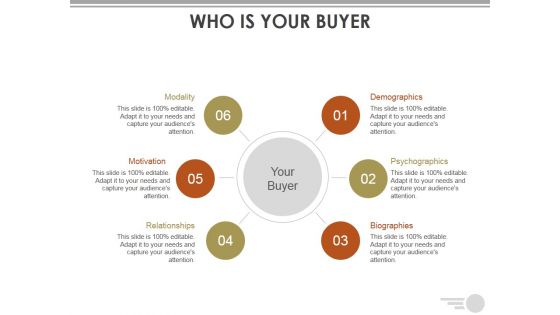
Who Is Your Buyer Ppt PowerPoint Presentation Visual Aids Infographics
This is a who is your buyer ppt powerpoint presentation visual aids infographics. This is a six stage process. The stages in this process are demographics, psychographics, biographies, relationships, motivation.
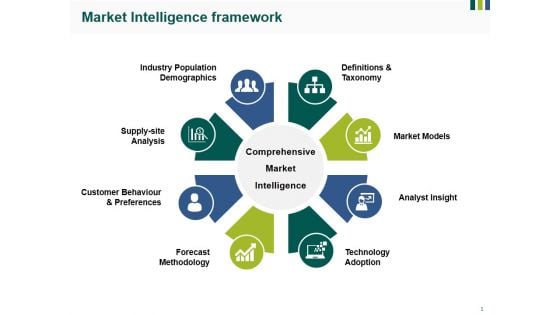
Market Intelligence Framework Ppt PowerPoint Presentation Outline Infographics
This is a market intelligence framework ppt powerpoint presentation outline infographics. This is a eight stage process. The stages in this process are definitions and taxonomy, market models, analyst insight, technology adoption, forecast methodology, supply site analysis.
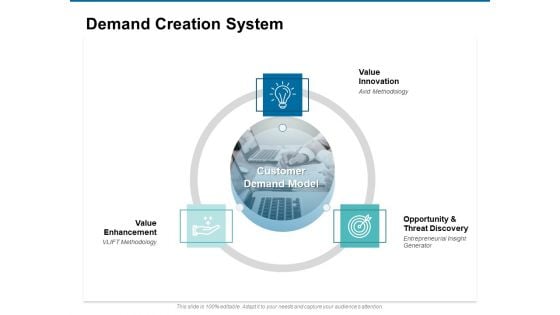
Demand Creation System Ppt PowerPoint Presentation Outline Infographics
Presenting this set of slides with name demand creation system ppt powerpoint presentation outline infographics. This is a three stage process. The stages in this process are value innovation, opportunity and threat discovery, value enhancement. This is a completely editable PowerPoint presentation and is available for immediate download. Download now and impress your audience.
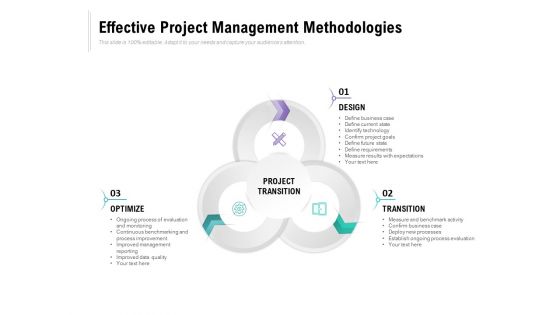
Effective Project Management Methodologies Ppt PowerPoint Presentation Ideas Infographics
Presenting this set of slides with name effective project management methodologies ppt powerpoint presentation ideas infographics. This is a three stage process. The stages in this process are project transition, optimize, transition, design. This is a completely editable PowerPoint presentation and is available for immediate download. Download now and impress your audience.
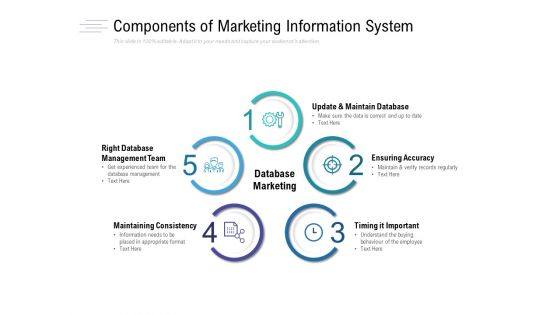
Components Of Marketing Information System Ppt PowerPoint Presentation Slides Infographics
Presenting this set of slides with name components of marketing information system ppt powerpoint presentation slides infographics. This is a five stage process. The stages in this process are maintaining consistency, timing it important, ensuring accuracy, update and maintain database, management team. This is a completely editable PowerPoint presentation and is available for immediate download. Download now and impress your audience.
Team Building Experiences Ppt PowerPoint Presentation File Infographics
Presenting this set of slides with name team building experiences ppt powerpoint presentation file infographics. This is an editable Powerpoint five stages graphic that deals with topics like team building experiences to help convey your message better graphically. This product is a premium product available for immediate download, and is 100 percent editable in Powerpoint. Download this now and use it in your presentations to impress your audience.
Interviewing Tips Managers Ppt PowerPoint Presentation Show Infographics Cpb
Presenting this set of slides with name interviewing tips managers ppt powerpoint presenta. This is an editable Powerpoint four stages graphic that deals with topics like interviewing tips managers to help convey your message better graphically. This product is a premium product available for immediate download and is 100 percent editable in Powerpoint. Download this now and use it in your presentations to impress your audience.
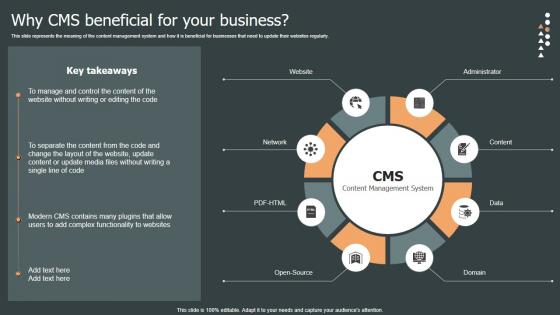
Why CMS Beneficial For Your Business Role Web Designing User Engagement Infographics PDF
From laying roadmaps to briefing everything in detail, our templates are perfect for you. You can set the stage with your presentation slides. All you have to do is download these easy-to-edit and customizable templates. Why CMS Beneficial For Your Business Role Web Designing User Engagement Infographics PDF will help you deliver an outstanding performance that everyone would remember and praise you for. Do download this presentation today. This slide represents the meaning of the content management system and how it is beneficial for businesses that need to update their websites regularly.

DNA Design Infographics For Research Powerpoint Slides
This business slide contains four DNA infographic structure. This diagram is suitable to present business research and analysis. Visual effect of this diagram helps in maintaining the flow of the discussion and provides more clarity to the subject.
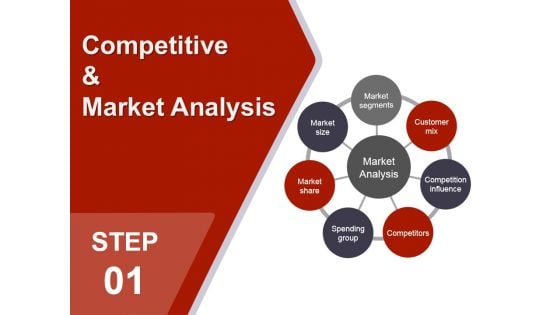
Competitive And Market Analysis Ppt PowerPoint Presentation Infographics Pictures
This is a competitive and market analysis ppt powerpoint presentation infographics pictures. This is a seven stage process. The stages in this process are market size, market segments, customer mix, competition influence, competitors, spending group, market analysis, market share.
Infographics Slide Of Business Agenda Powerpoint Slides
This PowerPoint template has been designed with infographic slide of business agenda. Download this PPT slide to depict important matters of business meeting. The structure of our template allows you to effectively highlight the key issues concerning to your agenda.
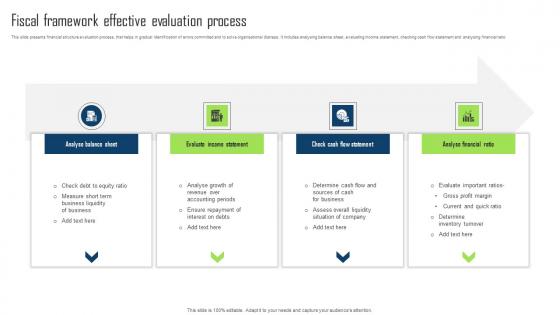
Fiscal Framework Effective Evaluation Process Infographics Pdf
This slide presents financial structure evaluation process, that helps in gradual identification of errors committed and to solve organisational distress. It includes analysing balance sheet, evaluating income statement, checking cash flow statement and analysing financial ratio. Pitch your topic with ease and precision using this Fiscal Framework Effective Evaluation Process Infographics Pdf. This layout presents information on Analyse Balance Sheet, Analyse Financial Ratio, Check Cash Flow Statement. It is also available for immediate download and adjustment. So, changes can be made in the color, design, graphics or any other component to create a unique layout. This slide presents financial structure evaluation process, that helps in gradual identification of errors committed and to solve organisational distress. It includes analysing balance sheet, evaluating income statement, checking cash flow statement and analysing financial ratio.

Thank You Ppt PowerPoint Presentation Infographics Structure
This is a thank you ppt powerpoint presentation infographics structure. This is a one stage process. The stages in this process are thank you, word, greetings.
Organization Structure Ppt Powerpoint Presentation Infographics Icon
This is a organization structure ppt powerpoint presentation infographics icon. This is a three stage process. The stages in this process are management, business, marketing, hierarchy.
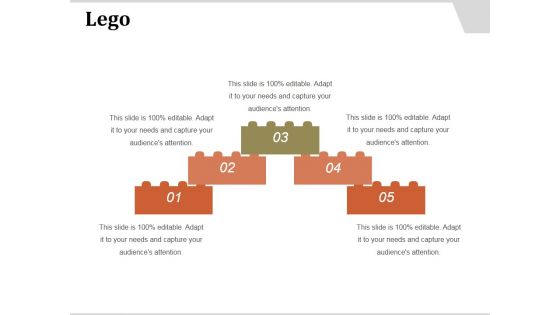
Lego Ppt PowerPoint Presentation Infographics Structure
This is a lego ppt powerpoint presentation infographics structure. This is a five stage process. The stages in this process are lego, planning, business, management, strategy.

Quotes Ppt PowerPoint Presentation Infographics Structure
This is a quotes ppt powerpoint presentation infographics structure. This is a one stage process. The stages in this process are communication, management, quotes, business, management.
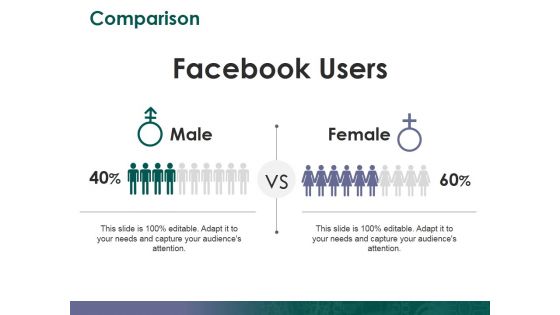
Comparison Ppt PowerPoint Presentation Infographics Structure
This is a comparison ppt powerpoint presentation infographics structure. This is a two stage process. The stages in this process are male, female, comparison.
Our Target Ppt PowerPoint Presentation Infographics Structure
This is a our target ppt powerpoint presentation infographics structure. This is a two stage process. The stages in this process are our goal, marketing, strategy, target, planning.
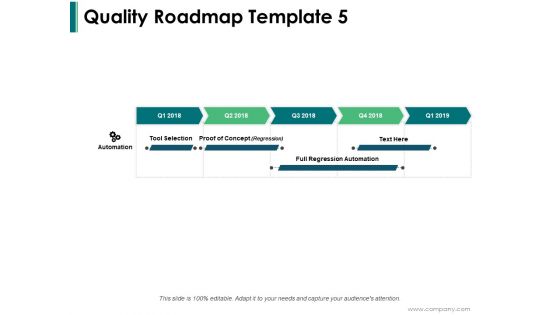
Roadmap Ppt PowerPoint Presentation Infographics Structure
This is a roadmap ppt powerpoint presentation infographics structure. This is a five stage process. The stages in this process are roadmap, timeline, process, management, planning.
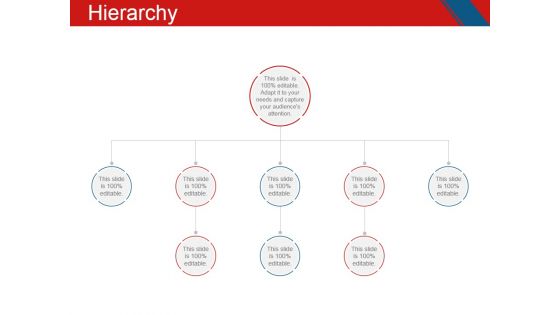
Hierarchy Ppt PowerPoint Presentation Infographics Graphic Images
This is a hierarchy ppt powerpoint presentation infographics graphic images. This is a eight stage process. The stages in this process are business, chart, organization, process, structure.
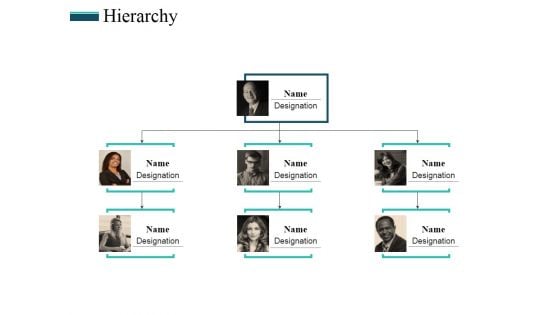
Hierarchy Ppt PowerPoint Presentation Infographics Demonstration
This is a hierarchy ppt powerpoint presentation infographics demonstration. This is a three stage process. The stages in this process are structure, people, communication, management, teamwork.
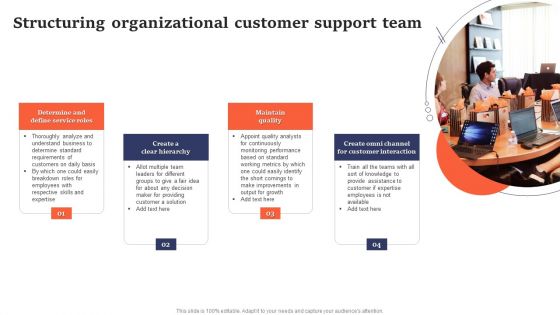
Structuring Organizational Customer Support Team Infographics PDF
Pitch your topic with ease and precision using this Structuring Organizational Customer Support Team Infographics PDF. This layout presents information on Create Clear Hierarchy, Maintain Quality. It is also available for immediate download and adjustment. So, changes can be made in the color, design, graphics or any other component to create a unique layout.
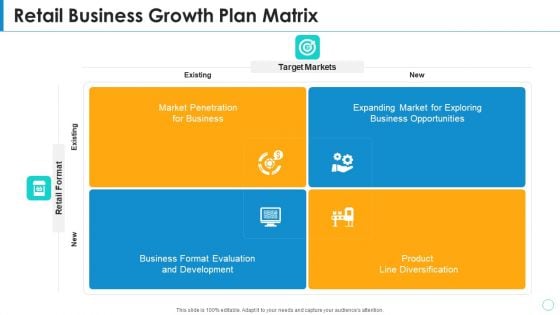
Retail Business Growth Plan Matrix Infographics PDF
Persuade your audience using this retail business growth plan matrix infographics pdf. This PPT design covers four stages, thus making it a great tool to use. It also caters to a variety of topics including market penetration for business, expanding market for exploring business opportunities, business format evaluation and development, product line diversification . Download this PPT design now to present a convincing pitch that not only emphasizes the topic but also showcases your presentation skills.
Retail Industry Outlook Icons Slide Infographics PDF
Presenting our innovatively structured retail industry outlook icons slide infographics pdf. set of slides. The slides contain a hundred percent editable icons. You can replace these icons without any inconvenience. Therefore, pick this set of slides and create a striking presentation.
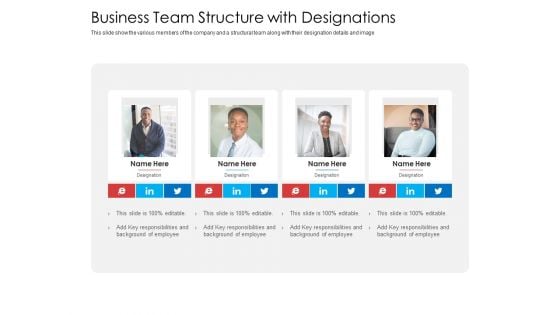
Business Team Structure With Designations Infographics PDF
This slide show the various members of the company and a structural team along with their designation details and image. This is a business team structure with designations infographics pdf template with various stages. Focus and dispense information on four stages using this creative set, that comes with editable features. It contains large content boxes to add your information on topics like business team structure with designations. You can also showcase facts, figures, and other relevant content using this PPT layout. Grab it now.
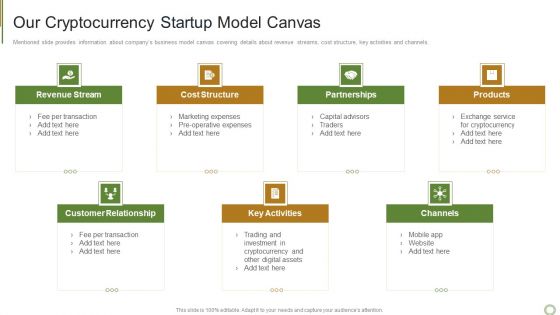
Our Cryptocurrency Startup Model Canvas Infographics PDF
Mentioned slide provides information about companys business model canvas covering details about revenue streams, cost structure, key activities and channels.This is a Our Cryptocurrency Startup Model Canvas Infographics PDF template with various stages. Focus and dispense information on seven stages using this creative set, that comes with editable features. It contains large content boxes to add your information on topics like Revenue Stream, Cost Structure, Partnerships You can also showcase facts, figures, and other relevant content using this PPT layout. Grab it now.
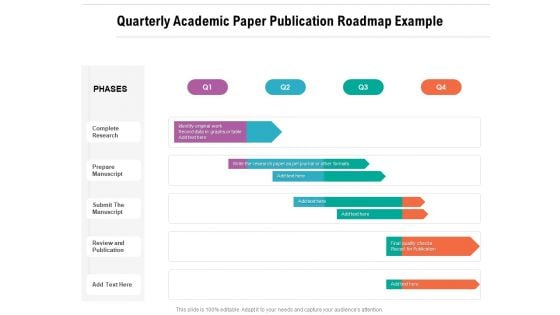
Quarterly Academic Paper Publication Roadmap Example Infographics
Presenting our innovatively-structured quarterly academic paper publication roadmap example infographics Template. Showcase your roadmap process in different formats like PDF, PNG, and JPG by clicking the download button below. This PPT design is available in both Standard Screen and Widescreen aspect ratios. It can also be easily personalized and presented with modified font size, font type, color, and shapes to measure your progress in a clear way.
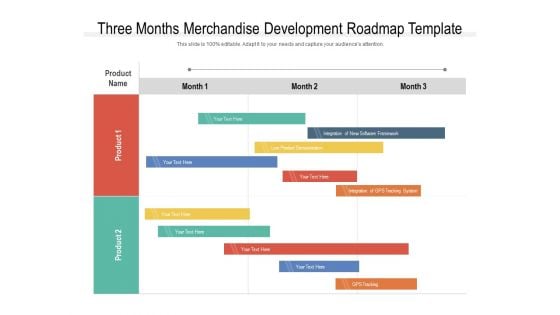
Three Months Merchandise Development Roadmap Template Infographics
Presenting our innovatively-structured three months merchandise development roadmap template infographics Template. Showcase your roadmap process in different formats like PDF, PNG, and JPG by clicking the download button below. This PPT design is available in both Standard Screen and Widescreen aspect ratios. It can also be easily personalized and presented with modified font size, font type, color, and shapes to measure your progress in a clear way.
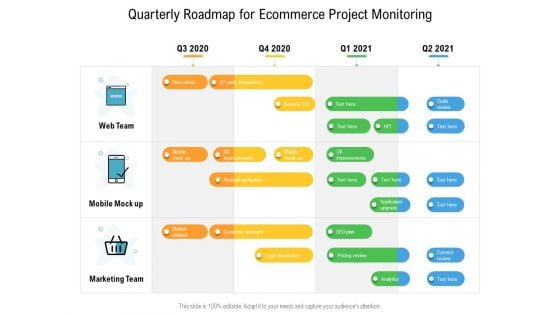
Quarterly Roadmap For Ecommerce Project Monitoring Infographics
Presenting our innovatively-structured quarterly roadmap for ecommerce project monitoring infographics Template. Showcase your roadmap process in different formats like PDF, PNG, and JPG by clicking the download button below. This PPT design is available in both Standard Screen and Widescreen aspect ratios. It can also be easily personalized and presented with modified font size, font type, color, and shapes to measure your progress in a clear way.
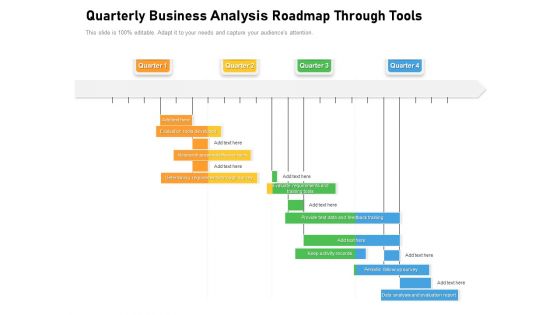
Quarterly Business Analysis Roadmap Through Tools Infographics
Presenting our innovatively-structured quarterly business analysis roadmap through tools infographics Template. Showcase your roadmap process in different formats like PDF, PNG, and JPG by clicking the download button below. This PPT design is available in both Standard Screen and Widescreen aspect ratios. It can also be easily personalized and presented with modified font size, font type, color, and shapes to measure your progress in a clear way.
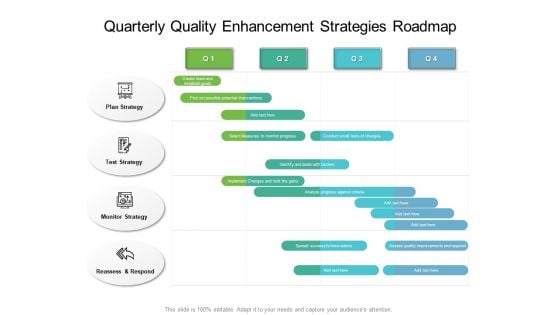
Quarterly Quality Enhancement Strategies Roadmap Infographics
Presenting our innovatively-structured quarterly quality enhancement strategies roadmap infographics Template. Showcase your roadmap process in different formats like PDF, PNG, and JPG by clicking the download button below. This PPT design is available in both Standard Screen and Widescreen aspect ratios. It can also be easily personalized and presented with modified font size, font type, color, and shapes to measure your progress in a clear way.
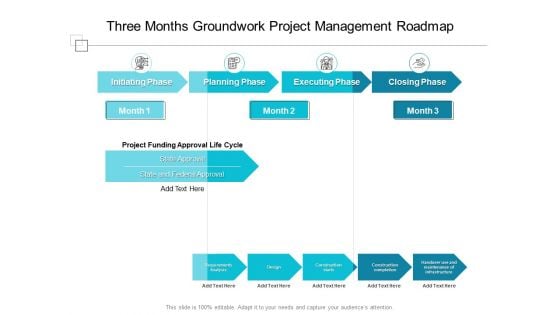
Three Months Groundwork Project Management Roadmap Infographics
Presenting our innovatively structured three months groundwork project management roadmap infographics Template. Showcase your roadmap process in different formats like PDF, PNG, and JPG by clicking the download button below. This PPT design is available in both Standard Screen and Widescreen aspect ratios. It can also be easily personalized and presented with modified font size, font type, color, and shapes to measure your progress in a clear way.
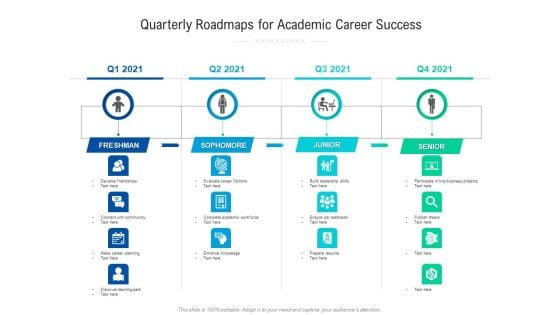
Quarterly Roadmaps For Academic Career Success Infographics
Presenting our innovatively structured quarterly roadmaps for academic career success infographics Template. Showcase your roadmap process in different formats like PDF, PNG, and JPG by clicking the download button below. This PPT design is available in both Standard Screen and Widescreen aspect ratios. It can also be easily personalized and presented with modified font size, font type, color, and shapes to measure your progress in a clear way.
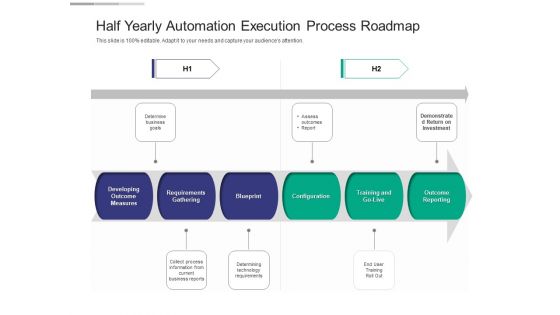
Half Yearly Automation Execution Process Roadmap Infographics
Presenting our innovatively structured half yearly automation execution process roadmap infographics Template. Showcase your roadmap process in different formats like PDF, PNG, and JPG by clicking the download button below. This PPT design is available in both Standard Screen and Widescreen aspect ratios. It can also be easily personalized and presented with modified font size, font type, color, and shapes to measure your progress in a clear way.
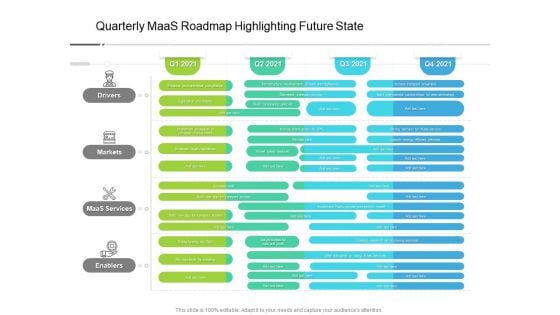
Quarterly Maas Roadmap Highlighting Future State Infographics
Presenting our innovatively-structured quarterly maas roadmap highlighting future state infographics Template. Showcase your roadmap process in different formats like PDF, PNG, and JPG by clicking the download button below. This PPT design is available in both Standard Screen and Widescreen aspect ratios. It can also be easily personalized and presented with modified font size, font type, color, and shapes to measure your progress in a clear way.
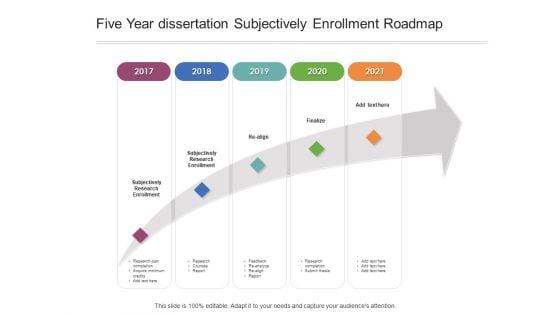
Five Year Dissertation Subjectively Enrollment Roadmap Infographics
Presenting our innovatively-structured five year dissertation subjectively enrollment roadmap infographics Template. Showcase your roadmap process in different formats like PDF, PNG, and JPG by clicking the download button below. This PPT design is available in both Standard Screen and Widescreen aspect ratios. It can also be easily personalized and presented with modified font size, font type, color, and shapes to measure your progress in a clear way.
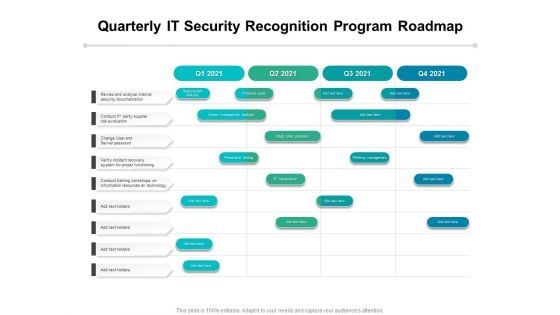
Quarterly IT Security Recognition Program Roadmap Infographics
Presenting our innovatively-structured quarterly it security recognition program roadmap infographics Template. Showcase your roadmap process in different formats like PDF, PNG, and JPG by clicking the download button below. This PPT design is available in both Standard Screen and Widescreen aspect ratios. It can also be easily personalized and presented with modified font size, font type, color, and shapes to measure your progress in a clear way.
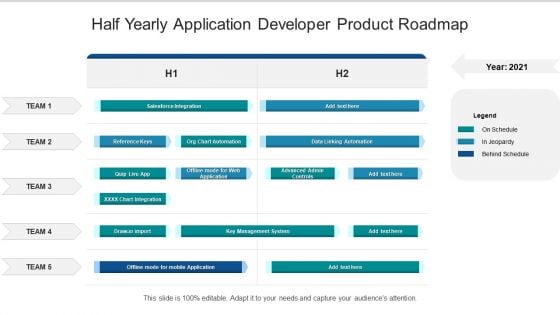
Half Yearly Application Developer Product Roadmap Infographics
Presenting our innovatively structured half yearly application developer product roadmap infographics Template. Showcase your roadmap process in different formats like PDF, PNG, and JPG by clicking the download button below. This PPT design is available in both Standard Screen and Widescreen aspect ratios. It can also be easily personalized and presented with modified font size, font type, color, and shapes to measure your progress in a clear way.
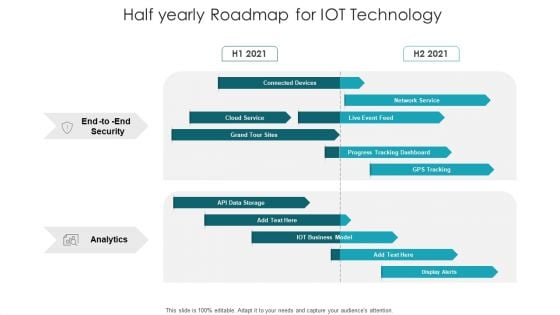
Half Yearly Roadmap For IOT Technology Infographics
Presenting our innovatively structured half yearly roadmap for iot technology infographics Template. Showcase your roadmap process in different formats like PDF, PNG, and JPG by clicking the download button below. This PPT design is available in both Standard Screen and Widescreen aspect ratios. It can also be easily personalized and presented with modified font size, font type, color, and shapes to measure your progress in a clear way.
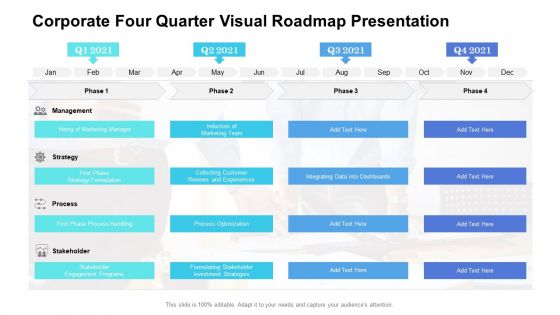
Corporate Four Quarter Visual Roadmap Presentation Infographics
Presenting our innovatively structured corporate four quarter visual roadmap presentation infographics Template. Showcase your roadmap process in different formats like PDF, PNG, and JPG by clicking the download button below. This PPT design is available in both Standard Screen and Widescreen aspect ratios. It can also be easily personalized and presented with modified font size, font type, color, and shapes to measure your progress in a clear way.
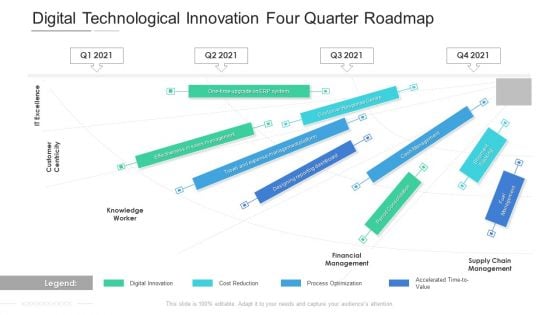
Digital Technological Innovation Four Quarter Roadmap Infographics
Presenting our innovatively structured digital technological innovation four quarter roadmap infographics Template. Showcase your roadmap process in different formats like PDF, PNG, and JPG by clicking the download button below. This PPT design is available in both Standard Screen and Widescreen aspect ratios. It can also be easily personalized and presented with modified font size, font type, color, and shapes to measure your progress in a clear way.
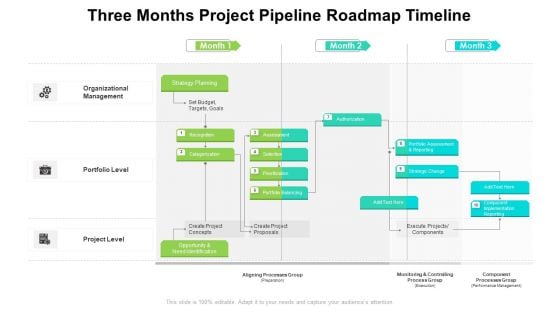
Three Months Project Pipeline Roadmap Timeline Infographics
Presenting our innovatively structured three months project pipeline roadmap timeline infographics Template. Showcase your roadmap process in different formats like PDF, PNG, and JPG by clicking the download button below. This PPT design is available in both Standard Screen and Widescreen aspect ratios. It can also be easily personalized and presented with modified font size, font type, color, and shapes to measure your progress in a clear way.
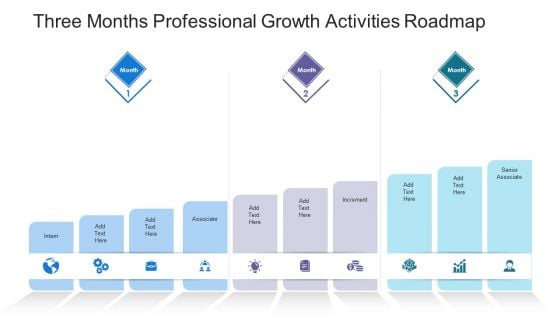
Three Months Professional Growth Activities Roadmap Infographics
Presenting our innovatively structured three months professional growth activities roadmap infographics Template. Showcase your roadmap process in different formats like PDF, PNG, and JPG by clicking the download button below. This PPT design is available in both Standard Screen and Widescreen aspect ratios. It can also be easily personalized and presented with modified font size, font type, color, and shapes to measure your progress in a clear way.

Datafy Framework Of Datafication Technology Infographics PDF
This slide represents the framework of datafication technology, and it includes two cycles such as design data and data use. The design data further contains four elements, including domain, domain model, implementation and appropriation, and design. Whether you have daily or monthly meetings, a brilliant presentation is necessary. Datafy Framework Of Datafication Technology Infographics PDF can be your best option for delivering a presentation. Represent everything in detail using Datafy Framework Of Datafication Technology Infographics PDF and make yourself stand out in meetings. The template is versatile and follows a structure that will cater to your requirements. All the templates prepared by Slidegeeks are easy to download and edit. Our research experts have taken care of the corporate themes as well. So, give it a try and see the results.
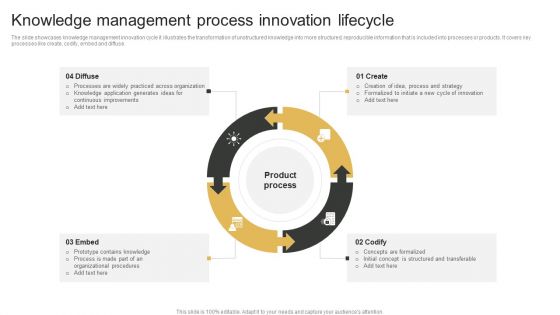
Knowledge Management Process Innovation Lifecycle Infographics PDF
The slide showcases knowledge management innovation cycle it illustrates the transformation of unstructured knowledge into more structured, reproducible information that is included into processes or products. It covers key processes like create, codify, embed and diffuse. Persuade your audience using this Knowledge Management Process Innovation Lifecycle Infographics PDF. This PPT design covers four stages, thus making it a great tool to use. It also caters to a variety of topics including Create, Codify, Embed. Download this PPT design now to present a convincing pitch that not only emphasizes the topic but also showcases your presentation skills.
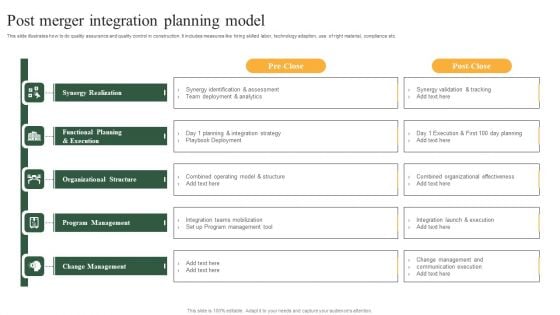
Post Merger Integration Planning Model Infographics PDF
This slide illustrates how to do quality assurance and quality control in construction. It includes measures like hiring skilled labor, technology adaption, use of right material, compliance etc. Presenting Post Merger Integration Planning Model Infographics PDF to dispense important information. This template comprises five stages. It also presents valuable insights into the topics including Synergy Realization, Functional Planning And Execution, Organizational Structure, Program Management, Change Management. This is a completely customizable PowerPoint theme that can be put to use immediately. So, download it and address the topic impactfully.
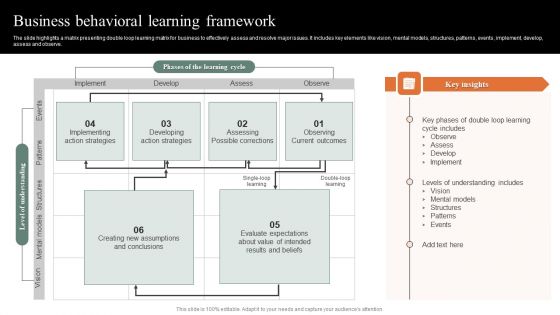
Business Behavioral Learning Framework Infographics PDF
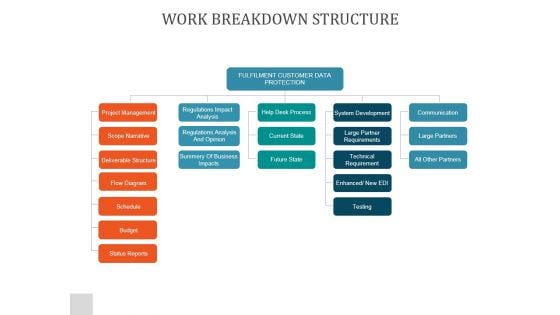
Work Breakdown Structure Ppt PowerPoint Presentation Infographics
This is a work breakdown structure ppt powerpoint presentation infographics. This is a five stage process. The stages in this process are fulfilment customer data protection, project management, regulations impact analysis, help desk process, system development, communication, scope narrative.


 Continue with Email

 Home
Home


