Circle Infographic
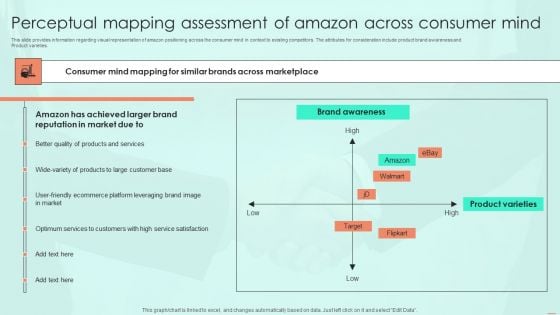
Perceptual Mapping Assessment Of Amazon Across Consumer Mind Infographics PDF
This slide provides information regarding visual representation of amazon positioning across the consumer mind in context to existing competitors. The attributes for consideration include product brand awareness and Product varieties. Slidegeeks is here to make your presentations a breeze with Perceptual Mapping Assessment Of Amazon Across Consumer Mind Infographics PDF With our easy to use and customizable templates, you can focus on delivering your ideas rather than worrying about formatting. With a variety of designs to choose from, you are sure to find one that suits your needs. And with animations and unique photos, illustrations, and fonts, you can make your presentation pop. So whether you are giving a sales pitch or presenting to the board, make sure to check out Slidegeeks first
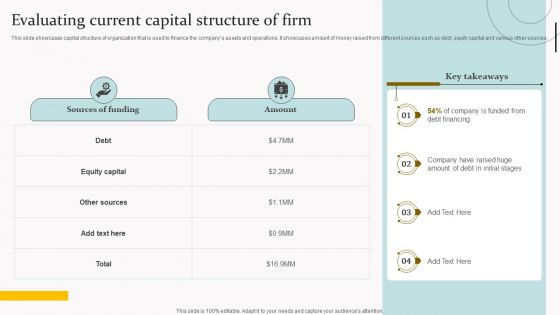
Evaluating Current Capital Structure Of Firm Infographics PDF
This slide showcases capital structure of organization that is used to finance the companys assets and operations. It showcases amount of money raised from different sources such as debt, equity capital and various other sources. Retrieve professionally designed Evaluating Current Capital Structure Of Firm Infographics PDF to effectively convey your message and captivate your listeners. Save time by selecting pre made slideshows that are appropriate for various topics, from business to educational purposes. These themes come in many different styles, from creative to corporate, and all of them are easily adjustable and can be edited quickly. Access them as PowerPoint templates or as Google Slides themes. You do not have to go on a hunt for the perfect presentation because Slidegeeks got you covered from everywhere.
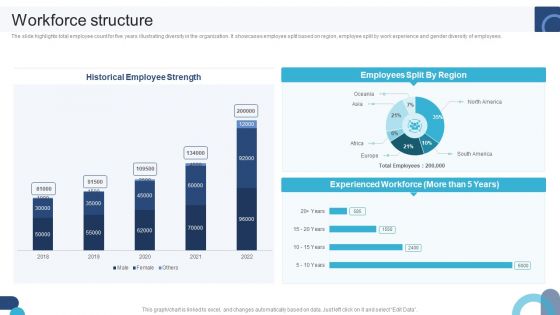
Digital Application Software Development Business Profile Workforce Structure Infographics PDF
The slide highlights total employee count for five years illustrating diversity in the organization. It showcases employee split based on region, employee split by work experience and gender diversity of employees. Do you know about Slidesgeeks Digital Application Software Development Business Profile Workforce Structure Infographics PDF These are perfect for delivering any kind od presentation. Using it, create PowerPoint presentations that communicate your ideas and engage audiences. Save time and effort by using our pre-designed presentation templates that are perfect for a wide range of topic. Our vast selection of designs covers a range of styles, from creative to business, and are all highly customizable and easy to edit. Download as a PowerPoint template or use them as Google Slides themes.
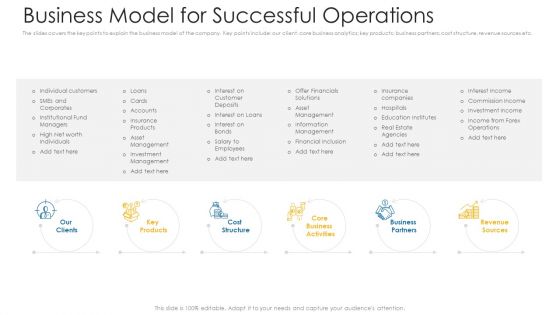
Business Model For Successful Operations Ppt Infographics Maker PDF
The slides covers the key points to explain the business model of the company. Key points include our client. core business analytics key products business partners cost structure, revenue sources etc.This is a business model for successful operations ppt infographics maker pdf. template with various stages. Focus and dispense information on six stages using this creative set, that comes with editable features. It contains large content boxes to add your information on topics like our clients, cost structure, business partners, core business activities. You can also showcase facts, figures, and other relevant content using this PPT layout. Grab it now.
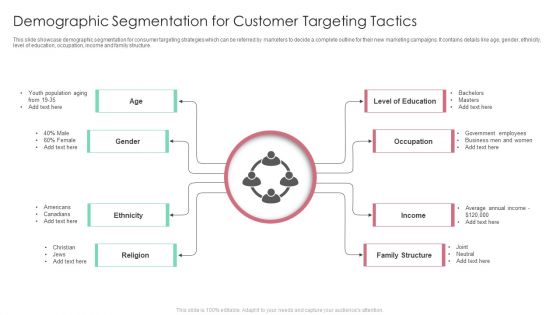
Demographic Segmentation For Customer Targeting Tactics Ppt Infographics Portfolio PDF
This slide showcase demographic segmentation for consumer targeting strategies which can be referred by marketers to decide a complete outline for their new marketing campaigns. It contains details like age, gender, ethnicity, level of education, occupation, income and family structure. Presenting Demographic Segmentation For Customer Targeting Tactics Ppt Infographics Portfolio PDF to dispense important information. This template comprises eight stages. It also presents valuable insights into the topics including Ethnicity, Religion, Family Structure, Level Of Education. This is a completely customizable PowerPoint theme that can be put to use immediately. So, download it and address the topic impactfully.
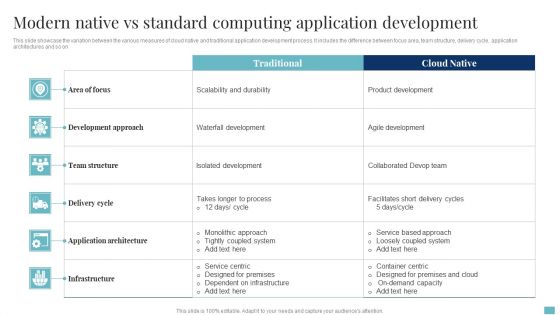
Modern Native Vs Standard Computing Application Development Infographics PDF
This slide showcase the variation between the various measures of cloud native and traditional application development process. It includes the difference between focus area, team structure, delivery cycle, application architectures and so on. Pitch your topic with ease and precision using this Modern Native Vs Standard Computing Application Development Infographics PDF. This layout presents information on Development Approach, Application Architecture, Team Structure. It is also available for immediate download and adjustment. So, changes can be made in the color, design, graphics or any other component to create a unique layout.
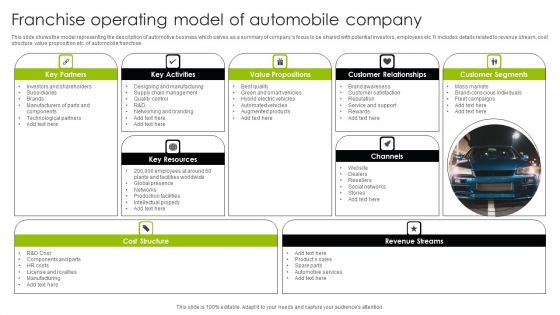
Franchise Operating Model Of Automobile Company Ppt Styles Infographics PDF
This slide shows the model representing the description of automotive business which serves as a summary of companys focus to be shared with potential investors, employees etc. It includes details related to revenue stream, cost structure, value proposition etc. of automobile franchise. Showcasing this set of slides titled Franchise Operating Model Of Automobile Company Ppt Styles Infographics PDF. The topics addressed in these templates are Cost Structure, Revenue Streams, Key Resources, Value Propositions. All the content presented in this PPT design is completely editable. Download it and make adjustments in color, background, font etc. as per your unique business setting.
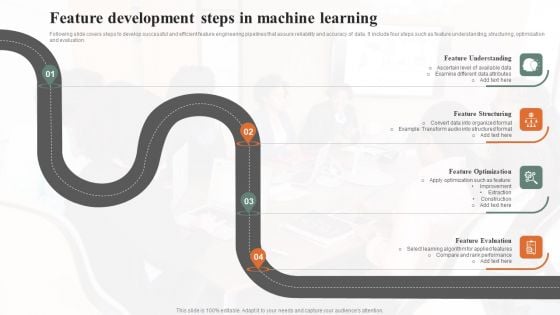
Feature Development Steps In Machine Learning Infographics PDF
Following slide covers steps to develop successful and efficient feature engineering pipelines that assure reliability and accuracy of data. It include four steps such as feature understanding, structuring, optimization and evaluation. Persuade your audience using this Feature Development Steps In Machine Learning Infographics PDF. This PPT design covers four stages, thus making it a great tool to use. It also caters to a variety of topics including Feature Understanding, Feature Structuring, Feature Optimization . Download this PPT design now to present a convincing pitch that not only emphasizes the topic but also showcases your presentation skills.
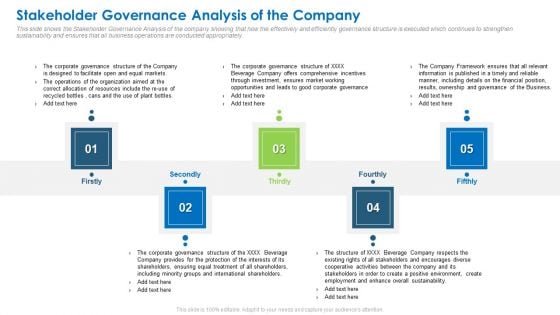
Stakeholder Governance Analysis Of The Company Infographics PDF
This slide shows the Stakeholder Governance Analysis of the company showing that how the effectively and efficiently governance structure is executed which continues to strengthen sustainability and ensures that all business operations are conducted appropriately. This is a stakeholder governance analysis of the company infographics pdf template with various stages. Focus and dispense information on five stages using this creative set, that comes with editable features. It contains large content boxes to add your information on topics like stakeholder governance analysis of the company. You can also showcase facts, figures, and other relevant content using this PPT layout. Grab it now.
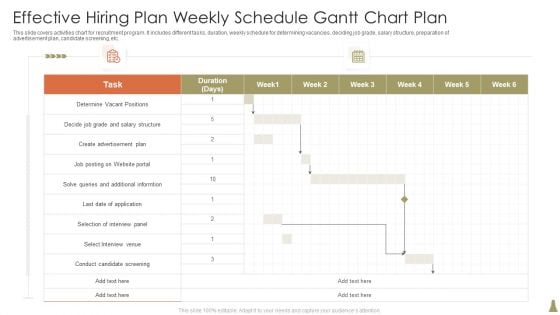
Effective Hiring Plan Weekly Schedule Gantt Chart Plan Infographics PDF
This slide covers activities chart for recruitment program. It includes different tasks, duration, weekly schedule for determining vacancies, deciding job grade, salary structure, preparation of advertisement plan, candidate screening, etc. Pitch your topic with ease and precision using this Effective Hiring Plan Weekly Schedule Gantt Chart Plan Infographics PDF. This layout presents information on Determine, Advertisement Plan, Informtion. It is also available for immediate download and adjustment. So, changes can be made in the color, design, graphics or any other component to create a unique layout.
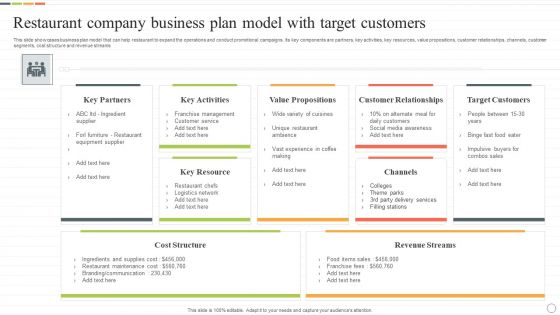
Restaurant Company Business Plan Model With Target Customers Infographics PDF
This slide showcases business plan model that can help restaurant to expand the operations and conduct promotional campaigns. Its key components are partners, key activities, key resources, value propositions, customer relationships, channels, customer segments, cost structure and revenue streams. Pitch your topic with ease and precision using this Restaurant Company Business Plan Model With Target Customers Infographics PDF. This layout presents information on Value Propositions, Customer Relationships, Target Customers. It is also available for immediate download and adjustment. So, changes can be made in the color, design, graphics or any other component to create a unique layout.
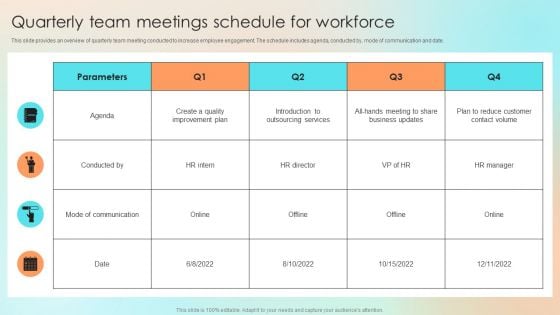
Quarterly Team Meetings Schedule For Workforce Infographics PDF
This slide provides an overview of quarterly team meeting conducted to increase employee engagement. The schedule includes agenda, conducted by, mode of communication and date. The Quarterly Team Meetings Schedule For Workforce Infographics PDF is a compilation of the most recent design trends as a series of slides. It is suitable for any subject or industry presentation, containing attractive visuals and photo spots for businesses to clearly express their messages. This template contains a variety of slides for the user to input data, such as structures to contrast two elements, bullet points, and slides for written information. Slidegeeks is prepared to create an impression.
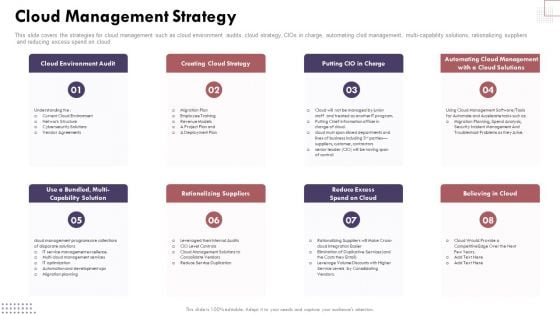
Cloud Management Strategy Cloud Computing Complexities And Solutions Infographics PDF
This slide covers the strategies for cloud management such as cloud environment audits, cloud strategy, CIOs in charge, automating clod management, multi-capability solutions, rationalizing suppliers and reducing excess spend on cloud. The Cloud Management Strategy Cloud Computing Complexities And Solutions Infographics PDF is a compilation of the most recent design trends as a series of slides. It is suitable for any subject or industry presentation, containing attractive visuals and photo spots for businesses to clearly express their messages. This template contains a variety of slides for the user to input data, such as structures to contrast two elements, bullet points, and slides for written information. Slidegeeks is prepared to create an impression.
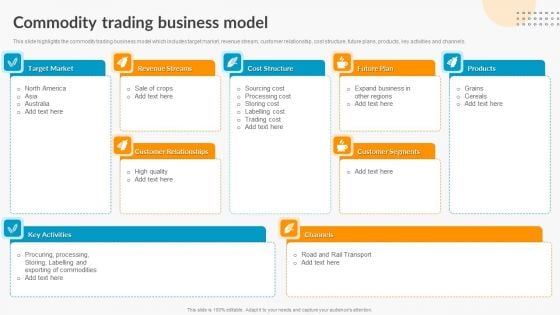
Commodity Trading Business Model Export Trade Business Profile Infographics PDF
This slide highlights the commodity trading business model which includes target market, revenue stream, customer relationship, cost structure, future plans, products, key activities and channels. Want to ace your presentation in front of a live audience Our Commodity Trading Business Model Export Trade Business Profile Infographics PDF can help you do that by engaging all the users towards you.. Slidegeeks experts have put their efforts and expertise into creating these impeccable powerpoint presentations so that you can communicate your ideas clearly. Moreover, all the templates are customizable, and easy-to-edit and downloadable. Use these for both personal and commercial use.
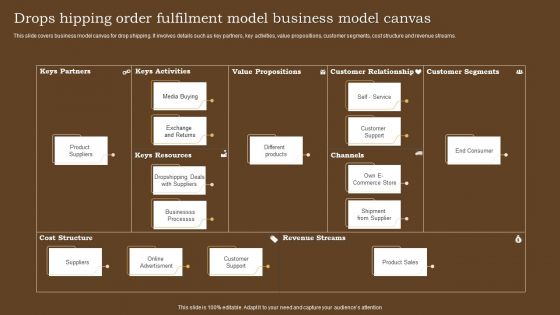
Drops Hipping Order Fulfilment Model Business Model Canvas Infographics PDF
This slide covers business model canvas for drop shipping. It involves details such as key partners, key activities, value propositions, customer segments, cost structure and revenue streams. Pitch your topic with ease and precision using this Drops Hipping Order Fulfilment Model Business Model Canvas Infographics PDF. This layout presents information on Media Buying, Exchange And Returns, Different Products. It is also available for immediate download and adjustment. So, changes can be made in the color, design, graphics or any other component to create a unique layout.
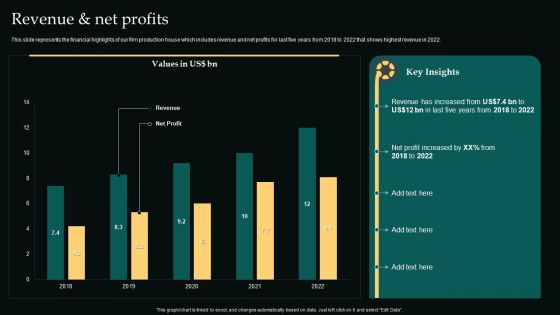
Revenue And Net Profits Movie Editing Company Outline Infographics PDF
This slide represents the business model of film production company which covers key partners, activities, value proposition, customer relationships, key resources, channels, cost structure, revenue streams, etc.Want to ace your presentation in front of a live audience Our Revenue And Net Profits Movie Editing Company Outline Infographics PDF can help you do that by engaging all the users towards you. Slidegeeks experts have put their efforts and expertise into creating these impeccable powerpoint presentations so that you can communicate your ideas clearly. Moreover, all the templates are customizable, and easy-to-edit and downloadable. Use these for both personal and commercial use.
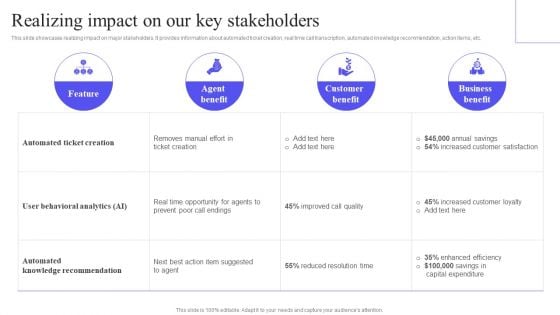
Realizing Impact On Our Key Stakeholders Infographics PDF
This slide showcases realizing impact on major stakeholders. It provides information about automated ticket creation, real time call transcription, automated knowledge recommendation, action items, etc. The Realizing Impact On Our Key Stakeholders Infographics PDF is a compilation of the most recent design trends as a series of slides. It is suitable for any subject or industry presentation, containing attractive visuals and photo spots for businesses to clearly express their messages. This template contains a variety of slides for the user to input data, such as structures to contrast two elements, bullet points, and slides for written information. Slidegeeks is prepared to create an impression.
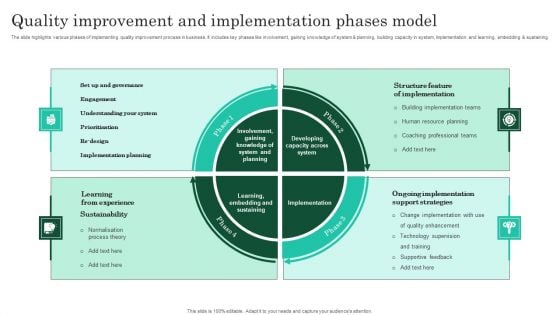
Quality Improvement And Implementation Phases Model Infographics PDF
The slide highlights various phases of implementing quality improvement process in business. It includes key phases like involvement, gaining knowledge of system and planning, building capacity in system, implementation and learning, embedding and sustaining. Presenting Quality Improvement And Implementation Phases Model Infographics PDF to dispense important information. This template comprises four stages. It also presents valuable insights into the topics including Structure Feature Of Implementation, Ongoing Implementation Support Strategies, Implementation Planning. This is a completely customizable PowerPoint theme that can be put to use immediately. So, download it and address the topic impactfully.
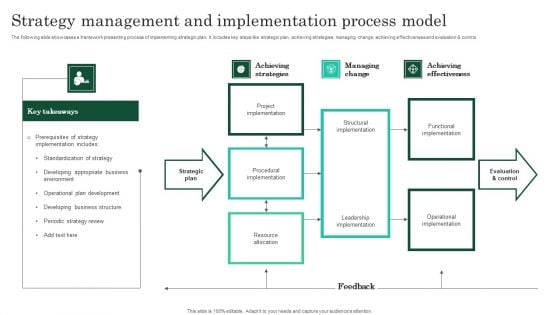
Strategy Management And Implementation Process Model Infographics PDF
The following slide showcases a framework presenting process of implementing strategic plan. It includes key steps like strategic plan, achieving strategies, managing change, achieving effectiveness and evaluation and control. Pitch your topic with ease and precision using this Strategy Management And Implementation Process Model Infographics PDF. This layout presents information on Operational Plan Development, Developing Business Structure, Periodic Strategy Review. It is also available for immediate download and adjustment. So, changes can be made in the color, design, graphics or any other component to create a unique layout.
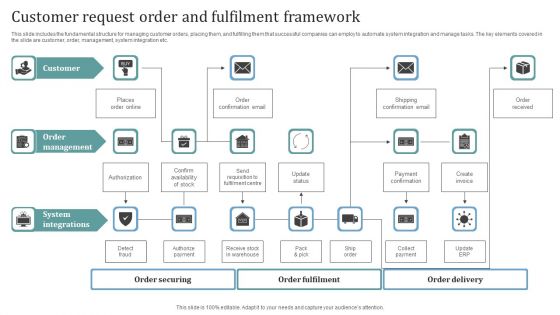
Customer Request Order And Fulfilment Framework Infographics PDF
This slide includes the fundamental structure for managing customer orders, placing them, and fulfilling them that successful companies can employ to automate system integration and manage tasks. The key elements covered in the slide are customer, order, management, system integration etc. Showcasing this set of slides titled Customer Request Order And Fulfilment Framework Infographics PDF. The topics addressed in these templates are Customer, Order Management, System Integrations. All the content presented in this PPT design is completely editable. Download it and make adjustments in color, background, font etc. as per your unique business setting.
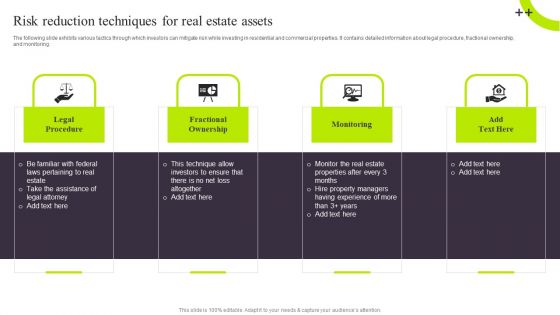
Risk Reduction Techniques For Real Estate Assets Infographics PDF
The following slide exhibits various tactics through which investors can mitigate risk while investing in residential and commercial properties. It contains detailed information about legal procedure, fractional ownership, and monitoring. The Risk Reduction Techniques For Real Estate Assets Infographics PDF is a compilation of the most recent design trends as a series of slides. It is suitable for any subject or industry presentation, containing attractive visuals and photo spots for businesses to clearly express their messages. This template contains a variety of slides for the user to input data, such as structures to contrast two elements, bullet points, and slides for written information. Slidegeeks is prepared to create an impression.
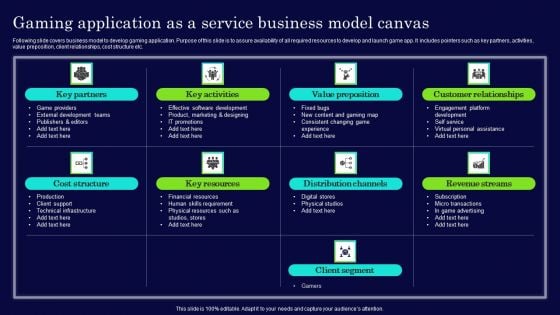
Gaming Application As A Service Business Model Canvas Infographics PDF
Following slide covers business model to develop gaming application. Purpose of this slide is to assure availability of all required resources to develop and launch game app. It includes pointers such as key partners, activities, value preposition, client relationships, cost structure etc. Persuade your audience using this Gaming Application As A Service Business Model Canvas Infographics PDF. This PPT design covers nine stages, thus making it a great tool to use. It also caters to a variety of topics including Revenue Streams, Customer Relationships, Value Preposition. Download this PPT design now to present a convincing pitch that not only emphasizes the topic but also showcases your presentation skills.
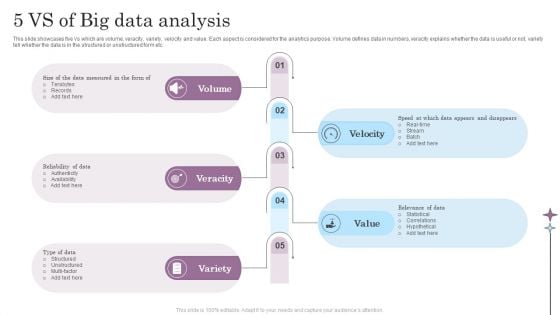
5 Vs Of Big Data Analysis Infographics PDF
This slide showcases five Vs which are volume, veracity, variety, velocity and value. Each aspect is considered for the analytics purpose. Volume defines data in numbers, veracity explains whether the data is useful or not, variety tell whether the data is in the structured or unstructured form etc. Persuade your audience using this 5 Vs Of Big Data Analysis Infographics PDF. This PPT design covers five stages, thus making it a great tool to use. It also caters to a variety of topics including Velocity, Volume, Veracity. Download this PPT design now to present a convincing pitch that not only emphasizes the topic but also showcases your presentation skills.
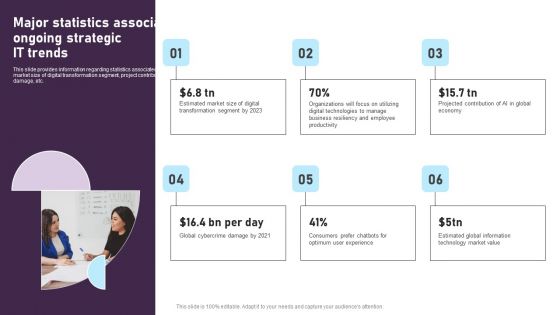
Major Statistics Associated With Ongoing Strategic IT Trends Infographics PDF
This slide provides information regarding statistics associated with ongoing IT trends in terms of market size of digital transformation segment, project contribution of AI, amount of global crime damage, etc. The Major Statistics Associated With Ongoing Strategic IT Trends Infographics PDF is a compilation of the most recent design trends as a series of slides. It is suitable for any subject or industry presentation, containing attractive visuals and photo spots for businesses to clearly express their messages. This template contains a variety of slides for the user to input data, such as structures to contrast two elements, bullet points, and slides for written information. Slidegeeks is prepared to create an impression.
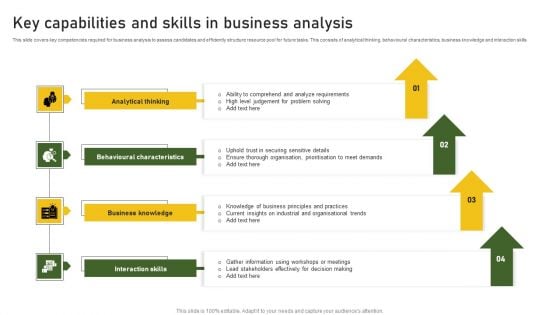
Key Capabilities And Skills In Business Analysis Infographics PDF
This slide covers key competencies required for business analysis to assess candidates and efficiently structure resource pool for future tasks. This consists of analytical thinking, behavioural characteristics, business knowledge and interaction skills. Presenting Key Capabilities And Skills In Business Analysis Infographics PDF to dispense important information. This template comprises four stages. It also presents valuable insights into the topics including Analytical Thinking, Behavioural Characteristics, Business Knowledge. This is a completely customizable PowerPoint theme that can be put to use immediately. So, download it and address the topic impactfully.
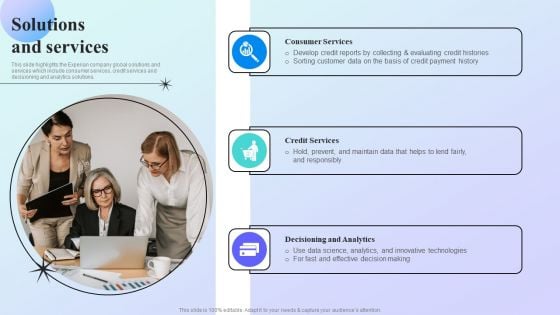
Information Analytics Company Outline Solutions And Services Infographics PDF
This slide highlights the Experian company global solutions and services which include consumer services, credit services and decisioning and analytics solutions. The Information Analytics Company Outline Solutions And Services Infographics PDF is a compilation of the most recent design trends as a series of slides. It is suitable for any subject or industry presentation, containing attractive visuals and photo spots for businesses to clearly express their messages. This template contains a variety of slides for the user to input data, such as structures to contrast two elements, bullet points, and slides for written information. Slidegeeks is prepared to create an impression.
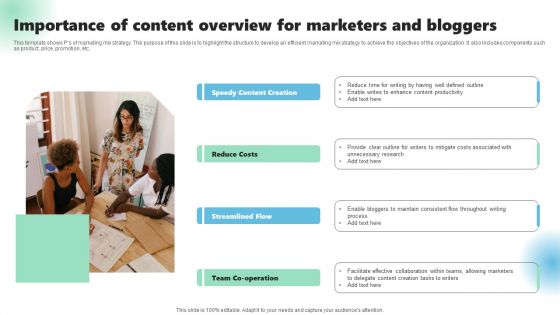
Importance Of Content Overview For Marketers And Bloggers Infographics PDF
This template shows Ps of marketing mix strategy. The purpose of this slide is to highlight the structure to develop an efficient marketing mix strategy to achieve the objectives of the organization. It also includes components such as product, price, promotion, etc. Persuade your audience using this Importance Of Content Overview For Marketers And Bloggers Infographics PDF. This PPT design covers four stages, thus making it a great tool to use. It also caters to a variety of topics including Content Creation, Reduce Costs, Streamlined Flow. Download this PPT design now to present a convincing pitch that not only emphasizes the topic but also showcases your presentation skills.
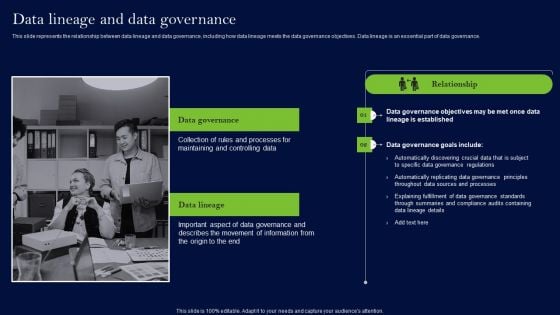
Data Lineage Methods Data Lineage And Data Governance Infographics PDF
This slide represents the relationship between data lineage and data governance, including how data lineage meets the data governance objectives. Data lineage is an essential part of data governance. The Data Lineage Methods Data Lineage And Data Governance Infographics PDF is a compilation of the most recent design trends as a series of slides. It is suitable for any subject or industry presentation, containing attractive visuals and photo spots for businesses to clearly express their messages. This template contains a variety of slides for the user to input data, such as structures to contrast two elements, bullet points, and slides for written information. Slidegeeks is prepared to create an impression.
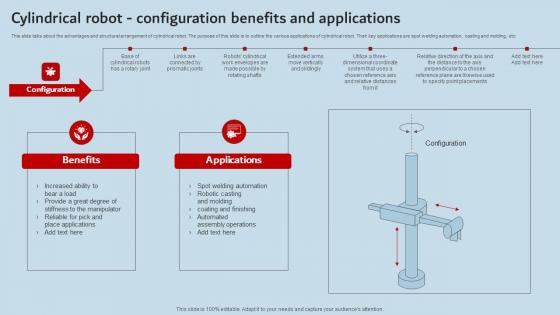
Cylindrical Robot Configuration Benefits And Applications Industrial Robots Infographics Pdf
This slide talks about the advantages and structural arrangement of cylindrical robot. The purpose of this slide is to outline the various applications of cylindrical robot. Their key applications are spot welding automation, casting and molding, etc. This modern and well-arranged Cylindrical Robot Configuration Benefits And Applications Industrial Robots Infographics Pdf provides lots of creative possibilities. It is very simple to customize and edit with the Powerpoint Software. Just drag and drop your pictures into the shapes. All facets of this template can be edited with Powerpoint no extra software is necessary. Add your own material, put your images in the places assigned for them, adjust the colors, and then you can show your slides to the world, with an animated slide included. This slide talks about the advantages and structural arrangement of cylindrical robot. The purpose of this slide is to outline the various applications of cylindrical robot. Their key applications are spot welding automation, casting and molding, etc.
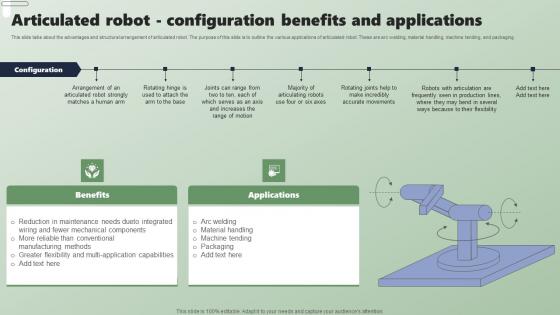
Articulated Robot Configuration Benefits Applications Of Industrial Robots Infographics Pdf
This slide talks about the advantages and structural arrangement of articulated robot. The purpose of this slide is to outline the various applications of articulated robot. These are arc welding, material handling, machine tending, and packaging. Slidegeeks is here to make your presentations a breeze with Articulated Robot Configuration Benefits Applications Of Industrial Robots Infographics Pdf With our easy-to-use and customizable templates, you can focus on delivering your ideas rather than worrying about formatting. With a variety of designs to choose from, you are sure to find one that suits your needs. And with animations and unique photos, illustrations, and fonts, you can make your presentation pop. So whether you are giving a sales pitch or presenting to the board, make sure to check out Slidegeeks first This slide talks about the advantages and structural arrangement of articulated robot. The purpose of this slide is to outline the various applications of articulated robot. These are arc welding, material handling, machine tending, and packaging.
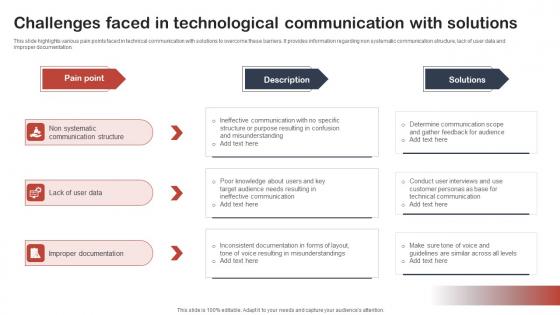
Challenges Faced In Technological Communication With Solutions Infographics Pdf
This slide highlights various pain points faced in technical communication with solutions to overcome these barriers. It provides information regarding non systematic communication structure, lack of user data and improper documentation. Showcasing this set of slides titled Challenges Faced In Technological Communication With Solutions Infographics Pdf. The topics addressed in these templates are Pain Point, Description, Solutions. All the content presented in this PPT design is completely editable. Download it and make adjustments in color, background, font etc. as per your unique business setting. This slide highlights various pain points faced in technical communication with solutions to overcome these barriers. It provides information regarding non systematic communication structure, lack of user data and improper documentation.
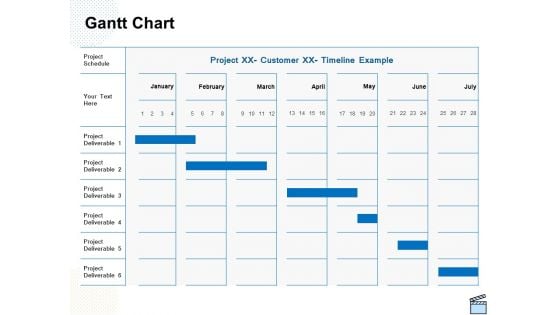
Professional Picture Proposal Gantt Chart Ppt Infographics Graphics Design PDF
Your complex projects can be managed and organized simultaneously using this detailed professional picture proposal gantt chart ppt infographics graphics design pdf template. Track the milestones, tasks, phases, activities, and subtasks to get an updated visual of your project. Share your planning horizon and release plan with this well crafted presentation template. This exemplary template can be used to plot various dependencies to distinguish the tasks in the pipeline and their impact on the schedules and deadlines of the project. Apart from this, you can also share this visual presentation with your team members and stakeholders. It a resourceful tool that can be incorporated into your business structure. Therefore, download and edit it conveniently to add the data and statistics as per your requirement.
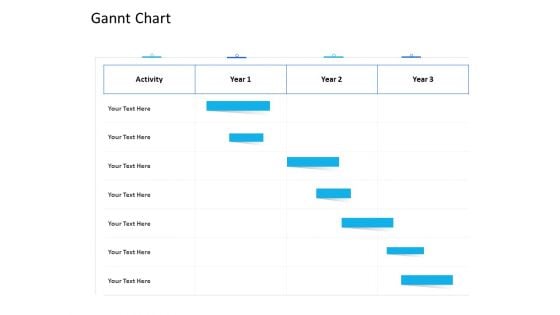
Organization Manpower Management Technology Gannt Chart Infographics PDF
Your complex projects can be managed and organized simultaneously using this detailed organization manpower management technology gannt chart infographics pdf template. Track the milestones, tasks, phases, activities, and subtasks to get an updated visual of your project. Share your planning horizon and release plan with this well crafted presentation template. This exemplary template can be used to plot various dependencies to distinguish the tasks in the pipeline and their impact on the schedules and deadlines of the project. Apart from this, you can also share this visual presentation with your team members and stakeholders. It a resourceful tool that can be incorporated into your business structure. Therefore, download and edit it conveniently to add the data and statistics as per your requirement.
Agenda PowerPoint Template Business Infographics Ppt PowerPoint Presentation Complete Deck
Improve your presentation delivery using this agenda powerpoint template business infographics ppt powerpoint presentation complete deck. Support your business vision and objectives using this well-structured PPT deck. This template offers a great starting point for delivering beautifully designed presentations on the topic of your choice. Comprising twelve slides this professionally designed template is all you need to host discussion and meetings with collaborators. Each slide is self-explanatory and equipped with high-quality graphics that can be adjusted to your needs. Therefore, you will face no difficulty in portraying your desired content using this PPT slideshow. This PowerPoint slideshow contains every important element that you need for a great pitch. It is not only editable but also available for immediate download and utilization. The color, font size, background, shapes everything can be modified to create your unique presentation layout. Therefore, download it now.
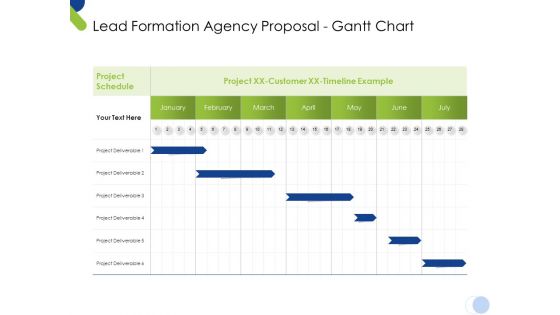
Lead Formation Agency Proposal Gantt Chart Ppt Summary Infographics PDF
Your complex projects can be managed and organized simultaneously using this detailed lead formation agency proposal gantt chart ppt summary infographics pdf template. Track the milestones, tasks, phases, activities, and subtasks to get an updated visual of your project. Share your planning horizon and release plan with this well crafted presentation template. This exemplary template can be used to plot various dependencies to distinguish the tasks in the pipeline and their impact on the schedules and deadlines of the project. Apart from this, you can also share this visual presentation with your team members and stakeholders. It a resourceful tool that can be incorporated into your business structure. Therefore, download and edit it conveniently to add the data and statistics as per your requirement.

Optimize Enterprise Core How Balance Sheet Is Restructured Infographics PDF
This slide covers information regarding the balance restructuring process. Restructuring include current assets and liabilities, long term assets and liabilities and owners equity. If outstanding debt level of firm rises to unmanageable level, firm should restructure its balance sheet in order to avoid bankruptcy and aggressive debt capital structure. Presenting Optimize Enterprise Core How Balance Sheet Is Restructured Infographics PDF to provide visual cues and insights. Share and navigate important information on three stages that need your due attention. This template can be used to pitch topics like Asset Rationalization, Adjusting Liability, Capital Moderation. In addtion, this PPT design contains high resolution images, graphics, etc, that are easily editable and available for immediate download.
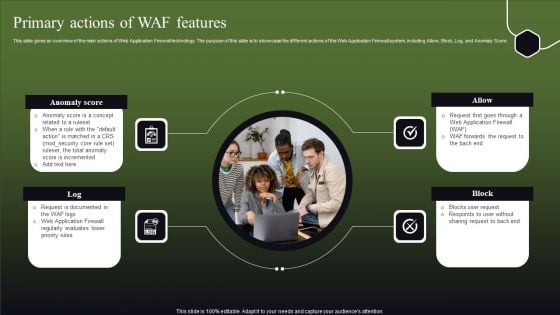
Primary Actions Of WAF Features Ppt Infographics Ideas PDF
This slide gives an overview of the main actions of Web Application Firewall technology. The purpose of this slide is to showcase the different actions of the Web Application Firewall system, including Allow, Block, Log, and Anomaly Score. The Primary Actions Of WAF Features Ppt Infographics Ideas PDF is a compilation of the most recent design trends as a series of slides. It is suitable for any subject or industry presentation, containing attractive visuals and photo spots for businesses to clearly express their messages. This template contains a variety of slides for the user to input data, such as structures to contrast two elements, bullet points, and slides for written information. Slidegeeks is prepared to create an impression.
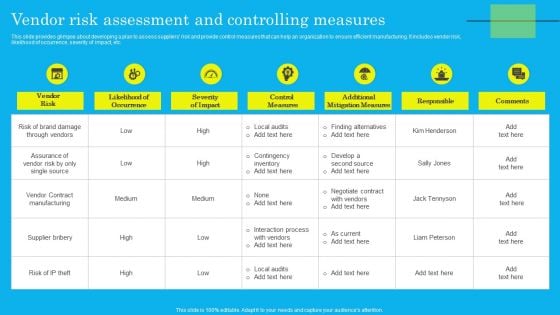
Vendor Risk Assessment And Controlling Measures Infographics PDF
This slide provides glimpse about developing a plan to assess suppliers risk and provide control measures that can help an organization to ensure efficient manufacturing. It includes vendor risk, likelihood of occurrence, severity of impact, etc. The Vendor Risk Assessment And Controlling Measures Infographics PDF is a compilation of the most recent design trends as a series of slides. It is suitable for any subject or industry presentation, containing attractive visuals and photo spots for businesses to clearly express their messages. This template contains a variety of slides for the user to input data, such as structures to contrast two elements, bullet points, and slides for written information. Slidegeeks is prepared to create an impression.

Airtable Capital Funding Pitch Deck Client Testimonials Infographics PDF
This slide covers client testimonials of company offered platform for creating ands sharing structural database. It highlights key benefits such as wide range of purposes, running marketing operations and facilitate effective workflows. Do you know about Slidesgeeks Airtable Capital Funding Pitch Deck Client Testimonials Infographics PDF. These are perfect for delivering any kind od presentation. Using it, create PowerPoint presentations that communicate your ideas and engage audiences. Save time and effort by using our pre designed presentation templates that are perfect for a wide range of topic. Our vast selection of designs covers a range of styles, from creative to business, and are all highly customizable and easy to edit. Download as a PowerPoint template or use them as Google Slides themes.

Roadmap For Reinforcement Learning Project Ppt Infographics Graphics Example PDF
This slide shows the roadmap for the reinforcement learning project, including the list of tasks to be performed from March 2023 to February 2024. The tasks include initializing the values table, observing the current state, choosing an action for that state, and so on. The Roadmap For Reinforcement Learning Project Ppt Infographics Graphics Example PDF is a compilation of the most recent design trends as a series of slides. It is suitable for any subject or industry presentation, containing attractive visuals and photo spots for businesses to clearly express their messages. This template contains a variety of slides for the user to input data, such as structures to contrast two elements, bullet points, and slides for written information. Slidegeeks is prepared to create an impression.
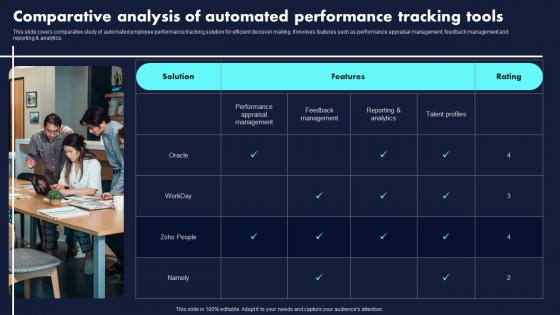
Comparative Analysis Of Automated Proven Techniques For Enhancing Infographics Pdf
This slide covers comparative study of automated employee performance tracking solution for efficient decision making. It involves features such as performance appraisal management, feedback management and reporting analytics.The Comparative Analysis Of Automated Proven Techniques For Enhancing Infographics Pdf is a compilation of the most recent design trends as a series of slides. It is suitable for any subject or industry presentation, containing attractive visuals and photo spots for businesses to clearly express their messages. This template contains a variety of slides for the user to input data, such as structures to contrast two elements, bullet points, and slides for written information. Slidegeeks is prepared to create an impression. This slide covers comparative study of automated employee performance tracking solution for efficient decision making. It involves features such as performance appraisal management, feedback management and reporting analytics.
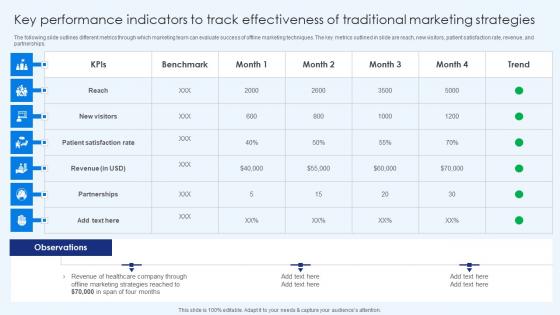
Key Performance Indicators To Track Effectivenes Healthcare Promotion Infographics Pdf
The following slide outlines different metrics through which marketing team can evaluate success of offline marketing techniques. The key metrics outlined in slide are reach, new visitors, patient satisfaction rate, revenue, and partnerships. The Key Performance Indicators To Track Effectivenes Healthcare Promotion Infographics Pdf is a compilation of the most recent design trends as a series of slides. It is suitable for any subject or industry presentation, containing attractive visuals and photo spots for businesses to clearly express their messages. This template contains a variety of slides for the user to input data, such as structures to contrast two elements, bullet points, and slides for written information. Slidegeeks is prepared to create an impression. The following slide outlines different metrics through which marketing team can evaluate success of offline marketing techniques. The key metrics outlined in slide are reach, new visitors, patient satisfaction rate, revenue, and partnerships.
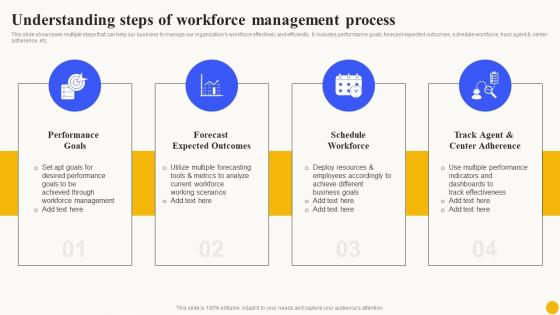
Understanding Steps Of Workforce Planned Workforce Enhancement Infographics Pdf
This slide showcases multiple steps that can help our business to manage our organizations workforce effectively and efficiently. It includes performance goals, forecast expected outcomes, schedule workforce, track agent and center adherence, etc.The Understanding Steps Of Workforce Planned Workforce Enhancement Infographics Pdf is a compilation of the most recent design trends as a series of slides. It is suitable for any subject or industry presentation, containing attractive visuals and photo spots for businesses to clearly express their messages. This template contains a variety of slides for the user to input data, such as structures to contrast two elements, bullet points, and slides for written information. Slidegeeks is prepared to create an impression. This slide showcases multiple steps that can help our business to manage our organizations workforce effectively and efficiently. It includes performance goals, forecast expected outcomes, schedule workforce, track agent and center adherence, etc.
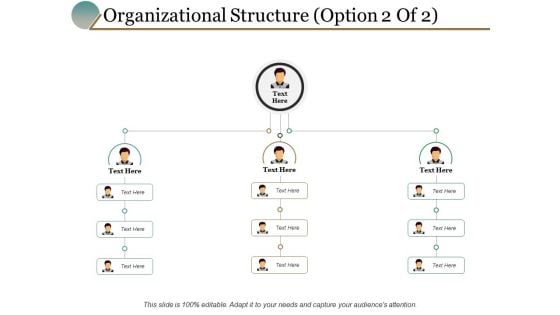
Organizational Structure Option Marketing Ppt PowerPoint Presentation Show Infographics
This is a organizational structure option marketing ppt powerpoint presentation show infographics. This is a three stage process. The stages in this process are business, management, planning, strategy, marketing.

Work Breakdown Structure Ppt PowerPoint Presentation Portfolio Infographics
This is a work breakdown structure ppt powerpoint presentation portfolio infographics. The topics discussed in this diagram are marketing, business, management, planning, strategy This is a completely editable PowerPoint presentation, and is available for immediate download.
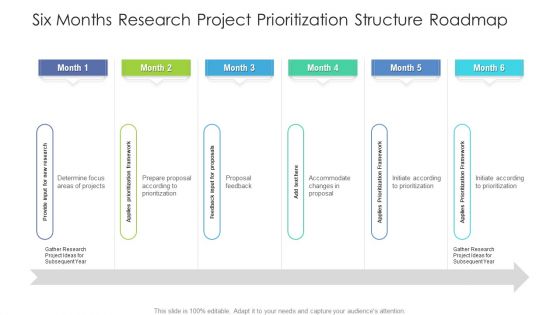
Six Months Research Project Prioritization Structure Roadmap Infographics
Presenting our jaw dropping six months research project prioritization structure roadmap infographics. You can alternate the color, font size, font type, and shapes of this PPT layout according to your strategic process. This PPT presentation is compatible with Google Slides and is available in both standard screen and widescreen aspect ratios. You can also download this well researched PowerPoint template design in different formats like PDF, JPG, and PNG. So utilize this visually appealing design by clicking the download button given below.

Three Months Product Feature Prioritization Structure Roadmap Infographics
Introducing our three months product feature prioritization structure roadmap infographics. This PPT presentation is Google Slides compatible, therefore, you can share it easily with the collaborators for measuring the progress. Also, the presentation is available in both standard screen and widescreen aspect ratios. So edit the template design by modifying the font size, font type, color, and shapes as per your requirements. As this PPT design is fully editable it can be presented in PDF, JPG and PNG formats.
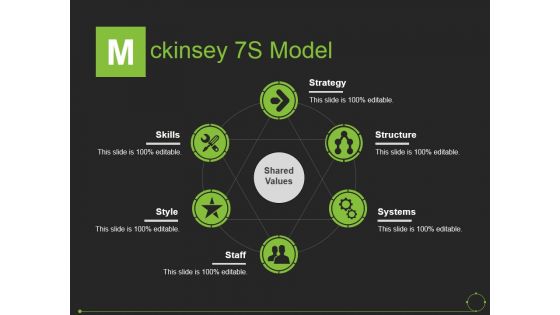
Mckinsey 7S Model Ppt PowerPoint Presentation Slides Infographics
This is a mckinsey 7s model ppt powerpoint presentation slides infographics. This is a two stage process. The stages in this process are hard elements, soft elements, strategy, structure, systems.
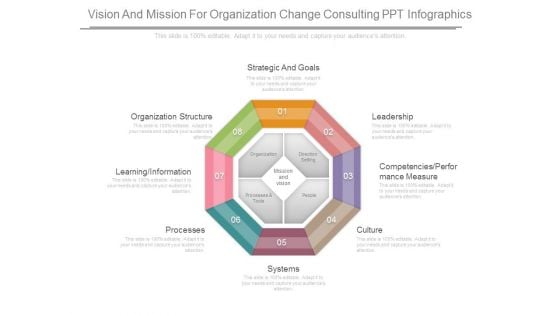
Vision And Mission For Organization Change Consulting Ppt Infographics
This is a vision and mission for organization change consulting ppt infographics. This is a eight stage process. The stages in this process are strategic and goals, leadership , culture , systems , processes , organization, structure , organization, direction setting.
Makeup And Skincare Brand What Makes Our Product Stand Out From The Crowd Ppt Icon Infographics PDF
This slide illustrates the production distinctions of XYZ beauty brand which includes dermatologist tested, fair trade, certified, etc. This is a Makeup And Skincare Brand What Makes Our Product Stand Out From The Crowd Ppt Icon Infographics PDF template with various stages. Focus and dispense information on three stages using this creative set, that comes with editable features. It contains large content boxes to add your information on topics like Dermatologist Tested, Prescription Strength, Beauty Organic. You can also showcase facts, figures, and other relevant content using this PPT layout. Grab it now.
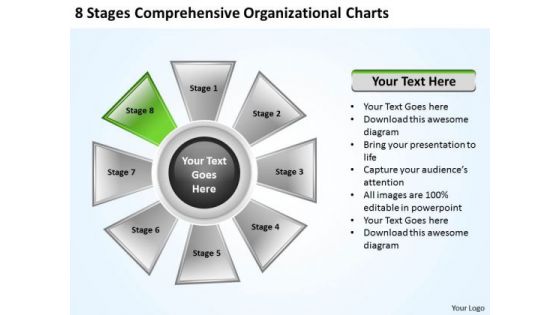
Company Business Strategy Comprehensive Organizational Charts Execution
We present our company business strategy comprehensive organizational charts execution.Download our Process and Flows PowerPoint Templates because Our PowerPoint Templates and Slides will give good value for money. They also have respect for the value of your time. Download and present our Business PowerPoint Templates because You can Double your output with our PowerPoint Templates and Slides. They make beating deadlines a piece of cake. Download our Marketing PowerPoint Templates because Our PowerPoint Templates and Slides will effectively help you save your valuable time. They are readymade to fit into any presentation structure. Download our Flow Charts PowerPoint Templates because Our PowerPoint Templates and Slides will let your team Walk through your plans. See their energy levels rise as you show them the way. Use our Success PowerPoint Templates because you can Set pulses racing with our PowerPoint Templates and Slides. They will raise the expectations of your team.Use these PowerPoint slides for presentations relating to Diagram, system, medical, graph, circular, graphic, nervous, white, circulatory, digestive, business, glowing, reproductive, vector, symbol, circle,element, illustration, icon, pie, chart, round, clipart, biology, respiratory, care, endocrine, design, science, colorful, clip, text, muscular, infographic,transparency, execratory, art, organ, immune. The prominent colors used in the PowerPoint template are Green, White, Gray. Assist them in making the right choice. Open up all the cards with our Company Business Strategy Comprehensive Organizational Charts Execution.
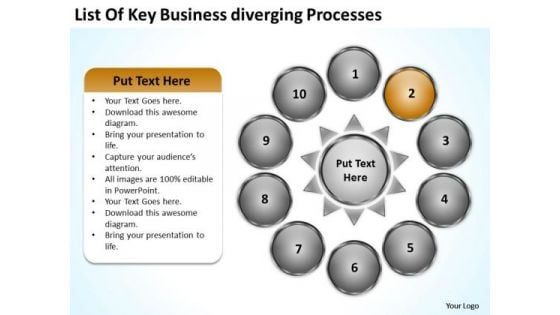
PowerPoint Presentation Diverging Processes Circular Flow Slides
We present our powerpoint presentation diverging processes Circular Flow Slides.Present our Success PowerPoint Templates because iT outlines the entire thought process for the benefit of others. Tell it to the world with your characteristic aplomb. Present our Arrows PowerPoint Templates because you know the path so show the way. Present our Flow charts PowerPoint Templates because there are a bucketful of brilliant ideas swirling around within your group. Download our Signs PowerPoint Templates because this is an amazing graphic to pin-point the manner and processes for them to follow in order to interconnect with each other. Download and present our Process and Flows PowerPoint Templates because you should Demonstrate how you think out of the box.Use these PowerPoint slides for presentations relating to Chart, check,circle, concept, control, cycle, design,development, diagram, do, engineering,evaluate, flow, flow,chart, flowchart,graphic, green, idea, infographic,iterative, life, lifecycle, lifecycle,management, method, model, pdca,plan, plan,dcheckact, process, quality,red, research, schema, software, spiral,step, strategy, success, white, work . The prominent colors used in the PowerPoint template are Brown, Black, Gray. People tell us our powerpoint presentation diverging processes Circular Flow Slides are Nifty. Customers tell us our concept PowerPoint templates and PPT Slides are Striking. Professionals tell us our powerpoint presentation diverging processes Circular Flow Slides are Detailed. Presenters tell us our development PowerPoint templates and PPT Slides are Efficacious. Use our powerpoint presentation diverging processes Circular Flow Slides are Royal. Presenters tell us our diagram PowerPoint templates and PPT Slides are specially created by a professional team with vast experience. They diligently strive to come up with the right vehicle for your brilliant Ideas. Exploit our PowerPoint Presentation Diverging Processes Circular Flow Slides with your ideas. Extract every inch of space on them.
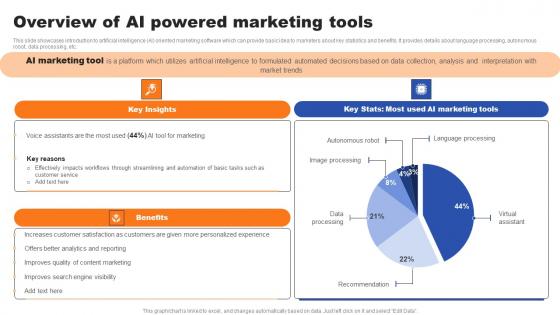
Overview Of AI Powered Marketing Tools Ppt Infographics Designs Download Pdf
This slide showcases introduction to artificial intelligence AI oriented marketing software which can provide basic idea to marketers about key statistics and benefits. It provides details about language processing, autonomous robot, data processing, etc. The Overview Of AI Powered Marketing Tools Ppt Infographics Designs Download Pdf is a compilation of the most recent design trends as a series of slides. It is suitable for any subject or industry presentation, containing attractive visuals and photo spots for businesses to clearly express their messages. This template contains a variety of slides for the user to input data, such as structures to contrast two elements, bullet points, and slides for written information. Slidegeeks is prepared to create an impression. This slide showcases introduction to artificial intelligence AI oriented marketing software which can provide basic idea to marketers about key statistics and benefits. It provides details about language processing, autonomous robot, data processing, etc.
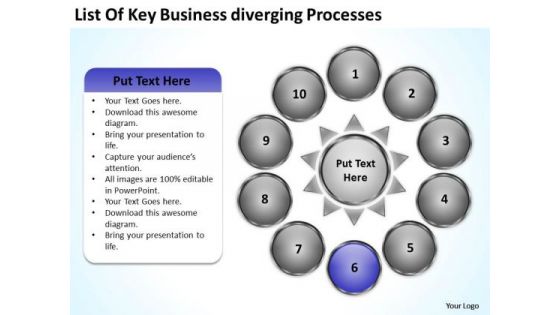
PowerPoint Templates Download Diverging Processes Chart Circular Flow Diagram
We present our powerpoint templates download diverging processes chart Circular Flow Diagram.Use our Success PowerPoint Templates because iT outlines the entire thought process for the benefit of others. Tell it to the world with your characteristic aplomb. Download and present our Arrows PowerPoint Templates because Our PowerPoint Templates and Slides has conjured up a web of all you need with the help of our great team. Use them to string together your glistening ideas. Download and present our Flow charts PowerPoint Templates because you have built your business strategy brick by brick. Download and present our Signs PowerPoint Templates because you understand the illness and its causes. Download and present our Process and Flows PowerPoint Templates because you have imbibed from this fountain of ideas and developed some worthwhile views.Use these PowerPoint slides for presentations relating to Chart, check,circle, concept, control, cycle, design,development, diagram, do, engineering,evaluate, flow, flow,chart, flowchart,graphic, green, idea, infographic,iterative, life, lifecycle, lifecycle,management, method, model, pdca,plan, plan,dcheckact, process, quality,red, research, schema, software, spiral,step, strategy, success, white, work . The prominent colors used in the PowerPoint template are Blue, Black, Gray. People tell us our powerpoint templates download diverging processes chart Circular Flow Diagram are Classic. Customers tell us our circle PowerPoint templates and PPT Slides will generate and maintain the level of interest you desire. They will create the impression you want to imprint on your audience. Professionals tell us our powerpoint templates download diverging processes chart Circular Flow Diagram are Youthful. Presenters tell us our concept PowerPoint templates and PPT Slides are specially created by a professional team with vast experience. They diligently strive to come up with the right vehicle for your brilliant Ideas. Use our powerpoint templates download diverging processes chart Circular Flow Diagram are Ritzy. Presenters tell us our control PowerPoint templates and PPT Slides are specially created by a professional team with vast experience. They diligently strive to come up with the right vehicle for your brilliant Ideas. They say appropriate facial expressions aid communication. Our PowerPoint Templates Download Diverging Processes Chart Circular Flow Diagram can be effective too.

DNA Molecules Cells For Biology Research Ppt PowerPoint Presentation Infographics Template PDF
Pitch your topic with ease and precision using this dna molecules cells for biology research ppt powerpoint presentation infographics template pdf. This layout presents information on dna molecules cells for biology research. It is also available for immediate download and adjustment. So, changes can be made in the color, design, graphics or any other component to create a unique layout.

DNA Strands For Science And Medical Research Ppt PowerPoint Presentation Infographics Information PDF
Pitch your topic with ease and precision using this dna strands for science and medical research ppt powerpoint presentation infographics information pdf. This layout presents information on dna strands for science and medical research. It is also available for immediate download and adjustment. So, changes can be made in the color, design, graphics or any other component to create a unique layout.
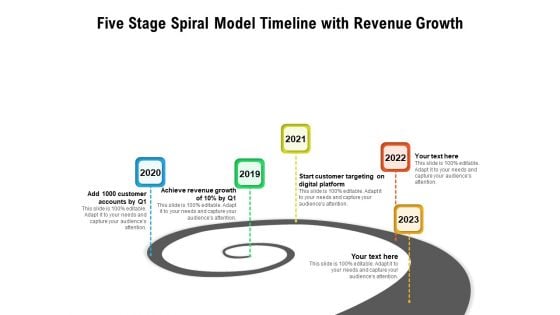
Five Stage Spiral Model Timeline With Revenue Growth Ppt PowerPoint Presentation Pictures Infographics PDF
Presenting this set of slides with name five stage spiral model timeline with revenue growth ppt powerpoint presentation pictures infographics pdf. This is a five stage process. The stages in this process are customer accounts, achieve revenue growth, start customer targeting on digital platform. This is a completely editable PowerPoint presentation and is available for immediate download. Download now and impress your audience.
Icons Slide For Digitization Of Client Onboarding Ppt Infographics Structure PDF
Help your business to create an attention grabbing presentation using our icons slide for digitization of client onboarding ppt infographics structure pdf set of slides. The slide contains innovative icons that can be flexibly edited. Choose this icons slide for digitization of client onboarding ppt infographics structure pdf template to create a satisfactory experience for your customers. Go ahead and click the download button.
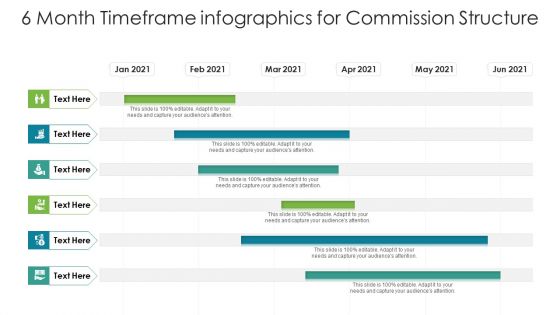
6 Month Timeframe Infographics For Commission Structure Ppt PowerPoint Presentation Gallery Background Designs PDF
Showcasing this set of slides titled 6 month timeframe infographics for commission structure ppt powerpoint presentation gallery background designs pdf. The topics addressed in these templates are 6 month timeframe infographics for commission structure. All the content presented in this PPT design is completely editable. Download it and make adjustments in color, background, font etc. as per your unique business setting.
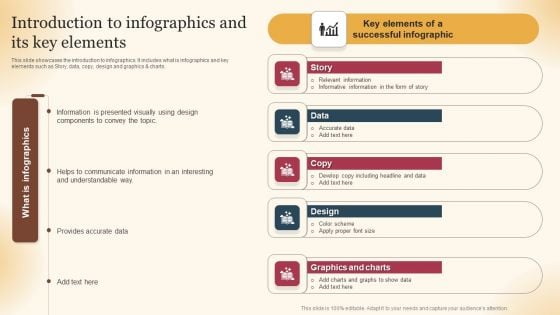
Qualified Traffic Generation Through Search Engines Introduction To Infographics And Its Key Elements Structure PDF
This slide showcases the introduction to infographics. It includes what is infographics and key elements such as Story, data, copy, design and graphics and charts. Presenting this PowerPoint presentation, titled Qualified Traffic Generation Through Search Engines Introduction To Infographics And Its Key Elements Structure PDF, with topics curated by our researchers after extensive research. This editable presentation is available for immediate download and provides attractive features when used. Download now and captivate your audience. Presenting this Qualified Traffic Generation Through Search Engines Introduction To Infographics And Its Key Elements Structure PDF. Our researchers have carefully researched and created these slides with all aspects taken into consideration. This is a completely customizable Qualified Traffic Generation Through Search Engines Introduction To Infographics And Its Key Elements Structure PDF that is available for immediate downloading. Download now and make an impact on your audience. Highlight the attractive features available with our PPTs.


 Continue with Email

 Home
Home


