Circular Arrow Process
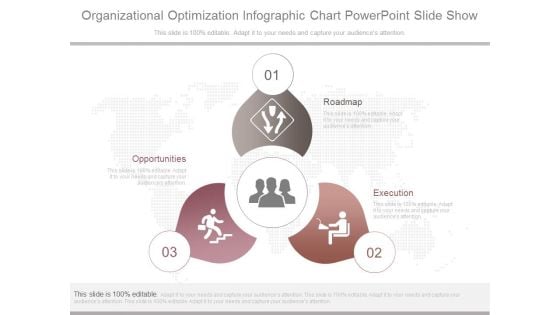
Organizational Optimization Infographic Chart Powerpoint Slide Show
This is a organizational optimization infographic chart powerpoint slide show. This is a three stage process. The stages in this process are opportunities, roadmap, execution.
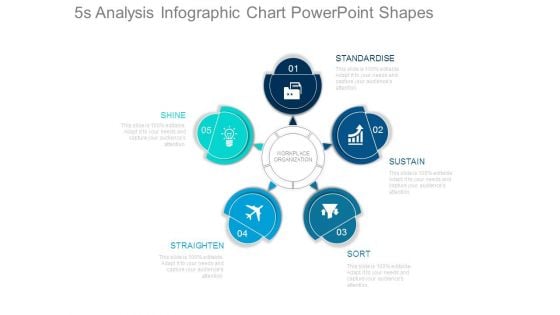
5s Analysis Infographic Chart Powerpoint Shapes
This is a 5s analysis infographic chart powerpoint shapes. This is a five stage process. The stages in this process are workplace organization, shine, straighten, sort, sustain, standardise.
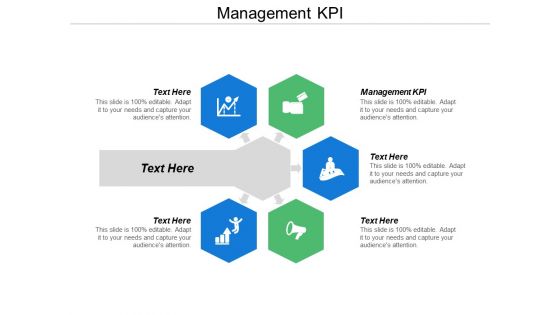
Management Kpi Ppt Powerpoint Presentation Diagram Graph Charts Cpb
This is a management kpi ppt powerpoint presentation diagram graph charts cpb. This is a five stage process. The stages in this process are management kpi.
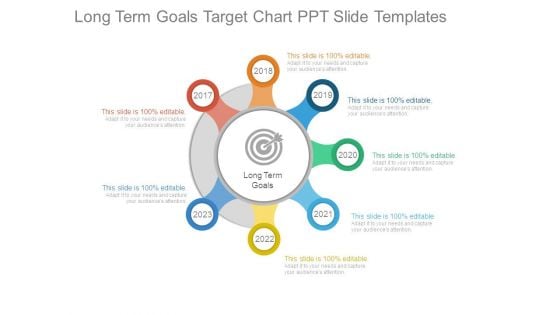
Long Term Goals Target Chart Ppt Slide Templates
This is a long term goals target chart ppt slide templates. This is a seven stage process. The stages in this process are long term goals.
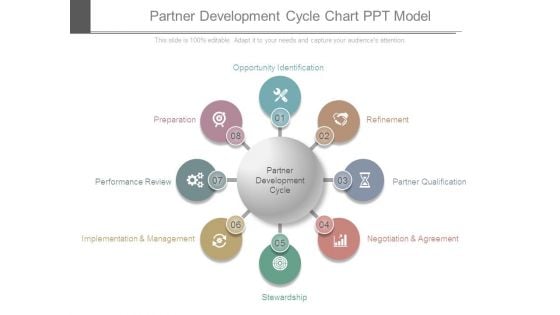
Partner Development Cycle Chart Ppt Model
This is a partner development cycle chart ppt model. This is a eight stage process. The stages in this process are opportunity identification, refinement, partner qualification, negotiation and agreement, stewardship, implementation and management, performance review, preparation.
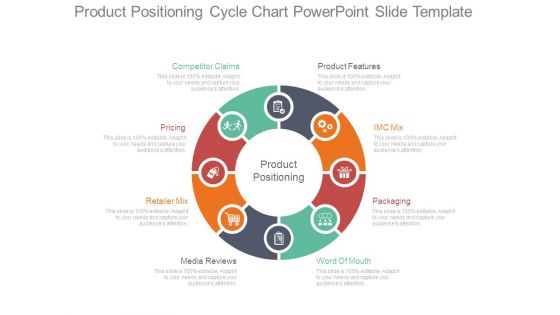
Product Positioning Cycle Chart Powerpoint Slide Template
This is a product positioning cycle chart powerpoint slide template. This is a eight stage process. The stages in this process are product features, imc mix, packaging, word of mouth, media reviews, retailer mix, pricing, competitor claims, product positioning.
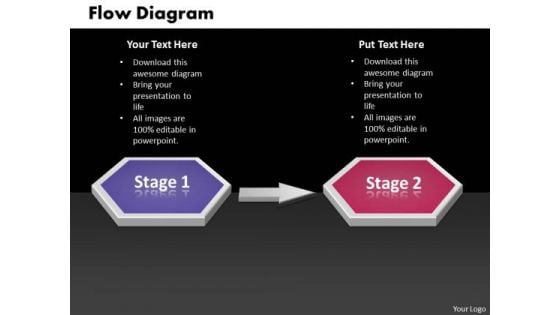
Ppt 3d Linear Work Flow Swim Lane Diagram PowerPoint Template Templates
PPT 3d linear work flow swim lane diagram powerpoint template Templates-This 3D Business PowerPoint Diagram Displays the circular arrows connected to each other signifying the continuous flow of steps to be executed. This Diagram can be used to represent Process charts, Business chart, Sales process chart and Finance process etc.-PPT 3d linear work flow swim lane diagram powerpoint template Templates-Abstract, Action, Attention, Business, Chart, Clipart, Commerce, Concept, Conceptual, Corporate, Customer, Design, Desire, Diagram, Flow, Goals, Guide, Icon, Idea, Illustration, Interest, Manage, Management, Map, Marketing, Mind, Mission, Model, Organization, Performance, Planning, Plans, Process Set an example with your views. Place the bar with our Ppt 3d Linear Work Flow Swim Lane Diagram PowerPoint Template Templates.
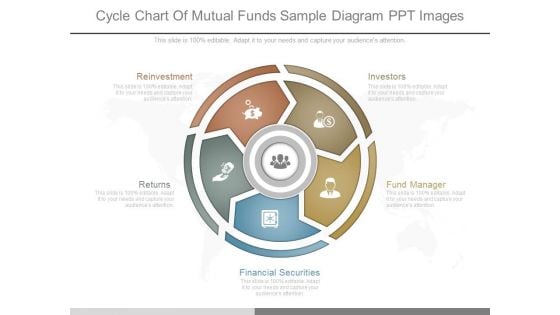
Cycle Chart Of Mutual Funds Sample Diagram Ppt Images
This is a cycle chart of mutual funds sample diagram ppt images. This is a five stage process. The stages in this process are reinvestment, returns, investors, fund manager, financial securities.
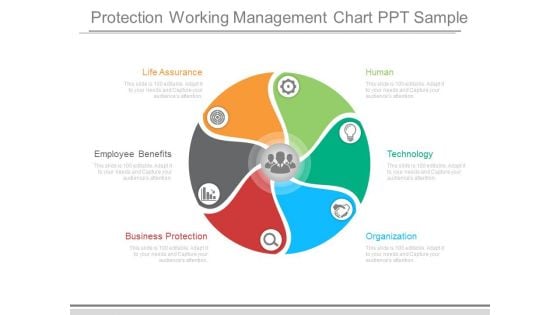
Protection Working Management Chart Ppt Sample
This is a protection working management chart ppt sample. This is a six stage process. The stages in this process are life assurance, employee benefits, business protection, human, technology, organization.
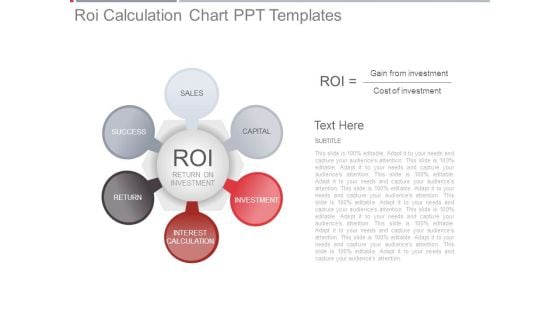
Roi Calculation Chart Ppt Templates
This is a roi calculation chart ppt templates. This is a six stage process. The stages in this process are sales, capital, investment, interest calculation, return, success, return on investment.
Data Flow Charts For Social Media Application Icons Ppt PowerPoint Presentation Gallery Slide Portrait PDF
Presenting Data Flow Charts For Social Media Application Icons Ppt PowerPoint Presentation Gallery Slide Portrait PDF to dispense important information. This template comprises three stages. It also presents valuable insights into the topics including Data Flow Charts, Social Media Application, Icons. This is a completely customizable PowerPoint theme that can be put to use immediately. So, download it and address the topic impactfully.
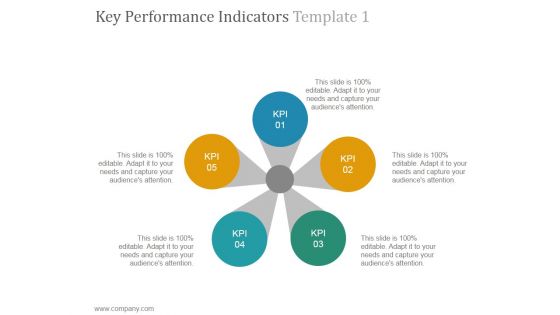
Key Performance Indicators Template 1 Ppt PowerPoint Presentation Inspiration
This is a key performance indicators template 1 ppt powerpoint presentation inspiration. This is a five stage process. The stages in this process are circle, loop, business, process, flow.
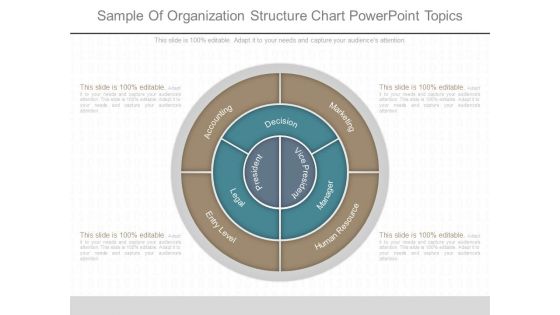
Sample Of Organization Structure Chart Powerpoint Topics
This is a sample of organization structure chart powerpoint topics. This is a four stage process. The stages in this process are president, vice president, decision, entry level, human resource, marketing, accounting.
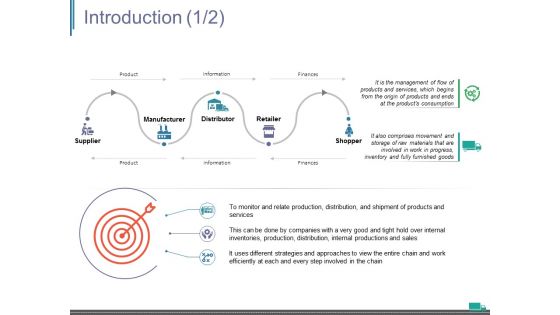
Introduction Template 1 Ppt PowerPoint Presentation Pictures Show
This is a introduction template 1 ppt powerpoint presentation pictures show. This is a six stage process. The stages in this process are goals, advantages, scm, implementation steps, scm introduction, supply chain components, scm process flow.
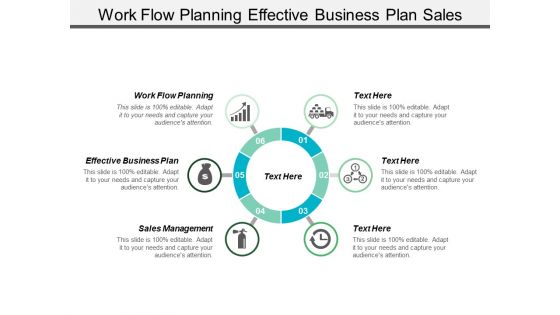
Work Flow Planning Effective Business Plan Sales Management Ppt PowerPoint Presentation Outline Show
This is a work flow planning effective business plan sales management ppt powerpoint presentation outline show. This is a six stage process. The stages in this process are work flow planning, effective business plan, sales management.
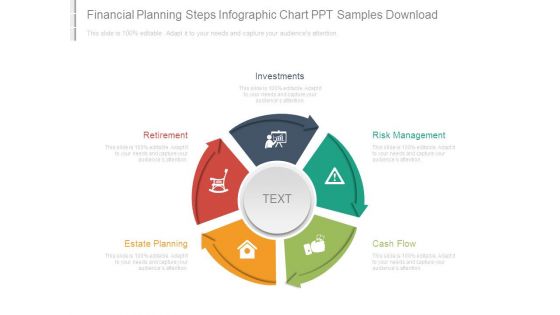
Financial Planning Steps Infographic Chart Ppt Samples Download
This is a financial planning steps infographic chart ppt samples download. This is a five stage process. The stages in this process are investments, retirement, estate planning, risk management, cash flow.
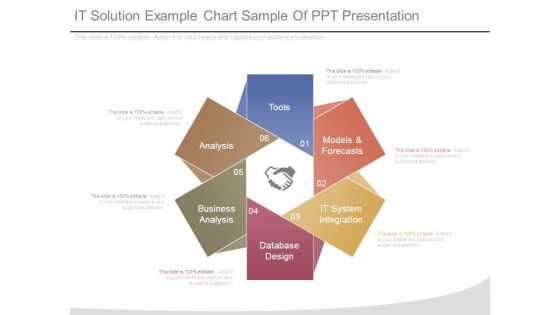
It Solution Example Chart Sample Of Ppt Presentation
This is a it solution example chart sample of ppt presentation. This is a six stage process. The stages in this process are tools, models and forecasts, it system integration, database design, business analysis, analysis.
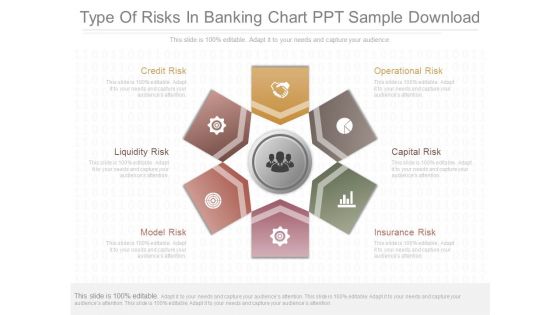
Type Of Risks In Banking Chart Ppt Sample Download
This is a type of risks in banking chart ppt sample download. This is a six stage process. The stages in this process are credit risk, liquidity risk, model risk, operational risk, capital risk, insurance risk.
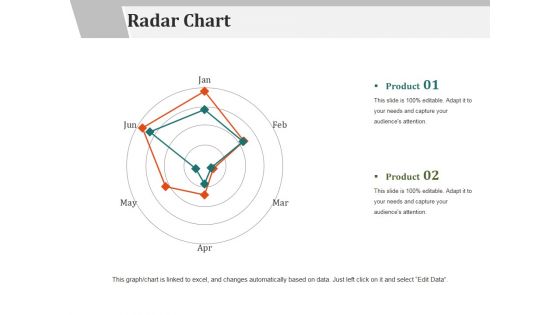
Radar Chart Ppt PowerPoint Presentation Gallery Layout Ideas
This is a radar chart ppt powerpoint presentation gallery layout ideas. This is a two stage process. The stages in this process are radar chart, marketing, management, strategy, planning.
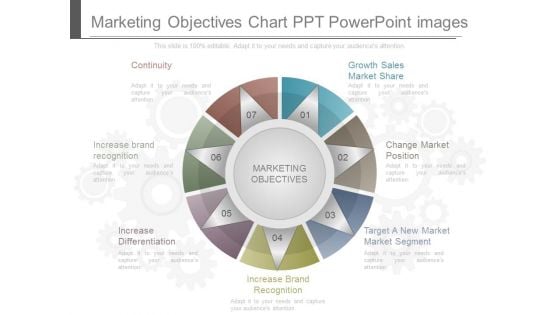
Marketing Objectives Chart Ppt Powerpoint Images
This is a marketing objectives chart ppt powerpoint images. This is a seven stage process. The stages in this process are continuity, growth sales market share, change market position, target a new market market segment, increase brand recognition, increase differentiation, increase brand recognition, marketing objectives.
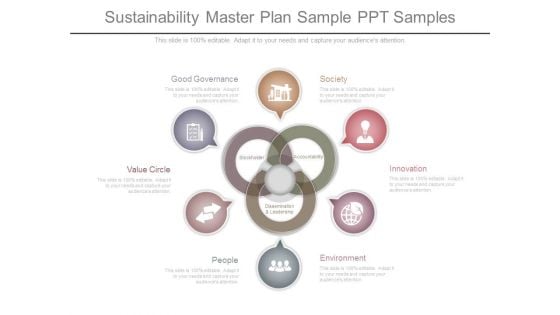
Sustainability Master Plan Sample Ppt Samples
This is a sustainability master plan sample ppt samples. This is a six stage process. The stages in this process are good governance, value circle, people, environment, innovation, society.
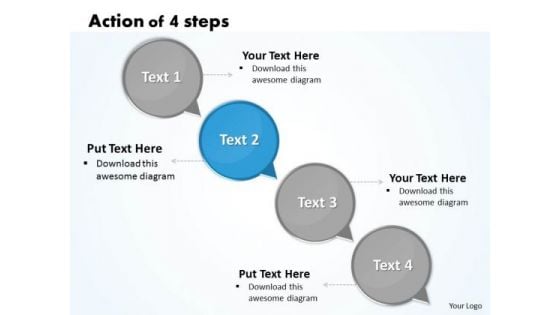
Ppt Action Of 4 PowerPoint Slide Numbers Involved Procedure Templates
PPT action of 4 powerpoint slide numbers involved procedure Templates-Use this circular arrow speech bubbles diagram to show a series of events or timeline information. This circular arrow description diagram make your audience understand, essential elements of your overall strategy of business deal. Create captivating presentations to deliver comparative and weighted arguments. -PPT action of 4 powerpoint slide numbers involved procedure Templates-Add, Aqua, Arrows, Badges, Bar, Blend, Blue, Bright, Bubbles, Buttons, Caution, Circle, Drop, Elements, Glossy, Glowing, Graphic, Heart, Help, Icons, Idea, Illustration, Navigation, Oblong, Plus, Round, Service, Shadow, Shiny, Sign, Speech, Squares Give finishing touches with our Ppt Action Of 4 PowerPoint Slide Numbers Involved Procedure Templates. You will be delighted with the final product.
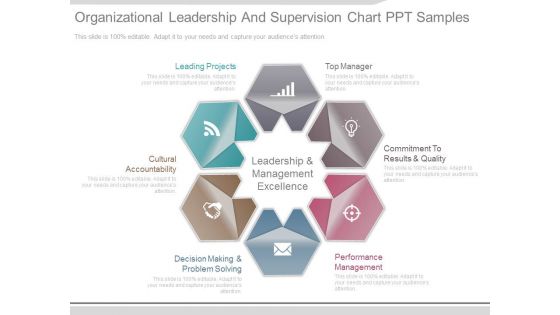
Organizational Leadership And Supervision Chart Ppt Samples
This is a organizational leadership and supervision chart ppt samples. This is a six stage process. The stages in this process are leading projects, top manager, commitment to results and quality, performance management, decision making and problem solving, cultural accountability, leadership and management excellence.
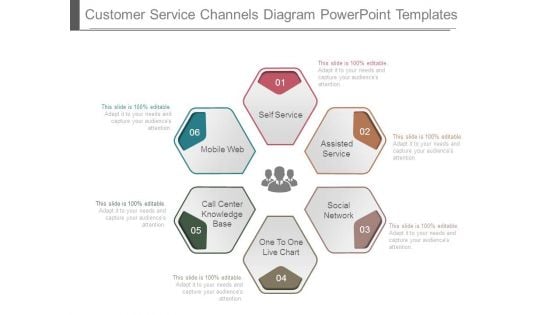
Customer Service Channels Diagram Powerpoint Templates
This is a customer service channels diagram powerpoint templates. This is a six stage process. The stages in this process are mobile web, self service, assisted service, social network, one to one live chart, call center knowledge base.
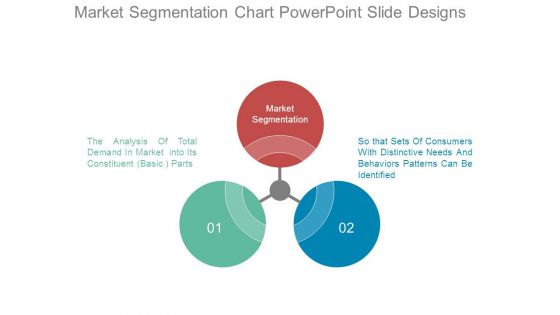
Market Segmentation Chart Powerpoint Slide Designs
This is a market segmentation chart powerpoint slide designs. This is a three stage process. The stages in this process are market segmentation, so that sets of consumers with distinctive needs and behaviors patterns can be identified, the analysis of total demand in market into its constituent basic parts.
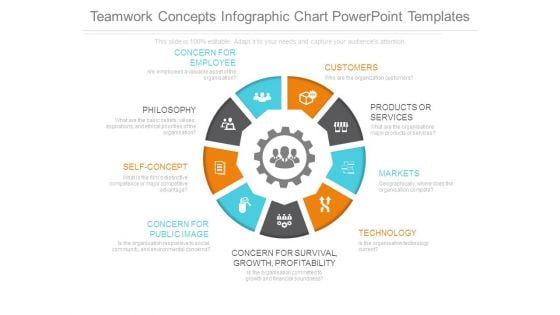
Teamwork Concepts Infographic Chart Powerpoint Templates
This is a teamwork concepts infographic chart powerpoint templates. This is a nine stage process. The stages in this process are concern for survival growth profitability, concern for employee, customers, products or services, markets, technology, concern for public image, self concept, philosophy.
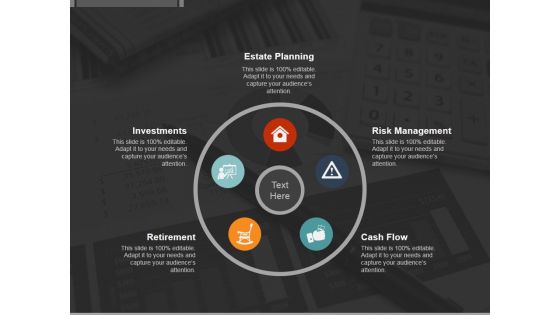
Financial Planning Ppt PowerPoint Presentation Designs Download
This is a financial planning ppt powerpoint presentation designs download. This is a five stage process. The stages in this process are estate planning, risk management, cash flow, retirement, investments.
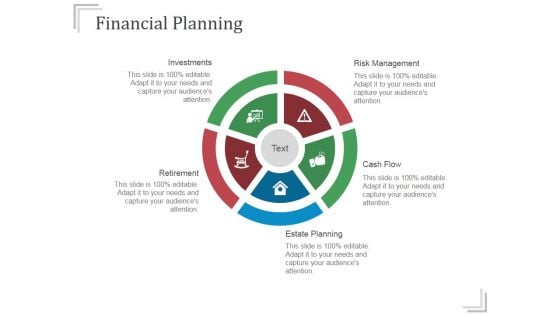
Financial Planning Ppt PowerPoint Presentation Tips
This is a financial planning ppt powerpoint presentation tips. This is a five stage process. The stages in this process are risk management, cash flow, estate planning, retirement, investments .
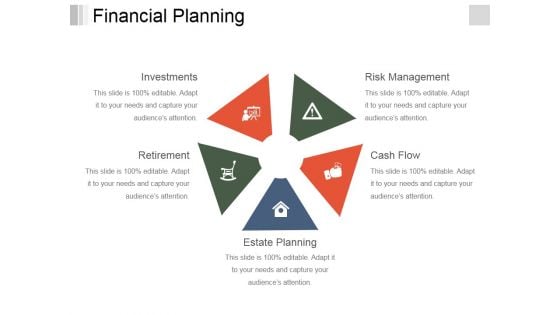
Financial Planning Ppt PowerPoint Presentation Styles Visuals
This is a financial planning ppt powerpoint presentation styles visuals. This is a five stage process. The stages in this process are investments, retirement, estate planning, cash flow, risk management.
Four Staged Interconnected Circles With Icons Powerpoint Templates
Create visually stunning and define your presentations in a unique and inspiring manner using our above template. It contains diagram of circular infographic. Download this slide to display planning for business growth.
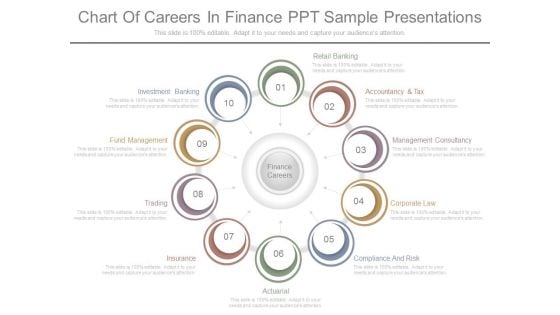
Chart Of Careers In Finance Ppt Sample Presentations
This is a chart of careers in finance ppt sample presentations. This is a ten stage process. The stages in this process are investment banking, fund management, trading, insurance, actuarial, compliance and risk, corporate law, management consultancy, accountancy and tax, retail banking, finance careers.
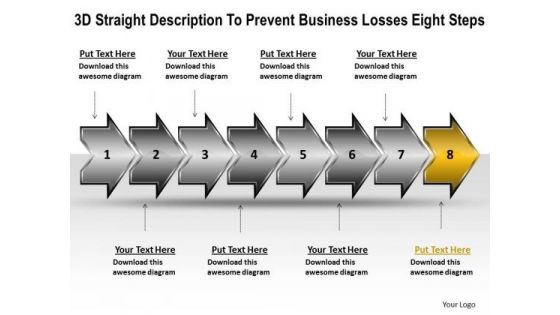
Business PowerPoint Presentation Losses Eight Steps Flow Chart Slides
We present our business powerpoint presentation losses eight steps flow chart Slides.Download our Finance PowerPoint Templates because they represent the proress in our lives. Download our Business PowerPoint Templates because watch the excitement levels rise as they realise their worth. Download our Process and Flows PowerPoint Templates because it demonstrates to your audience how the best and most refined ideas pass through. Present our Arrows PowerPoint Templates because you can Educate your listeners on the means to keep it ticking over. Present our Shapes PowerPoint Templates because this diagram depicts the essence of this chain reaction like sequence of events.Use these PowerPoint slides for presentations relating to 3d, Abstract, Around, Arrows, Business, Center, Circle, Circular, Concept, Connections, Curve, Cycle, Directions, Distribution, Illustration, Management, Middle, Objects, Plan, Process, Recycle, Rounded, Shadows, Space, System. The prominent colors used in the PowerPoint template are Yellow, Gray, Black. People tell us our business powerpoint presentation losses eight steps flow chart Slides provide great value for your money. Be assured of finding the best projection to highlight your words. PowerPoint presentation experts tell us our Circle PowerPoint templates and PPT Slides are Lush. Presenters tell us our business powerpoint presentation losses eight steps flow chart Slides are Nifty. The feedback we get is that our Circle PowerPoint templates and PPT Slides are Multicolored. You can be sure our business powerpoint presentation losses eight steps flow chart Slides are Romantic. Professionals tell us our Center PowerPoint templates and PPT Slides are Elegant. Fulfill aspirations with our Business PowerPoint Presentation Losses Eight Steps Flow Chart Slides. Cater to all your clients fancy demands.
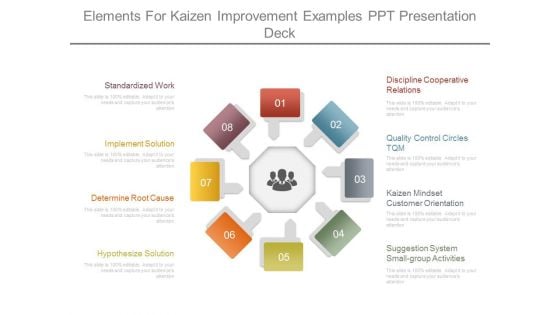
Elements For Kaizen Improvement Examples Ppt Presentation Deck
This is a elements for kaizen improvement examples ppt presentation deck. This is a eight stage process. The stages in this process are standardized work, implement solution, determine root cause, hypothesize solution, discipline cooperative relations, quality control circles tqm, kaizen mindset customer orientation, suggestion system small-group activities.
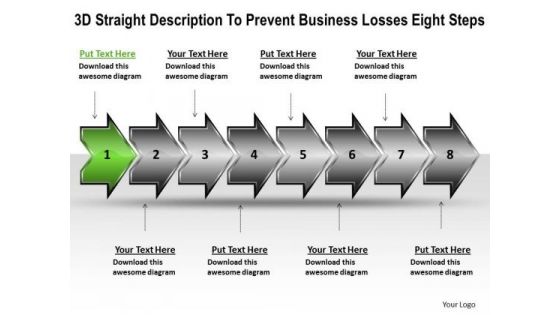
E Business PowerPoint Presentation Losses Eight Steps Technical Flow Chart Slides
We present our e business powerpoint presentation losses eight steps technical flow chart Slides.Present our Finance PowerPoint Templates because you envisage some areas of difficulty in the near future. The overall financial situation could be a source of worry. Present our Business PowerPoint Templates because spell out your advertising plans to increase market share. The feedback has been positive and productive. Download our Process and Flows PowerPoint Templates because you can blaze a brilliant trail from point to point. Download and present our Arrows PowerPoint Templates because one pushes the other till it all comes back full circle. Download and present our Shapes PowerPoint Templates because you have the right arrows in your quiver.Use these PowerPoint slides for presentations relating to 3d, Abstract, Around, Arrows, Business, Center, Circle, Circular, Concept, Connections, Curve, Cycle, Directions, Distribution, Illustration, Management, Middle, Objects, Plan, Process, Recycle, Rounded, Shadows, Space, System. The prominent colors used in the PowerPoint template are Green, Gray, Black. People tell us our e business powerpoint presentation losses eight steps technical flow chart Slides are Handsome. PowerPoint presentation experts tell us our Arrows PowerPoint templates and PPT Slides are designed to make your presentations professional. Presenters tell us our e business powerpoint presentation losses eight steps technical flow chart Slides are Majestic. The feedback we get is that our Circle PowerPoint templates and PPT Slides are One-of-a-kind. You can be sure our e business powerpoint presentation losses eight steps technical flow chart Slides are Excellent. Professionals tell us our Center PowerPoint templates and PPT Slides are designed by a team of presentation professionals. Propose awesome plans with our E Business PowerPoint Presentation Losses Eight Steps Technical Flow Chart Slides. Download without worries with our money back guaranteee.
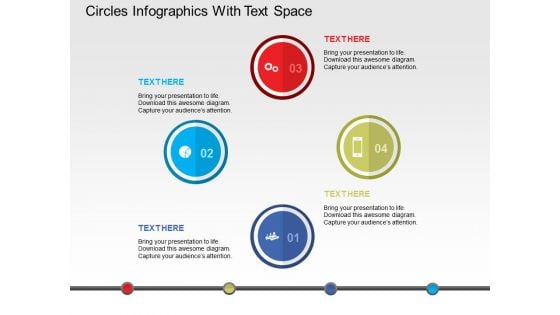
Circles Infographics With Text Space Powerpoint Templates
Circular infographic has been displayed in this business slide. This business diagram helps to exhibit process of target planning. Use this diagram to build an exclusive presentation.
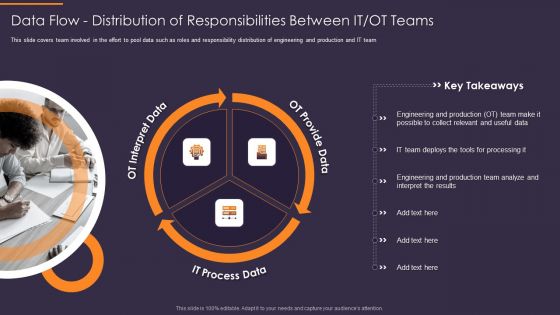
Convergence Strategy Information Data Flow Distribution Of Responsibilities Between It Graphics PDF
This slide covers team involved in the effort to pool data such as roles and responsibility distribution of engineering and production and IT team. Presenting Convergence Strategy Information Data Flow Distribution Of Responsibilities Between It Graphics PDF to provide visual cues and insights. Share and navigate important information on three stages that need your due attention. This template can be used to pitch topics like OT Interpret Data, OT Provide Data, IT Process Data. In addtion, this PPT design contains high resolution images, graphics, etc, that are easily editable and available for immediate download.
Five Wings Around Circle With Icons Powerpoint Templates
This business slide contains diagram of smart phone with apps icons. This diagram is suitable to present concept of mobile communication. Download this diagram for schematic representation of any information. Visual effect of this slide helps in maintaining the flow of the discussion and provides more clarity to the subject.
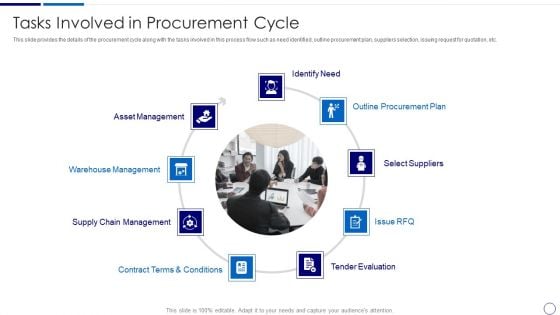
Procurement And SCM Tasks Involved In Procurement Cycle Ppt Inspiration Example PDF
This slide provides the details of the procurement cycle along with the tasks involved in this process flow such as need identified, outline procurement plan, suppliers selection, issuing request for quotation, etc. Presenting procurement and scm tasks involved in procurement cycle ppt inspiration example pdf to provide visual cues and insights. Share and navigate important information on nine stages that need your due attention. This template can be used to pitch topics like identify need, outline procurement plan, select suppliers, tender evaluation, warehouse management, asset management. In addtion, this PPT design contains high resolution images, graphics, etc, that are easily editable and available for immediate download.
Sections Of Circle With Eight Pieces Of Pie Chart Ppt PowerPoint Presentation Icon Display PDF
Persuade your audience using this sections of circle with eight pieces of pie chart ppt powerpoint presentation icon display pdf. This PPT design covers eight stages, thus making it a great tool to use. It also caters to a variety of topics including sections of circle with eight pieces of pie chart. Download this PPT design now to present a convincing pitch that not only emphasizes the topic but also showcases your presentation skills.
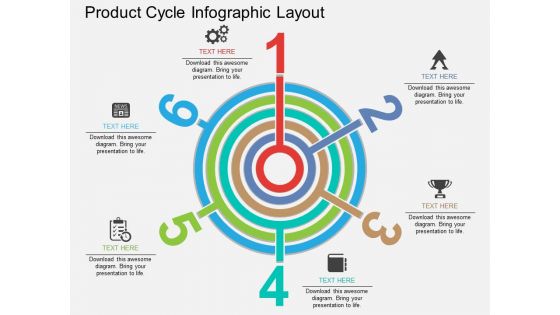
Product Cycle Infographic Layout Powerpoint Template
This business diagram has been designed with circular graphics with six steps. This PowerPoint template may be used to display product cycle steps. Prove the viability of your ideas using this impressive slide.
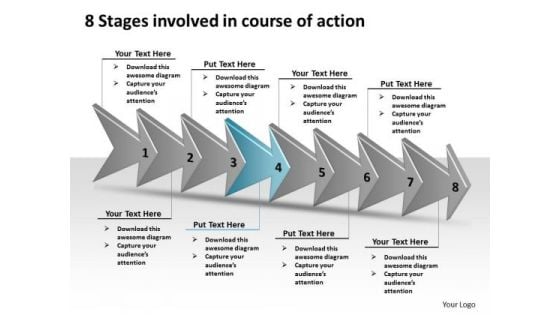
8 Stages Involved Course Of Action Make Flowchart PowerPoint Slides
We present our 8 stages involved course of action make flowchart PowerPoint Slides.Use our Leadership PowerPoint Templates because this diagram can be used to illustrate the logical path or system. Download and present our Shapes PowerPoint Templates because with the help of our Slides you can Illustrate your plans on using the many social media modes available to inform soceity at large of the benefits of your product. Use our Signs PowerPoint Templates because you must Evolve the strategy to take you down the required path with appropriate, efficient and effective marketing along the way. Download our Arrows PowerPoint Templates because we provide the means to project your views. Download and present our Process and Flows PowerPoint Templates because the Venn graphic comprising interlinking circles geometrically demonstate how various functions operating independantly, to a large extent, are essentially interdependant.Use these PowerPoint slides for presentations relating to Designator, blue bottom, circular cobalt banner, clean group badge, clear directional, crimson application icon, down load, download, circle marker, filter grain, front, grunge, grungy, internet page site, left orientation, magenta cursor symbol, monochromatic texture, monochrome pattern, navigation panel, next indicator, noise effect, Arrows sign, push, red pointer pictogram, redo, right, round shape, scattered surface,. The prominent colors used in the PowerPoint template are Blue light, White, Gray. The feedback we get is that our 8 stages involved course of action make flowchart PowerPoint Slides are Pleasant. People tell us our cobalt PowerPoint templates and PPT Slides are Attractive. We assure you our 8 stages involved course of action make flowchart PowerPoint Slides are Upbeat. Presenters tell us our cobalt PowerPoint templates and PPT Slides are One-of-a-kind. We assure you our 8 stages involved course of action make flowchart PowerPoint Slides will make you look like a winner. Use our group PowerPoint templates and PPT Slides are Splendid. Beat mediocrity with our 8 Stages Involved Course Of Action Make Flowchart PowerPoint Slides. You will come out on top.

Concentric Sphere Chart Slide For Comparison Ppt Portfolio Inspiration PDF
Presenting concentric sphere chart slide for comparison ppt portfolio inspiration pdf to dispense important information. This template comprises four stages. It also presents valuable insights into the topics including concentric sphere chart slide for comparison. This is a completely customizable PowerPoint theme that can be put to use immediately. So, download it and address the topic impactfully.
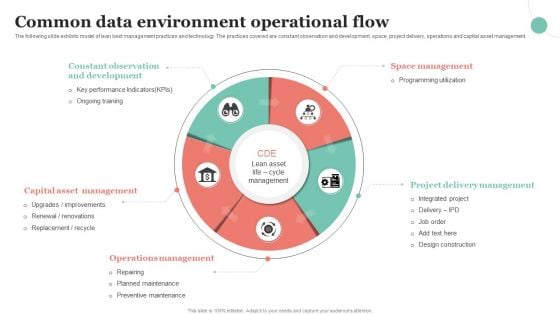
Common Data Environment Operational Flow Ppt Slide PDF
The following slide exhibits model of lean best management practices and technology. The practices covered are constant observation and development, space, project delivery, operations and capital asset management. Persuade your audience using this Common Data Environment Operational Flow Ppt Slide PDF. This PPT design covers five stages, thus making it a great tool to use. It also caters to a variety of topics including Space Management, Project Delivery Management, Operations Management. Download this PPT design now to present a convincing pitch that not only emphasizes the topic but also showcases your presentation skills.
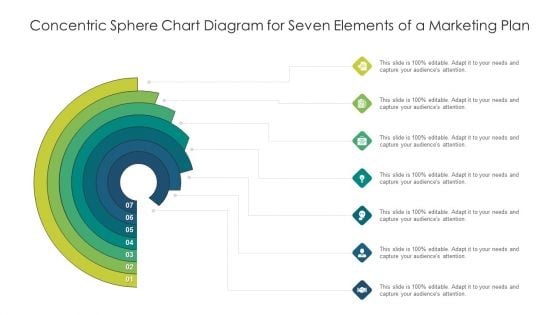
Concentric Sphere Chart Diagram For Seven Elements Of A Marketing Plan Ppt Styles Display PDF
Persuade your audience using this concentric sphere chart diagram for seven elements of a marketing plan ppt styles display pdf. This PPT design covers seven stages, thus making it a great tool to use. It also caters to a variety of topics including concentric sphere chart diagram for seven elements of a marketing plan. Download this PPT design now to present a convincing pitch that not only emphasizes the topic but also showcases your presentation skills.
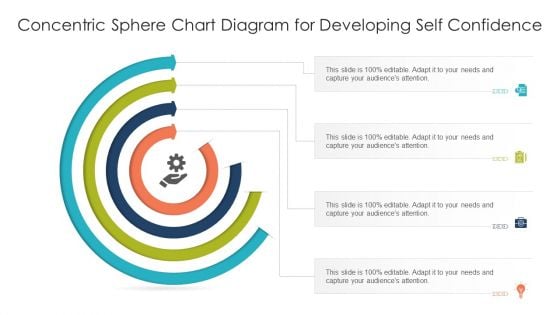
Concentric Sphere Chart Diagram For Developing Self Confidence Ppt Slides PDF
Presenting concentric sphere chart diagram for developing self confidence ppt slides pdf to dispense important information. This template comprises four stages. It also presents valuable insights into the topics including concentric sphere chart diagram for developing self confidence. This is a completely customizable PowerPoint theme that can be put to use immediately. So, download it and address the topic impactfully.
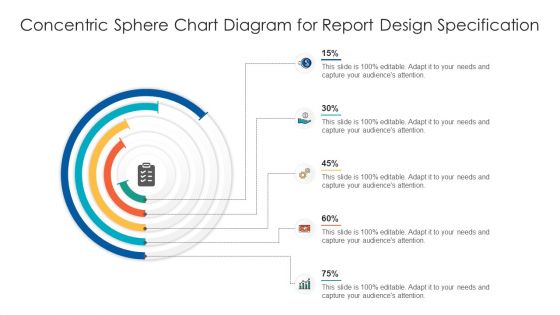
Concentric Sphere Chart Diagram For Report Design Specification Ppt Inspiration PDF
Presenting concentric sphere chart diagram for report design specification ppt inspiration pdf to dispense important information. This template comprises five stages. It also presents valuable insights into the topics including concentric sphere chart diagram for report design specification. This is a completely customizable PowerPoint theme that can be put to use immediately. So, download it and address the topic impactfully.
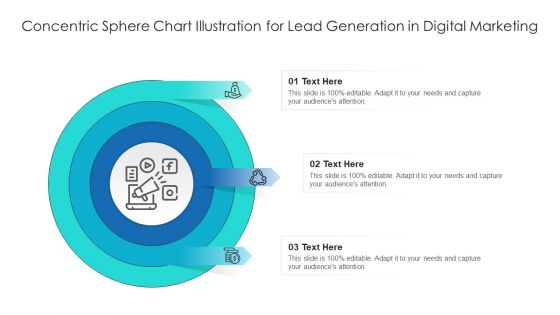
Concentric Sphere Chart Illustration For Lead Generation In Digital Marketing Ppt Outline Files PDF
Persuade your audience using this concentric sphere chart illustration for lead generation in digital marketing ppt outline files pdf. This PPT design covers three stages, thus making it a great tool to use. It also caters to a variety of topics including concentric sphere chart illustration for lead generation in digital marketing. Download this PPT design now to present a convincing pitch that not only emphasizes the topic but also showcases your presentation skills.
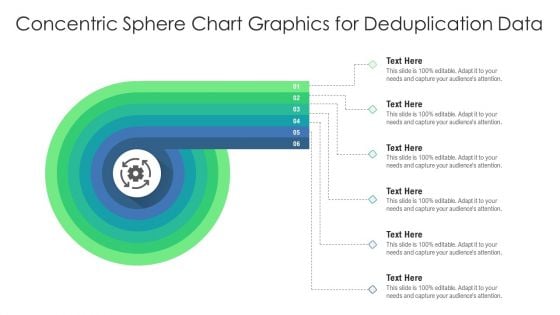
Concentric Sphere Chart Graphics For Deduplication Data Ppt Portfolio Inspiration PDF
Presenting concentric sphere chart graphics for deduplication data ppt portfolio inspiration pdf to dispense important information. This template comprises six stages. It also presents valuable insights into the topics including concentric sphere chart graphics for deduplication data. This is a completely customizable PowerPoint theme that can be put to use immediately. So, download it and address the topic impactfully.
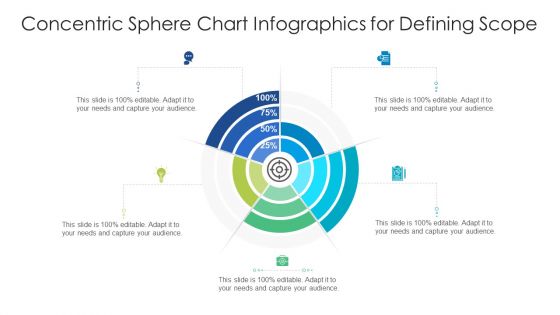
Concentric Sphere Chart Infographics For Defining Scope Ppt Gallery Slide Portrait PDF
Presenting concentric sphere chart infographics for defining scope ppt gallery slide portrait pdf to dispense important information. This template comprises five stages. It also presents valuable insights into the topics including concentric sphere chart infographics for defining scope. This is a completely customizable PowerPoint theme that can be put to use immediately. So, download it and address the topic impactfully.
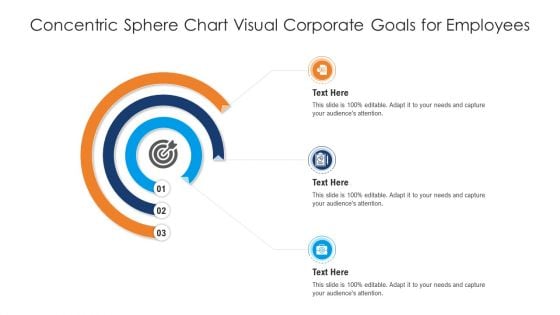
Concentric Sphere Chart Visual Corporate Goals For Employees Ppt Infographic Template Example Topics PDF
Presenting concentric sphere chart visual corporate goals for employees ppt infographic template example topics pdf to dispense important information. This template comprises three stages. It also presents valuable insights into the topics including concentric sphere chart visual corporate goals for employees. This is a completely customizable PowerPoint theme that can be put to use immediately. So, download it and address the topic impactfully.
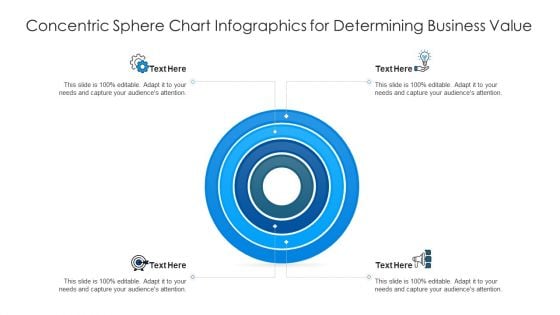
Concentric Sphere Chart Infographics For Determining Business Value Ppt Professional Template PDF
Persuade your audience using this concentric sphere chart infographics for determining business value ppt professional template pdf. This PPT design covers four stages, thus making it a great tool to use. It also caters to a variety of topics including concentric sphere chart infographics for determining business value. Download this PPT design now to present a convincing pitch that not only emphasizes the topic but also showcases your presentation skills.
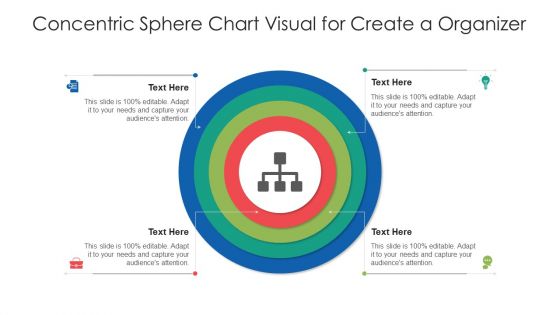
Concentric Sphere Chart Visual For Create A Organizer Ppt Infographic Template Example File
Persuade your audience using this concentric sphere chart visual for create a organizer ppt infographic template example file. This PPT design covers four stages, thus making it a great tool to use. It also caters to a variety of topics including concentric sphere chart visual for create a organizer. Download this PPT design now to present a convincing pitch that not only emphasizes the topic but also showcases your presentation skills.
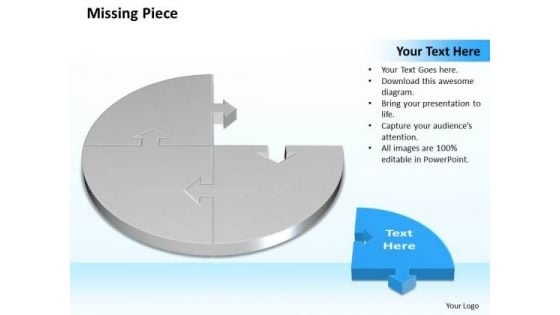
Business Charts PowerPoint Templates 3d Circle Problem Solving Puzzle Piece Showing Missing Diagram
Business Charts PowerPoint templates 3d circle Problem Solving Puzzle Piece showing missing diagram-Use this Business PowerPoint Diagram to explain the missing concept in a process. It shows that if one piece is missing , the puzzle is not complete, in the similar way if in business one With our Business Charts PowerPoint Templates 3d Circle Problem Solving Puzzle Piece Showing Missing Diagram there are no mixed feelings. The aim will be loud and clear to all.
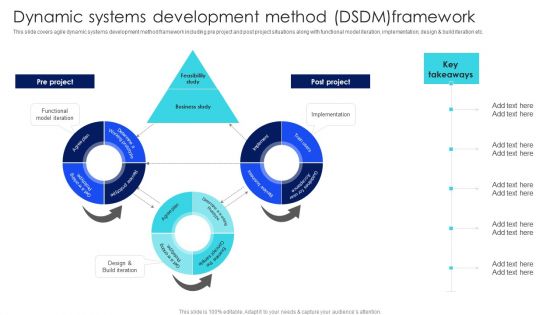
IT Agile Framework Dynamic Systems Development Method DSDM Demonstration PDF
This slide covers agile dynamic systems development method framework including pre project and post project situations along with functional model iteration, implementation, design and build iteration etc. If you are looking for a format to display your unique thoughts, then the professionally designed IT Agile Framework Dynamic Systems Development Method DSDM Demonstration PDF is the one for you. You can use it as a Google Slides template or a PowerPoint template. Incorporate impressive visuals, symbols, images, and other charts. Modify or reorganize the text boxes as you desire. Experiment with shade schemes and font pairings. Alter, share or cooperate with other people on your work. Download IT Agile Framework Dynamic Systems Development Method DSDM Demonstration PDF and find out how to give a successful presentation. Present a perfect display to your team and make your presentation unforgettable.
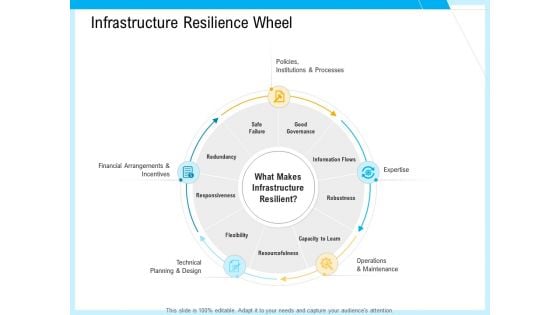
IT And Cloud Facilities Management Infrastructure Resilience Wheel Ppt Gallery Templates PDF
This is a it and cloud facilities management infrastructure resilience wheel ppt gallery templates pdf template with various stages. Focus and dispense information on five stages using this creative set, that comes with editable features. It contains large content boxes to add your information on topics like financial arrangements and incentives, technical, planning and design, responsiveness, flexibility, redundancy, resourcefulness, capacity learn, robustness, information flows. You can also showcase facts, figures, and other relevant content using this PPT layout. Grab it now.
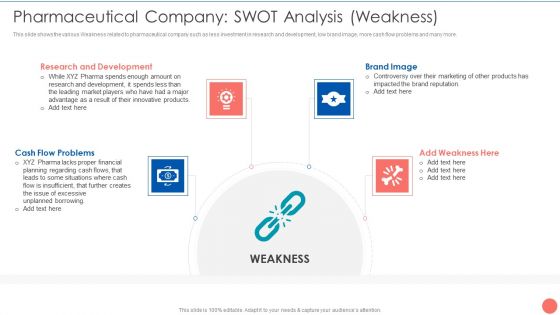
Tactics To Achieve Sustainability Pharmaceutical Company SWOT Analysis Weakness Structure PDF
This slide shows the various Weakness related to pharmaceutical company such as less investment in research and development, low brand image, more cash flow problems and many more. This is a Tactics To Achieve Sustainability Pharmaceutical Company SWOT Analysis Weakness Structure PDF template with various stages. Focus and dispense information on four stages using this creative set, that comes with editable features. It contains large content boxes to add your information on topics like Research And Development, Cash Flow Problems, Brand Image Weakness. You can also showcase facts, figures, and other relevant content using this PPT layout. Grab it now.
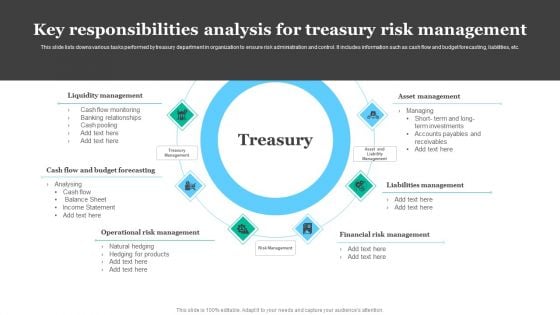
Key Responsibilities Analysis For Treasury Risk Management Professional PDF
This slide lists downs various tasks performed by treasury department in organization to ensure risk administration and control. It includes information such as cash flow and budget forecasting, liabilities, etc. Presenting Key Responsibilities Analysis For Treasury Risk Management Professional PDF to dispense important information. This template comprises six stages. It also presents valuable insights into the topics including Liquidity Management, Operational Risk Management, Liabilities Management, Asset Management. This is a completely customizable PowerPoint theme that can be put to use immediately. So, download it and address the topic impactfully.
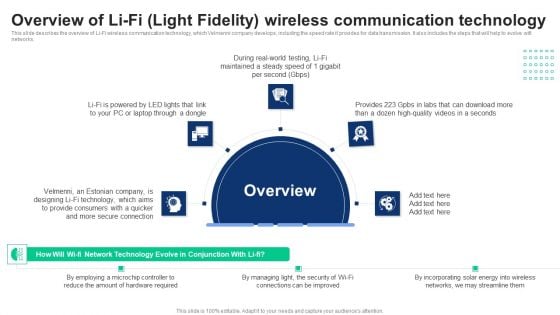
1G To 5G Cellular Overview Of Lifi Light Fidelity Wireless Communication Technology Diagrams PDF
This slide describes the overview of Li-Fi wireless communication technology, which Velmenni company develops, including the speed rate it provides for data transmission. It also includes the steps that will help to evolve wifi networks. If you are looking for a format to display your unique thoughts, then the professionally designed 1G To 5G Cellular Overview Of Lifi Light Fidelity Wireless Communication Technology Diagrams PDF is the one for you. You can use it as a Google Slides template or a PowerPoint template. Incorporate impressive visuals, symbols, images, and other charts. Modify or reorganize the text boxes as you desire. Experiment with shade schemes and font pairings. Alter, share or cooperate with other people on your work. Download 1G To 5G Cellular Overview Of Lifi Light Fidelity Wireless Communication Technology Diagrams PDF and find out how to give a successful presentation. Present a perfect display to your team and make your presentation unforgettable.

Enhancing Companys Project Determine Manager Leadership Mission In Projects Microsoft PDF
This slide provides information regarding the project manager leadership mission in projects who act as information distributor in order to ensure easy workable conditions. Presenting Enhancing Companys Project Determine Manager Leadership Mission In Projects Microsoft PDF to provide visual cues and insights. Share and navigate important information on one stages that need your due attention. This template can be used to pitch topics like Information Flow Outside, Leadership Mission Project. In addtion, this PPT design contains high resolution images, graphics, etc, that are easily editable and available for immediate download.
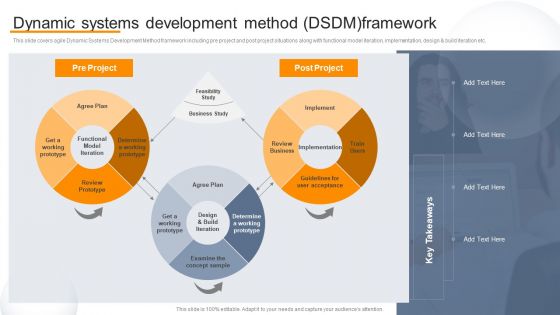
Agile Virtual Project Management Dynamic Systems Development Method DSDM Pictures PDF
This slide covers agile Dynamic Systems Development Method framework including pre project and post project situations along with functional model iteration, implementation, design and build iteration etc. If you are looking for a format to display your unique thoughts, then the professionally designed Agile Virtual Project Management Dynamic Systems Development Method DSDM Pictures PDF is the one for you. You can use it as a Google Slides template or a PowerPoint template. Incorporate impressive visuals, symbols, images, and other charts. Modify or reorganize the text boxes as you desire. Experiment with shade schemes and font pairings. Alter, share or cooperate with other people on your work. Download Agile Virtual Project Management Dynamic Systems Development Method DSDM Pictures PDF and find out how to give a successful presentation. Present a perfect display to your team and make your presentation unforgettable.


 Continue with Email

 Home
Home


