Circular Process Diagram
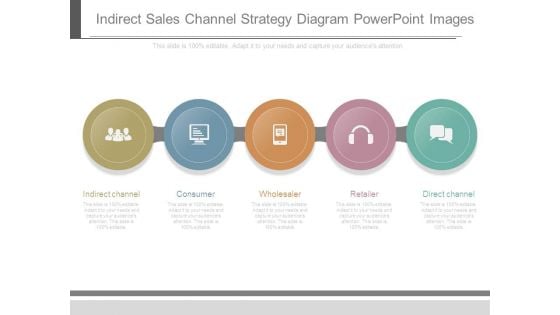
Indirect Sales Channel Strategy Diagram Powerpoint Images
This is a indirect sales channel strategy diagram powerpoint images. This is a five stage process. The stages in this process are indirect channel, consumer, wholesaler, retailer, direct channel.
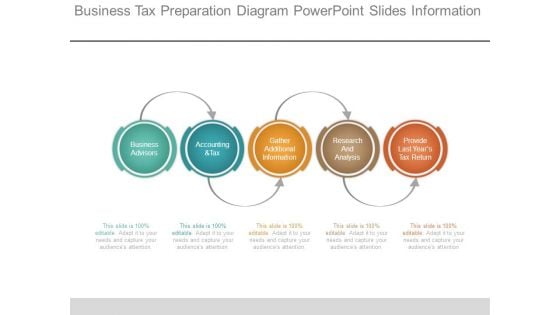
Business Tax Preparation Diagram Powerpoint Slides Information
This is a business tax preparation diagram powerpoint slides information. This is a five stage process. The stages in this process are business advisors, accounting and tax, gather additional information, research and analysis, provide last years tax return.
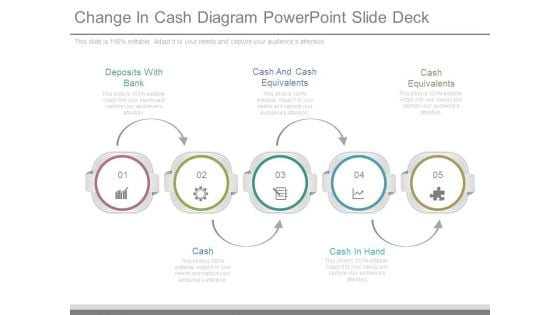
Change In Cash Diagram Powerpoint Slide Deck
This is a change in cash diagram powerpoint slide deck. This is a five stage process. The stages in this process are deposits with bank, cash and cash equivalents, cash equivalents, cash, cash in hand.
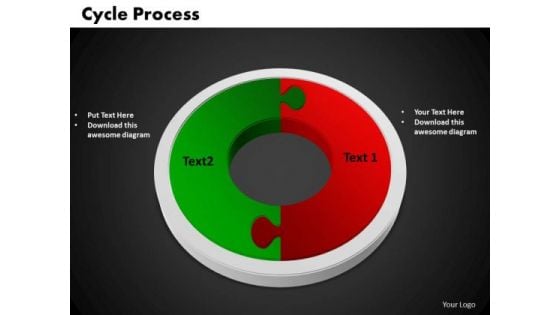
PowerPoint Presentation Cycle Process Chart Ppt Themes
PowerPoint Presentation Cycle Process Chart PPT Themes-Cycle Diagrams are a type of graphics that shows how items are related to one another in a repeating cycle. In a cycle diagram, you can explain the main events in the cycle, how they interact, and how the cycle repeats.-PowerPoint Presentation Cycle Process Chart PPT Themes-Background, Business, Chart, Circle, Circular, Marketing, Management, Flow, Graph, Process, Round, Segmented, Sequence, Wheel, Diagram, Division, Continuity, Template, Web, Illustration Enhance the belief of your congregation. Our PowerPoint Presentation Cycle Process Chart Ppt Themes help add to their devotion.
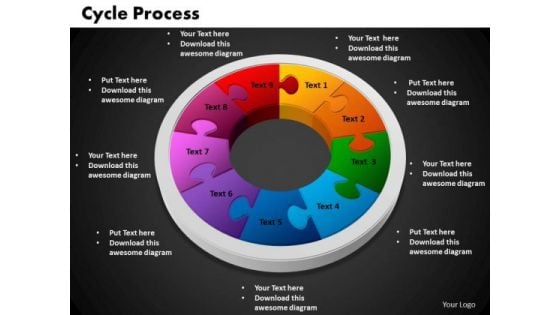
PowerPoint Template Cycle Process Chart Ppt Themes
PowerPoint Template Cycle Process Chart PPT Themes-Cycle Diagrams are a type of graphics that shows how items are related to one another in a repeating cycle. In a cycle diagram, you can explain the main events in the cycle, how they interact, and how the cycle repeats.-PowerPoint Template Cycle Process Chart PPT Themes-Background, Business, Chart, Circle, Circular, Marketing, Management, Flow, Graph, Process, Round, Segmented, Sequence, Wheel, Diagram, Division, Continuity, Template, Web, Illustration Take your game to the highest level with our PowerPoint Template Cycle Process Chart Ppt Themes. Dont waste time struggling with PowerPoint. Let us do it for you.
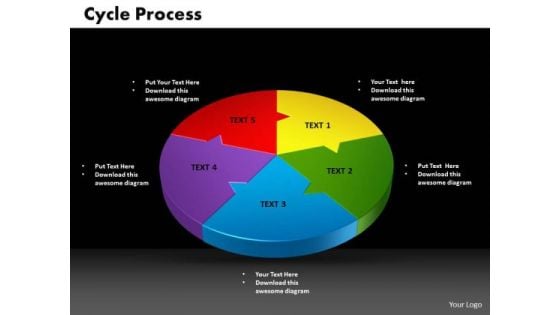
PowerPoint Template Cycle Process Business Ppt Theme
PowerPoint Template Cycle Process Business PPT Theme-Cycle Diagrams are a type of graphics that shows how items are related to one another in a repeating cycle. In a cycle diagram, you can explain the main events in the cycle, how they interact, and how the cycle repeats.-PowerPoint Template Cycle Process Business PPT Theme-Background, Business, Chart, Circle, Circular, Marketing, Management, Flow, Graph, Process, Round, Segmented, Sequence, Wheel, Diagram, Division, Continuity, Template, Web, Illustration Be as fastidious as you want to be. Our PowerPoint Template Cycle Process Business Ppt Theme will be more than a match.
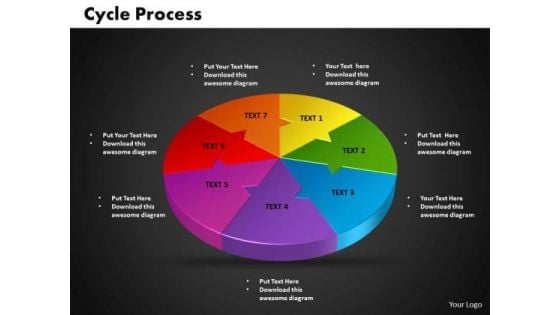
PowerPoint Template Cycle Process Ppt Themes
PowerPoint Template Cycle Process PPT Themes-Cycle Diagrams are a type of graphics that shows how items are related to one another in a repeating cycle. In a cycle diagram, you can explain the main events in the cycle, how they interact, and how the cycle repeats.-PowerPoint Template Cycle Process PPT Themes-Background, Business, Chart, Circle, Circular, Marketing, Management, Flow, Graph, Process, Round, Segmented, Sequence, Wheel, Diagram, Division, Continuity, Template, Web, Illustration Smash the ceiling with our PowerPoint Template Cycle Process Ppt Themes. Blow thru with your thoughts.
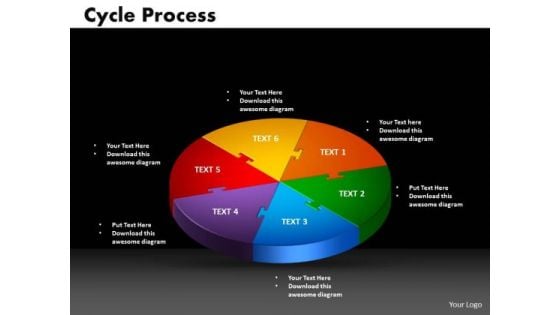
PowerPoint Template Cycle Process Success Ppt Theme
PowerPoint Template Cycle Process Success PPT Theme-Cycle Diagrams are a type of graphics that shows how items are related to one another in a repeating cycle. In a cycle diagram, you can explain the main events in the cycle, how they interact, and how the cycle repeats.-PowerPoint Template Cycle Process Success PPT Theme-Background, Business, Chart, Circle, Circular, Marketing, Management, Flow, Graph, Process, Round, Segmented, Sequence, Wheel, Diagram, Division, Continuity, Template, Web, Illustration Attract attention with our PowerPoint Template Cycle Process Success Ppt Theme. You will come out on top.
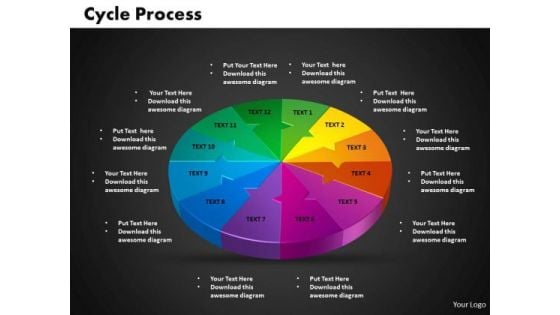
PowerPoint Presentation Cycle Process Chart Ppt Designs
PowerPoint Presentation Cycle Process Chart PPT Designs-Cycle Diagrams are a type of graphics that shows how items are related to one another in a repeating cycle. In a cycle diagram, you can explain the main events in the cycle, how they interact, and how the cycle repeats.-PowerPoint Presentation Cycle Process Chart PPT Designs-Background, Business, Chart, Circle, Circular, Marketing, Management, Flow, Graph, Process, Round, Segmented, Sequence, Wheel, Diagram, Division, Continuity, Template, Web, Illustration Reposition yourself with our PowerPoint Presentation Cycle Process Chart Ppt Designs. Download without worries with our money back guaranteee.
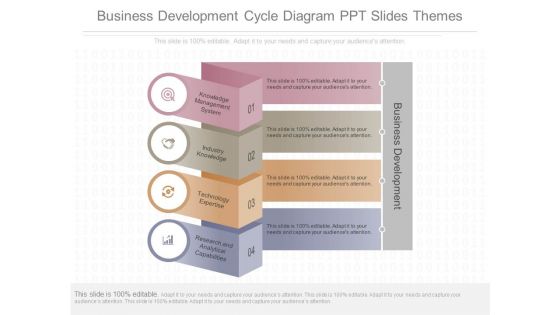
Business Development Cycle Diagram Ppt Slides Themes
This is a business development cycle diagram ppt slides themes. This is a four stage process. The stages in this process are business development, knowledge management system, industry knowledge, technology expertise, research and analytical capabilities.
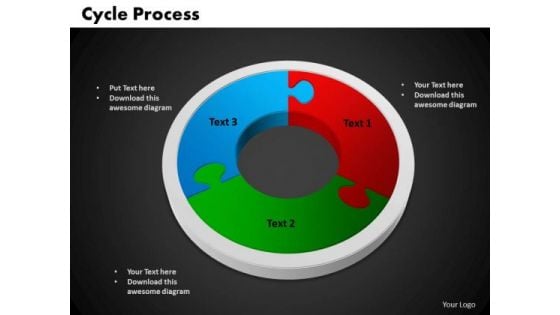
PowerPoint Design Cycle Process Marketing Ppt Slide
PowerPoint Design Cycle Process Marketing PPT Slide-Cycle Diagrams are a type of graphics that shows how items are related to one another in a repeating cycle. In a cycle diagram, you can explain the main events in the cycle, how they interact, and how the cycle repeats.-PowerPoint Design Cycle Process Marketing PPT Slide-Background, Business, Chart, Circle, Circular, Marketing, Management, Flow, Graph, Process, Round, Segmented, Sequence, Wheel, Diagram, Division, Continuity, Template, Web, Illustration It is time to say farewell to failure. Our PowerPoint Design Cycle Process Marketing Ppt Slide assure achievement.
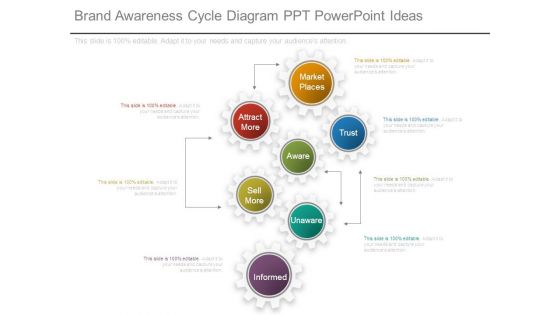
Brand Awareness Cycle Diagram Ppt Powerpoint Ideas
This is a brand awareness cycle diagram ppt powerpoint ideas. This is a seven stage process. The stages in this process are market places, attract more, trust, aware, sell more, unaware, informed.

Sales Improvement Performance Cycle Diagram Powerpoint Show
This is a sales improvement performance cycle diagram powerpoint show. This is a six stage process. The stages in this process are execution enablement, strategy and operations, accountability, motivation, staffing, capability.
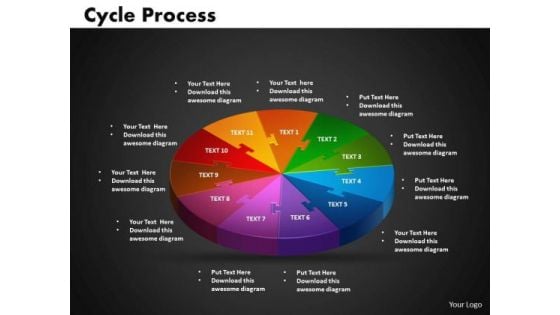
PowerPoint Design Cycle Process Editable Ppt Template
PowerPoint Design Cycle Process Editable PPT Template-Cycle Diagrams are a type of graphics that shows how items are related to one another in a repeating cycle. In a cycle diagram, you can explain the main events in the cycle, how they interact, and how the cycle repeats. -PowerPoint Design Cycle Process Editable PPT Template-Background, Business, Chart, Circle, Circular, Marketing, Management, Flow, Graph, Process, Round, Segmented, Sequence, Wheel, Diagram, Division, Continuity, Template, Web, Illustration Raise the bar with our PowerPoint Design Cycle Process Editable Ppt Template. You will come out on top.

Sales Management Activities Cycle Diagram Ppt Slides
This is a sales management activities cycle diagram ppt slides. This is a six stage process. The stages in this process are market intelligence, planning, selling, communicating, administering, decision making, selling activities.
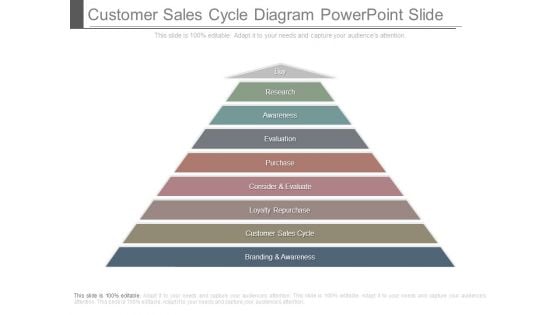
Customer Sales Cycle Diagram Powerpoint Slide
This is a customer sales cycle diagram powerpoint slide. This is a eight stage process. The stages in this process are buy, research, awareness, evaluation, purchase, consider and evaluate, loyalty repurchase, customer sales cycle, branding and awareness.
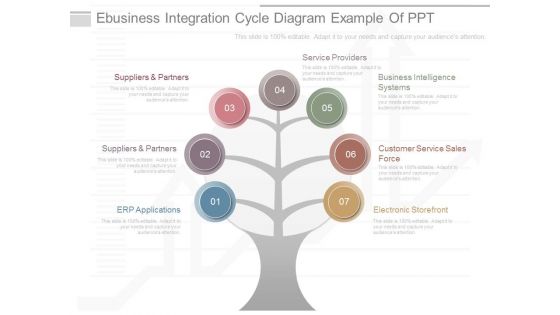
Ebusiness Integration Cycle Diagram Example Of Ppt
This is a ebusiness integration cycle diagram example of ppt. This is a seven stage process. The stages in this process are electronic storefront, customer service sales force, business intelligence systems, service providers, suppliers and partners, erp applications.

Manufacturing Schedule Cycle Diagram Ppt Sample
This is a manufacturing schedule cycle diagram ppt sample. This is a six stage process. The stages in this process are delivery product on time, satisfy customer, improve customer retention, increase sales, drive revenue growth, deliver profit.

Big Data Cycle For Analysis Diagram Slides
This is a big data cycle for analysis diagram slides. This is a five stage process. The stages in this process are massive data, new management needs, new final result, new hard and software, new analysis possibilities.

Annual Financial Planning Cycle Diagram Ppt Summary
This is a annual financial planning cycle diagram ppt summary. This is a six stage process. The stages in this process are annual report, risk management, strategy objectives, budget, strategy invectives, evaluate alternatives.

Performance Cycle Diagram Ppt Powerpoint Ideas
This is a performance cycle diagram ppt powerpoint ideas. This is a five stage process. The stages in this process are repeat if desired, measure performance, establish a baseline, identify bottlenecks, make one change at a time.
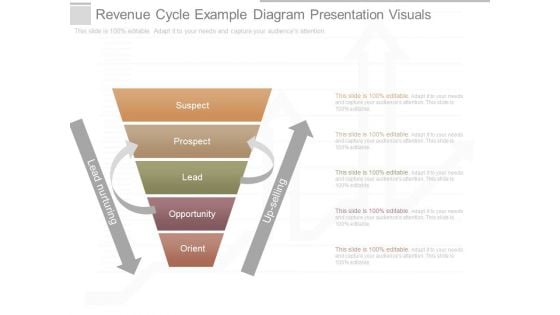
Revenue Cycle Example Diagram Presentation Visuals
This is a revenue cycle example diagram presentation visuals. This is a five stage process. The stages in this process are suspect, prospect, lead, opportunity, orient, up-selling, lead nurturing.
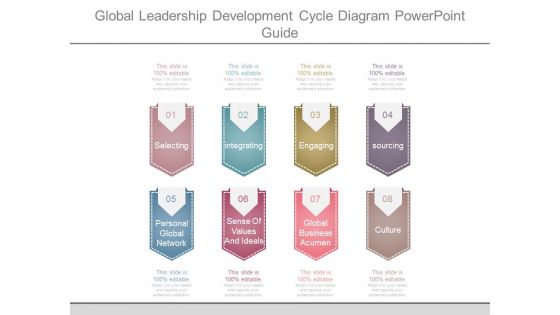
Global Leadership Development Cycle Diagram Powerpoint Guide
This is a global leadership development cycle diagram powerpoint guide. This is a eight stage process. The stages in this process are selecting, integrating, engaging, sourcing, personal global network, sense of values and ideals, global business acumen, culture.
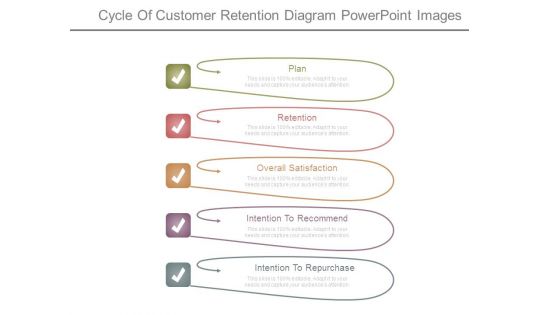
Cycle Of Customer Retention Diagram Powerpoint Images
This is a cycle of customer retention diagram powerpoint images. This is a five stage process. The stages in this process are plan, retention, overall satisfaction, intention to recommend, intention to repurchase.
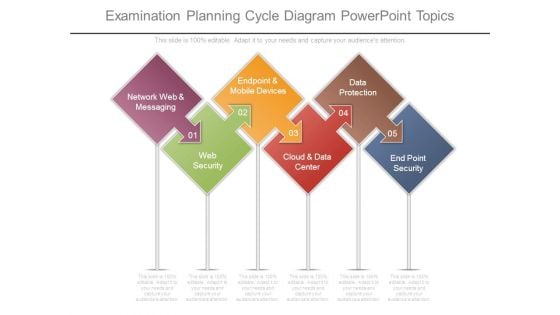
Examination Planning Cycle Diagram Powerpoint Topics
This is a examination planning cycle diagram powerpoint topics. This is a five stage process. The stages in this process are network web and messaging, web security, endpoint and mobile devices, cloud and data center, data protection, end point security.
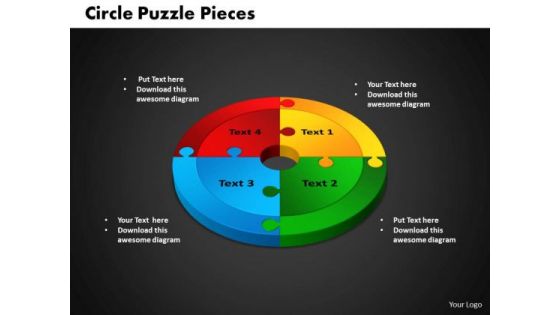
PowerPoint Backgrounds Circle Puzzle Process Ppt Slides
PowerPoint Backgrounds Circle Puzzle Process PPT Slides-The Circle Puzzle diagram is a wonderful graphics to focus on directions of many business processes. Display the direction of the specific activities involved and how to put these in a proper manner for achieving the desired goal.-PowerPoint Backgrounds Circle Puzzle Process PPT Slides-Cycle, Design, Diagram, Element, Graph, Business, Chart, Circular, Connect, Connection, Puzzle, Round, Solving, Step, Together, Putting, Mystery, Linking, Infographic, Icon, Spread your ideas far and wide. Our PowerPoint Backgrounds Circle Puzzle Process Ppt Slides are dependable carriers.
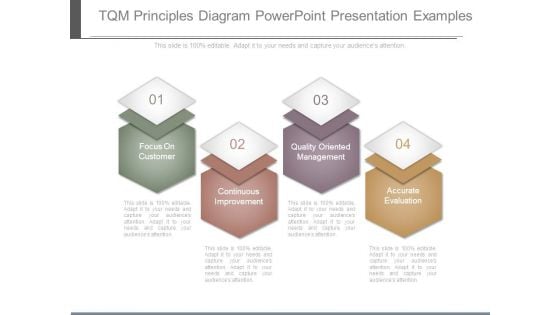
Tqm Principles Diagram Powerpoint Presentation Examples
This is a tqm principles diagram powerpoint presentation examples. This is a four stage process. The stages in this process are focus on customer, continuous improvement, quality oriented management, accurate evaluation.
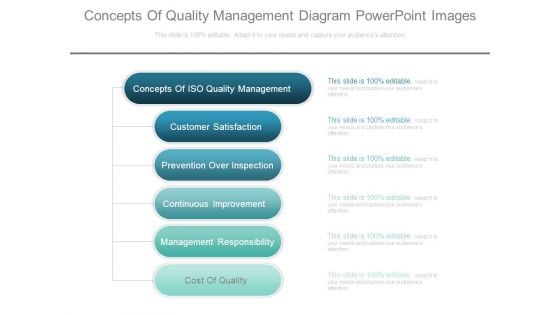
Concepts Of Quality Management Diagram Powerpoint Images
This is a concepts of quality management diagram powerpoint images. This is a six stage process. The stages in this process are concepts of iso quality management, customer satisfaction, prevention over inspection, continuous improvement, management responsibility, cost of quality.
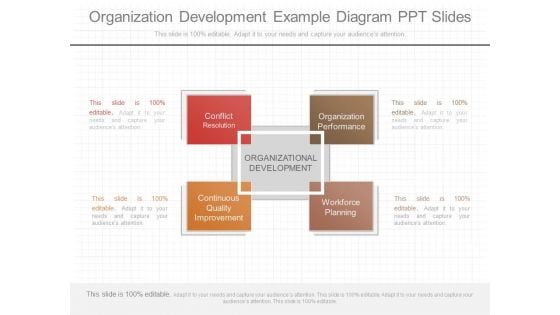
Organization Development Example Diagram Ppt Slides
This is a organization development example diagram ppt slides. This is a four stage process. The stages in this process are conflict resolution, organization performance, organizational development, continuous quality improvement, workforce planning.
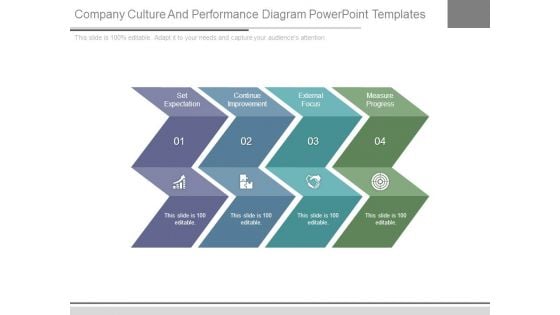
Company Culture And Performance Diagram Powerpoint Templates
This is a Company Culture And Performance Diagram Powerpoint Templates. This is a four stage process. The stages in this process are set expectation, continue improvement, external focus, measure progress.
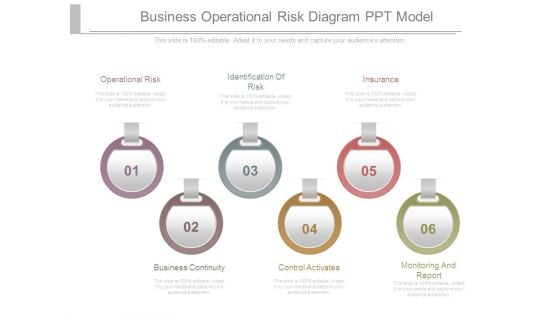
Business Operational Risk Diagram Ppt Model
This is a business operational risk diagram ppt model. This is a six stage process. The stages in this process are operational risk, identification of risk, insurance, business continuity, control activates, monitoring and report.
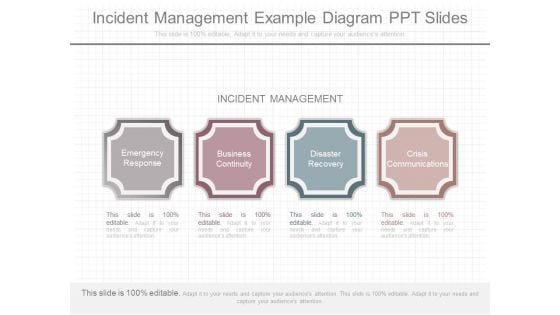
Incident Management Example Diagram Ppt Slides
This is a incident management example diagram ppt slides. This is a four stage process. The stages in this process are emergency response, business continuity, disaster recovery, crisis communications, incident management.
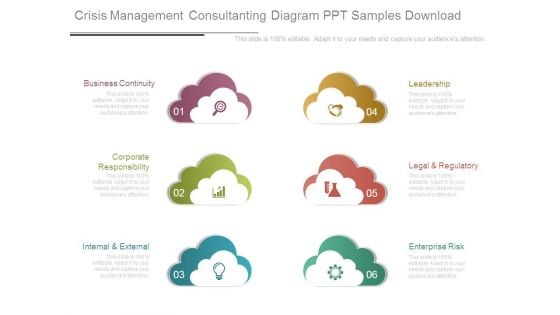
Crisis Management Consultanting Diagram Ppt Samples Download
This is a crisis management consultanting diagram ppt samples download. This is a six stage process. The stages in this process are business continuity, corporate responsibility, internal and external, leadership, legal and regulatory, enterprise risk.
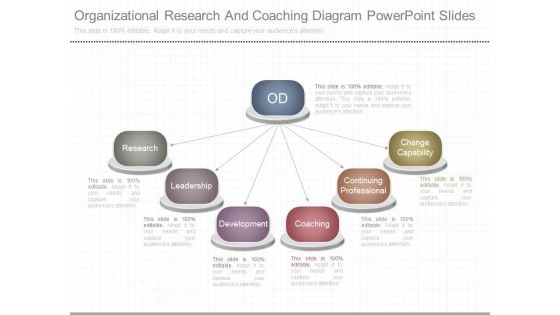
Organizational Research And Coaching Diagram Powerpoint Slides
This is a organizational research and coaching diagram powerpoint slides. This is a six stage process. The stages in this process are research, leadership, development, coaching, continuing professional, change capability, od.
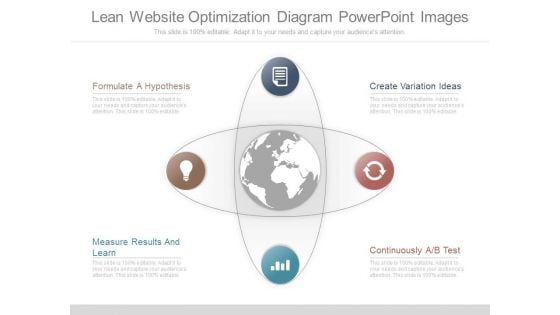
Lean Website Optimization Diagram Powerpoint Images
This is a lean website optimization diagram powerpoint images. This is a four stage process. The stages in this process are formulate a hypothesis, measure results and learn, continuously a b test create variation ideas.
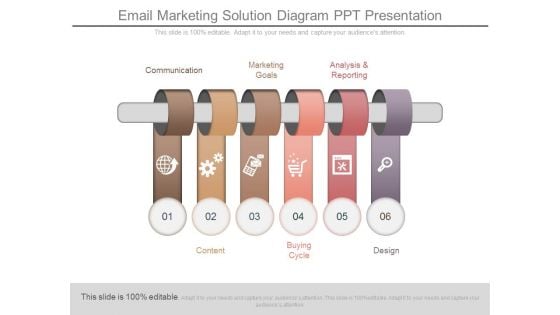
Email Marketing Solution Diagram Ppt Presentation
This is a email marketing solution diagram ppt presentation. This is a six stage process. The stages in this process are communication, marketing, goals, analysis and reporting, content, buying cycle, design.
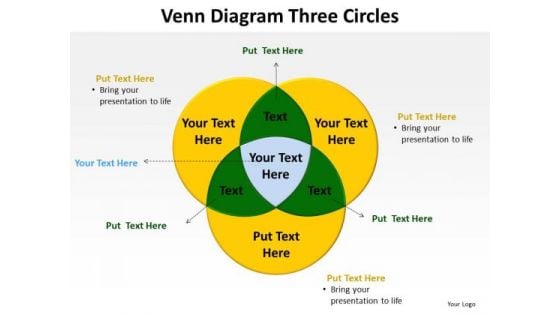
PowerPoint Backgrounds Chart Venn Diagram Ppt Design
PowerPoint Backgrounds Chart Venn Diagram PPT Design-The Venn graphic comprising interlinking circles geometrically demonstrate how various functions operating independently, to a large extent, are essentially interdependent. Amplify on this basic corporate concept and forefront the benefits of overlapping processes to arrive at common goals.-Background, Black, Blue, Business, Chart, Circle, Diagram, Drop, Financial, Green, Icon, Isolated, Overlapping, Process, Red, Round, Shadow, Shape, Three, Transparency, Vector, Venn, White Brighten up the day with our PowerPoint Backgrounds Chart Venn Diagram Ppt Design. Dispal any darkness around.
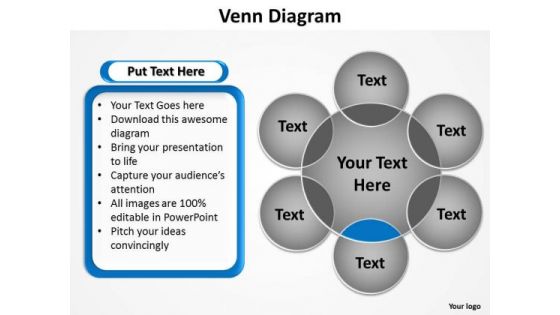
PowerPoint Backgrounds Strategy Venn Diagram Ppt Template
PowerPoint Backgrounds Strategy Venn Diagram PPT Template-The Venn graphic comprising interlinking circles geometrically demonstrate how various functions operating independently, to a large extent, are essentially interdependent. Amplify on this basic corporate concept and forefront the benefits of overlapping processes to arrive at common goals.-Background, Black, Blue, Business, Chart, Circle, Diagram, Drop, Financial, Green, Icon, Isolated, Overlapping, Process, Red, Round, Shadow, Shape, Three, Transparency, Vector, Venn, White Our PowerPoint Backgrounds Strategy Venn Diagram Ppt Template make great allies. They uphold your faith in them.
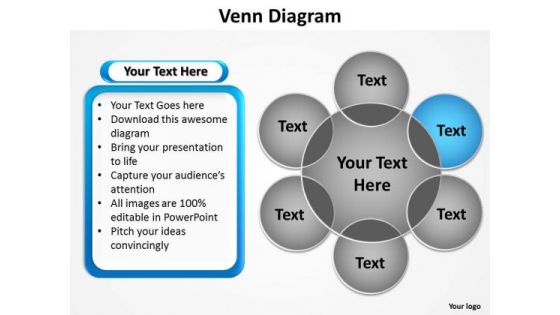
PowerPoint Layouts Company Venn Diagram Ppt Design
PowerPoint Layouts Company Venn Diagram PPT Design-The Venn graphic comprising interlinking circles geometrically demonstrate how various functions operating independently, to a large extent, are essentially interdependent. Amplify on this basic corporate concept and forefront the benefits of overlapping processes to arrive at common goals.-Background, Black, Blue, Business, Chart, Circle, Diagram, Drop, Financial, Green, Icon, Isolated, Overlapping, Process, Red, Round, Shadow, Shape, Three, Transparency, Vector, Venn, White Our PowerPoint Layouts Company Venn Diagram Ppt Design aredelightfully crafted. Designed to charm the biggest disbelievers.
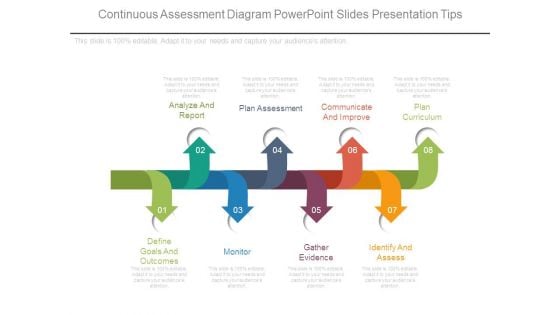
Continuous Assessment Diagram Powerpoint Slides Presentation Tips
This is a continuous assessment diagram powerpoint slides presentation tips. This is a eight stage process. The stages in this process are define goals and outcomes, analyze and report, monitor, plan assessment, gather evidence, communicate and improve, identify and assess, plan curriculum.
Business Cycle Diagram Chess Board Strategic Management
Document The Process On Our Business Cycle Diagram Chess Board Strategic Management Powerpoint Templates. Make A Record Of Every Detail. Satiate Desires With Our Business Cycle Diagram Chess Board Strategic Management Powerpoint Templates. Give Them All They Want And More.

Three Level Business Continuity Diagram Ppt Slides
This is a three level business continuity diagram ppt slides. This is a three stage process. The stages in this process are business continuity planning, security management, disaster recovery, technology, roles, testing, risk management, data assessment, coordination, communicating plan, policy, technology, services, procedures, incident response.
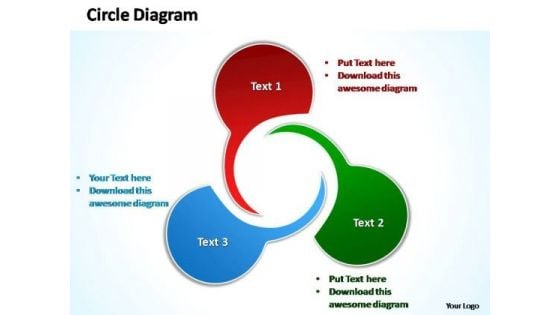
PowerPoint Templates Business Circle Diagram Ppt Theme
PowerPoint Templates Business Circle Diagram PPT Theme-The Circle of Life - a concept emmbedded in our minds and hence easy to comprehend. Life and Business is made up of processes comprising stages that flow from one to another. An excellent graphic to attract the attention of and understanding by your audience to improve earnings.-PowerPoint Templates Business Circle Diagram PPT Theme Define growth with our PowerPoint Templates Business Circle Diagram Ppt Theme. Download without worries with our money back guaranteee.
Activity Based Costing Ppt Diagram Ppt Icon
This is a activity based costing ppt diagram ppt icon. This is a eight stage process. The stages in this process are expenses by department, costs of activities by department, identify activities and activity pools, prepare reports, resource drivers, activity drivers, assign costs to cost objects, costs object costs.
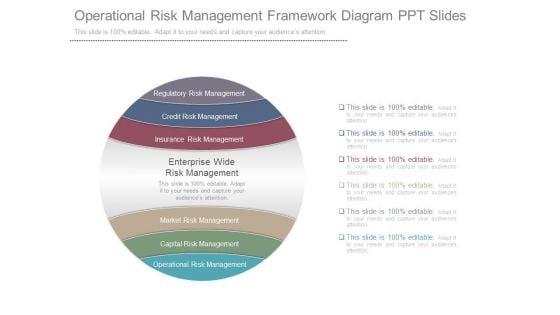
Operational Risk Management Framework Diagram Ppt Slides
This is a operational risk management framework diagram ppt slides. This is a six stage process. The stages in this process are regulatory risk management, credit risk management, insurance risk management, enterprise wide risk management, market risk management, capital risk management, operational risk management.
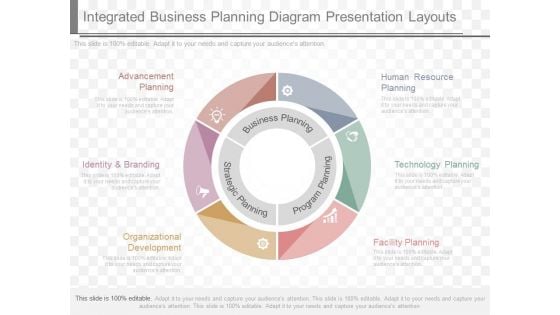
Integrated Business Planning Diagram Presentation Layouts
This is a integrated business planning diagram presentation layouts. This is a six stage process. The stages in this process are business planning, strategic planning, program planning, advancement planning, identity and branding, organizational development, human resource planning, technology planning, facility planning.
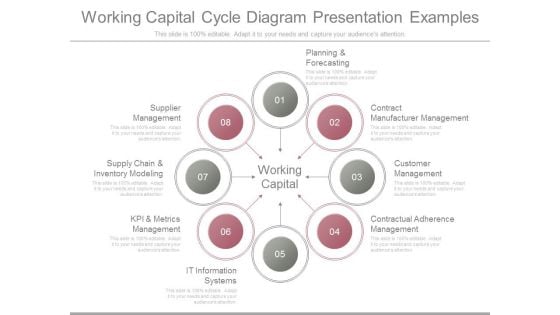
Working Capital Cycle Diagram Presentation Examples
This is a working capital cycle diagram presentation examples. This is a eight stage process. The stages in this process are planning and forecasting, contract manufacturer management, customer management, contractual adherence management, it information systems, kpi and metrics management, supply chain and inventory modeling, supplier management.
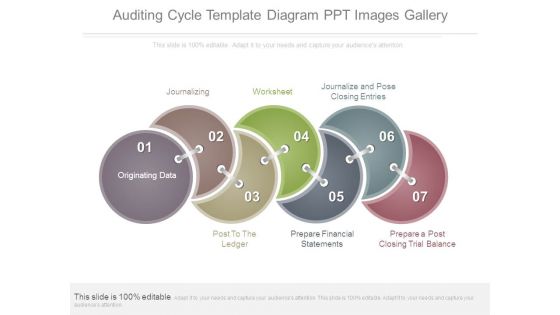
Auditing Cycle Template Diagram Ppt Images Gallery
This is a auditing cycle template diagram ppt images gallery. This is a seven stage process. The stages in this process are journalizing, worksheet, journalize and pose closing entries, post to the ledger, prepare financial statements, prepare a post closing trial balance, originating data.
Product Portfolio Categories Diagram Powerpoint Layout
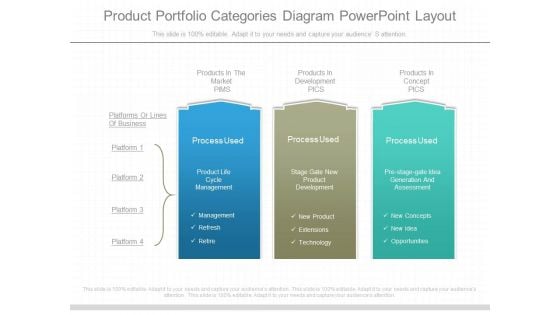
This is a product portfolio categories diagram powerpoint layout. This is a three stage process. The stages in this process are platforms or lines of business, products in the market pims, products in development pics, products in concept pics, process used, product life cycle management, management, refresh, retire, stage gate new product development, new product, extensions, technology, pre stage gate idea generation and assessment, new concepts, new idea, opportunities.
PowerPoint Backgrounds Marketing Venn Diagram Ppt Slide
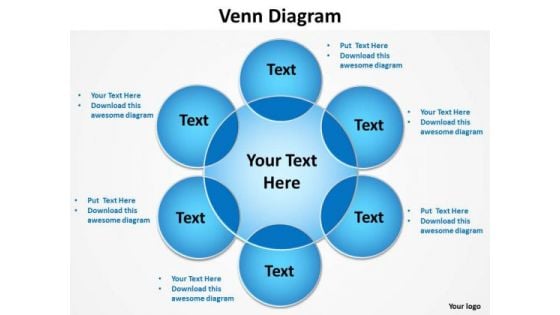
PowerPoint Backgrounds Marketing Venn Diagram PPT Slide-The Venn graphic comprising interlinking circles geometrically demonstrate how various functions operating independently, to a large extent, are essentially interdependent. Amplify on this basic corporate concept and forefront the benefits of overlapping processes to arrive at common goals.-Background, Black, Blue, Business, Chart, Circle, Diagram, Drop, Financial, Green, Icon, Isolated, Overlapping, Process, Red, Round, Shadow, Shape, Three, Transparency, Vector, Venn, White Our PowerPoint Backgrounds Marketing Venn Diagram Ppt Slide will generate and maintain excitement in your audience. They will create the impression you want to imprint on your audience.

PowerPoint Design Success Venn Diagram Ppt Slides
PowerPoint Design Success Venn Diagram PPT Slides-The Venn graphic comprising interlinking circles geometrically demonstrate how various functions operating independently, to a large extent, are essentially interdependent. Amplify on this basic corporate concept and forefront the benefits of overlapping processes to arrive at common goals.-Background, Black, Blue, Business, Chart, Circle, Diagram, Drop, Financial, Green, Icon, Isolated, Overlapping, Process, Red, Round, Shadow, Shape, Three, Transparency, Vector, Venn, White Exult in the happiness of your performance. Convey your emotions through our PowerPoint Design Success Venn Diagram Ppt Slides.
PowerPoint Templates Sales Venn Diagram Ppt Backgrounds
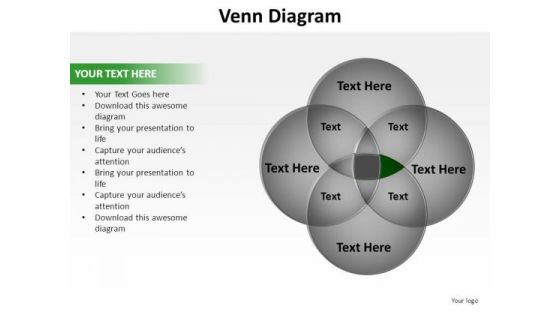
PowerPoint Templates Sales Venn Diagram PPT Backgrounds-The Venn graphic comprising interlinking circles geometrically demonstrate how various functions operating independently, to a large extent, are essentially interdependent. Amplify on this basic corporate concept and forefront the benefits of overlapping processes to arrive at common goals. with our PowerPoint Templates Sales Venn Diagram Ppt Backgrounds. Dont pass up this opportunity to shine.
PowerPoint Slide Company Venn Diagram Ppt Template
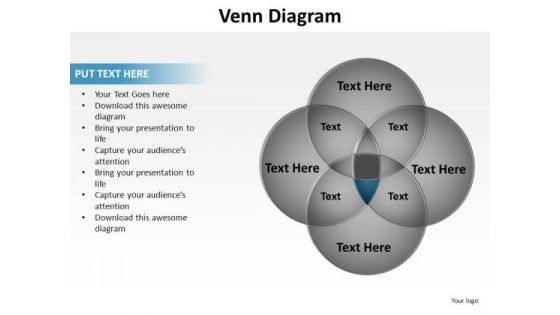
PowerPoint Slide Company Venn Diagram PPT Template-The Venn graphic comprising interlinking circles geometrically demonstrate how various functions operating independently, to a large extent, are essentially interdependent. Amplify on this basic corporate concept and forefront the benefits of overlapping processes to arrive at common goals. Give due attention to key features. Filter out the unnecessary with our PowerPoint Slide Company Venn Diagram Ppt Template.
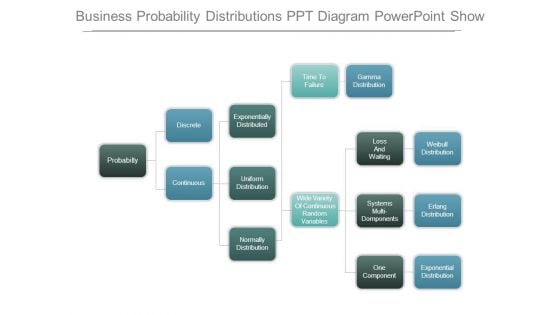
Business Probability Distributions Ppt Diagram Powerpoint Show
This is a business probability distributions ppt diagram powerpoint show. This is a six stage process. The stages in this process are probabilty, discrete, continuous, exponentially distributed, uniform distribution, normally distribution, time to failure, wide variety of continuous random variables, gamma distribution, loss and waiting, systems multi domponents, one component, weibull distribution, erlang distribution, exponential distribution.
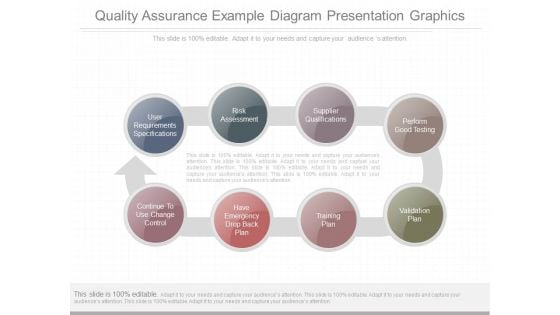
Quality Assurance Example Diagram Presentation Graphics
This is a quality assurance example diagram presentation graphics. This is a eight stage process. The stages in this process are user requirements specifications, risk assessment, supplier qualifications, perform good testing, continue to use change control, have emergency drop back plan, training plan, validation plan.
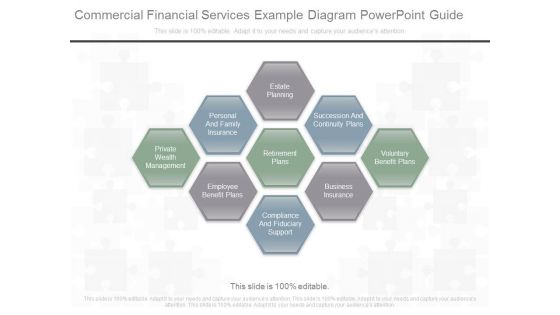
Commercial Financial Services Example Diagram Powerpoint Guide
This is a commercial financial services example diagram powerpoint guide. This is a nine stage process. The stages in this process are private wealth management, personal and family insurance, estate planning, employee benefit plans, retirement plans, succession and continuity plans, compliance and fiduciary support, business insurance, voluntary benefit plans.
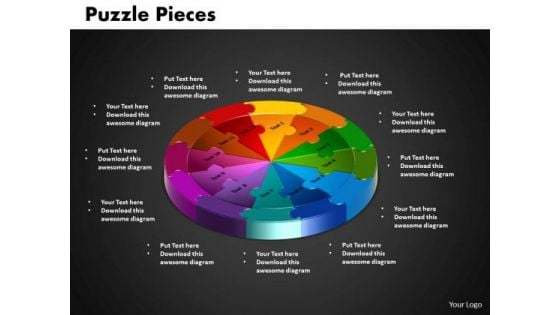
PowerPoint Theme Circle Puzzle Diagram Ppt Designs
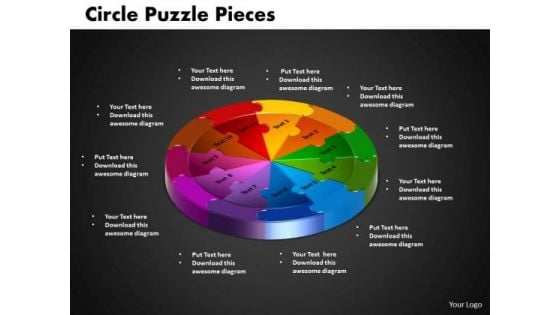
PowerPoint Theme Circle Puzzle Diagram PPT Designs-It is all there in bits and pieces. Individual components well researched and understood in their place.Use this template to illustrate your method, piece by piece, and interlock the whole process in the minds of your audience.-PowerPoint Theme Circle Puzzle Diagram PPT Designs-Cycle, Design, Diagram, Element, Graph, Business, Chart, Circular, Connect, Connection, Puzzle, Round, Solving, Step, Together, Putting, Mystery, Linking, Infographic, Icon, Admit them into your world of brilliance. Our PowerPoint Theme Circle Puzzle Diagram Ppt Designs will direct them along.
PowerPoint Theme Circle Puzzle Diagram Ppt Presentation
PowerPoint Theme Circle Puzzle Diagram PPT Presentation-It is all there in bits and pieces. Individual components well researched and understood in their place.Use this template to illustrate your method, piece by piece, and interlock the whole process in the minds of your audience.-PowerPoint Theme Circle Puzzle Diagram PPT Presentation-Cycle, Design, Diagram, Element, Graph, Business, Chart, Circular, Connect, Connection, Puzzle, Round, Solving, Step, Together, Putting, Mystery, Linking, Infographic, Icon, Your ideas deserve the best accessories. Our PowerPoint Theme Circle Puzzle Diagram Ppt Presentation are a shining example.
PowerPoint Backgrounds Diagram Jigsaw Ppt Design
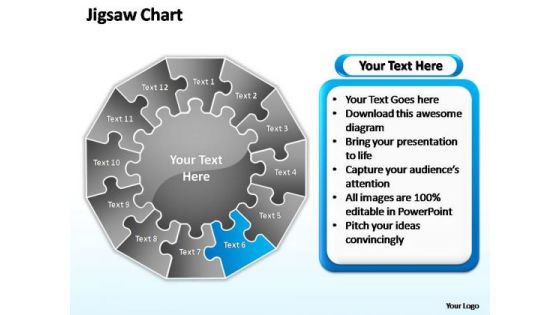
PowerPoint Backgrounds Diagram Jigsaw PPT Design-Puzzles PowerPoint templates being the perennial educational tool. Emphasize the process of your business/corporate growth. Highlight your ideas broad- based on strong fundamentals and illustrate how they step by step achieve the set growth factor. Dont miss a trick. Be in charge with our PowerPoint Backgrounds Diagram Jigsaw Ppt Design. You will be at the top of your game.
AI Deployment In IT Process Artificial Intelligence Model In Operations Diagrams PDF
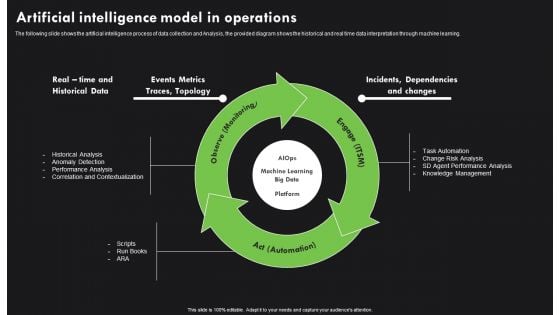
The following slide shows the artificial intelligence process of data collection and Analysis, the provided diagram shows the historical and real time data interpretation through machine learning. Coming up with a presentation necessitates that the majority of the effort goes into the content and the message you intend to convey. The visuals of a PowerPoint presentation can only be effective if it supplements and supports the story that is being told. Keeping this in mind our experts created AI Deployment In IT Process Artificial Intelligence Model In Operations Diagrams PDF to reduce the time that goes into designing the presentation. This way, you can concentrate on the message while our designers take care of providing you with the right template for the situation.


 Continue with Email

 Home
Home


