City

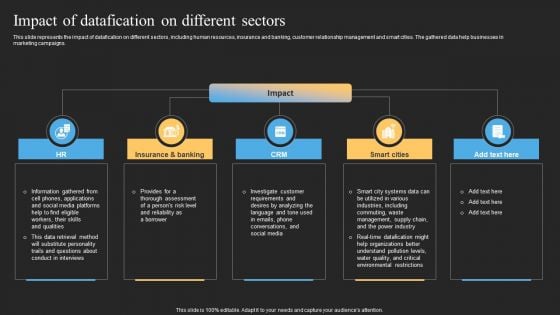
Datafy Impact Of Datafication On Different Sectors Slides PDF
This slide represents the impact of datafication on different sectors, including human resources, insurance and banking, customer relationship management and smart cities. The gathered data help businesses in marketing campaigns. If you are looking for a format to display your unique thoughts, then the professionally designed Datafy Impact Of Datafication On Different Sectors Slides PDF is the one for you. You can use it as a Google Slides template or a PowerPoint template. Incorporate impressive visuals, symbols, images, and other charts. Modify or reorganize the text boxes as you desire. Experiment with shade schemes and font pairings. Alter, share or cooperate with other people on your work. Download Datafy Impact Of Datafication On Different Sectors Slides PDF and find out how to give a successful presentation. Present a perfect display to your team and make your presentation unforgettable.
Comprehensive Guide For Storytelling Promotion Brand Podcast Performance Tracking Dashboards Clipart PDF
This slide showcases dashboard used to track the performance of podcast produced by brands as part of storytelling marketing campaign. It tracks listeners, number of plays, new followers, time listened, top performing episode and top cities. Get a simple yet stunning designed Comprehensive Guide For Storytelling Promotion Brand Podcast Performance Tracking Dashboards Clipart PDF. It is the best one to establish the tone in your meetings. It is an excellent way to make your presentations highly effective. So, download this PPT today from Slidegeeks and see the positive impacts. Our easy to edit Comprehensive Guide For Storytelling Promotion Brand Podcast Performance Tracking Dashboards Clipart PDF can be your go to option for all upcoming conferences and meetings. So, what are you waiting for Grab this template today.

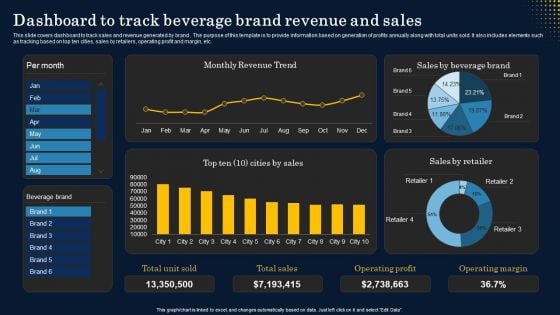
Dashboard To Track Beverage Brand Revenue And Sales Structure PDF
This slide covers dashboard to track sales and revenue generated by brand . The purpose of this template is to provide information based on generation of profits annually along with total units sold. It also includes elements such as tracking based on top ten cities, sales by retailers, operating profit and margin, etc. Are you in need of a template that can accommodate all of your creative concepts This one is crafted professionally and can be altered to fit any style. Use it with Google Slides or PowerPoint. Include striking photographs, symbols, depictions, and other visuals. Fill, move around, or remove text boxes as desired. Test out color palettes and font mixtures. Edit and save your work, or work with colleagues. Download Dashboard To Track Beverage Brand Revenue And Sales Structure PDF and observe how to make your presentation outstanding. Give an impeccable presentation to your group and make your presentation unforgettable.


 Continue with Email

 Home
Home


