Client Presentation
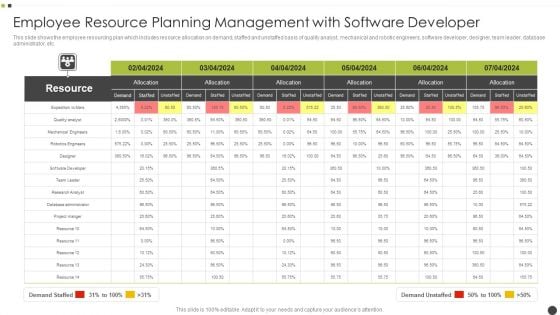
Employee Resource Planning Management With Software Developer Background PDF
This slide shows the employee resourcing plan which includes resource allocation on demand, staffed and unstaffed basis of quality analyst, mechanical and robotic engineers, software developer, designer, team leader, database administrator, etc. Pitch your topic with ease and precision using this Employee Resource Planning Management With Software Developer Background PDF. This layout presents information on Resource, Quality Analyst, Software Developer. It is also available for immediate download and adjustment. So, changes can be made in the color, design, graphics or any other component to create a unique layout.
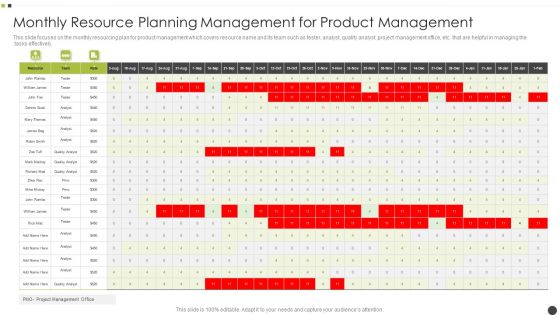
Monthly Resource Planning Management For Product Management Guidelines PDF
This slide focuses on the monthly resourcing plan for product management which covers resource name and its team such as tester, analyst, quality analyst, project management office, etc. that are helpful in managing the tasks effectively. Pitch your topic with ease and precision using this Monthly Resource Planning Management For Product Management Guidelines PDF. This layout presents information on Quality Analyst, Project Management Office. It is also available for immediate download and adjustment. So, changes can be made in the color, design, graphics or any other component to create a unique layout.

Project Management Dashboard Depicting Resource Planning Management Diagrams PDF
This slide focuses on the project management dashboard which shows resourcing plan that also includes tasks of project such as planning, analysis, recruiting, monitoring and implementing with team members with their availability and absence, etc. Pitch your topic with ease and precision using this Project Management Dashboard Depicting Resource Planning Management Diagrams PDF. This layout presents information on Project Manager, Team Manager, Implementing It is also available for immediate download and adjustment. So, changes can be made in the color, design, graphics or any other component to create a unique layout.
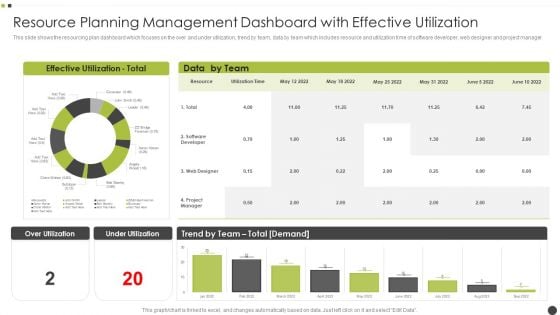
Resource Planning Management Dashboard With Effective Utilization Mockup PDF
This slide shows the resourcing plan dashboard which focuses on the over and under utilization, trend by team, data by team which includes resource and utilization time of software developer, web designer and project manager. Pitch your topic with ease and precision using this Resource Planning Management Dashboard With Effective Utilization Mockup PDF. This layout presents information on Web Designer, Software Developer, Team. It is also available for immediate download and adjustment. So, changes can be made in the color, design, graphics or any other component to create a unique layout.
Resource Planning Management Depicting Employee Skill Matrix Icons PDF
This slide focuses on the resourcing plan that depicts the employee skill matrix which shows the employees skills such as security, software development, data management, testing, governance, documentation, leadership, etc. Pitch your topic with ease and precision using this Resource Planning Management Depicting Employee Skill Matrix Icons PDF. This layout presents information on Technical Skills, Generic Skills, Project Management. It is also available for immediate download and adjustment. So, changes can be made in the color, design, graphics or any other component to create a unique layout.
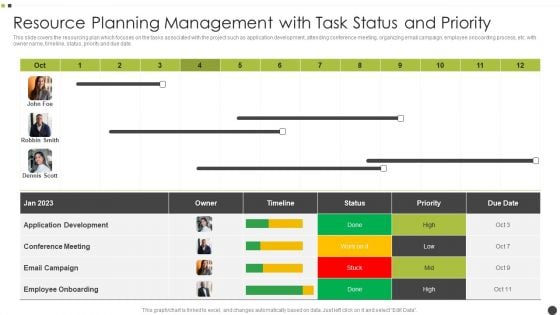
Resource Planning Management With Task Status And Priority Elements PDF
This slide covers the resourcing plan which focuses on the tasks associated with the project such as application development, attending conference meeting, organizing email campaign, employee onboarding process, etc. with owner name, timeline, status, priority and due date. Pitch your topic with ease and precision using this Resource Planning Management With Task Status And Priority Elements PDF. This layout presents information on Application Development, Email Campaign, Employee Onboarding. It is also available for immediate download and adjustment. So, changes can be made in the color, design, graphics or any other component to create a unique layout.
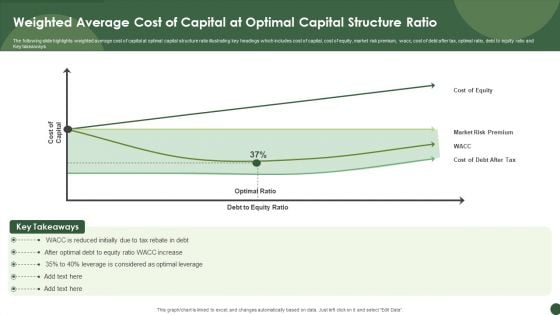
Weighted Average Cost Of Capital At Optimal Capital Structure Ratio Sample PDF
The following slide highlights weighted average cost of capital at optimal capital structure ratio illustrating key headings which includes cost of capital, cost of equity, market risk premium, wacc, cost of debt after tax, optimal ratio, debt to equity ratio and Key takeaways.Pitch your topic with ease and precision using this Weighted Average Cost Of Capital At Optimal Capital Structure Ratio Sample PDF. This layout presents information on Reduced Initially, Leverage Considered, Optimal Leverage. It is also available for immediate download and adjustment. So, changes can be made in the color, design, graphics or any other component to create a unique layout.
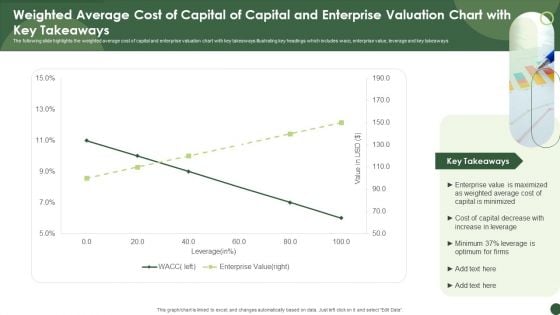
Weighted Average Cost Of Capital Of Capital And Enterprise Valuation Chart With Key Takeaways Inspiration PDF
The following slide highlights the weighted average cost of capital and enterprise valuation chart with key takeaways illustrating key headings which includes wacc, enterprise value, leverage and key takeaways. Pitch your topic with ease and precision using this Weighted Average Cost Of Capital Of Capital And Enterprise Valuation Chart With Key Takeaways Inspiration PDF. This layout presents information on Enterprise Value, Weighted Average, Capital Is Minimized. It is also available for immediate download and adjustment. So, changes can be made in the color, design, graphics or any other component to create a unique layout.
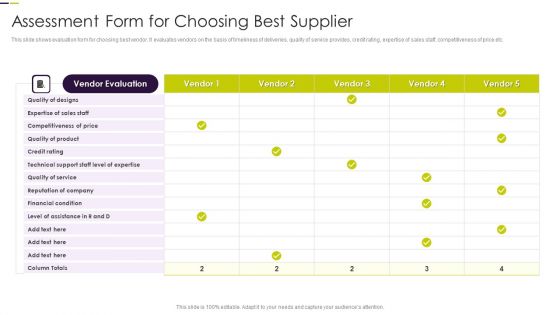
Assessment Form For Choosing Best Supplier Demonstration PDF
This slide shows evaluation form for choosing best vendor. It evaluates vendors on the basis of timeliness of deliveries, quality of service provides, credit rating, expertise of sales staff, competitiveness of price etc.Pitch your topic with ease and precision using this Assessment Form For Choosing Best Supplier Demonstration PDF. This layout presents information on Vendor Evaluation, Expertise Of Sales, Competitiveness. It is also available for immediate download and adjustment. So, changes can be made in the color, design, graphics or any other component to create a unique layout.

Section Description For Supplier Assessment Form Guidelines PDF
The slide shows section description for vendor evaluation form. It includes incoming inspection, design control, production control, inspection and testing of final products, measuring and texting equipment control etc. Pitch your topic with ease and precision using this Section Description For Supplier Assessment Form Guidelines PDF. This layout presents information on Incoming Inspection, Production Control, Production Control. It is also available for immediate download and adjustment. So, changes can be made in the color, design, graphics or any other component to create a unique layout.
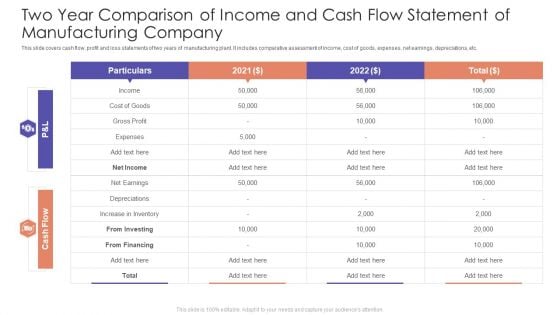
Two Year Comparison Of Income And Cash Flow Statement Of Manufacturing Company Demonstration PDF
This slide covers cash flow, profit and loss statements of two years of manufacturing plant. It includes comparative assessment of income, cost of goods, expenses, net earnings, depreciations, etc. Pitch your topic with ease and precision using this Two Year Comparison Of Income And Cash Flow Statement Of Manufacturing Company Demonstration PDF. This layout presents information on Cost Goods, Income, Cash Flow, Net Income. It is also available for immediate download and adjustment. So, changes can be made in the color, design, graphics or any other component to create a unique layout.
Impact Of Various Bankruptcy Ratios On A Firm Icons PDF
The following slide showcases companys insolvency ratios and whether it can cover its long term debt. Key ratios covered are debt to equity, debt to asset and equity ratio. Pitch your topic with ease and precision using this Impact Of Various Bankruptcy Ratios On A Firm Icons PDF. This layout presents information on Equity Ratio, Financial. It is also available for immediate download and adjustment. So, changes can be made in the color, design, graphics or any other component to create a unique layout.
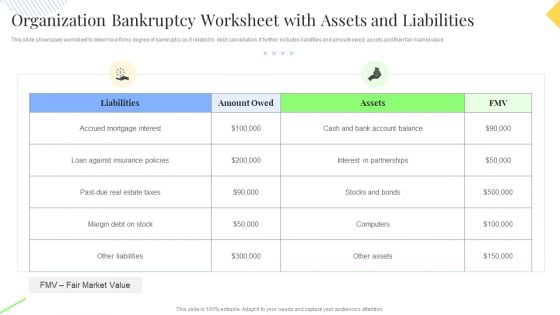
Organization Bankruptcy Worksheet With Assets And Liabilities Demonstration PDF
This slide showcases worksheet to determine firms degree of bankruptcy as it related to debt cancellation. It further includes liabilities and amount owed, assets and their fair market value. Pitch your topic with ease and precision using this Organization Bankruptcy Worksheet With Assets And Liabilities Demonstration PDF. This layout presents information on Accrued Mortgage Interest, Stocks And Bonds, Market Value. It is also available for immediate download and adjustment. So, changes can be made in the color, design, graphics or any other component to create a unique layout.
Gross Profit Margin Dashboard With Revenue Vs Expenses Icons PDF
This slide showcases dashboard that can help organization to evaluate the revenue generated and expenses incurred in conducting operations. It also showcases gross profit and margin of last financial year. Pitch your topic with ease and precision using this Gross Profit Margin Dashboard With Revenue Vs Expenses Icons PDF. This layout presents information on Gross Profit Margin, EBITDA Margin, Net Profit Margin. It is also available for immediate download and adjustment. So, changes can be made in the color, design, graphics or any other component to create a unique layout.
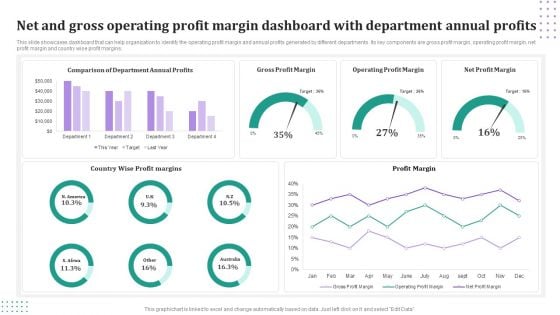
Net And Gross Operating Profit Margin Dashboard With Department Annual Profits Mockup PDF
This slide showcases dashboard that can help organization to identify the operating profit margin and annual profits generated by different departments. Its key components are gross profit margin, operating profit margin, net profit margin and country wise profit margins. Pitch your topic with ease and precision using this Net And Gross Operating Profit Margin Dashboard With Department Annual Profits Mockup PDF. This layout presents information on Gross Profit Margin, Operating Profit Margin, Net Profit Margin. It is also available for immediate download and adjustment. So, changes can be made in the color, design, graphics or any other component to create a unique layout.
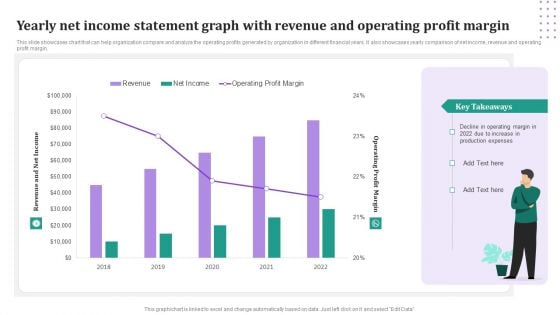
Yearly Net Income Statement Graph With Revenue And Operating Profit Margin Download PDF
This slide showcases chart that can help organization compare and analyze the operating profits generated by organization in different financial years. It also showcases yearly comparison of net income, revenue and operating profit margin. Pitch your topic with ease and precision using this Yearly Net Income Statement Graph With Revenue And Operating Profit Margin Download PDF. This layout presents information on Revenue, Net Income, Operating Profit Margin. It is also available for immediate download and adjustment. So, changes can be made in the color, design, graphics or any other component to create a unique layout.
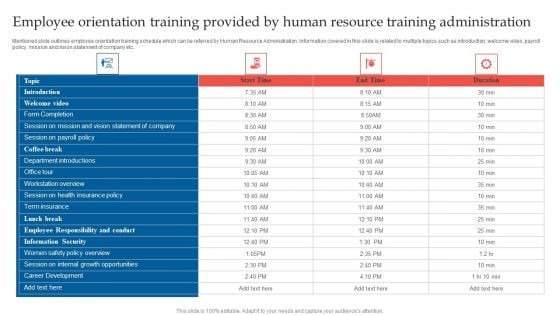
Employee Orientation Training Provided By Human Resource Training Administration Structure PDF
Mentioned slide outlines employee orientation training schedule which can be referred by Human Resource Administration. Information covered in this slide is related to multiple topics such as introduction, welcome video, payroll policy, mission and vision statement of company etc. Pitch your topic with ease and precision using this Employee Orientation Training Provided By Human Resource Training Administration Structure PDF. This layout presents information on Introduction, Department Introductions, Term Insurance. It is also available for immediate download and adjustment. So, changes can be made in the color, design, graphics or any other component to create a unique layout.
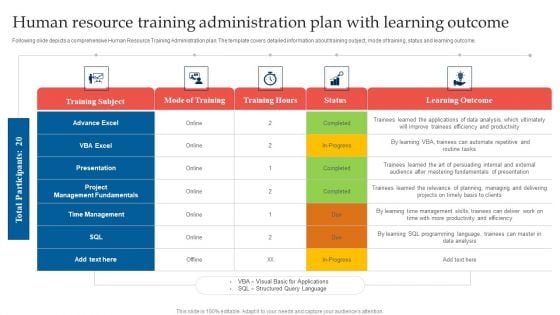
Human Resource Training Administration Plan With Learning Outcome Brochure PDF
Following slide depicts a comprehensive Human Resource Training Administration plan. The template covers detailed information about training subject, mode of training, status and learning outcome. Pitch your topic with ease and precision using this Human Resource Training Administration Plan With Learning Outcome Brochure PDF. This layout presents information on Learning Outcome, Project Management Fundamentals, Time Management. It is also available for immediate download and adjustment. So, changes can be made in the color, design, graphics or any other component to create a unique layout.
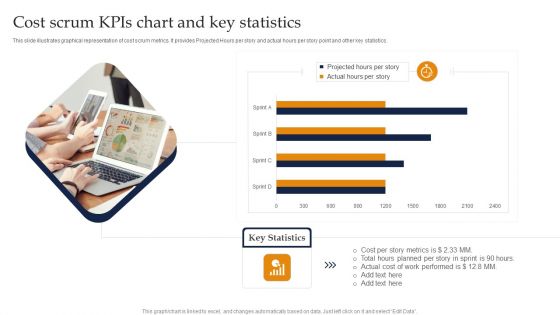
Cost Scrum Kpis Chart And Key Statistics Ppt Layouts Example Introduction PDF
This slide illustrates graphical representation of cost scrum metrics. It provides Projected Hours per story and actual hours per story point and other key statistics. Pitch your topic with ease and precision using this Cost Scrum Kpis Chart And Key Statistics Ppt Layouts Example Introduction PDF. This layout presents information on Projected Hours, Cost Per Story, Metrics, Actual Cost. It is also available for immediate download and adjustment. So, changes can be made in the color, design, graphics or any other component to create a unique layout.
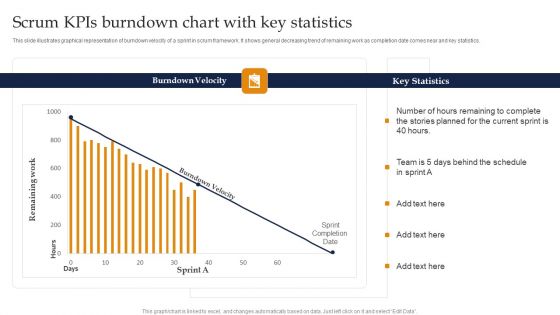
Scrum Kpis Burndown Chart With Key Statistics Ppt Pictures Visual Aids PDF
This slide illustrates graphical representation of burndown velocity of a sprint in scrum framework. It shows general decreasing trend of remaining work as completion date comes near and key statistics. Pitch your topic with ease and precision using this Scrum Kpis Burndown Chart With Key Statistics Ppt Pictures Visual Aids PDF. This layout presents information on Burndown Velocity, Key Statistics, Current Sprint. It is also available for immediate download and adjustment. So, changes can be made in the color, design, graphics or any other component to create a unique layout.
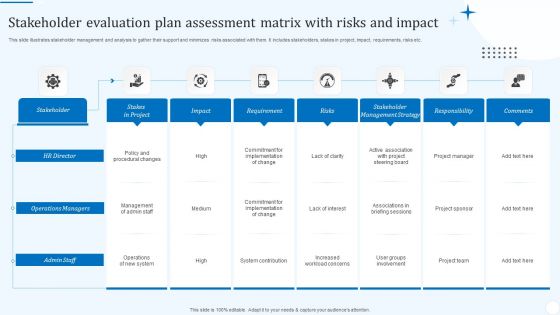
Stakeholder Evaluation Plan Assessment Matrix With Risks And Impact Structure PDF
This slide illustrates stakeholder management and analysis to gather their support and minimizes risks associated with them. It includes stakeholders, stakes in project, impact, requirements, risks etc. Pitch your topic with ease and precision using this Stakeholder Evaluation Plan Assessment Matrix With Risks And Impact Structure PDF. This layout presents information on Requirement, Risks, HR Director. It is also available for immediate download and adjustment. So, changes can be made in the color, design, graphics or any other component to create a unique layout.
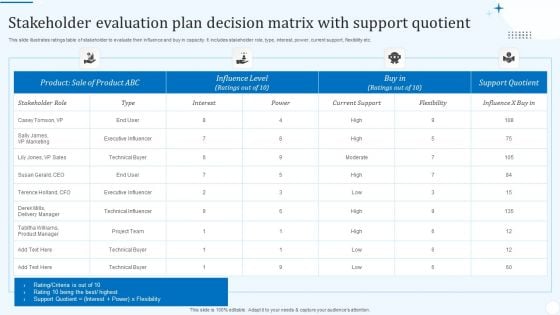
Stakeholder Evaluation Plan Decision Matrix With Support Quotient Mockup PDF
This slide illustrates ratings table of stakeholder to evaluate their influence and buy in capacity. It includes stakeholder role, type, interest, power, current support, flexibility etc. Pitch your topic with ease and precision using this Stakeholder Evaluation Plan Decision Matrix With Support Quotient Mockup PDF. This layout presents information on Stakeholder Role, Executive Influencer, Technical Influencer. It is also available for immediate download and adjustment. So, changes can be made in the color, design, graphics or any other component to create a unique layout.
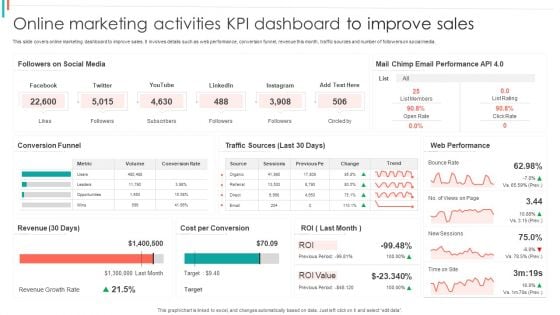
Online Marketing Activities KPI Dashboard To Improve Sales Ideas PDF
This slide covers online marketing dashboard to improve sales. It involves details such as web performance, conversion funnel, revenue this month, traffic sources and number of followers on social media.Pitch your topic with ease and precision using this Online Marketing Activities KPI Dashboard To Improve Sales Ideas PDF. This layout presents information on Email Performance, Web Performance, Cost Conversion. It is also available for immediate download and adjustment. So, changes can be made in the color, design, graphics or any other component to create a unique layout.
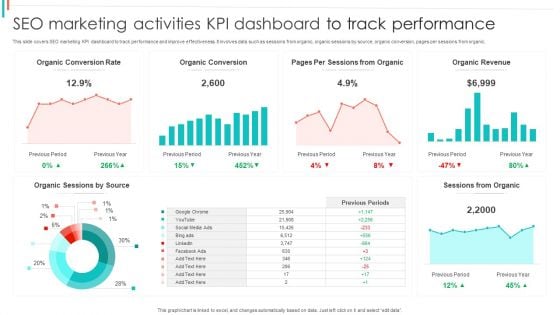
SEO Marketing Activities KPI Dashboard To Track Performance Brochure PDF
This slide covers SEO marketing KPI dashboard to track performance and improve effectiveness. It involves data such as sessions from organic, organic sessions by source, organic conversion, pages per sessions from organic.Pitch your topic with ease and precision using this SEO Marketing Activities KPI Dashboard To Track Performance Brochure PDF. This layout presents information on Organic Conversion, Sessions Organic, Organic Revenue. It is also available for immediate download and adjustment. So, changes can be made in the color, design, graphics or any other component to create a unique layout.
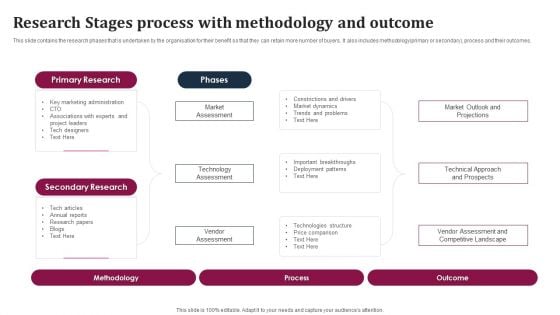
Research Stages Process With Methodology And Outcome Ideas PDF
This slide contains the research phases that is undertaken by the organisation for their benefit so that they can retain more number of buyers. It also includes methodology primary or secondary, process and their outcomes. Pitch your topic with ease and precision using this Research Stages Process With Methodology And Outcome Ideas PDF. This layout presents information on Primary Research, Secondary Research, Marketing Administration. It is also available for immediate download and adjustment. So, changes can be made in the color, design, graphics or any other component to create a unique layout.
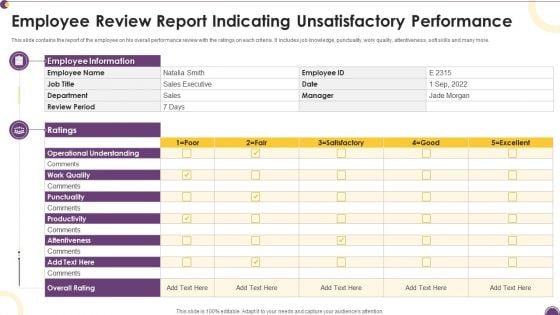
Employee Review Report Indicating Unsatisfactory Performance Themes PDF
This slide contains the report of the employee on his overall performance review with the ratings on each criteria. It includes job knowledge, punctuality, work quality, attentiveness, soft skills and many more.Pitch your topic with ease and precision using this Employee Review Report Indicating Unsatisfactory Performance Themes PDF. This layout presents information on Operational Understanding, Employee Information, Punctuality. It is also available for immediate download and adjustment. So, changes can be made in the color, design, graphics or any other component to create a unique layout.
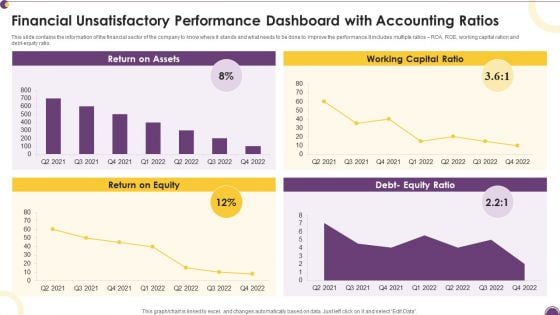
Financial Unsatisfactory Performance Dashboard With Accounting Ratios Diagrams PDF
This slide contains the information of the financial sector of the company to know where it stands and what needs to be done to improve the performance.It includes multiple ratios ROA, ROE, working capital ration and debt-equity ratio. Pitch your topic with ease and precision using this Financial Unsatisfactory Performance Dashboard With Accounting Ratios Diagrams PDF. This layout presents information on Return Assets, Working Capital, Return Equity. It is also available for immediate download and adjustment. So, changes can be made in the color, design, graphics or any other component to create a unique layout.
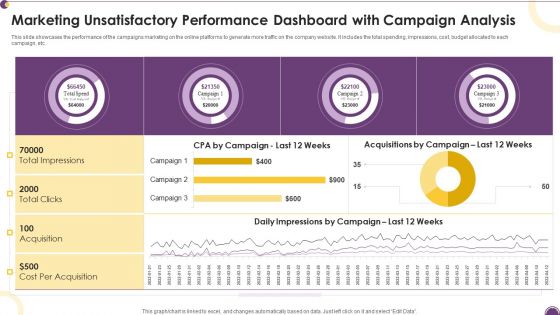
Marketing Unsatisfactory Performance Dashboard With Campaign Analysis Information PDF
This slide showcases the performance of the campaigns marketing on the online platforms to generate more traffic on the company website. It includes the total spending, impressions, cost, budget allocated to each campaign, etc.Pitch your topic with ease and precision using this Marketing Unsatisfactory Performance Dashboard With Campaign Analysis Information PDF. This layout presents information on Cost Acquisition, Total Clicks, Total Impressions. It is also available for immediate download and adjustment. So, changes can be made in the color, design, graphics or any other component to create a unique layout.
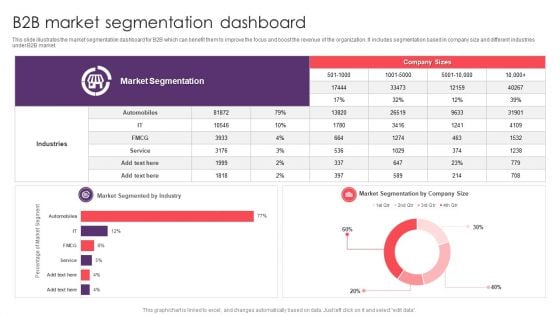
B2B Market Segmentation Dashboard Microsoft PDF
This slide illustrates the market segmentation dashboard for B2B which can benefit them to improve the focus and boost the revenue of the organization. It includes segmentation based in company size and different industries under B2B market. Pitch your topic with ease and precision using this B2B Market Segmentation Dashboard Microsoft PDF. This layout presents information on Industries, Market Segmentation, Service. It is also available for immediate download and adjustment. So, changes can be made in the color, design, graphics or any other component to create a unique layout.
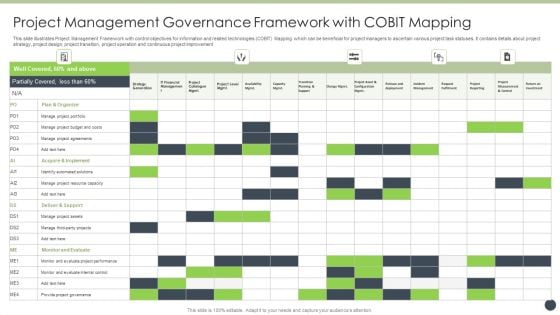
Project Management Governance Framework With Cobit Mapping Inspiration PDF
This slide illustrates Project Management Framework with control objectives for information and related technologies COBIT Mapping which can be beneficial for project managers to ascertain various project task statuses. It contains details about project strategy, project design, project transition, project operation and continuous project improvement Pitch your topic with ease and precision using this Project Management Governance Framework With Cobit Mapping Inspiration PDF. This layout presents information on Implement, Acquire, Project Resource Capacity. It is also available for immediate download and adjustment. So, changes can be made in the color, design, graphics or any other component to create a unique layout.
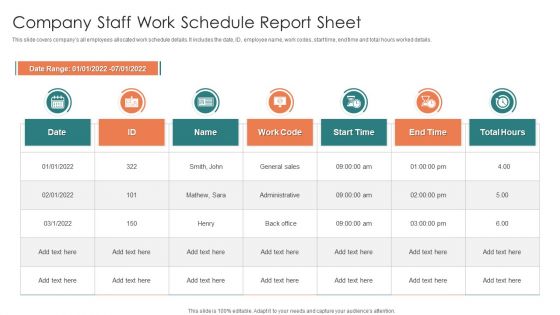
Company Staff Work Schedule Report Sheet Elements PDF
This slide covers companys all employees allocated work schedule details. It includes the date, ID, employee name, work codes, start time, end time and total hours worked details. Pitch your topic with ease and precision using this Company Staff Work Schedule Report Sheet Elements PDF. This layout presents information on Company Staff Work, Schedule Report Sheet. It is also available for immediate download and adjustment. So, changes can be made in the color, design, graphics or any other component to create a unique layout.

Comparative Assessment Of Waterfall Project Management Tools Structure PDF
This slide shows the comparative assessment of waterfall project management tools on the basis of features such as complete designing, real time tracking, measurable progress, flexibility and adaptability. Pitch your topic with ease and precision using this Comparative Assessment Of Waterfall Project Management Tools Structure PDF. This layout presents information on Complete Designing, Flexibility And Adaptability, Measurable Progress. It is also available for immediate download and adjustment. So, changes can be made in the color, design, graphics or any other component to create a unique layout.
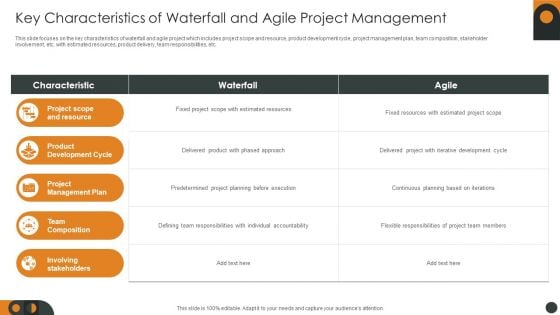
Key Characteristics Of Waterfall And Agile Project Management Themes PDF
This slide focuses on the key characteristics of waterfall and agile project which includes project scope and resource, product development cycle, project management plan, team composition, stakeholder involvement, etc. with estimated resources, product delivery, team responsibilities, etc. Pitch your topic with ease and precision using this Key Characteristics Of Waterfall And Agile Project Management Themes PDF. This layout presents information on Project Management Plan, Team Composition, Product Development Cycle. It is also available for immediate download and adjustment. So, changes can be made in the color, design, graphics or any other component to create a unique layout.
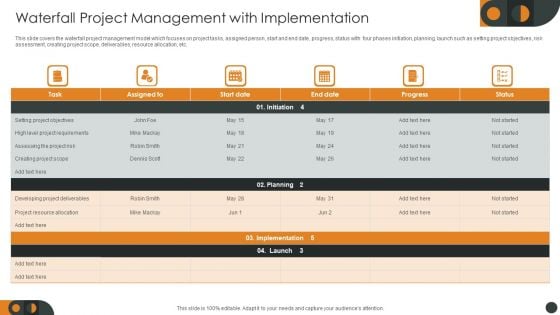
Waterfall Project Management With Implementation Graphics PDF
This slide covers the waterfall project management model which focuses on project tasks, assigned person, start and end date, progress, status with four phases initiation, planning, launch such as setting project objectives, risk assessment, creating project scope, deliverables, resource allocation, etc. Pitch your topic with ease and precision using this Waterfall Project Management With Implementation Graphics PDF. This layout presents information on Project Requirements, Project Resource Allocation, Developing Project Deliverables. It is also available for immediate download and adjustment. So, changes can be made in the color, design, graphics or any other component to create a unique layout.
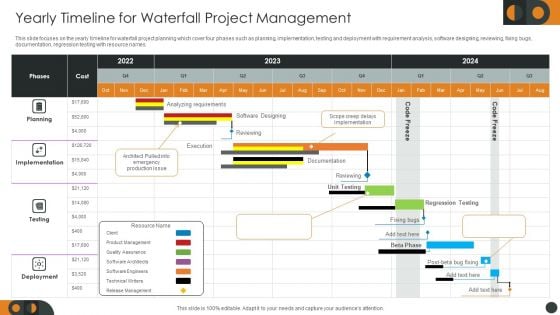
Yearly Timeline For Waterfall Project Management Clipart PDF
This slide focuses on the yearly timeline for waterfall project planning which cover four phases such as planning, implementation, testing and deployment with requirement analysis, software designing, reviewing, fixing bugs, documentation, regression testing with resource names. Pitch your topic with ease and precision using this Yearly Timeline For Waterfall Project Management Clipart PDF. This layout presents information on Planning, Implementation, Deployment. It is also available for immediate download and adjustment. So, changes can be made in the color, design, graphics or any other component to create a unique layout.
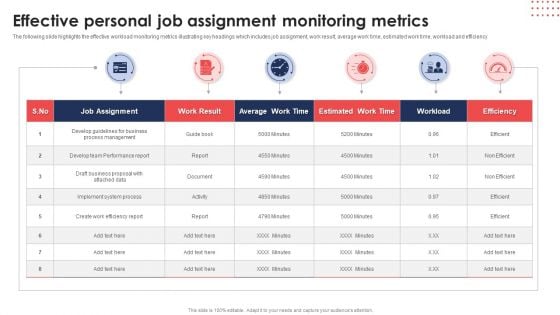
Effective Personal Job Assignment Monitoring Metrics Ppt Portfolio Samples PDF
The following slide highlights the effective workload monitoring metrics illustrating key headings which includes job assignment, work result, average work time, estimated work time, workload and efficiency. Pitch your topic with ease and precision using this Effective Personal Job Assignment Monitoring Metrics Ppt Portfolio Samples PDF. This layout presents information on Job Assignment, Work Result, Average Work Time. It is also available for immediate download and adjustment. So, changes can be made in the color, design, graphics or any other component to create a unique layout.
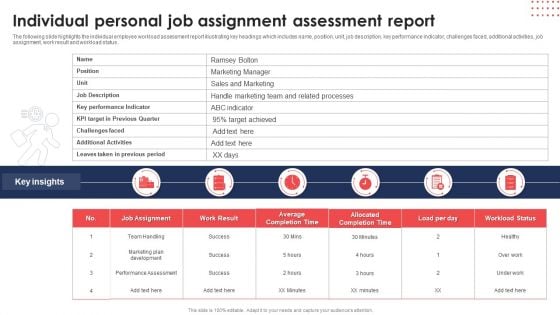
Individual Personal Job Assignment Assessment Report Ppt Model Brochure PDF
The following slide highlights the individual employee workload assessment report illustrating key headings which includes name, position, unit, job description, key performance indicator, challenges faced, additional activities, job assignment, work result and workload status. Pitch your topic with ease and precision using this Individual Personal Job Assignment Assessment Report Ppt Model Brochure PDF. This layout presents information on Job Assignment, Average Completion Time, Load Per Day. It is also available for immediate download and adjustment. So, changes can be made in the color, design, graphics or any other component to create a unique layout.
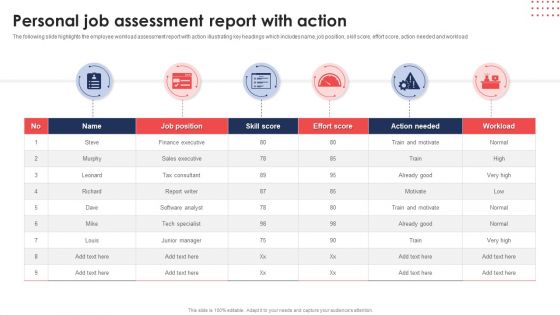
Personal Job Assessment Report With Action Ppt Professional Gallery PDF
The following slide highlights the employee workload assessment report with action illustrating key headings which includes name, job position, skill score, effort score, action needed and workload. Pitch your topic with ease and precision using this Personal Job Assessment Report With Action Ppt Professional Gallery PDF. This layout presents information on Skill Score, Effort Score, Action Needed. It is also available for immediate download and adjustment. So, changes can be made in the color, design, graphics or any other component to create a unique layout.
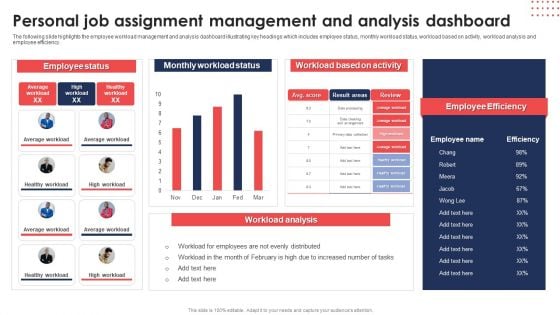
Personal Job Assignment Management And Analysis Dashboard Diagrams PDF
The following slide highlights the employee workload management and analysis dashboard illustrating key headings which includes employee status, monthly workload status, workload based on activity, workload analysis and employee efficiency. Pitch your topic with ease and precision using thisPersonal Job Assignment Management And Analysis Dashboard Diagrams PDF. This layout presents information on Employee Status, Monthly Workload Status, Workload Based Activity. It is also available for immediate download and adjustment. So, changes can be made in the color, design, graphics or any other component to create a unique layout.

Conference Plan For Project Management Event Background PDF
This slide showcases project management conference plan that can help to ensure smooth functioning of event and define clear set of objectives for each participant. It also outlines time duration to keep track of each activity. Pitch your topic with ease and precision using this Conference Plan For Project Management Event Background PDF. This layout presents information on Networking, Project Management, Technology. It is also available for immediate download and adjustment. So, changes can be made in the color, design, graphics or any other component to create a unique layout.
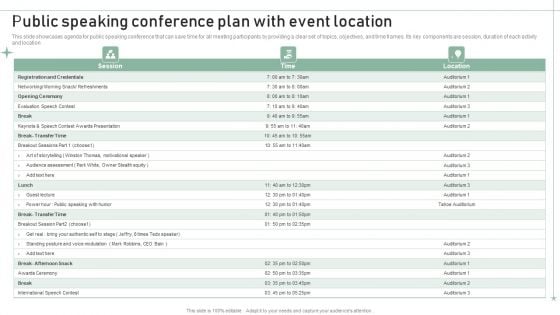
Public Speaking Conference Plan With Event Location Structure PDF
This slide showcases agenda for public speaking conference that can save time for all meeting participants by providing a clear set of topics, objectives, and time frames. Its key components are session, duration of each activity and location. Pitch your topic with ease and precision using this Public Speaking Conference Plan With Event Location Structure PDF. This layout presents information on Networking, Equity, Evaluation. It is also available for immediate download and adjustment. So, changes can be made in the color, design, graphics or any other component to create a unique layout.
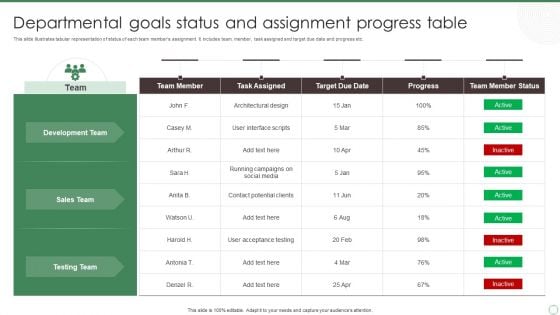
Departmental Goals Status And Assignment Progress Table Ppt File Example PDF
This slide illustrates tabular representation of status of each team members assignment. It includes team, member, task assigned and target due date and progress etc. Pitch your topic with ease and precision using this Departmental Goals Status And Assignment Progress Table Ppt File Example PDF. This layout presents information on Development Team, Sales Team, Testing Team. It is also available for immediate download and adjustment. So, changes can be made in the color, design, graphics or any other component to create a unique layout.
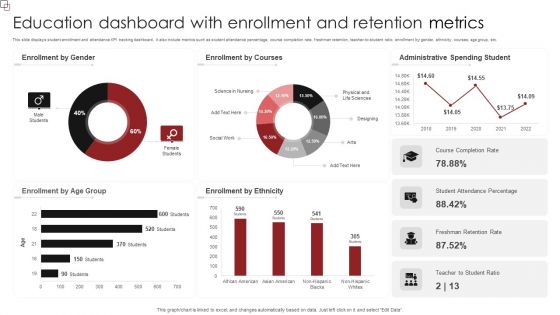
Education Dashboard With Enrollment And Retention Metrics Sample PDF
This slide displays student enrollment and attendance KPI tracking dashboard. It also include metrics such as student attendance percentage, course completion rate, freshman retention, teacher-to-student ratio, enrollment by gender, ethnicity, courses, age group, etc. Pitch your topic with ease and precision using this Education Dashboard With Enrollment And Retention Metrics Sample PDF. This layout presents information on Enrollment Gender, Enrollment Courses, Administrative Spending Student. It is also available for immediate download and adjustment. So, changes can be made in the color, design, graphics or any other component to create a unique layout.
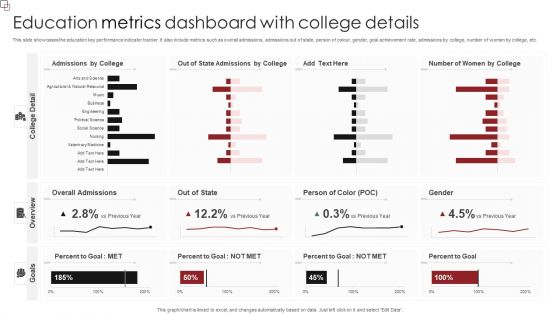
Education Metrics Dashboard With College Details Formats PDF
This slide showcases the education key performance indicator tracker. It also include metrics such as overall admissions, admissions out of state, person of colour, gender, goal achievement rate, admissions by college, number of women by college, etc. Pitch your topic with ease and precision using this Education Metrics Dashboard With College Details Formats PDF. This layout presents information on Overall Admissions, Person Of Color, Percent To Goal. It is also available for immediate download and adjustment. So, changes can be made in the color, design, graphics or any other component to create a unique layout.
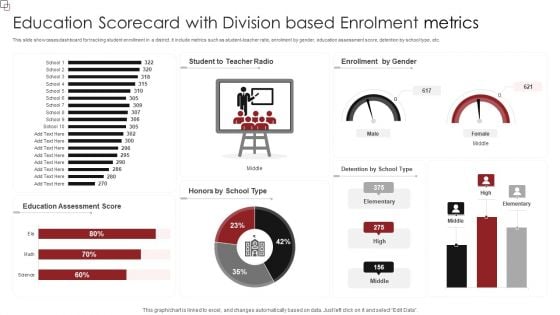
Education Scorecard With Division Based Enrolment Metrics Professional PDF
This slide showcases dashboard for tracking student enrollment in a district. It include metrics such as student-teacher ratio, enrolment by gender, education assessment score, detention by school type, etc. Pitch your topic with ease and precision using this Education Scorecard With Division Based Enrolment Metrics Professional PDF. This layout presents information on Education Assessment Score, Enrollment Gender. It is also available for immediate download and adjustment. So, changes can be made in the color, design, graphics or any other component to create a unique layout.
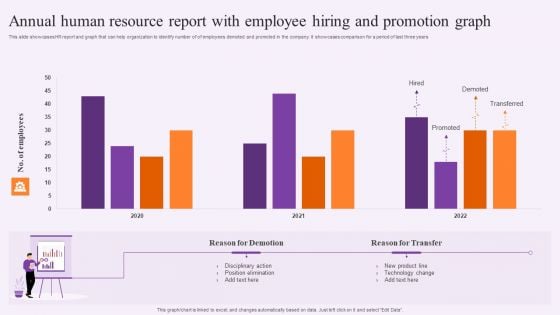
Annual Human Resource Report With Employee Hiring And Promotion Graph Mockup PDF
This slide showcases HR report and graph that can help organization to identify number of of employees demoted and promoted in the company. It showcases comparison for a period of last three years. Pitch your topic with ease and precision using this Annual Human Resource Report With Employee Hiring And Promotion Graph Mockup PDF. This layout presents information on Technology, Product, Employees. It is also available for immediate download and adjustment. So, changes can be made in the color, design, graphics or any other component to create a unique layout.
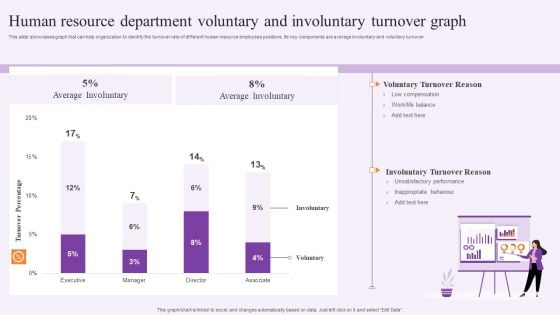
Human Resource Department Voluntary And Involuntary Turnover Graph Summary PDF
This slide showcases graph that can help organization to identify the turnover rate of different human resource employees positions. Its key components are average involuntary and voluntary turnover. Pitch your topic with ease and precision using this Human Resource Department Voluntary And Involuntary Turnover Graph Summary PDF. This layout presents information on Executive, Voluntary Turnover Reason, Average Involuntary. It is also available for immediate download and adjustment. So, changes can be made in the color, design, graphics or any other component to create a unique layout.
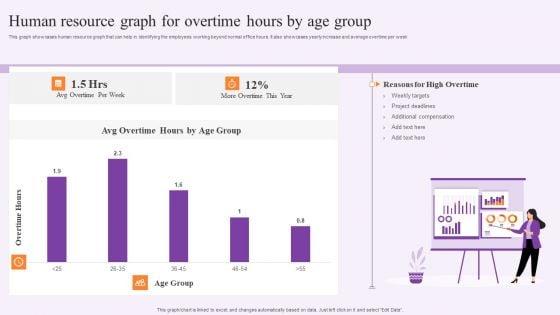
Human Resource Graph For Overtime Hours By Age Group Rules PDF
This graph showcases human resource graph that can help in identifying the employees working beyond normal office hours. It also showcases yearly increase and average overtime per week. Pitch your topic with ease and precision using this Human Resource Graph For Overtime Hours By Age Group Rules PDF. This layout presents information on Weekly Targets, Project Deadlines. It is also available for immediate download and adjustment. So, changes can be made in the color, design, graphics or any other component to create a unique layout.
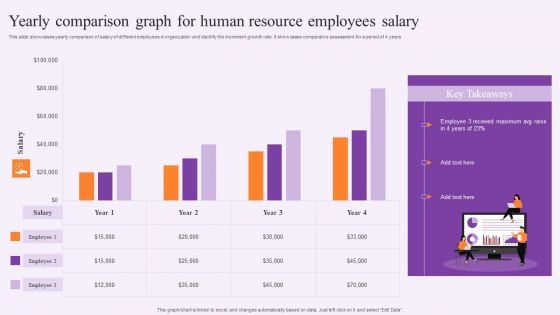
Yearly Comparison Graph For Human Resource Employees Salary Template PDF
This slide showcases yearly comparison of salary of different employees in organization and identify the increment growth rate. It showcases comparative assessment for a period of 4 years. Pitch your topic with ease and precision using this Yearly Comparison Graph For Human Resource Employees Salary Template PDF. This layout presents information on Human Resource, Employees Salary. It is also available for immediate download and adjustment. So, changes can be made in the color, design, graphics or any other component to create a unique layout.
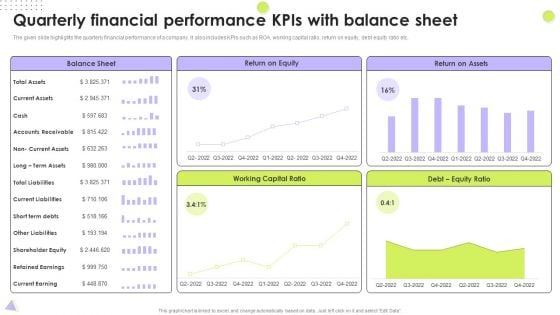
Quarterly Financial Performance Kpis With Balance Sheet Designs PDF
The given slide highlights the quarterly financial performance of a company. It also includes KPIs such as ROA, working capital ratio, return on equity, debt equity ratio etc. Pitch your topic with ease and precision using this Quarterly Financial Performance Kpis With Balance Sheet Designs PDF. This layout presents information on Total Liabilities, Return On Equity, Working Capital Ratio. It is also available for immediate download and adjustment. So, changes can be made in the color, design, graphics or any other component to create a unique layout.
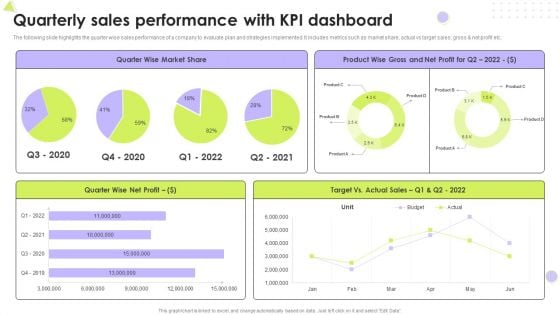
Quarterly Sales Performance With Kpi Dashboard Introduction PDF
The following slide highlights the quarter wise sales performance of a company to evaluate plan and strategies implemented. It includes metrics such as market share, actual vs target sales, gross and net profit etc. Pitch your topic with ease and precision using this Quarterly Sales Performance With Kpi Dashboard Introduction PDF. This layout presents information on Market Share, Net Profit, Target. It is also available for immediate download and adjustment. So, changes can be made in the color, design, graphics or any other component to create a unique layout.
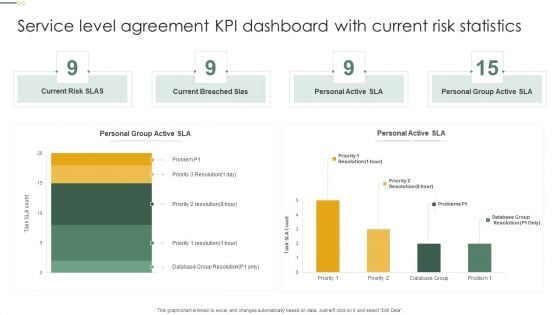
Service Level Agreement KPI Dashboard With Current Risk Statistics Topics PDF
This graph or chart is linked to excel, and changes automatically based on data. Just left click on it and select Edit Data. Pitch your topic with ease and precision using this Service Level Agreement KPI Dashboard With Current Risk Statistics Topics PDF. This layout presents information on Current Risk SLAS, Current Breached Slas, Personal Active SLA It is also available for immediate download and adjustment. So, changes can be made in the color, design, graphics or any other component to create a unique layout.
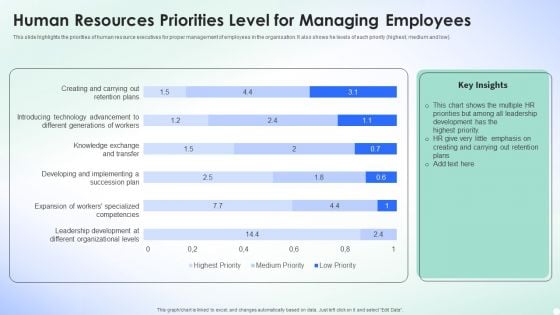
Human Resources Priorities Level For Managing Employees Template PDF
This slide highlights the priorities of human resource executives for proper management of employees in the organisation. It also shows he levels of each priority highest, medium and low. Pitch your topic with ease and precision using this Human Resources Priorities Level For Managing Employees Template PDF. This layout presents information on Leadership Development, Organizational Levels, Implementing. It is also available for immediate download and adjustment. So, changes can be made in the color, design, graphics or any other component to create a unique layout.
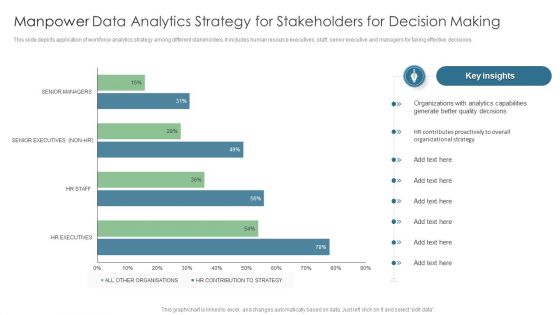
Manpower Data Analytics Strategy For Stakeholders For Decision Making Summary PDF
This slide depicts application of workforce analytics strategy among different stakeholders. It includes human resource executives, staff, senior executive and managers for taking effective decisions. Pitch your topic with ease and precision using this Manpower Data Analytics Strategy For Stakeholders For Decision Making Summary PDF. This layout presents information on Organizations, Analytics Capabilities, Generate Better Quality. It is also available for immediate download and adjustment. So, changes can be made in the color, design, graphics or any other component to create a unique layout.
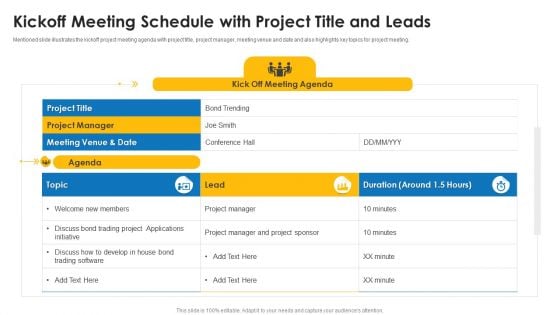
Kickoff Meeting Schedule With Project Title And Leads Ppt Outline Layouts PDF
Mentioned slide illustrates the kickoff project meeting agenda with project title, project manager, meeting venue and date and also highlights key topics for project meeting. Pitch your topic with ease and precision using this Kickoff Meeting Schedule With Project Title And Leads Ppt Outline Layouts PDF. This layout presents information on Project Title, Project Manager, Agenda. It is also available for immediate download and adjustment. So, changes can be made in the color, design, graphics or any other component to create a unique layout.
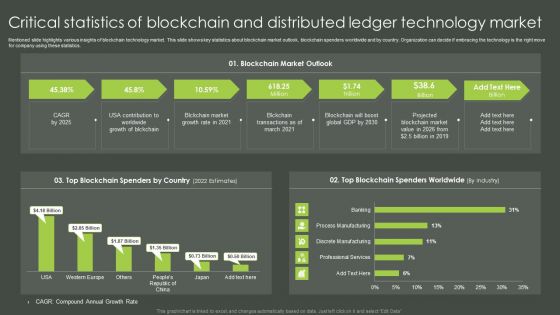
Critical Statistics Of Blockchain And Distributed Ledger Technology Market Structure PDF
Mentioned slide highlights various insights of blockchain technology market. This slide shows key statistics about blockchain market outlook, blockchain spenders worldwide and by country. Organization can decide if embracing the technology is the right move for company using these statistics. Pitch your topic with ease and precision using this Critical Statistics Of Blockchain And Distributed Ledger Technology Market Structure PDF. This layout presents information on USA Contribution, Projected Blockchain, Market Value. It is also available for immediate download and adjustment. So, changes can be made in the color, design, graphics or any other component to create a unique layout.
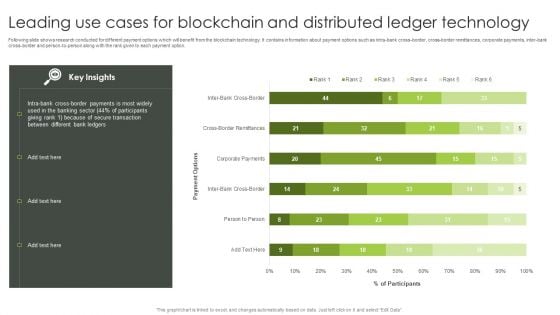
Leading Use Cases For Blockchain And Distributed Ledger Technology Slides PDF
Following slide shows research conducted for different payment options which will benefit from the blockchain technology. It contains information about payment options such as intra-bank cross-border, cross-border remittances, corporate payments, inter-bank cross-border and person-to-person along with the rank given to each payment option. Pitch your topic with ease and precision using this Leading Use Cases For Blockchain And Distributed Ledger Technology Slides PDF. This layout presents information on Person To Person, Corporate Payments, Cross Border Remittances. It is also available for immediate download and adjustment. So, changes can be made in the color, design, graphics or any other component to create a unique layout.
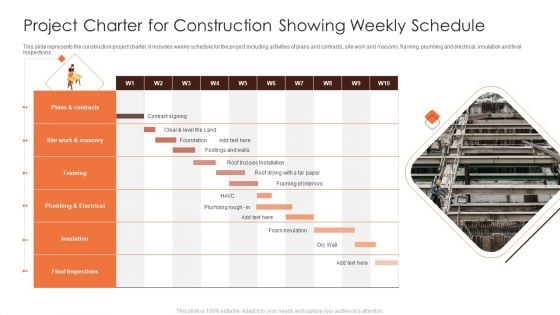
Project Charter For Construction Showing Weekly Schedule Diagrams PDF
This slide represents the construction project charter. It includes weekly schedule for the project including activities of plans and contracts, site work and masonry, framing, plumbing and electrical, insulation and final inspections. Pitch your topic with ease and precision using this Project Charter For Construction Showing Weekly Schedule Diagrams PDF. This layout presents information on Plans, Project Charter. It is also available for immediate download and adjustment. So, changes can be made in the color, design, graphics or any other component to create a unique layout.
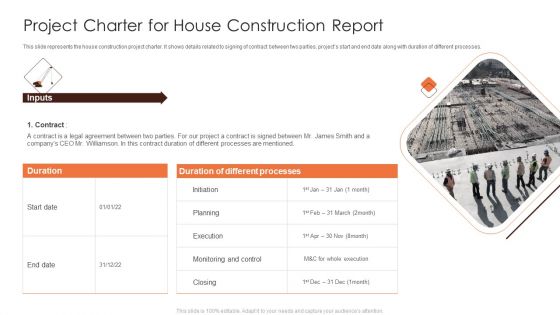
Project Charter For House Construction Report Graphics PDF
This slide represents the house construction project charter. It shows details related to signing of contract between two parties, projects start and end date along with duration of different processes. Pitch your topic with ease and precision using this Project Charter For House Construction Report Graphics PDF. This layout presents information on Planning, Execution, Project Charter. It is also available for immediate download and adjustment. So, changes can be made in the color, design, graphics or any other component to create a unique layout.
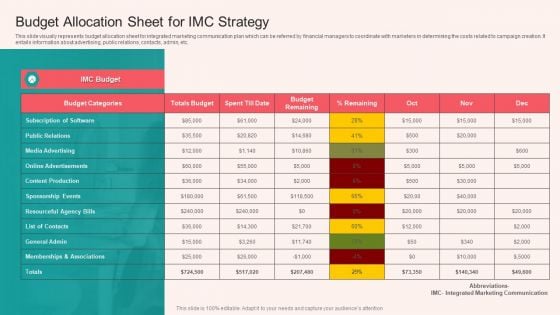
Budget Allocation Sheet For IMC Strategy Designs PDF
This slide visually represents budget allocation sheet for integrated marketing communication plan which can be referred by financial managers to coordinate with marketers in determining the costs related to campaign creation. It entails information about advertising, public relations, contacts, admin, etc. Pitch your topic with ease and precision using this Budget Allocation Sheet For IMC Strategy Designs PDF. This layout presents information on Media Advertising, Budget Categories, Content Production. It is also available for immediate download and adjustment. So, changes can be made in the color, design, graphics or any other component to create a unique layout.


 Continue with Email

 Home
Home


